Article

A Comparison of the Microbial Populations in a Culture-Dependent and a Culture-Independent Analysis of Industrial Water Samples

by
Douglas B. McIlwaine
1,*,
Mackenzie Moore
1,
Alexsandra Corrigan
1,
Benjamin Niemaseck
1 and
Danika Nicoletti
2
1
R&D Department, ChemTreat Incorporated, Ashland, VA 23005, USA
2
LuminUltra Technologies Ltd., Fredericton, NB E3B 6G3, Canada
*
Author to whom correspondence should be addressed.
Appl. Microbiol. 2024, 4(3), 1079-1090; https://doi.org/10.3390/applmicrobiol4030073
Submission received: 30 May 2024 / Revised: 2 July 2024 / Accepted: 4 July 2024 / Published: 15 July 2024

Abstract

:
Culture-dependent and culture-independent microbiological methods are two approaches used to study microbial community composition. Culture-dependent methods have been the standard method used for many years but have limited utility with unculturable microorganisms. Culture-independent methods, including molecular techniques, enable direct analysis of microbial DNA without requiring cultivation. Both culture-dependent and -independent methods have roles in advancing our understanding of microbiology, and a combination of these approaches often yields a comprehensive depiction of the microbial diversity within a dynamic system. Bacterial activity reaction tests (BARTs) are a common culture-dependent test used to identify bacteria growing in industrial water samples. In this study, next-generation sequencing (NGS) was used to identify the taxa growing in BARTs and compared with the BART reaction patterns. Additionally, several water samples were analyzed by both BART and NGS analysis to determine whether the bacteria found in the water were also present in the BARTs. The results showed overall agreement between NGS and BARTs, though, in some cases, the most abundant taxa found in the water samples differed from those in the BARTs. This highlights the need for further study into the microbial community dynamics of culture-dependent tests to determine whether they are representative of the original sample.

1. Introduction

The culture-dependent methods used to enumerate microbiological populations typically use various types of nutrient agar to either stimulate the growth of the population as a whole or select for particular types of microorganisms [1]. Popular nutrient-media-based tools to quantify microbial populations in water samples may use a nonselective nutrient media to stimulate the growth of microorganisms in the sample so that they can be quantified by various methods. Examples of nonselective growth media for aerobic microbes include R2A media [2], tryptic soy broth [3], and plate count agar [4]. Selective media can include cetrimide for Pseudomonas species [5], MacConkey agar for Gram-negative microbes [6], and even BYCE agar for the isolation and quantification of Legionella species [7]. The use of these types of nutrient media helps determine the types and populations of microbes present in industrial water systems.
The ability to quantify and characterize microorganisms in industrial water samples is a critically important part of an industrial water treatment program. While microbial populations are typically determined by traditional culture-based methods, selective media tests can be used to ascertain the types of industrially relevant microorganisms that are present in the water. The microorganisms of particular interest in most industrial water applications are those that form biofilms, those capable of participating in microbiologically influenced corrosion (MIC), and the potentially pathogenic bacteria such as Legionella. Monitoring for the presence of these various types of microorganisms requires different tools and is a critically important part of a water treatment program.
While selective media stimulate the growth of certain microorganisms, it is well known that most microorganisms in a sample cannot be cultured [8]. Fortunately, the development of cost-effective metagenomic analysis of waters has enabled users to obtain much more information on the entire microbiological population in their systems compared to culture-based methods [9]. For example, next-generation sequencing (NGS) is now widely available and can provide valuable information on the types of microorganisms in an industrial water system. Although higher in cost than traditional methods, the rapid advances in genetic sequencing and metagenomic analysis make NGS analysis of water samples a useful complement to the well-known culture-based tests.
While the various nutrient media options are useful tools in a laboratory setting, they are impractical for use in the field. Some field nutrient-based microbiological tools are available to help determine microbial populations outside of a lab setting. Examples of these would include dip slides for aerobic microbes, small nutrient vials for the detection of sulfate-reducing prokaryotes, and biological activity reaction tests (BARTs) for the detection of various types of microorganisms [10]. BARTs are fairly low-cost culture-dependent tests that use selective media that are present in convenient plastic tubes to encourage the growth of various types of microbes when a water sample is added. Both the way the microorganisms grow and the reactions that may occur in the tube can indicate the types of microorganisms present. The time in which both the growth and reaction occur can help in the quantification of the microorganisms present. Taken together, the BARTs can yield valuable information about the types and quantity of microorganisms present in a system.
This study was undertaken because a large chilled-water loop in Texas was experiencing corrosion issues, and to rule out microbiologically influenced corrosion (MIC), several tests were run to determine whether the corrosion could be attributed to the metabolic activity of microorganisms. A sample of the water from this system was added to an iron-related bacteria BART tube and incubated according to the directions. After several days, growth was observed by the appearance of cloudiness in the tube, but that growth did not correspond to the reaction pattern that would include darkening and the appearance of red in the tube if the familiar iron-related bacteria associated with MIC were present [11,12,13]. To determine the types of microorganisms growing in the tube, the sample was sent for NGS analysis. The results showed the most abundant bacteria to be Pseudomonas and several other microbes, but none of the well-known iron bacteria Leptothrix or Sphaerotilus were found. Although Pseudomonas are known to play a role in microbiologically influenced corrosion events [14], the absence of the Leptothrix and Sphaerotilus led us to investigate the types of microorganisms that are present in the BART tubes.
Toward this end, the microbiological populations in several different types of BARTs were characterized by NGS analysis to understand which taxa were the most predominant in the tubes after incubation and whether these taxa were of notable abundance in the original sample. This paper describes the comparison of the BART reaction patterns and the NGS results of the most abundant microbial genera present in the tube compared to the NGS analysis of the original sample.

2. Materials and Methods

A total of 99 different samples from various types of industrial water systems were used in this study. Table 1 lists the number of different water samples that were cultured in the various BART tubes, and Table 2 lists the 10 water samples that were analyzed by both BART tube and NGS analysis. The BART tubes were inoculated with 15 mL of the system water, labeled, and incubated at room temperature out of direct sunlight according to the instructions [15]. The BARTs were observed every day until a reaction had occurred or until 7 days after inoculation. The reaction patterns and approximate population (cfu/mL) were then noted and tabulated according to the type of BART that was used. If the BART tube yielded a positive result, or if active growth was observed, that tube was then selected for NGS analysis, and a picture was taken to record the appearance of the tube and to interpret the reaction patterns of the positive tubes.
NGS analysis by 16S rRNA gene sequencing was used to determine the types and relative abundance of microorganisms present in the BART tubes. To prepare the samples for NGS, the DNA contained in the sample was preserved according to the following procedure: Approximately 15 mL of each positive BART sample was filtered through a 100 mL Pall Co. MicroFunnel filter funnel with a 0.2-micron Supor membrane (Pall Co., Port Washington, NY, USA). Using heat-sterilized tweezers, the membrane filter was then folded three times and placed into a proprietary lyophilized preservation buffer (Preservation Buffer A, LuminUltra Technologies, Fredericton, NB, Canada) in a 5 mL conical tube that had been previously rehydrated using 1.5 mL of nuclease-free water (LuminUltra Technologies, Fredericton, NB, Canada). Once the membrane was added to the rehydrated preservation buffer, the tubes were vortexed for ~30 s as per the manufacturer’s instructions.
The tube and its contents were then shipped overnight for NGS analysis. The preserved DNA from the samples was extracted and subjected to PCR amplification using the V4 variable region primers 515F (GTGYCAGCMGCCGCGGTAA) [16] + 806R (GGACTACNVGGGTWTCTAAT) [17]. The thermocycler program consists of denaturation at 94 °C for 120 s followed by 30 cycles of denaturation at 94 °C for 45 s, annealing at 59 °C for 45 s, and elongation at 72 °C for 45 s followed by a final elongation at 72 °C for 10 min. The amplicons were purified using Agencourt AMPure XP magnetic beads (Beckman Coulter Genomics GmbH, South Plainfield, UK) according to the manufacturer’s instructions. Following the quantification of the purified products using a Qubit High-Sensitivity Fluorometer kit (Invitrogen, Carlsbad, CA, USA), amplicons from each sample were combined at equimolar concentrations into an amplicon library. Finally, the DNA concentration of the library was measured by Qubit once again, diluted to a concentration of 2 nM, and then sequenced using an Illumina MiSeq sequencer with a v2 500 cycle reagent kit (Illumina, San Diego, CA, USA). Sequences were received for each sample as de-multiplexed FASTQ files representing forward and reverse paired-end reads. The paired-end reads were merged, and combined reads with a total expected error threshold above 0.5 were discarded using USEARCH (v10.0.240) [18], and the “classify.seqs” and “remove.lineage” commands in Mothur (v. 1.36.1) were used to identify and remove potential mitochondrial, chloroplast, archaeal, and eukaryotic contaminants [19]. The remaining sequences were grouped into operational taxonomic units (OTUs) based on a 3% sequence dissimilarity cutoff using the UPARSE greedy algorithm in USEARCH, during which chimeric sequences were also removed [18]. Subsequently, the taxonomic identity of each OTU was determined with the SINTAX algorithm implemented in USEARCH [20] in conjunction with the most current SILVA SSU ARB database [21,22]. The β-diversity analysis was carried out using the “ggplot2”, “vegan”, and “picante” packages in R.
The NGS results included putative metabolic assignments for the microbes found in the sample that were classified to the genus level. These assignments were assigned by cross-referencing a database that connects taxonomic IDs (via SILVA [16]) with a database of metabolic activities ascribed to those genera in the literature. Since the genus level is the most specific classification that can be reported with 16S rRNA gene sequencing, there are taxa that appear in multiple metabolic groups (for example, various species within the genus Pseudomonas, have different metabolic capabilities, including slime forming and iron reduction). These assignments were used to help determine whether the microbial consortia [15] identified by the growth patterns in the BART tube were specific to the type of BART used or whether it was part of an opportunistic population, which would not have given rise to the expected growth patterns that were observed in the tube. The primary criteria that were then used to determine agreement, or disagreement, between the methods was the presence or absence of the same microbes and subsequent metabolic groups identified by both methods.

3. Results

The intent of this study was to determine whether there was agreement between the types of microbes that were identified as being present in the BART tubes, based upon the reaction patterns and reaction patterns listed in the BART instruction manuals, and the microbes identified through NGS results.
Table 1 summarizes the comparison of the types of microbes present in the different BART tubes used in this study, based upon the observed reaction patterns in each tube, with the metabolic group of the identified taxa based upon the NGS analysis of each tube.

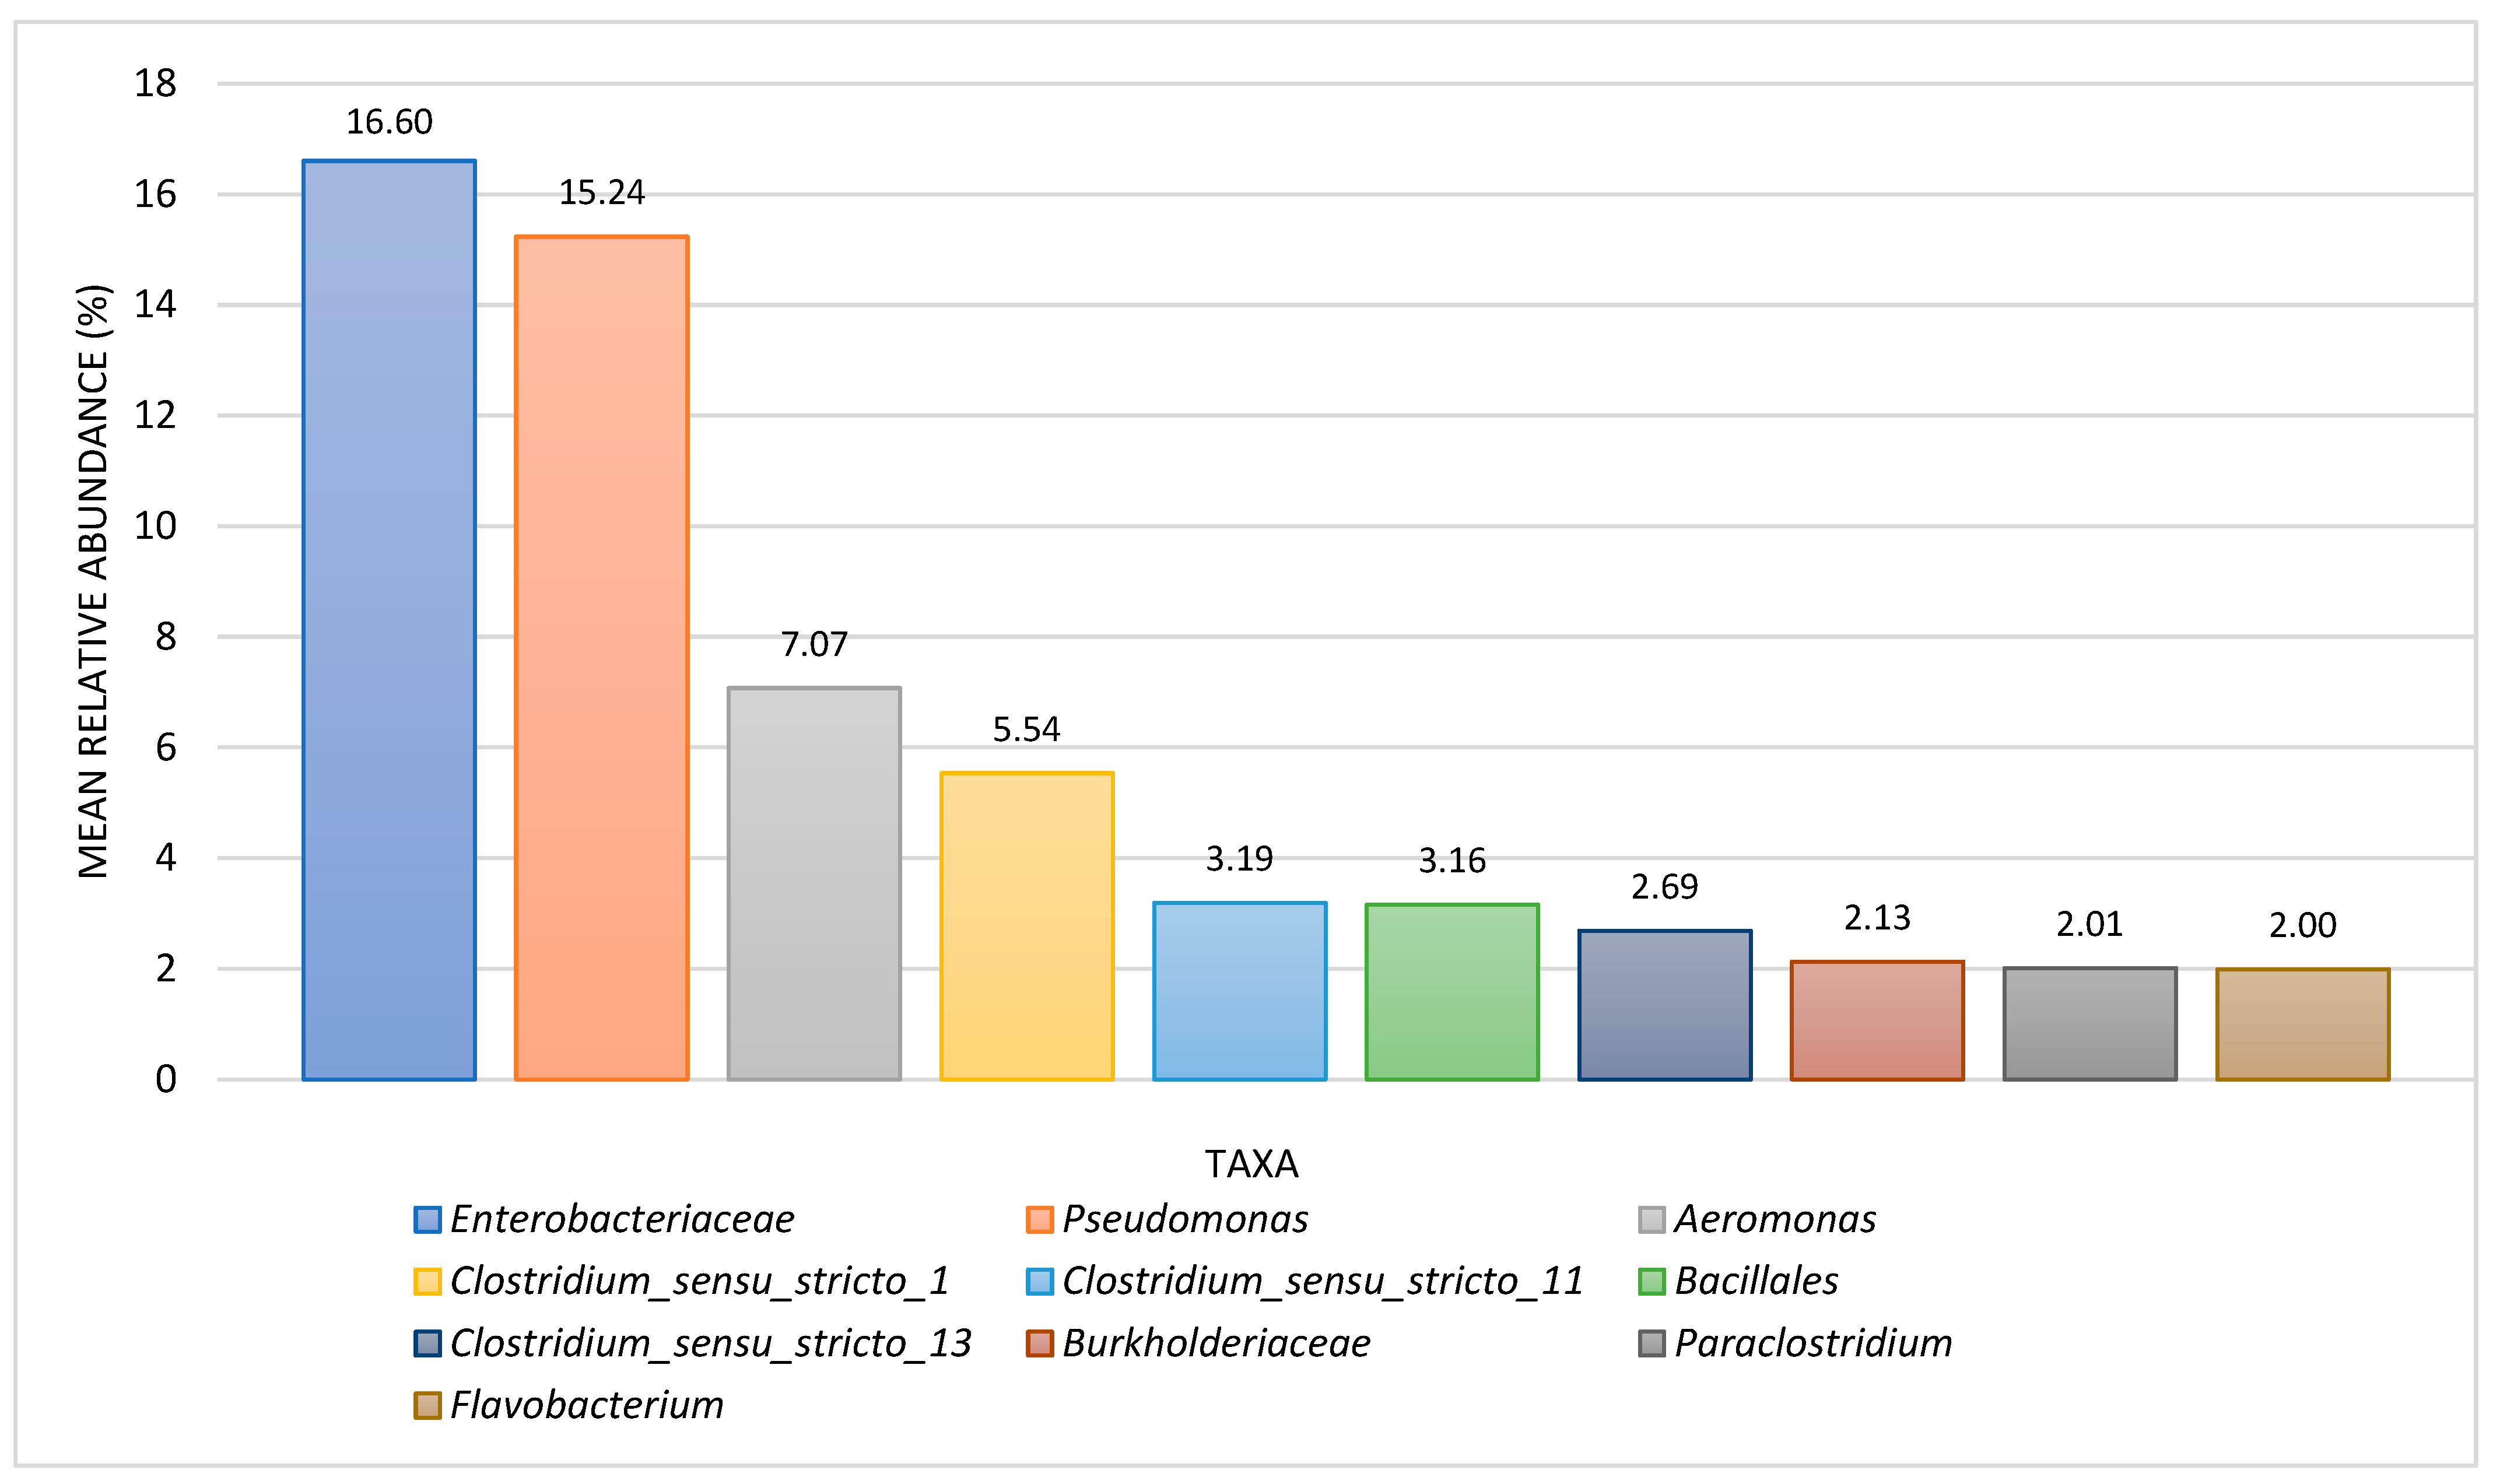
3.1. Comparison between Slime-Forming Bacteria (SLYM) BART and NGS Results

The SLYM BART has a total of eight reaction patterns that can occur. A total of twenty-eight SLYM BARTs were sent for NGS analysis, all of which exhibited one or more of the five reaction patterns DS (dense slime gel-like), SR (slime rings around the ball), CP (cloudy plate layering), CL (cloudy growth), and BL (blackened liquid) (15). The reaction patterns DS, SR, CP, and CL all identify the slime-former metabolic group and BL identifies enteric bacteria and pseudomonads.
As shown in Table 1, the NGS analysis results and the reaction pattern of the BART showed agreement in 100% of the samples for the presence of slime-forming bacteria. In 6 out of the 28 BARTs (21%), the reaction pattern for both enteric bacteria and pseudomonads was present. NGS analysis of those six BARTs (21%) showed the presence of enteric bacteria in three and Pseudomonas presence in five. In 22 of the 28 slime-forming BARTs (79%), the reaction pattern for enteric bacteria and pseudomonads was absent. NGS analysis showed that, in 17 of those 22 BARTs (77%), enteric bacteria were present, and in 21 of those 22 BARTs (95%), pseudomonads were present.
The most abundant taxon identified by NGS, at the genus level, in the SLYM BARTs was Pseudomonas, identified in 26 out of the 28 samples (93%) as shown in Figure 1.
At the family level, Enterbacteriaceae were the most abundant microbes that were identified, as shown in Figure 1.

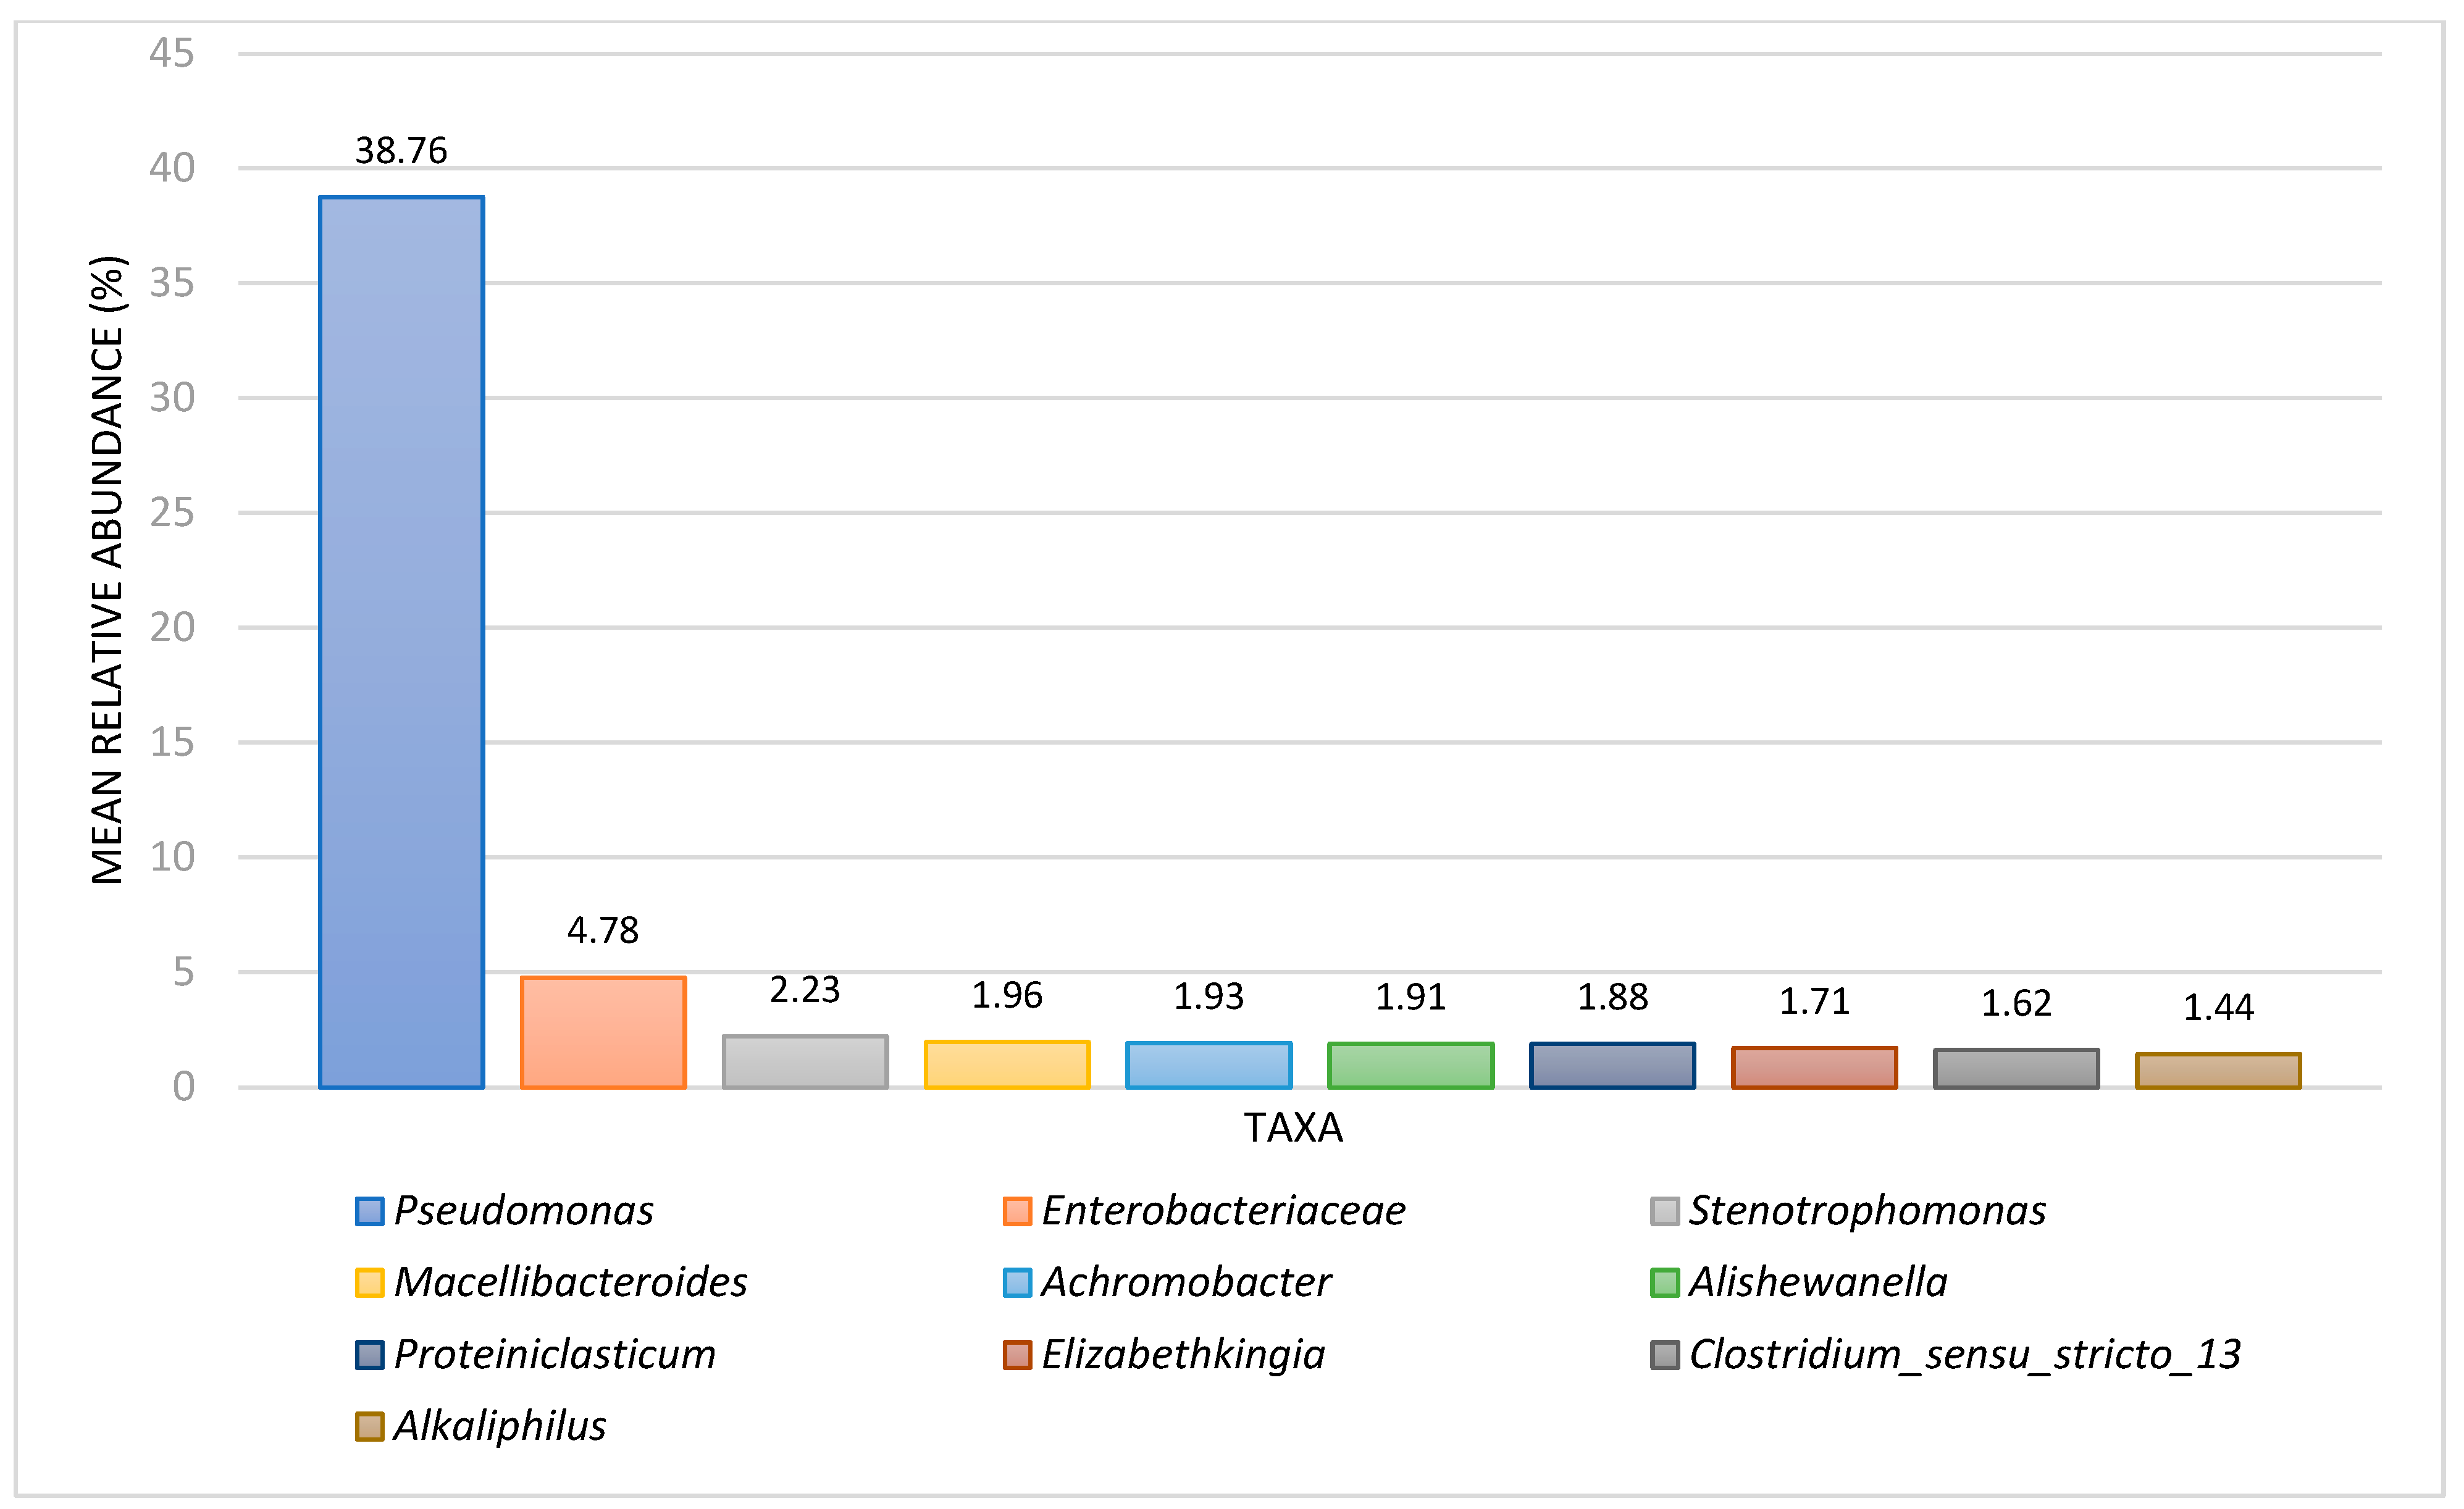
3.2. Comparison between Iron-Related Bacteria (IRB) BART and NGS Results

The IRB BART has a total of eight reaction patterns that can occur. A total of twenty-six IRB BARTs were analyzed and sent out for NGS analysis, all of which exhibited one or more of the six reaction patterns: BC (brown cloudy), FO (foam), BR (brown rings), BG (brown gel), RC (red cloudy), and BL (blackened liquid). The reaction patterns BC, BG, and BR all identify iron-related bacteria; FO identifies anaerobic bacteria; BL identifies pseudomonads and enteric bacteria; and RC identifies enteric bacteria.
As shown in Table 1, the NGS analysis results and the reaction pattern of the BART showed agreement in ~85% of the samples for the presence of iron-related bacteria. The remaining four IRB BARTs (15%) that were not in agreement did not show the reaction pattern for iron-related bacteria. The BART reaction patterns and NGS results in 14 (54%) of the BARTs were not in agreement regarding enteric organisms. In eight of those fourteen samples, the BART interpretation indicated the presence of enteric organisms, but the NGS results showed no enteric organisms. In the remaining six samples, NGS analysis showed the presence of enteric microbes, but the BART reaction pattern did not. Twenty-two of the twenty-six IRB BARTs (85%) did not show a reaction pattern for pseudomonads, whereas the NGS results did.
Nine of the twenty-six BARTs (35%) did not show agreement for anaerobic bacteria between reaction patterns and NGS analysis. The reaction patterns for four of those nine indicated the presence of anaerobic bacteria, while the NGS data did not. The remaining five samples did not show the reaction pattern for anaerobes, whereas the NGS results did report their presence.
At the family level, Enterbacteriaceae and Burkholderiaceae were identified as the second and third most abundant present as shown in Figure 2.

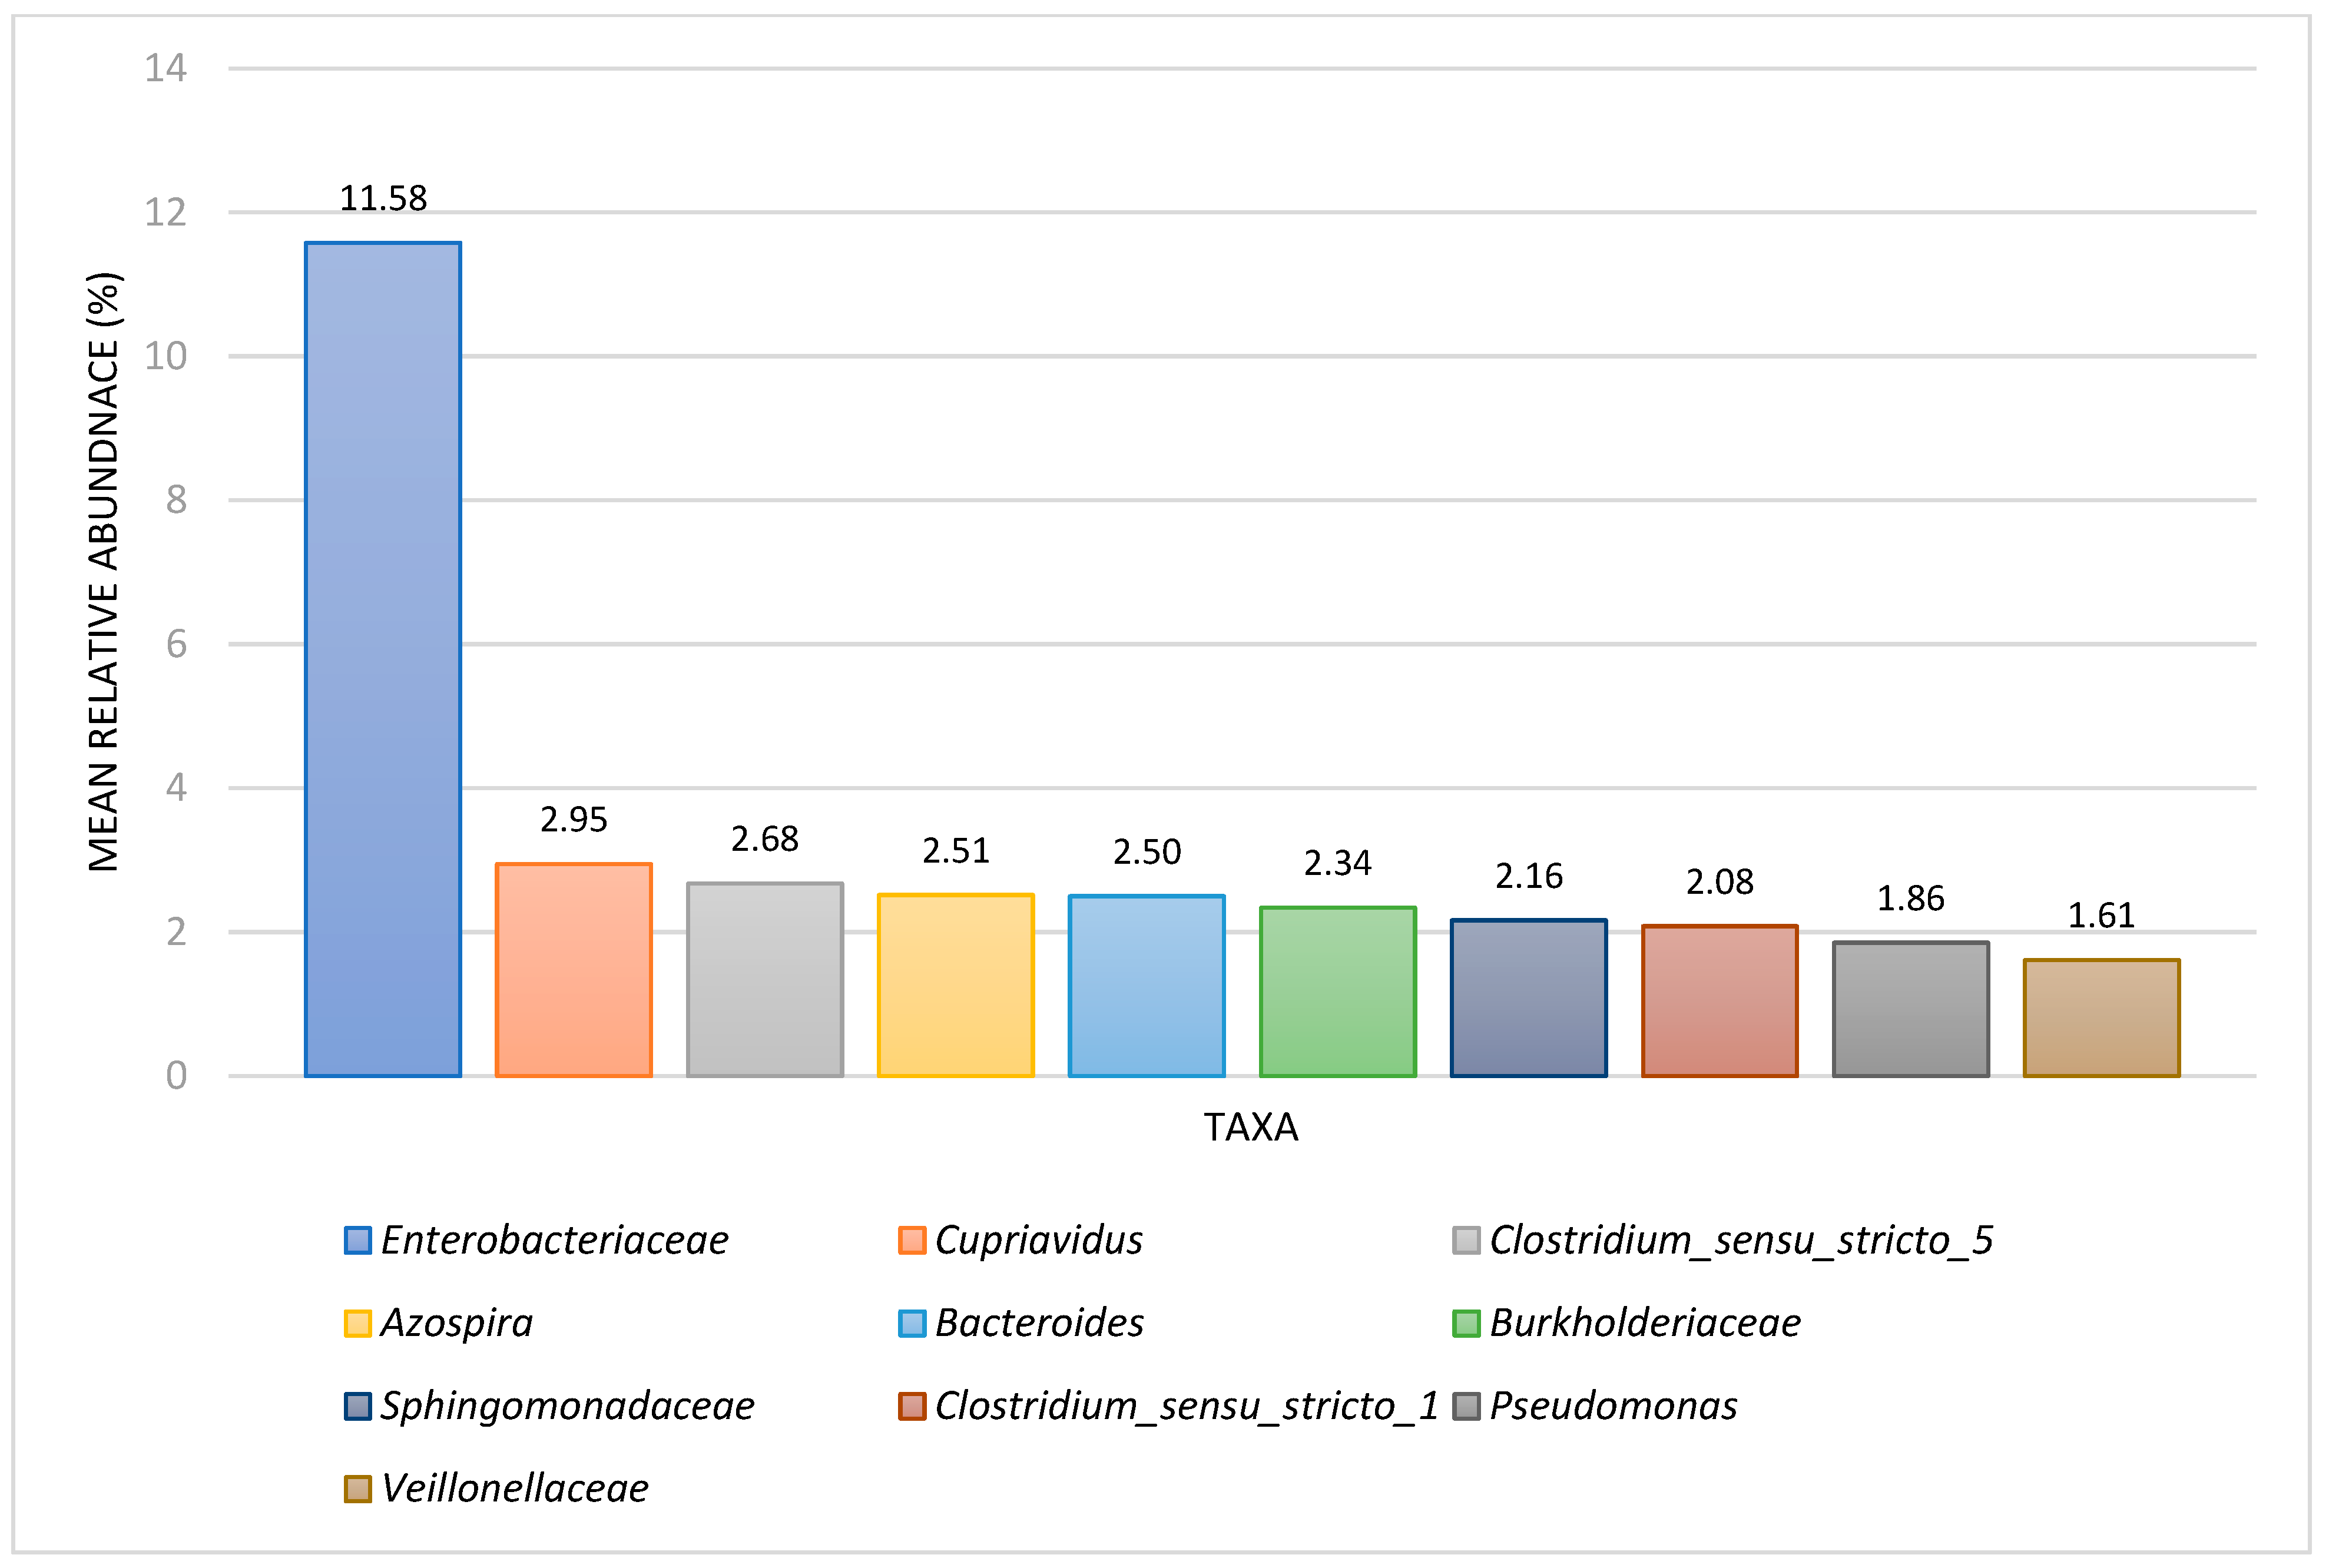
3.3. Comparison between Denitrifying (DN) BART and NGS Results

The DN BART has a single reaction pattern noted as FO for foam formation. A total of twenty-one DN BARTs were analyzed and sent out for NGS analysis. As displayed in Table 1, the NGS analysis results and the reaction pattern of the DN BARTs showed agreement in all twenty-one samples for the presence of taxa that can perform denitrification. Pseudomonas was the most abundant microbe identified by NGS and was identified in all twenty-one of the samples. Figure 3 shows the most abundant microbes at the family levels.

3.4. Comparison between Acid-Producing Bacteria (APB) BART and NGS Results

The APB BART also has a single reaction pattern, that is, a color change due to the pH indicator bromocresol purple, which changes color from purple to yellow, and is noted as DY. A total of fourteen APB BARTs were analyzed and sent out for NGS analysis. Table 1 shows that the NGS analysis and the reaction pattern of the APB BART agreed in fourteen of the fourteen samples for the presence of acid-producing bacteria. Cupriavidus was the most abundant taxa identified by NGS at the genus level, but members of Enterobacteriaceae were the most abundant at the family level. Figure 4 shows the most abundant taxa at the family level.

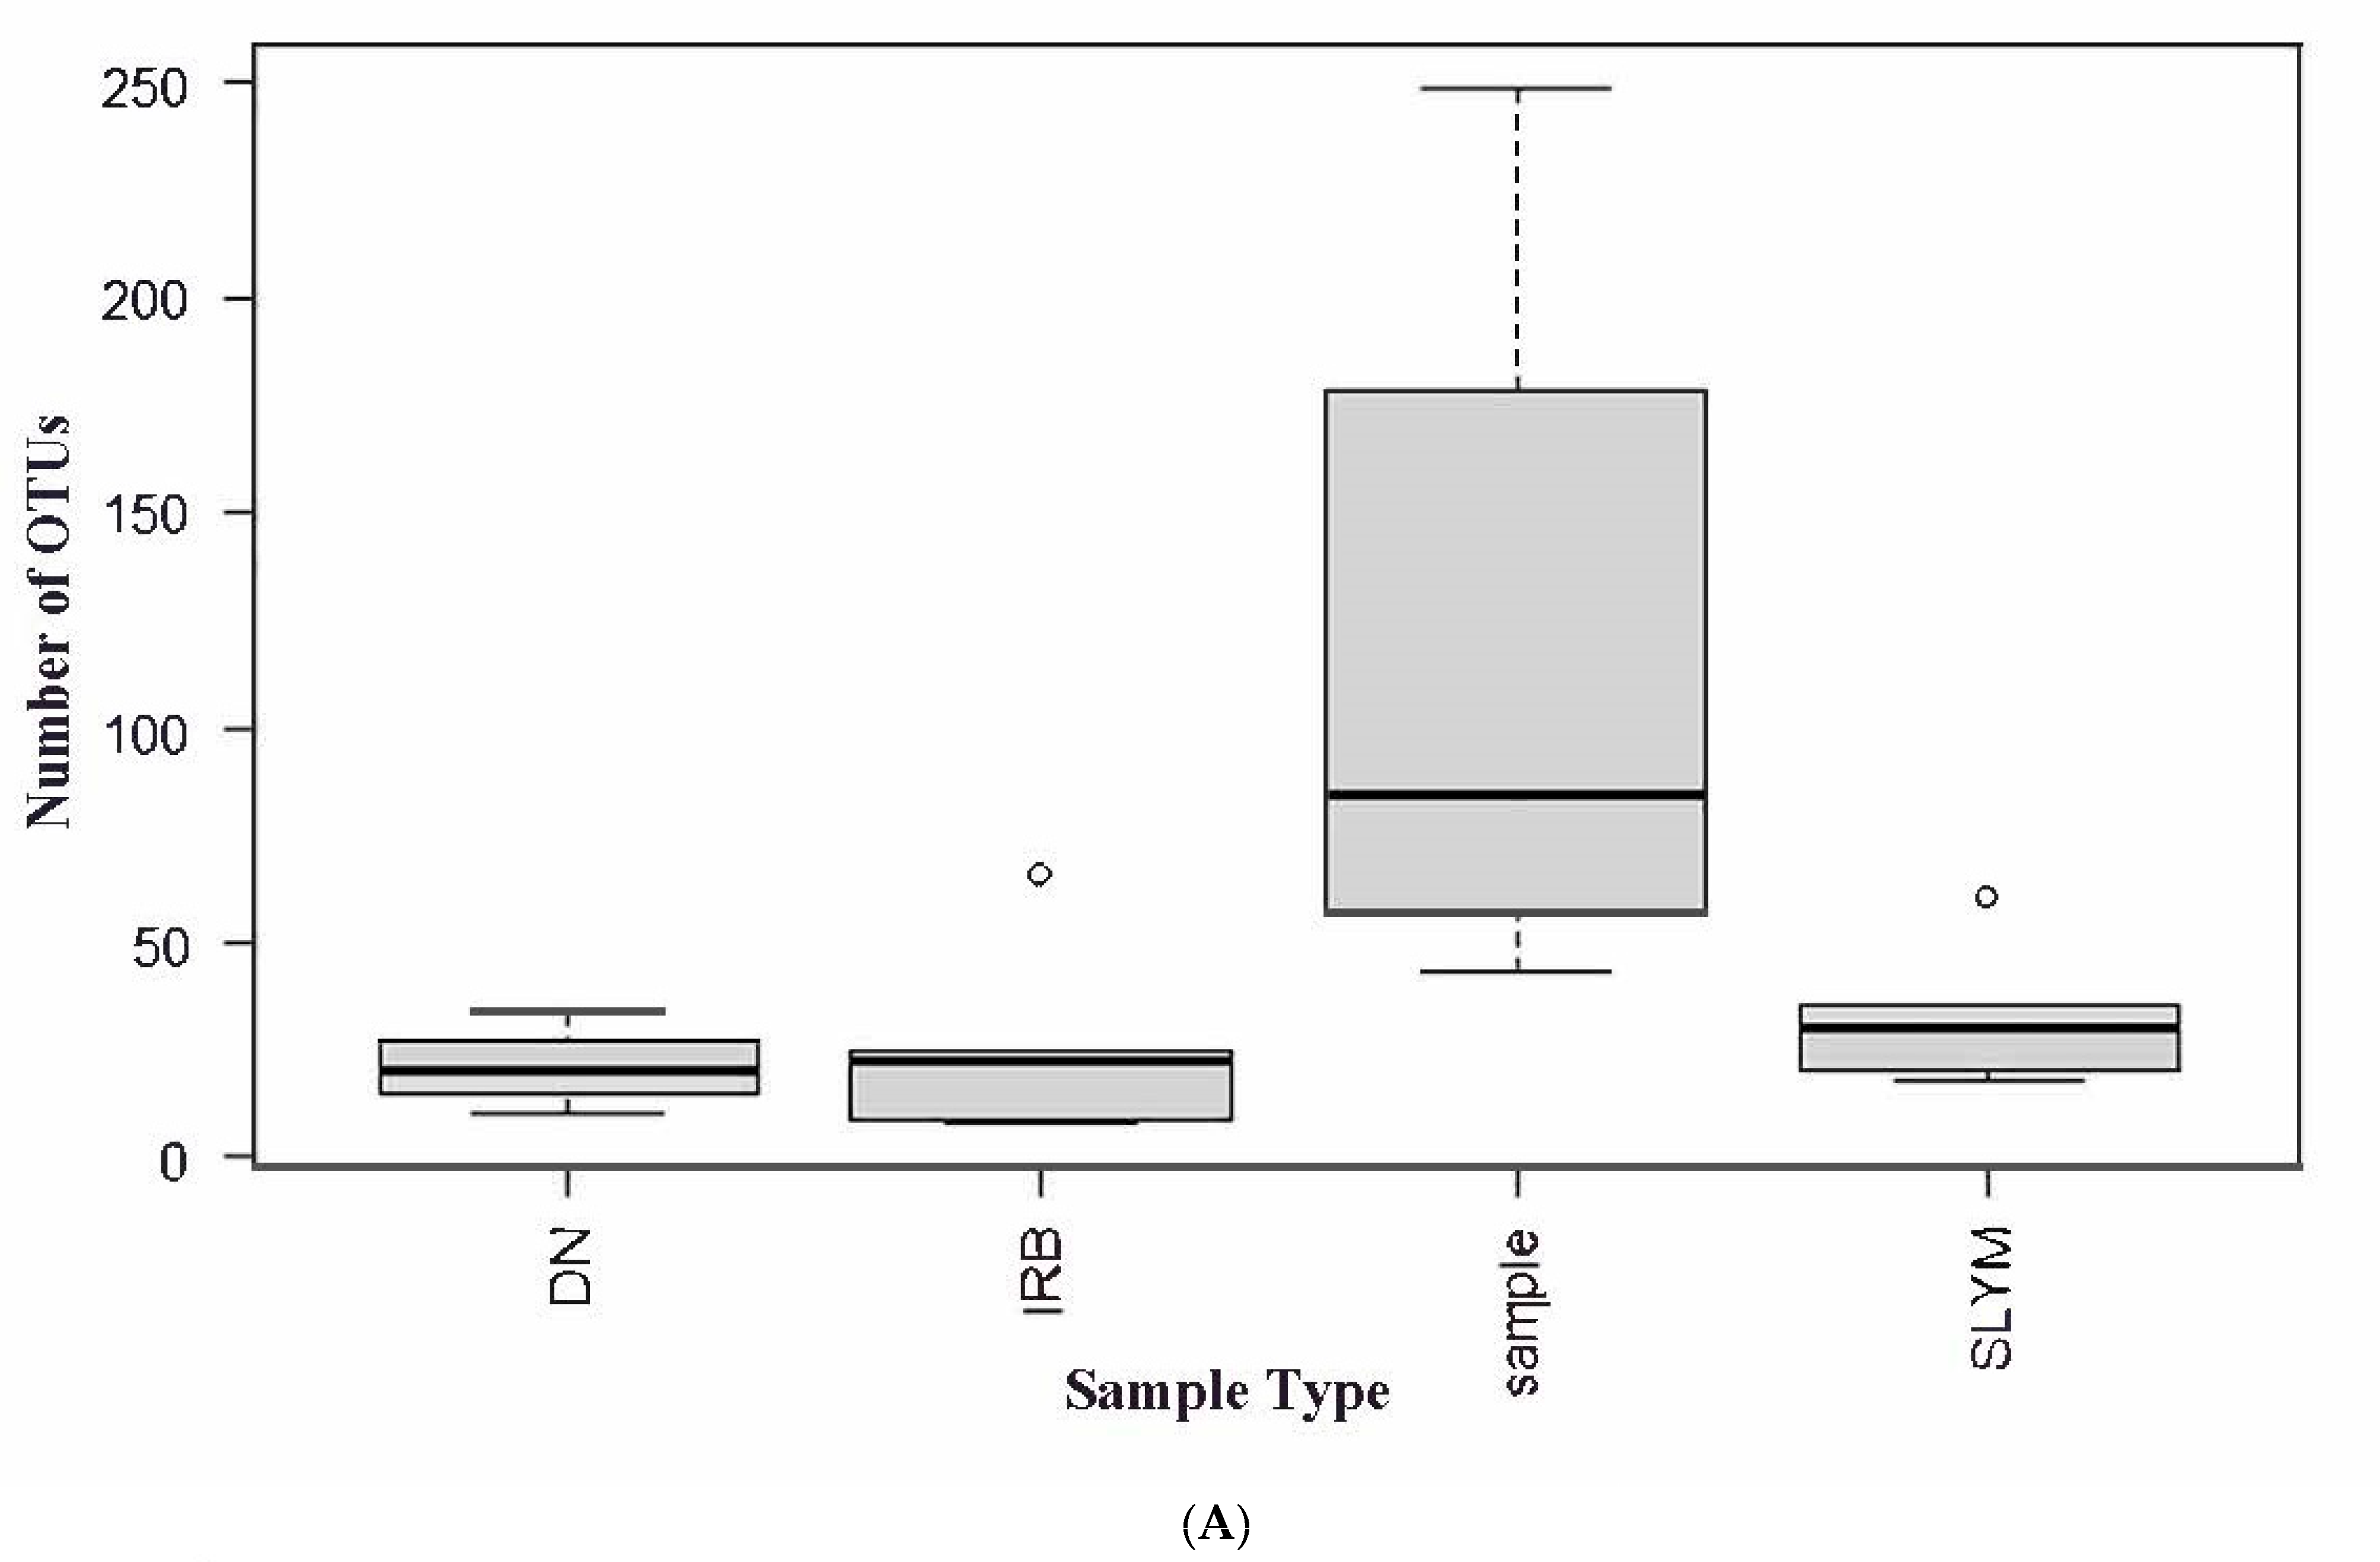
3.5. NGS and BART Analysis of Water Samples

To determine whether the microbiological populations in the BART tubes were reflective of the types of microbial communities present in the original water samples, ten different water samples were analyzed by one or more BARTs, followed by NGS analysis of the water and the BART that was used on the water sample. The three most abundant taxa identified by NGS in the water and in the BART are presented in Table 2. If a taxon was in the top three of both the water and the BART, it is highlighted in red. If there are no results listed for a BART, that particular BART was not used for the water sample.
In six of the ten samples, there was at least one taxon that was among the three most abundant taxa found in both the water sample and the BART tube. Four of the samples had no common taxon amongst the three most abundant in either the water or the BART tubes. In three of the samples, Pseudomonas was the most abundant taxon in the water and in the BART.

4. Discussion

The goals of this project were to understand whether the reaction patterns observed in the BARTs were truly indicative of the types of bacteria that were growing in the tubes (as identified by NGS analysis of the tubes) and whether the bacteria that were identified in an industrial water sample were also present in the BART tube that was used to analyze that water sample.
It was largely the case that the reaction patterns observed in the BART tubes corresponded well to the microbes that were identified by NGS sequencing. The reaction patterns for the slime-forming bacteria (SLYM) BART were in excellent agreement with the NGS results in all of the BARTs, although several of the BARTs did not indicate the presence of enteric bacteria whereas the NGS results did. The iron-related bacteria (IRB BART) reaction patterns showed good agreement with the NGS results in 84.6% of the BARTs but provided mixed results for the presence of enteric bacteria, agreeing in only 46.2% of the samples. In the case of the denitrifying BART (BN), there was excellent agreement between the BART reaction patterns for the presence denitrifying microorganisms and the NGS results, with all of the samples in complete agreement. Finally, the BART reaction patterns for the presence of acid-producing bacteria (APB) were in excellent agreement with the NGS results, with all of the samples in agreement for the types of bacteria present. Taken together, the BART reaction patterns did accurately reflect the types of bacteria that were identified by NGS, with the exceptions being that, in several of the SLYM and IRB BARTs, the reaction patterns did not reflect the presence of enteric bacteria.
It was most interesting to find that the types of bacteria in a water sample were not necessarily the most abundant bacteria that were found growing in the BART tube used to analyze that water sample. The discrepancy between the types of microorganisms identified in the water samples by the culture-dependent BART and the culture-independent NGS analysis is an interesting observation that has been shown before in work by Gieg et al. [23]. In their study, oilfield sludge samples and culture vials of those sludge samples were analyzed using 16S rRNA gene sequencing to determine the types of microorganisms present in each. Their results also showed distinct differences in the types of microorganisms identified in the original sludge sample and the culture samples; they attributed these differences to the presence of nutrients in the culture media that stimulated the growth of faster-growing microorganisms in the sludge samples. Similar results were noted by Vaz-Moreira et al. [24] in their study of a freshwater sample. Though the enrichment of certain metabolic groups is expected in the specialized media of BART bottles, these findings indicate that BART bottles can, in some cases, inflate the significance of a particular metabolic group by enriching for fast-growing taxa that are in very low abundance in the original sample.
To highlight the shift in microbial community dynamics after a sample has been incubated in a BART bottle, a beta diversity analysis is shown in Figure 4 and Figure 5. Figure 4 displays the difference in the number of unique taxa recovered from NGS analysis of the BART-incubated samples and the original sample. The number of distinct taxa in the BART bottle samples is very small compared to that in the original sample as a result of the enrichment of taxa capable of growing in a particular specialized medium. Figure 5 shows a nonmetric multidimensional scaling (NMDS) plot of four water samples and their corresponding BART-incubated samples in which each data point represents the microbial community of one sample. The plot distance matrix in this NMDS plot was calculated based on the Bray–Curtis dissimilarity, where data points that are more dissimilar in microbial community structure appear further apart from one another. Sample 10 (red) and Sample 5 (blue) show a distinct separation between their original samples (square) and their BART-incubated counterparts. This indicates how the microbial community in the original sample shifts in response to exposure to a specialized medium.

5. Conclusions

The use of culture-dependent methods to study the microbiological content of water samples has been prevalent for many years in applied microbiology. The NGS analysis of the types of microorganisms that grew in the BARTs revealed that the reaction patterns produced accurately reflected the types of microbes that were growing in the tube in most cases. However, the use of NGS on both water samples and BART tubes grown from those water samples gave a slightly different outcome and highlighted a shortcoming in the culture-dependent method of complex samples. Culturing samples can favor some microbes while inhibiting the growth of others, leading to potentially confusing outcomes. In this case, NGS analysis of water samples and BARTs showed inconsistent results with respect to the most abundant microbes in each sample. While the reaction patterns of the BARTs indicated a positive result, the type of microbe responsible for that result was not always consistent with that in the original water sample. This work highlights the need to use culture-dependent and culture-independent methods like next-generation sequencing as complimentary methods for analyzing complex communities in industrial water samples.

Supplementary Materials

The following supporting information can be downloaded at https://www.mdpi.com/article/10.3390/applmicrobiol4030073/s1, File S1: A PowerPoint file of pictures of the BART tubes and NGS results for most of the samples used in this study.

Author Contributions

D.B.M.: conceptualization, analysis, interpretation, and writing—original draft preparation and editing; M.M.: data generation, analysis, interpretation, writing, and editing; A.C.: data generation, analysis, interpretation, writing, and editing; B.N.: project management, analysis, and interpretation; D.N.: data interpretation, preparation of NMDS plot, and editing the manuscript. All authors have read and agreed to the published version of the manuscript.

Funding

Funding for this study was provided by the management of ChemTreat, Inc.

Data Availability Statement

The original contributions presented in this study are included in the article/Supplementary Materials; further inquiries can be directed to the corresponding author.

Acknowledgments

The authors would like to thank the management of ChemTreat, Inc., and LuminUltra, Inc., for allowing us to publish this work and for the helpful assistance provided by LuminUltra, Inc., in interpreting the NGS data generated in this study.

Conflicts of Interest

Douglas B. McIlwaine, Mackenzie Moore, Alexsandra Corrigan and Benjamin Niemaseck are employed with ChemTreat Incorporated. Danika Nicoletti is employed with LuminUltra Technologies Ltd.

References

  1. Gracias, K.S.; McKillip, J.L. A review of conventional detection and enumeration methods for pathogenic bacteria in food. Can. J. Microbiol. 2004, 50, 883–890. [Google Scholar] [CrossRef] [PubMed]
  2. Reasoner, D.J.; Geldreich, E.E. A new medium for the enumeration and subculture of bacteria from potable water. Appl. Environ. Microbiol. 1985, 49, 1–7. [Google Scholar] [CrossRef] [PubMed]
  3. Clesceri, L.S.; Greenberg, A.E.; Trussell, R.R. Standard Methods for the Examination of Water and Wastewater, 21st ed.; APHA: Washington, DC, USA, 2005. [Google Scholar]
  4. Clesceri, L.S.; Greenberg, A.E.; Eaton, A.D. Standard Methods for the Examination of Water and Wastewater, 20th ed.; APHA: Washington, DC, USA, 1998. [Google Scholar]
  5. Brown, V.I.; Lowbury, E.J. Use of an improved cetrimide agar medium and other culture methods for Pseudomonas aeruginosa. J. Clin. Pathol. 1965, 18, 752–756. [Google Scholar] [CrossRef] [PubMed]
  6. Elazhary, M.A.; Saheb, S.A.; Roy, R.S.; Lagacé, A. A simple procedure for the preliminary identification of aerobic gram-negative intestinal bacteria with special reference to the Enterobacteriaceae. Can. J. Comp. Med. 1973, 37, 43–46. [Google Scholar] [PubMed]
  7. Bopp, C.A.; Sumner, J.W.; Morris, G.K.; Wells, J.G. Isolation of Legionella spp. from environmental water samples by low-pH treatment and use of a selective medium. J. Clin. Microbiol. 1981, 13, 714–719. [Google Scholar] [CrossRef] [PubMed]
  8. Bonnet, M.; Lagier, J.C.; Raoult, D.; Khelaifia, S. Bacterial culture through selective and non-selective conditions: The evolution of culture media in clinical microbiology. New Microbes New Infect. 2019, 34, 100622. [Google Scholar] [CrossRef] [PubMed]
  9. Kamuran, A.; Serap, C.; Esin, O.Y.; Gülcihan, G. Advance methods for the qualitative and quantitative determination of microorganisms. Microchem. J. 2021, 166, 106188. [Google Scholar] [CrossRef]
  10. Razban, B.; Nelson, K.Y.; Cullimore, D.R.; Cullimore, J.; McMartin, D.W. Quantitative bacteriological assessment of aerobic wastewater treatment quality and plant performance. J. Environ. Sci. Health Part A Toxic Hazard. Subst. Environ. Eng. 2012, 47, 727–733. [Google Scholar] [CrossRef] [PubMed]
  11. Little, B.J.; Wagner, P.A.; Lewandowski, Z. The Role of Biomineralization in Microbiologically Influenced Corrosion. In Proceedings of the CORROSION/98, San Diego, CA, USA, 22–27 March 1998; NACE International: Houston, TX, USA, 1998. Paper No. 294. [Google Scholar]
  12. Little, B.; Wagner, P.; Hart, K.; Ray, R.; Lavoie, D.; Nealson, K.; Aguilar, C. The role of biomineralization in microbiologically influenced corrosion. Biodegradation 1998, 9, 1–10. [Google Scholar] [CrossRef] [PubMed]
  13. Nguyen, T.A.; Lu, Y.; Yang, X.; Shi, X. Carbon and steel surfaces modified by Leptothrix discophora SP-6: Characterization and implications. Environ. Sci. Technol. 2007, 41, 7987–7996. [Google Scholar] [CrossRef] [PubMed]
  14. Yang, J.; Zhang, Y.; Chang, W.; Lou, Y.; Qian, H. Microbiologically influenced corrosion of FeCoNiCrMn high-entropy alloys by Pseudomonas aeruginosa biofilm. Front. Microbiol. 2022, 13, 1009310. [Google Scholar] [CrossRef] [PubMed]
  15. Cullimore, D.R. Standard Methods for BART Testers, Fourth Edition. Available online: https://www.dbi.ca/StandMeth/StandardMethod-4th.pdf (accessed on 19 December 2013).
  16. Parada, A.E.; Needham, D.M.; Fuhrman, J.A. Every base matters: Assessing small subunit rRNA primers for marine microbiomes with mock communities, time series and global field samples. Environ. Microbiol. 2016, 18, 1403–1414. [Google Scholar] [CrossRef] [PubMed]
  17. Apprill, A.; McNally, S.; Parsons, R.; Weber, L. Minor revision to V4 region SSU rRNA 806R gene primer greatly increases detection of SAR11 bacterioplankton. Aquat. Microb. Ecol. 2015, 75, 129–137. [Google Scholar] [CrossRef]
  18. Edgar, R.C. UPARSE: Highly accurate OTU sequences from microbial amplicon reads. Nat. Methods 2013, 10, 996–998. [Google Scholar] [CrossRef] [PubMed]
  19. Schloss, P.D.; Westcott, S.L.; Ryabin, T.; Hall, J.R.; Hartmann, M.; Hollister, E.B.; Lesniewski, R.A.; Oakley, B.B.; Parks, D.H.; Robinson, C.J.; et al. Introducing mothur: Open-source, platform-independent, community-supported software for describing and comparing microbial communities. Appl. Environ. Microbiol. 2009, 75, 7537–7541. [Google Scholar] [CrossRef] [PubMed]
  20. Edgar, R.C. SINTAX, a simple non-Bayesian taxonomy classifier for 16S and ITS 513 sequences. bioRxiv 2016. [Google Scholar] [CrossRef]
  21. Quast, C.; Pruesse, E.; Yilmaz, P.; Gerken, J.; Schweer, T.; Yarza, P.; Peplies, J.; Glöckner, F.O. The SILVA ribosomal RNA gene database project: Improved data processing and web-based tools. Nucl. Acids Res. 2013, 41, D590–D596. [Google Scholar] [CrossRef]
  22. Caporaso, J.G.; Lauber, C.L.; Walters, W.A.; Berg-Lyons, D.; Huntley, J.; Fierer, N.; Owens, S.M.; Betley, J.; Fraser, L.; Bauer, M.; et al. Ultra-high-throughput microbial community analysis on the Illumina HiSeq and MiSeq platforms. ISME J. 2012, 6, 1621–1624. [Google Scholar] [CrossRef]
  23. Gieg, L.; Sargent, J.; Bagaria, H.; Place, T.; Sharma, M.; Shen, Y.; Kiesman, D. Synergistic effect of biocide and biodispersant to mitigate microbiologically influenced corrosion in crude oil transmission pipelines. In CORROSION 2020-15090; NACE International: Houston, TX, USA, 2020. [Google Scholar]
  24. Vaz-Moreira, I.; Egas, C.; Nunes, O.C.; Manaia, C.M. Culture-dependent and culture-independent diversity surveys target different bacteria: A case study in a freshwater sample. Antonie Van Leeuwenhoek 2011, 100, 245–257. [Google Scholar] [CrossRef] [PubMed]
Figure 1. The top 10 taxa by mean relative abundance (%) identified in the SLYM BARTs (n = 28) by NGS analysis, identified to its most specified taxonomic level.
Applmicrobiol 04 00073 g001
Figure 2. The top 10 taxa by mean relative abundance (%) identified in the IRB BARTs (n = 26) by NGS analysis, identified to its most specified taxonomic level.
Applmicrobiol 04 00073 g002
Figure 3. The top 10 taxa by mean relative abundance (%) identified in the DN BARTs (n = 21) by NGS analysis, identified to its most specified taxonomic level.
Applmicrobiol 04 00073 g003
Figure 4. The top 10 taxa by mean relative abundance (%) identified in the APB BARTs (n = 14) by NGS analysis, identified to its most specified taxonomic level.
Applmicrobiol 04 00073 g004
Figure 5. Beta diversity analysis of original water samples and corresponding BART-incubated samples for various metabolic groups (denitrifying bacteria (DN), iron-reducing bacteria (IRB), and slime-forming bacteria (SLYM)). (A) The number of OTUs identified in each sample type—original sample (sample) and three types of BART bottles. (B) NMDS plot displaying the dissimilarity between microbial communities determined by Bray–Curtis dissimilarity analysis. Each data point represents the microbial community of one sample.
Applmicrobiol 04 00073 g005aApplmicrobiol 04 00073 g005b
Table 1. The percentage of BARTs tubes in which the reaction pattern and metabolic group/taxon identified by NGS analysis agreed after incubation. Agreement determined where the reaction pattern and metabolic group/taxon both indicated a presence above 1–5% relative abundance.
Metabolic Group/TaxonSlime-Forming Bacteria BARTs (%), n = 28Iron-Related Bacteria BARTs, (%) n = 26Denitrifying Bacteria BARTs, (%), n = 21Acid-Producing Bacteria BARTs, (%), n = 14Interpretation Notes
Enteric bacteria28.646.2----------Enteric bacteria encompass all identified organisms under the family Enterobacteriaceae.
Pseudomonas21.4 15.4 ----------Pseudomonads include all identified organisms under the genus Pseudomonas.
Slime-forming bacteria/
prokaryotes
100 ---------------The slime-forming/prokaryotes and bacteria metabolic groupings included slime formers, both bacterial and prokaryotic, as well as viscous bulking bacteria.
Iron-related bacteria-----84.6 ----------The iron-related bacteria metabolic grouping included both iron-reducing bacteria and iron-oxidizing bacteria.
Anaerobic bacteria-----65.4 ----------The anaerobic metabolic grouping included methane oxidizing, methane- producing—acetotrophic, methane-producing—hydrogenotrophic, methane producing—methylotrophic, methane-oxidizing prokaryotes, syntrophs, sulfate-reducing bacteria, foaming, and fermentative prokaryotes.
Acid-producing and/or fermentative metabolism---------------100 The acid-producing and fermentative metabolic grouping included acid-producing prokaryotes, fermentative prokaryotes, fermentative thiosulfate-reducing prokaryotes, and acetogens.
Denitrifying bacteria----------100-----The denitrifying grouping included nitrite-reducing and nitrate-reducing organisms.
Agreements for the listed microorganisms and metabolic groupings were only considered if the types of BARTs had reaction patterns for them.
Table 2. The three most abundant genera identified by NGS in the original water samples versus those in the BART-incubated samples. Genera that are in red bold text appear in the top three both in the original water sample and in the BART-incubated samples.
Sample Top 3 Genera IRB BART Top 3 GeneraSLYM BART Top 3 GeneraDN BART Top 3 Genera
Sample 101. Phaeodactylibacter
2. Hydrogenophaga
3. JGI_0001001-H03
1. Pseudomonas
2. Shewanella
3. Proteiniclasticum
1. Clostridium_sensu_stricto_1
2. Shewanella
3. Pseudomonas
Sample 91. Hydrogenophaga
2. Flavobacterium
3. Simplicispira
1. Pseudomonas
2. Chryseobacterium
3. Flavobacterium
Sample 8 1. Pseudomonas
2. Rheinheimera
3. Flavobacterium
1. Pseudomonas
2. Thermovirga
3. Halomonas
Sample 71. Pseudomonas
2. Alishewanella
3. Sphingopyxis
1. Pseudomonas
2. Stenotrophomos
3. Alishewanella
1. Clostridium_sensu_stricto
_1
2. Pseudomonas
3. Stenotrophomonas
1. Pseudomonas
2. Stenotrophomonas
3. Alishewanella
Sample 61. Nubsella
2. Sphingopyxis
3. Aminobacter
1. Aeromonas
2. Morganella
3. Hafina-Obesumbacterium
Sample 51. Cupriavidus
2. Pedobacter
3. Sphingobacterium
1. Providencia
2. Pseudomonas
3. Alcaligenes
1. Sphingobacterium
2. Stenotrophomonas
3. Clostridium_sensu_stricto
_18
Sample 41. Hyphomicrobium
2. Pir4_lineage
3. Haliscomenobacter
1. Pseudomonas
2. Morganella
3. Aeromonas
Sample 31. Pseudomonas
2. Legionella
3. Porphyrobacter
1. Clostridium_sensu_stricto
_1
2. Lysinibacillus
3. Paraclostridium
Sample 21. Pseudomonas
2. Methyloversatilis
3. Cupriavidus
1. Pseudomonas
2. Morganella
3. Acinetobacter
1. Pseudomonas
2. Alkaliphilus
3. Cupriavidus
Sample 11. Pseudomonas
2. Cupriavidus
3. Sphingobacterium
1. Pseudomonas
2. Sphingobacterium
3. Stenotrophomonas
Disclaimer/Publisher’s Note: The statements, opinions and data contained in all publications are solely those of the individual author(s) and contributor(s) and not of MDPI and/or the editor(s). MDPI and/or the editor(s) disclaim responsibility for any injury to people or property resulting from any ideas, methods, instructions or products referred to in the content.

