Abstract
Background/Objectives: Uric acid (UA) levels vary based on gender, but elevated UA levels are linked to various health conditions in both sexes. Methods: This study examined the impact of a high-pectin smoothie (11.6 g fiber/day) consumption for 3 weeks on UA levels and gut microbiota in 28 healthy women. Food diaries, stool, and blood samples were collected at baseline and after the smoothie consumption. Results: The participants with similar baseline UA levels showed divergent responses: UA levels increased in the 15th participant (UAI group) and decreased in the 13th (UAD group) post-intervention. Smoothie consumption increased Bacteroides in the UAD and Prevotella 9 in the UAI, contrasting with the baseline abundances, where Prevotella 9 was higher in the UAD and Bacteroides in the UAI group. Furthermore, the proportion of Faecalibacterium increased in the UAI group after smoothie consumption, equalizing the baseline difference with the UAD group. Conclusions: This research highlights the role of personalized dietary strategies, noting that the impact of increased pectin consumption on managing UA levels in women may rely on their baseline gut microbiota and fiber intake.
1. Introduction
Uric acid (UA) is a compound that either forms when the body breaks down purines found in certain foods and drinks or is synthesized within the body. The liver, kidneys, and intestines regulate UA levels, primarily excreting it through the kidneys and partly through the intestines and bile. Some gut bacteria can convert UA to allantoin using the enzyme uricase, which is more soluble and less likely to crystallize in joints, but humans lack it due to evolutionary changes [1]. Additionally, estrogen has been shown to facilitate UA excretion through the kidneys [2]. When there is a disruption in the coordination between these organs and the gut microbiota, it can lead to elevated levels of blood UA, which is linked to various diseases, including gout [3]. Hyperuricemia raises the risk of all-cause and coronary heart disease mortality more in women than in men, and even slightly elevated serum UA levels may increase the risk of arterial stiffness [4,5]. Furthermore, studies have shown correlations between body composition and UA levels [6,7]. Elevated UA levels may increase oxidative stress by increasing the production of reactive oxygen species, particularly in females [8].
Based on current knowledge, gut bacteria producing short-chain fatty acids (SCFAs) can lower UA levels [9,10]. The growth of SCFAs-producing bacteria can be enhanced by consuming dietary fiber-rich foods. Soluble dietary fiber pectin, from sources such as apple pomace and citrus peel, is stable in the gastrointestinal tract and reaches the large intestine, where prebiotic oligosaccharides are fermented by gut microbiota, producing SCFAs that promote health [11,12]. A recent study indicates that regular administration of Ligilactobacillus salivarius CECT 30632 can effectively reduce serum urate levels, helping to control hyperuricemia [13]. Abnormalities in the breakdown of UA due to gut microbiota can cause increased UA production, the release of pro-inflammatory mediators, and damage to the intestinal barrier [14]. Since many gut bacteria are involved in purine metabolism, hyperuricemia is frequently associated with gut dysbiosis [15]. As the enterotype appears to be related to health indicators, lower UA levels are known to be associated with the Prevotella enterotype [16]. At the same time, the relative abundance of Prevotella, along with Bacteroides and Fusobacterium, was found to be increased in gout [17].
Various factors may influence the microbiota enterotype, with sex being an important determinant. Hormones affect gut microbiota differently depending on gender, influenced by diet, lifestyle, and medication use [18]. It is known that high-fructose, high-fat, and purine-rich diets can lead to hyperuricemia and alterations in gut microbiota, as observed in both animal models and hyperuricemic individuals [19,20]. On the contrary, the DASH (Dietary Approaches to Stop Hypertension) diet, characterized by greater consumption of high-fiber fruit and vegetables, along with low-fat dairy and reduced total and saturated fat, lowers serum urate levels [21]. Consistent with the above, our previous study showed that otherwise healthy female participants in the low-fiber group had significantly higher levels of UA compared to the high-fiber group [22]. It is well known that food choices and individual menu components can have a preventive effect on the development of diseases and that dietary fibers, such as pectins, contribute to general health and strengthen the health of the digestive tract [23].
This specific observational study was part of a larger research project and aimed to investigate the effect of consuming a high-pectin (HPect) smoothie on UA levels and gut microbiota composition in healthy women without clinical hyperuricemia.
2. Materials and Methods
2.1. Recruitment of Study Participants and Design of the Study
This smoothie study was carried out, and the smoothies were developed by the Center of Food and Fermentation Technologies (AS TFTAK, Tallinn, Estonia) in collaboration with Siidrikoda (Estonia). This study was divided into five periods and lasted from October 2022 to December 2022. The participants were selected based on a questionnaire regarding their eating habits, health status (including digestive health), and lifestyle. The target group included individuals with at least three of the following: a sedentary lifestyle, a low Bristol score (<3), limited fruit and vegetable intake, and gastrointestinal complaints without a diagnosed disease. Exclusion criteria included antibiotic use in the past three months, severe or chronic diseases, specific diets, recent travel to tropical areas, or intolerance to apples. Participants were instructed to maintain their usual eating habits, and those deviating from the protocol were excluded. The exact study design, smoothie composition, and inclusion and exclusion criteria are described in detail in our previous article related to the study project [22]. Following the previous study, this study focuses on monitoring the effect of a pectin-rich smoothie on UA levels in healthy women who consume few fruits and vegetables. An additional criterion for inclusion in this study was that UA levels aligned with the reference values established by the United Laboratories of Tartu University Hospital (https://www.kliinikum.ee/yhendlabor/wp-content/uploads/2023/05/TL-14_5__V20_Reference_values_for_clinical_chemistry_tests.pdf, accessed on 1 May 2023). Of the 368 volunteers who filled out the questionnaire, 39 were included in the study, with 31 completing it, including three men (9.7%). Since this research focused on female health, data from the men were withdrawn, leaving data from 28 women for analysis. Data was obtained at baseline and the end of the HPect smoothie consumption period. During the 3-week HPect smoothie period, participants consumed an additional 11.6 g of fiber per day alongside their regular meals. Meanwhile, participants were asked to continue with their usual eating habits. The study participants were divided into groups based on changes in UA levels after consuming the HPect smoothie: a decreased UA group (UAD, n = 13) and an increased UA group (UAI, n = 15).
2.2. Data Collection
Participants completed nutrition diaries one week before blood and fecal sample collection using the NutriData program (National Institute for Health Development, Estonia). The macronutrient analysis included all regular diet periods to account for variations. Blood and fecal samples were collected at the end of each period, and body composition was measured with a Tanita body composition analyzer (DC-360S, Tanita Corporation, Tokyo, Japan). The uric acid levels were measured using the enzymatic colorimetric method (Cobas c 501, Roche Diagnostics CH—6343 Rotkreuz, Switzerland). A detailed description of data collection and blood sampling is available in our earlier article [22].
2.3. DNA Extraction and Sequencing
Fecal samples were collected with DNA/RNA Shield Collection Tubes (Research, Irvine, CA, USA) and stored at +4 °C. Before DNA extraction, the samples were frozen at −20 °C overnight. DNA was extracted using the ZymoBIOMICS DNA Miniprep Kit. The Qubit™ 3 Fluorometer (Thermo Fisher Scientific, Waltham, MA, USA) was used for gDNA quantification. The V4 region of the 16S rRNA gene was PCR amplified with universal primers F515 and R806. Samples were sequenced on the Illumina MiSeq platform, yielding an average of 38,800 reads per sample. The whole sequencing workflow has been published before [24]. Subsequent analysis was performed using BION-meta software (https://github.com/nielsl/mcdonald-et-al), involving sequence cleaning, chimaera removal, and clustering by 95% similarity [25]. Consensus reads were aligned to the SILVA reference 16S rRNA database (v138). A detailed description of DNA extraction is available in our earlier article [22].
2.4. Statistical Analyses
Statistical analyses were performed at the bacteria genus level with an abundance of at least >0.0006 per sample. Data analyses were conducted by R version 4.2.1. Pairwise comparisons between baseline and post-HPect smoothie consumption were assessed using the Wilcoxon signed-rank test to evaluate differences between UAD and UAI groups. Statistical significance was set at p < 0.01. Macronutrient intake and health parameters were analyzed using SPSS version 20.0, employing the Wilcoxon test for subgroup comparisons with significance set at p < 0.05.
3. Results
3.1. Baseline Characteristics of the Two Groups, Formed According to Changes in Uric Acid Levels After Consuming the HPect Smoothie
Age is an essential factor influencing female overall health and hormonal status. The participants in the UAD group were younger, with an average age of 34 (±6.8), compared to the participants in the UAI group, who had an average age of 39 (±4.8) (t-test p-value = 0.02). No statistically significant differences were found between the two groups regarding their eating habits. Table 1 displays the daily intake of energy, macronutrients, and fiber. The macronutrient intake of the two groups during their standard diet was analyzed via food records. The mean intake of fructose, a sugar that may affect UA levels, was relatively low in both groups (18.7 g in the UAD and 16 g in the UAI group, respectively). Both groups’ menus contained more fat than what is recommended in the Estonian nutrition guidelines [26]. In the UAD and UAI groups, 38% and 37.3% of daily energy consumption came from fat, respectively. Notably, there was an increase in the intake of saturated fatty acids, which contributed to 13% of daily energy intake in the UAD group and 11% in the UAI group. At the same time, fruit and vegetable consumption was low based on the food frequency questionnaire. After dividing participants into two groups based on changes in UA levels due to HPect smoothie consumption, we assessed the baseline UA levels of both groups and found no statistically significant differences (Figure 1A). The UA values during the baseline period of all participants remained below the recommended maximum of the reference, i.e., below 339 μmol/L [27]. Both groups had a similar median BMI corresponding to normal weight (21.9 in the UAD and 22 in the UAI, respectively).

Table 1.
Baseline period: daily energy and macronutrient intake.

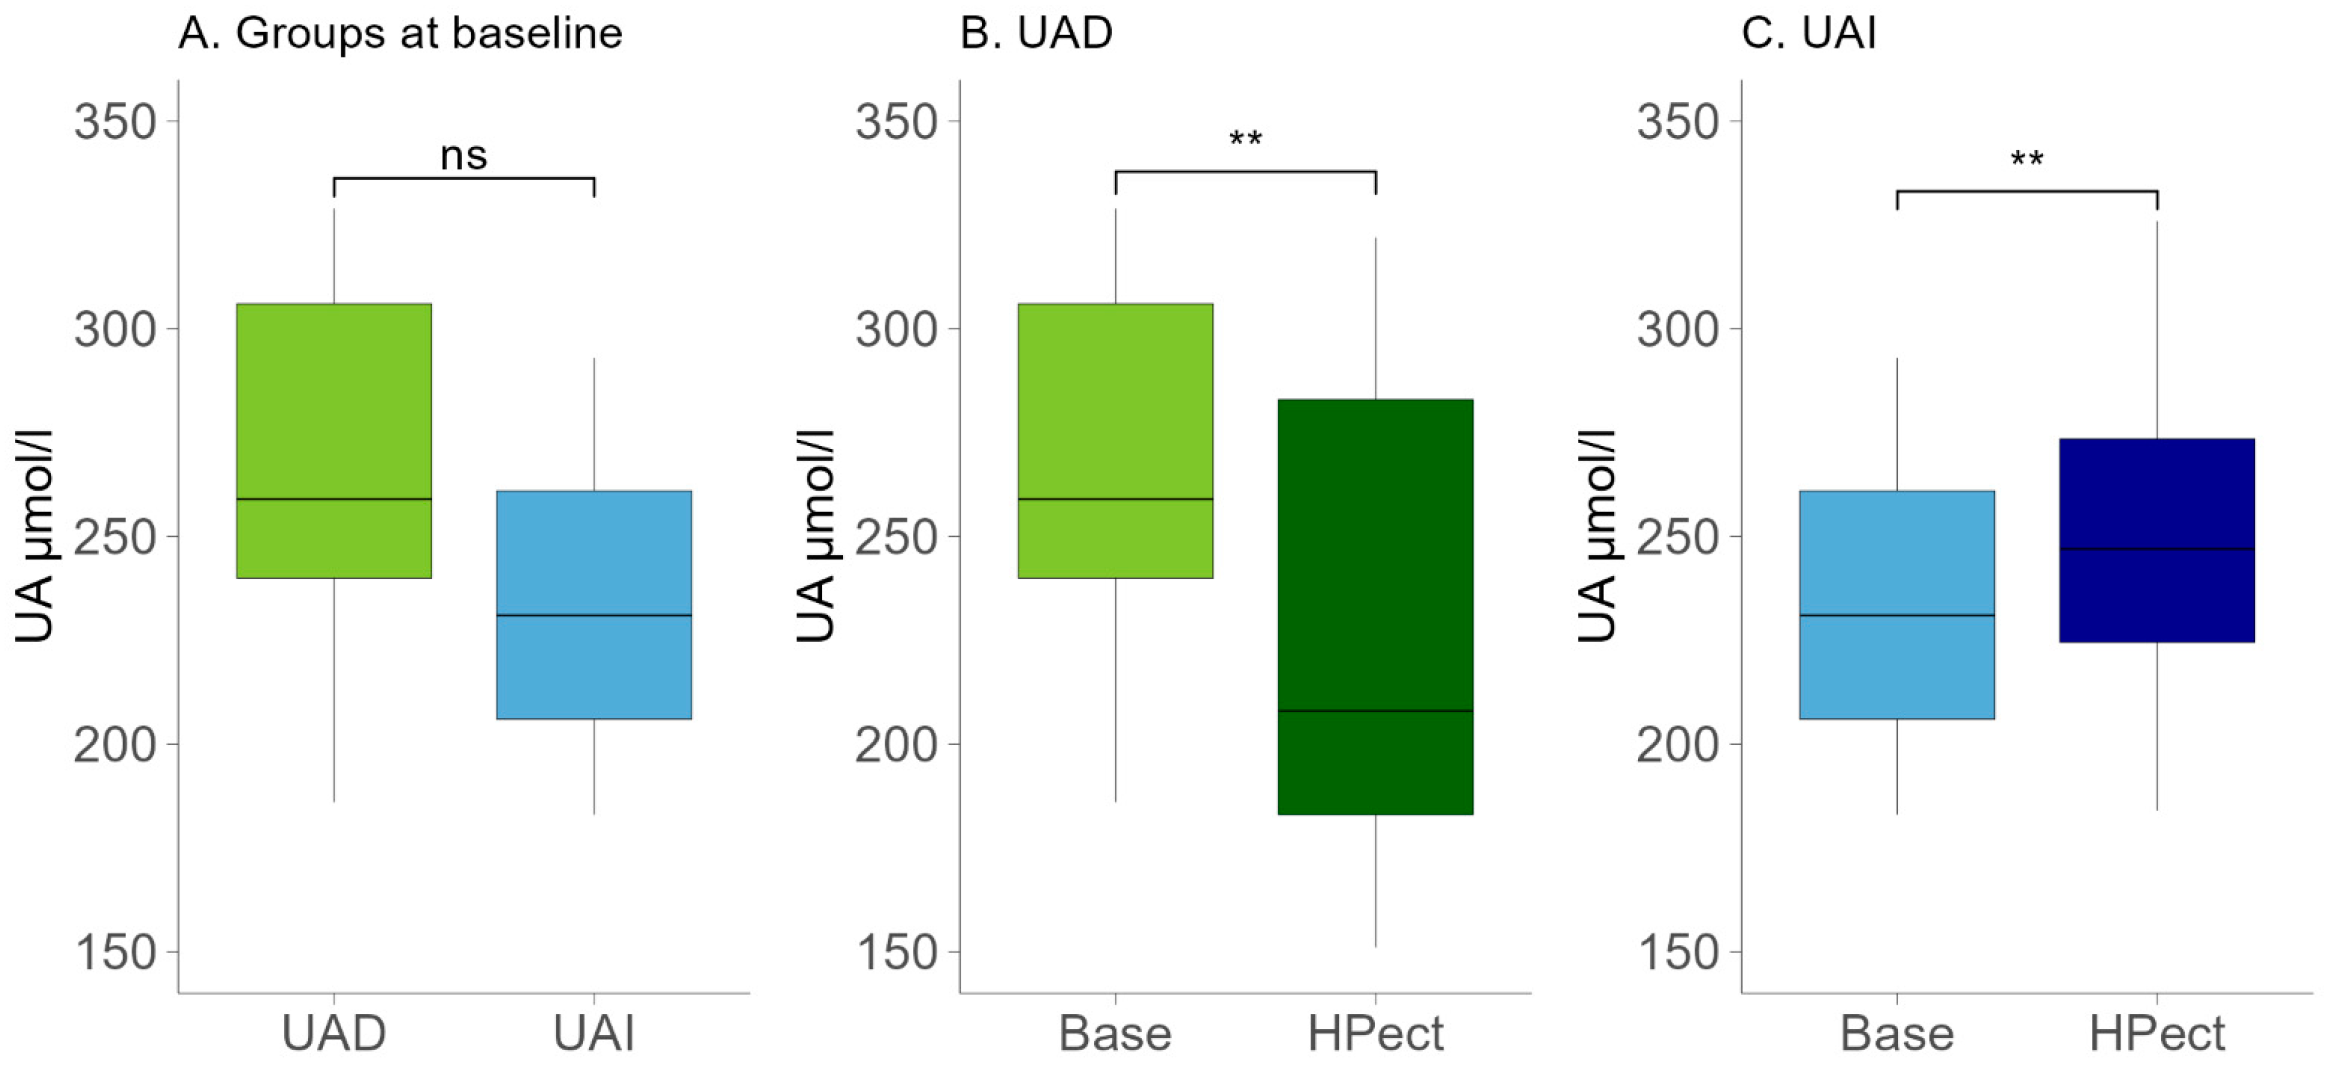
Figure 1.
(A) Baseline UA levels in the UAD (n = 13) and UAI (n = 15) groups. The Wilcoxon rank-sum test was performed. The p-value was 0.09; ns—statistically not significant. (B) Changes in UA levels after HPect intake in the UAD group. The Wilcoxon signed-rank test was performed. p-value ** < 0.01. (C) Changes in UA levels after HPect intake in the UAI group. The Wilcoxon signed-rank test was performed. p-value ** < 0.01.
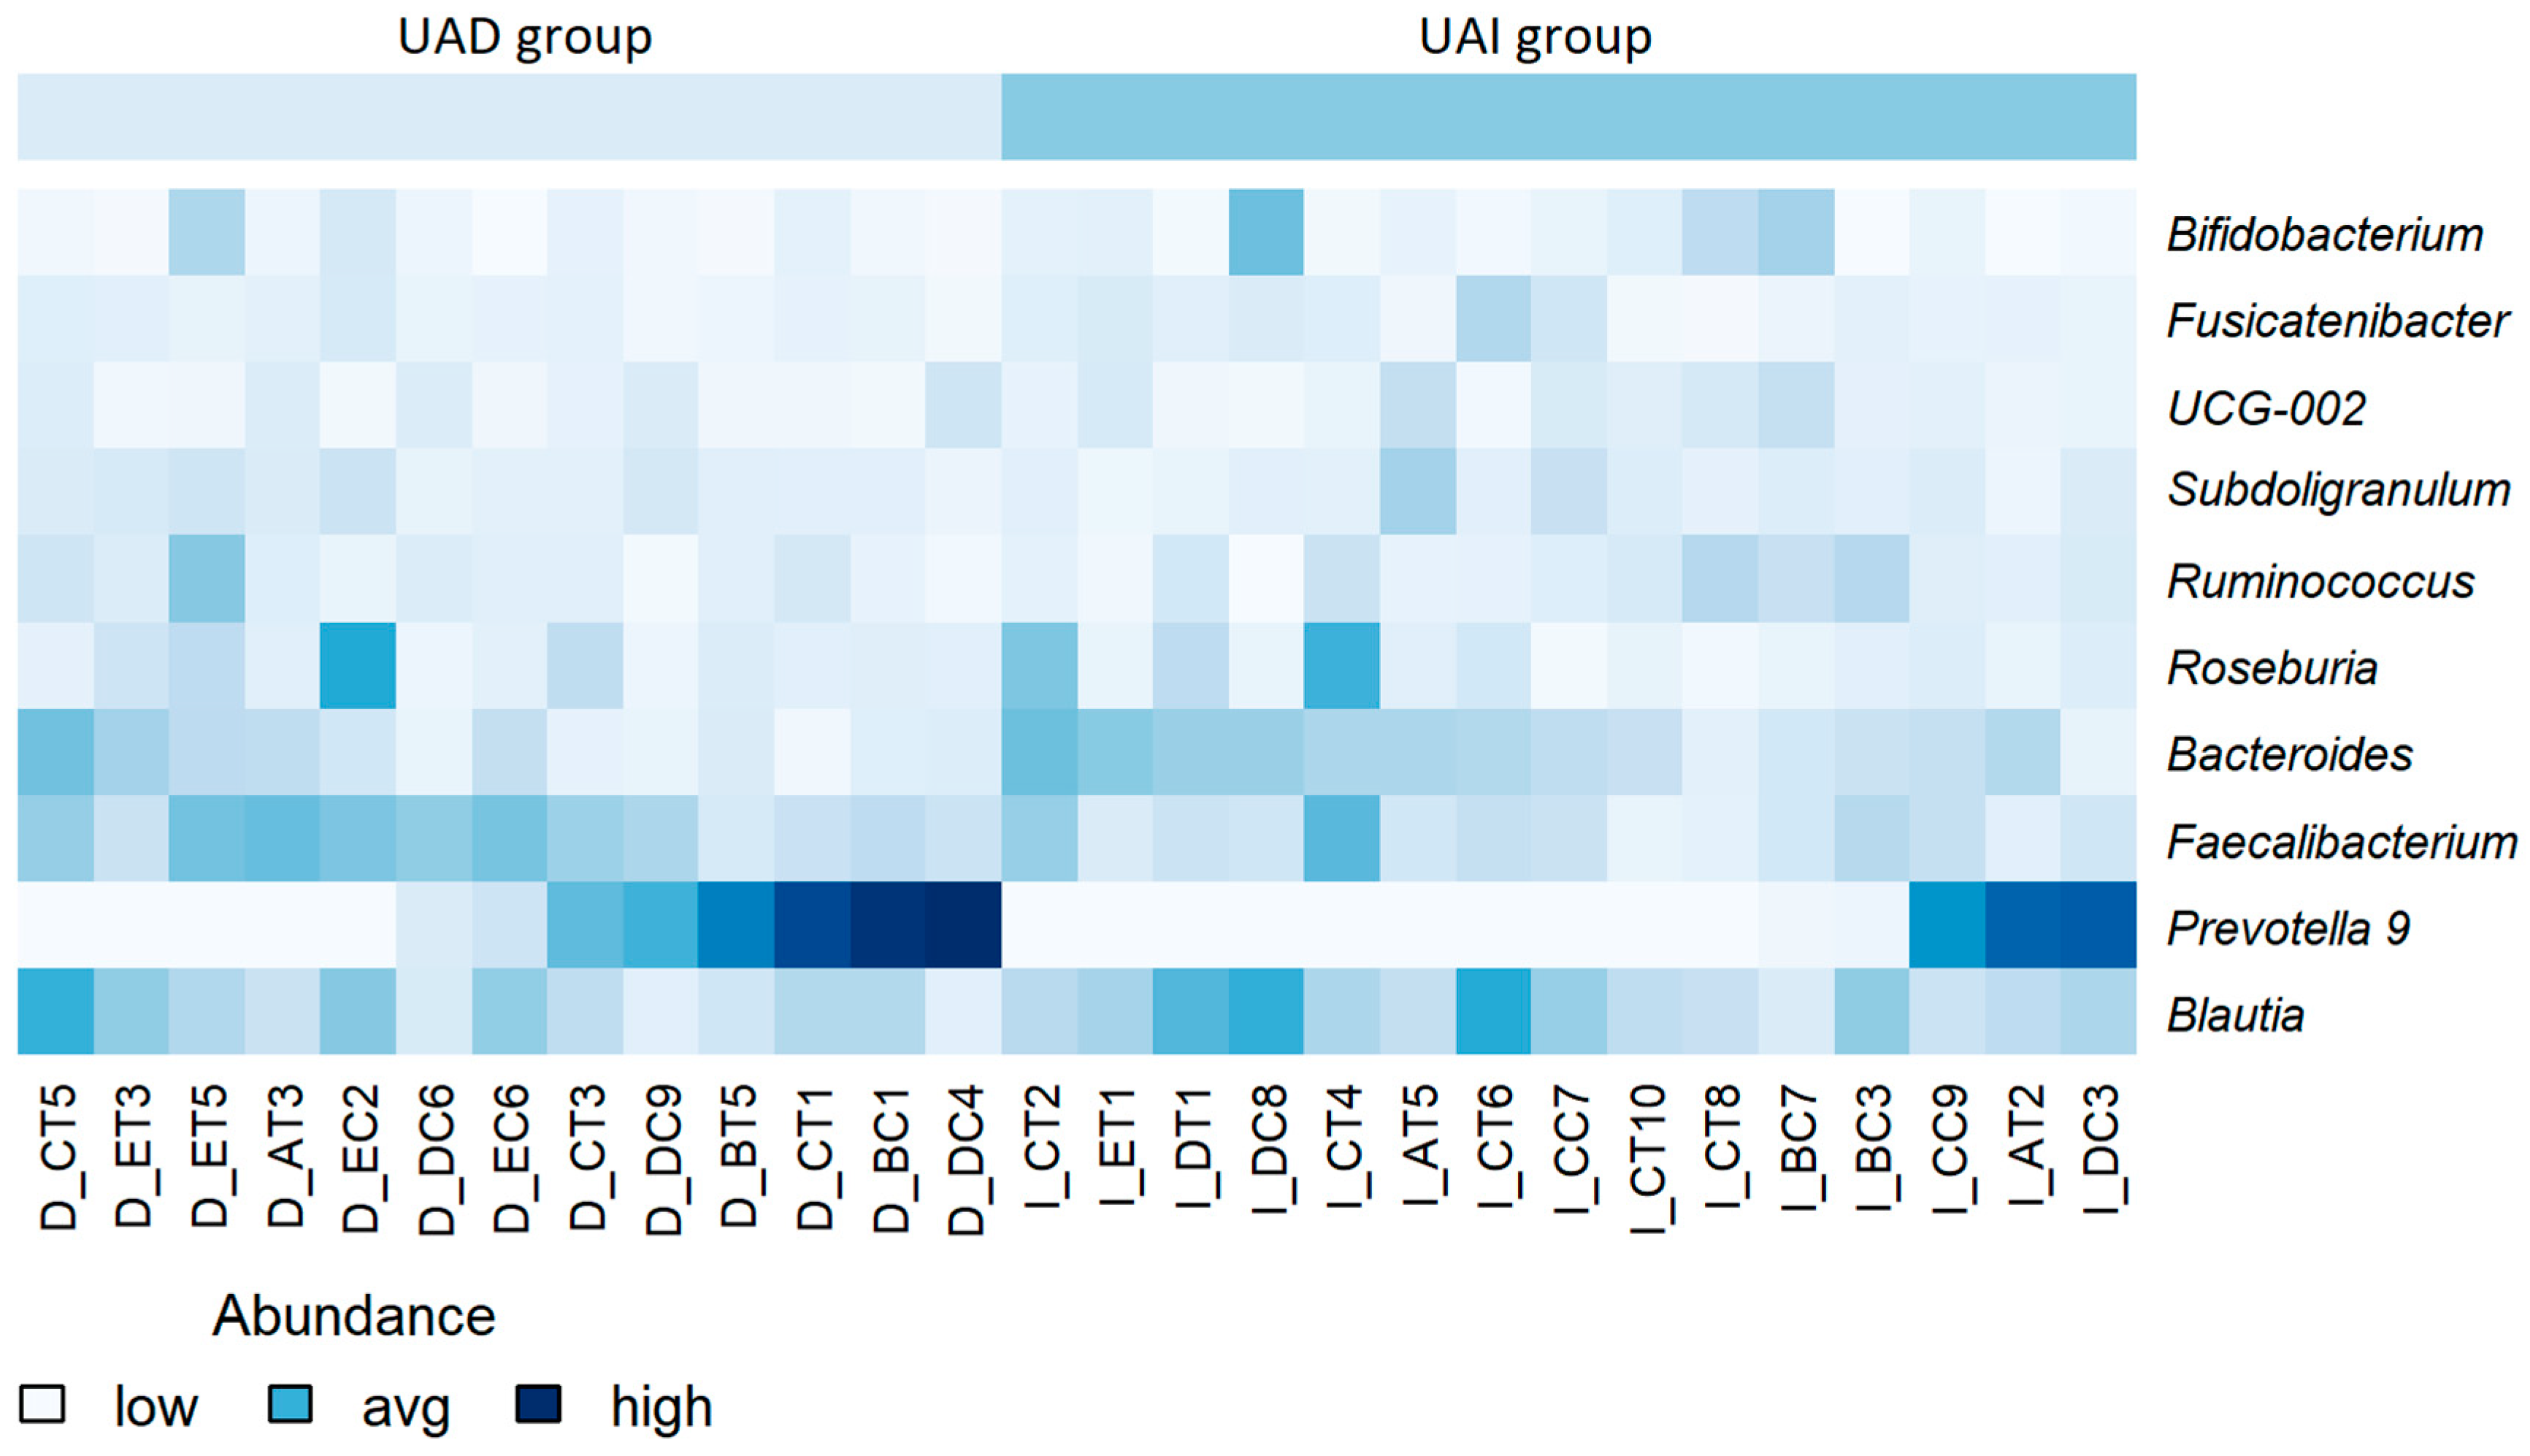
Next, we compared the gut microbiota of both groups at the beginning of the study and found quite similar compositions at the genus level. The results are comparable to our previous study [22]. At the same time, a significantly decreased abundance of Faecalibacterium and Anaerosporobacter and an increased abundance of Prevotella and Lactococcus were found in the UAI group compared to the UAD group (p < 0.01, respectively) (Figure 2A). Since the abundance of Bacteroides and Prevotella may be related to purine metabolism and UA levels [28], we investigated the proportion of these bacteria and their response to smoothie consumption in our study subjects. During the baseline period, 54% of participants in the UAD group exhibited higher levels of Prevotella 9 compared to Bacteroides, while only 20% of participants in the UAI group showed this trend (Figure 3).
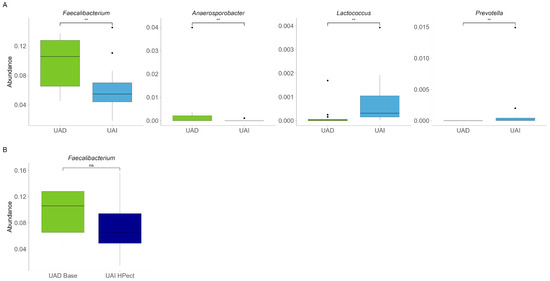
Figure 2.
(A) Baseline relative abundance of four bacterial genera with statistically significant differences between UAD (n = 13, green) and UAI (n = 15, blue) groups. The Wilcoxon rank-sum test was used, and outliers were shown. ** The p-values were 0.0083, 0.0066, 0.0023, 0.0096, respectively. (B) Abundance of Faecalibacterium in the UAD group during the baseline period and in the UAI group after HPect consumption. The Wilcoxon rank-sum test was performed, and outliers were shown. The p-value was 0.16; ns—statistically not significant.
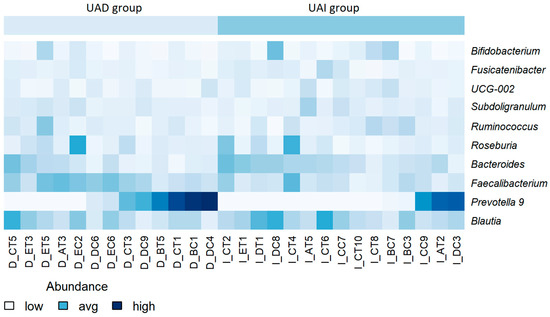
Figure 3.
Heatmap of the relative abundance of bacterial genera at baseline, stratified by participant. Lower abundance levels are depicted in light blue or white, while higher levels are shown in dark blue. No scaling has been applied. Participant identifiers are located along the horizontal axis.
3.2. The High-Pectin Smoothie Affects Uric Acid Levels and Gut Microbiota Differently in the UAI and UAD Groups
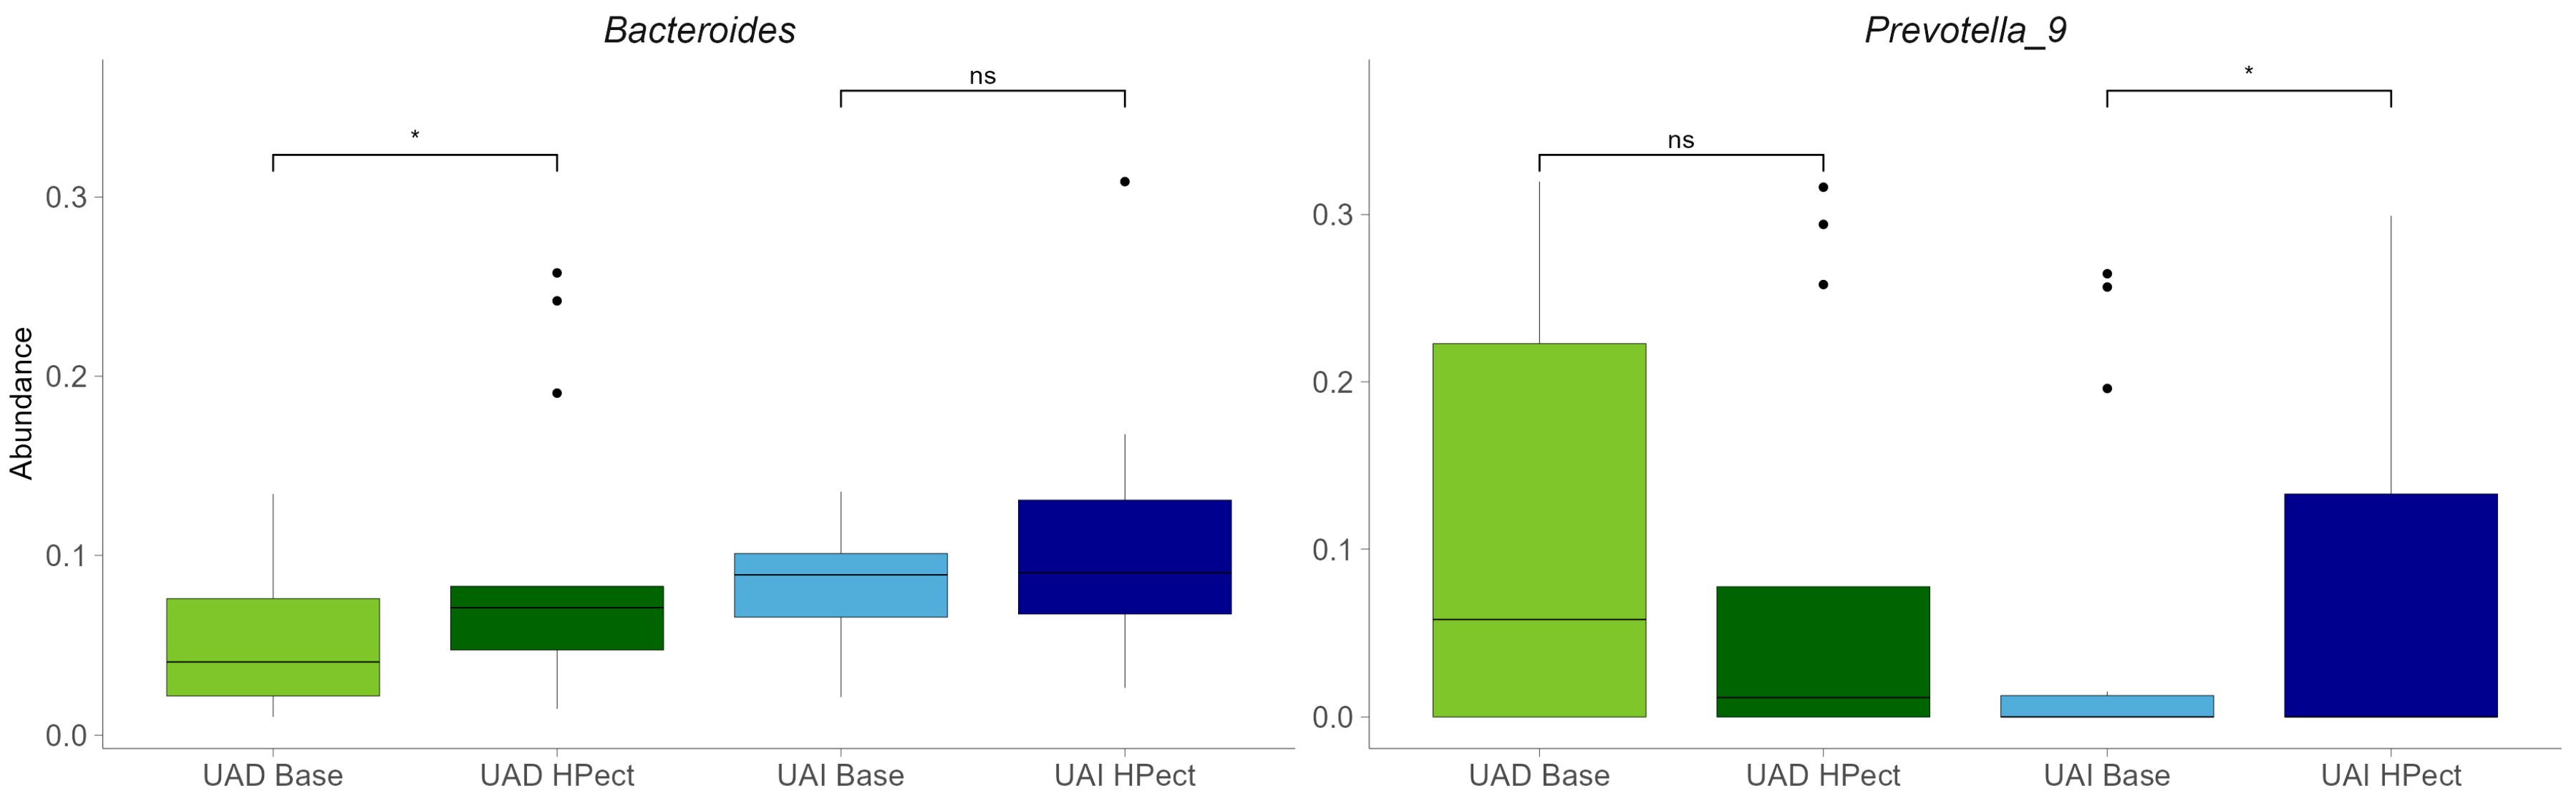
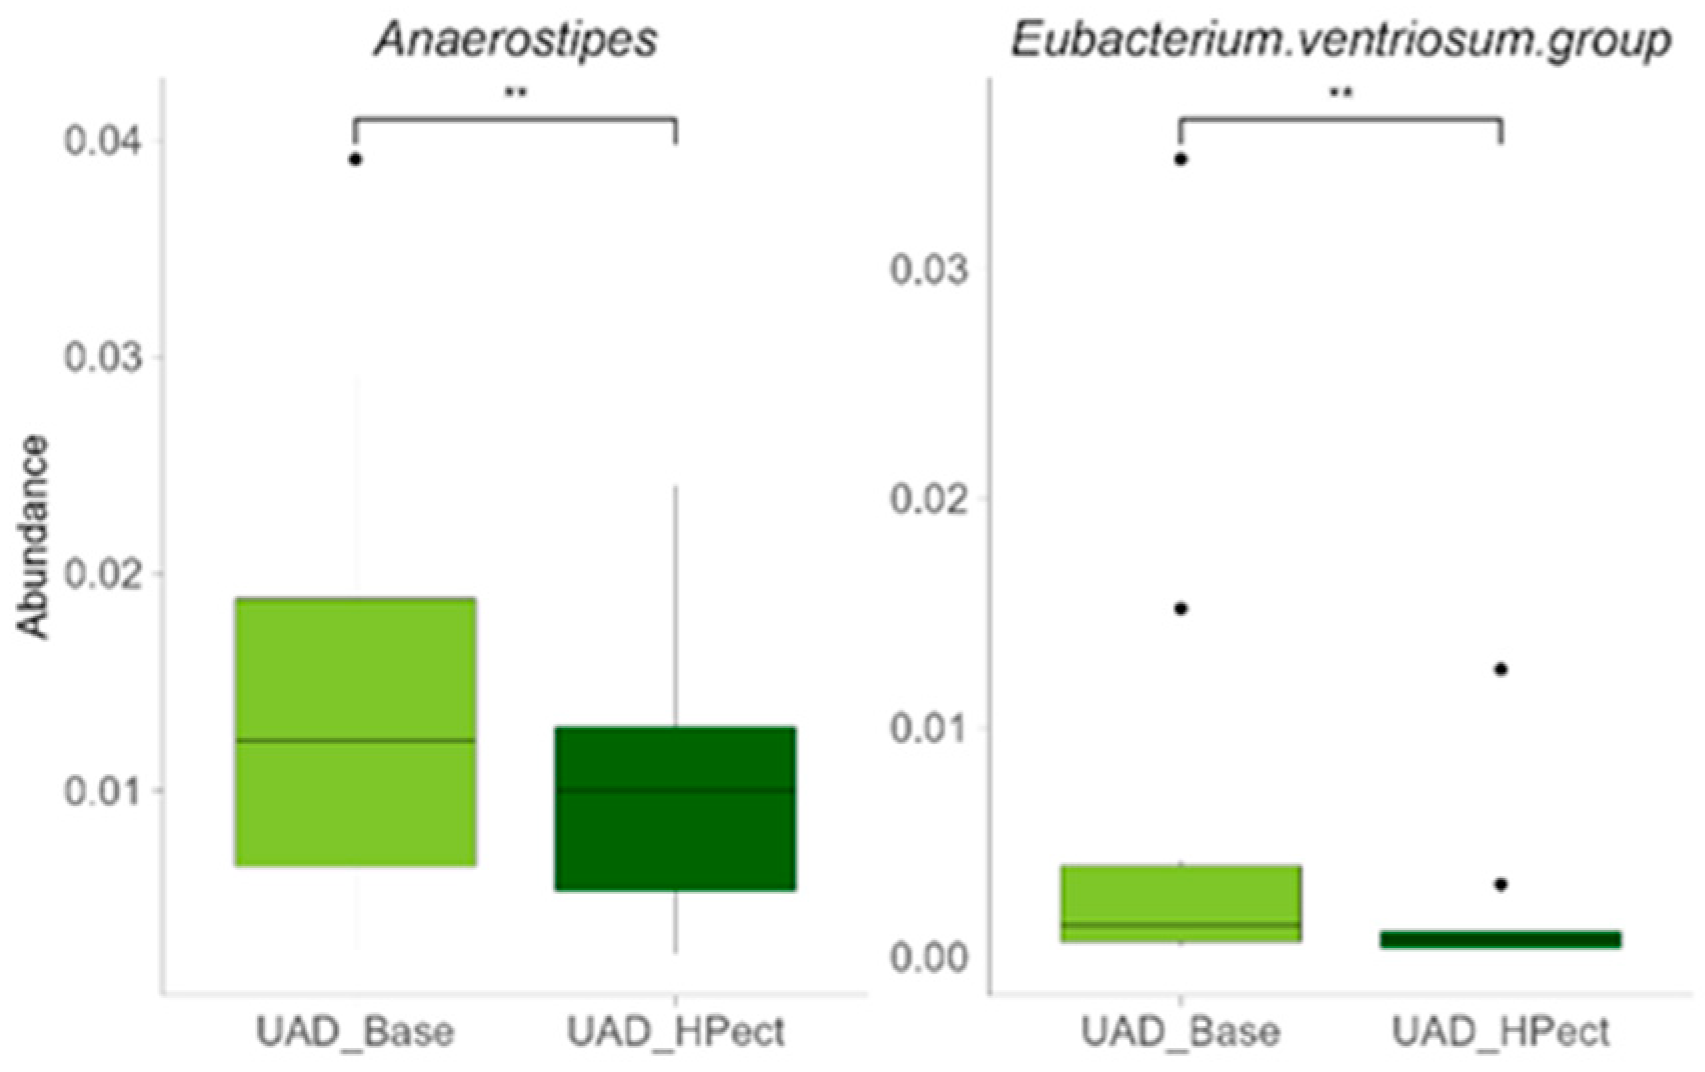
Compared to the baseline period, HPect smoothie consumption significantly decreased the UA level in the UAD group (264.4 µmol/L vs. 227.9 µmol/L) and increased it in the UAI group (234.1 µmol/L vs. 249.5 µmol/L) (Figure 1B and C, respectively). At the same time, consumption of the HPect smoothie led to a small but significant increase in the abundance of Bacteroides in UAD and Prevotella 9 in the UAI group (Figure 4). Furthermore, in the UAI group, after consuming the HPect smoothie, the levels of the Ruminococcus torques group, Fusicatenibacterium, and Butyricimonas decreased, while Sutterella and Paraprevotella increased (p-values < 0.01, Figure 5). In addition, in the UAD group, the levels of Anaerostipes and the Eubacterium ventriosum group decreased (Figure 6). Interestingly, in the UAI group, the level of Faecalibacterium increased after consuming HPect smoothie to such an extent that no significant difference was observed compared to the base period of the UAD group (Figure 2B).
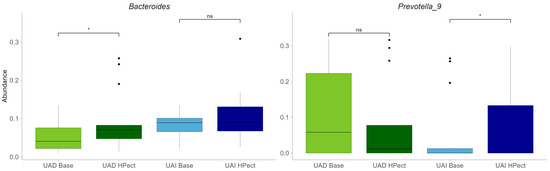
Figure 4.
Relative abundances of Bacteroides and Prevotella 9 in UAD and UAI groups before and after HPect consumption. The Wilcoxon signed-rank test was performed, and outliers were shown. * The p-values were 0.027, 0.12, 0.34, and 0.036, respectively. ns—statistically not significant.
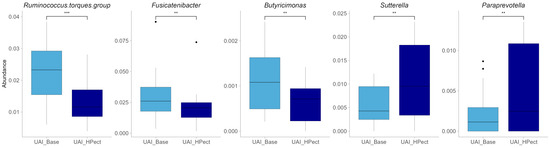
Figure 5.
Relative abundance of bacterial genera after HPect consumption in the UAI group. The Wilcoxon signed-rank test was performed, and outliers were shown. *** The p-value was 0.00043. ** The p-values were 0.0084, 0.0067, 0.0021, and 0.008, respectively.

Figure 6.
Relative abundance of bacterial genera after HPect intake in the UAD group. The Wilcoxon signed-rank test was performed, and outliers were shown. ** The p-values were 0.0061 and 0.0034, respectively.
4. Discussion
An important finding of the study was that otherwise healthy women with initially similar uric acid (UA) levels experienced both increases (UAI group) and decreases (UAD group) in UA levels after consuming a pectin-enriched (HPect) smoothie.
Existing evidence underscores the importance of considering both sex and age in research on hyperuricemia [29]. Our study focused on women under 50 to explore the relationship between dietary changes, gut microbiota, and UA levels, considering the differences in reference values between genders and the limited research on women’s health in relation to UA.
UA levels naturally increase with age, likely due to hormonal changes [30]. In healthy premenopausal women, UA levels vary throughout the menstrual cycle, with the lowest levels occurring during the luteal phase [31]. Although the average age in the UAI group was significantly higher than that of the UAD group, there were no statistically significant differences in baseline UA levels. In addition, since all participants were under 50, any potential effects of age differences were unlikely to have a dominant influence.
In addition to age, various factors affect UA levels, among which diet plays an important role [14,32,33]. Evidence from the meta-analysis indicated that intake of red meat, seafood, fructose, and alcohol may increase hyperuricemia, while consumption of dairy products or soy foods may decrease the risk of hyperuricemia [32]. Although participants’ dietary habits were not entirely consistent with national recommendations, no significant differences were observed between groups, and participants’ diets at baseline and during the study period did not change enough to explain the bidirectional changes in UA levels.
As the proportion of sugars in our diet has significantly increased, it is crucial to monitor fructose intake to prevent an increase in UA levels, especially considering the evidence surrounding fructose metabolism [33,34]. The fructose consumption of the study participants was relatively moderate, being less than 5% of their daily energy. However, it can be presumed that incorporating fructose-rich foods, such as smoothies, into the diet may affect UA levels, especially as we age. At the same time, a systematic review and meta-analysis of controlled feeding trials showed a decreasing effect of 100% fruit juice on UA levels in contrast to sugar-sweetened beverages, which increased UA [35]. According to dietary recommendations, fructose does not cause hyperuricemia if it comes from foods that are also rich in fiber, vitamins, and antioxidants, such as vegetables, fruits, berries, and whole grains, which, for example, are typical of the Mediterranean diet [36]. The average fiber intake of our study participants at baseline was slightly less than the recommended 25 g per day, and the dietary fiber came mainly from whole grain products, while a very small amount came from fruits and vegetables. As both groups had similar diets in terms of macronutrient composition throughout the study, the changes in UA levels associated with the consumption of the HPect smoothie may be more closely related to the effect of the specific fiber, individual variations in fiber intake, and the baseline composition of gut microbiota. Since the study included participants with modest vegetable and fruit consumption, as shown in their food diaries, the regular intake of a fruit-based pectin-rich smoothie introduced a type of fiber that was usually lacking in their diets and similarly increased overall fiber intake, normalizing daily requirements in both groups.
Several studies have demonstrated that different types of fibers uniquely impact gut microbiota and UA levels, and distinct gut microbiota among individuals with varying serum UA levels have been found [37,38,39,40]. It is important to note that while fiber can influence the gut microbiota, these effects are specific to individual bacterial strains and species [40]. During the baseline period, the UAD group showed a higher proportion of Prevotella 9 compared to the UAI group, whereas the opposite was observed for Bacteroides. Consuming the HPect smoothie led to a cross-reactive increase in Prevotella 9 in the UAI group and Bacteroides in the UAD group, with no opposing effects. It has been suggested that the levels of Bacteroides and Prevotella might be associated with purine metabolism and UA levels, linking gut microbiota as an effector of UA metabolism [28]. Notably, Prevotella and Bacteroides are primary consumers of pectin and are likely to gain comparable benefits from a HPect smoothie [41]. In addition, the prevalence of uric acid-affecting bacteria may vary by specific population. For instance, a study of Asians found that the genus Collinsella, which is abundant in their gut microbiota, and Dorea are strongly linked to hyperuricaemia, while low UA levels are associated with Faecalibacterium and Ruminococcus [6]. It has also been revealed that structurally different types of pectins can control different bacterial populations, including Faecalibacterium prausnitzii, Ruminococcus, Sutterella, Prevotella copri, and Bacteroides spp. [40,41,42]. These previous findings may, at least partially, explain the results of our study. Likewise, HPect smoothie consumption-associated variation in UA levels within both groups may be related to changes in the Prevotella-to-Bacteroides ratio. Thus, a lower Prevotella-to-Bacteroides ratio has been shown in asymptomatic hyperuricemia [28]. Moreover, it has been previously mentioned that non-dietary factors could influence the distribution of gut Prevotella species [43]. Furthermore, the differences in baseline-period microbiota between groups may suggest a more significant initial imbalance in the UAI group, characterized by a decreased abundance of Faecalibacterium and Anaerosporobacter and an increased abundance of Prevotella. Certain species of Prevotella have been found to possess varying properties, and some strains may be linked to chronic inflammation [44]. A correlation between inflammatory conditions and low levels of Faecalibacterium has also been previously shown [45]. Despite Anaerosporobacter not being extensively studied, its abundance difference between the groups could be associated with a high-fat diet and aging, as shown by a negative correlation in a murine model [46]. Our study indicates that consuming the HPect smoothie increases Faecalibacterium levels among the UAI group. Although the UAI group participants deviated somewhat from the recommended eating pattern, they remained normouremic, even after increased UA levels, following HPect smoothie consumption. Therefore, we cannot definitively state whether the intervention and the bidirectional changes in UA levels affected their well-being. We can only speculate that a certain increase in UA, if accompanied by positive changes in the microbiota, may prove to be a balancing factor for the functioning of the microbiota.
As for health indicators, several women’s health problems are associated with UA and can occur even at lower UA levels, while the threshold at which UA levels become abnormal is still controversial. Thus, it is shown that the risk of developing hypertension starts at uricemia levels of 214 μmol/L, which, according to the paper’s authors, is lower than the conventional hyperuricemia threshold of 404 μmol/L [47]. A significant association between cardiovascular disease and diabetes has also been shown with mean UA levels below the definition of hyperuricemia [29]. Furthermore, a high-normal or elevated serum UA level may be linked to a higher risk of arterial stiffness in healthy women [5]. Given this information, investigating the relationship between diet, microbiota, and UA levels may be useful in clinical practice, especially when correlating these parameters with cardiometabolic and hormonal indicators.
In conclusion, our findings suggest that increasing the variety of fibers available in the diet and incorporating specific types of fibers may help promote a more balanced microbiota in otherwise healthy women. For instance, as shown in our study, Faecalibacterium levels in the UAI group increased after consumption of the HPect smoothie, ultimately eliminating the baseline difference observed between the UAI and UAD groups.
However, the study is limited by the relatively short-term duration and small number of participants, making the results more vulnerable to individual variations. Additionally, the results may be influenced by seasonal variations in diet, so they cannot be significantly generalized. The use of hormone parameters could have provided additional insight, considering their effect on UA. Accordingly, for better generalization and application in clinical practice, future research on microbiota should more systematically evaluate the effects of fiber on UA levels, considering women’s age and hormonal status.
In summary, the unclear threshold for uric acid (UA) levels that may pose health risks highlights the need to explore factors that influence these levels, such as the effects of different types of fiber on gut microbiota or women’s hormonal status. Understanding these factors will help us better manage and improve future health outcomes.
Author Contributions
Conception and design of the study (K.E.-A. and S.P.), investigation (K.E.-A. and S.P.), data preparation (S.P.), data analysis and interpretation (K.E.-A., S.P. and J.K.), writing and critical revision of the manuscript (K.E.-A., S.P. and J.K.). All authors have read and agreed to the published version of the manuscript.
Funding
This study was supported by the European Agricultural Fund for Rural Development (EAFRD) and the Estonian Rural Development Plan (ERDP) for 2014–2020, measure 16.2, and by The Republic of Estonia Agricultural Registers and Information Board (ARIB), project number 616219790087. This study was partly funded by the inter-sectorial mobility grant no 2021-2027.1.01.23-0352 provided by the Estonian State Shared Service Centre and co-funded by the European Union.
Institutional Review Board Statement
The local ethics committee approved the study (Research Ethics Committee of the National Institute for Health Development, Reference number 1065, issued on 25 April 2022. The participants were informed about all the procedures and purposes of the study. Signed written consent was obtained from all subjects involved in the study.
Informed Consent Statement
All participants signed written informed consent forms before the start of the study.
Data Availability Statement
The data presented in this study are available on the SRA database: https://www.ncbi.nlm.nih.gov/bioproject/PRJNA981491 (accessed on 10 March 2025).
Acknowledgments
The authors express their gratitude to Aili Kallastu, Anne Meikas, and Esther Malv for their assistance with fecal sample preparation and sequencing, to Margit Paukson for conducting the bioinformatic analyses, and to Rain Kuldjärv for serving as the project coordinator.
Conflicts of Interest
The authors declare that they have no known competing financial interests or personal relationships that could have appeared to have influenced the work reported in this paper.
References
- Demarquoy, J.; Dehmej, O. Reassessing Gout Management through the Lens of Gut Microbiota. Appl. Microbiol. 2024, 4, 824–838. [Google Scholar] [CrossRef]
- Kuhns, V.L.H.; Woodward, O.M. Sex Differences in Urate Handling. Int. J. Mol. Sci. 2020, 21, 4269. [Google Scholar] [CrossRef] [PubMed]
- Bardin, T.; Richette, P. Definition of hyperuricemia and gouty conditions. Curr. Opin. Rheumatol. 2014, 26, 186–191. [Google Scholar] [CrossRef]
- Zuo, T.; Liu, X.; Jiang, L.; Mao, S.; Yin, X.; Guo, L. Hyperuricemia and coronary heart disease mortality: A meta-analysis of prospective cohort studies. BMC Cardiovasc. Disord. 2016, 16, 207. [Google Scholar] [CrossRef] [PubMed]
- Fang, J.I.; Wu, J.S.; Yang, Y.C.; Wang, R.H.; Lu, F.H.; Chang, C.J. High uric acid level associated with increased arterial stiffness in apparently healthy women. Atherosclerosis 2014, 236, 389–393. [Google Scholar] [CrossRef]
- Miyajima, Y.; Karashima, S.; Mizoguchi, R.; Kawakami, M.; Ogura, K.; Ogai, K.; Koshida, A.; Ikagawa, Y.; Ami, Y.; Zhu, Q.; et al. Prediction and causal inference of hyperuricemia using gut microbiota. Sci. Rep. 2024, 14, 9901. [Google Scholar] [CrossRef]
- Mao, T.; He, Q.; Yang, J.; Jia, L.; Xu, G. Relationship between gout, hyperuricemia, and obesity—Does central obesity play a significant role?—A study based on the NHANES database. Diabetol. Metab. Syndr. 2024, 16, 24. [Google Scholar] [CrossRef]
- Kurajoh, M.; Fukumoto, S.; Yoshida, S.; Akari, S.; Murase, T.; Nakamura, T.; Ishii, H.; Yoshida, H.; Nagata, Y.; Morioka, T.; et al. Uric acid shown to contribute to increased oxidative stress level independent of xanthine oxidoreductase activity in MedCity21 health examination registry. Sci. Rep. 2021, 11, 7378. [Google Scholar] [CrossRef]
- Yamada, N.; Iwamoto, C.; Kano, H.; Yamaoka, N.; Fukuuchi, T.; Kaneko, K.; Asami, Y. Evaluation of purine utilization by Lactobacillus gasseri strains with potential to decrease the absorption of food-derived purines in the human intestine. Nucleosides Nucleotides Nucleic Acids 2016, 35, 670–676. [Google Scholar] [CrossRef]
- Martínez-Nava, G.A.; Méndez-Salazar, E.O.; Vázquez-Mellado, J.; Zamudio-Cuevas, Y.; Francisco-Balderas, A.; Martínez-Flores, K.; Fernández-Torres, J.; Lozada-Pérez, C.; Guido-Gómora, D.L.; Martínez-Gómez, L.E.; et al. The impact of short-chain fatty acid–producing bacteria of the gut microbiota in hyperuricemia and gout diagnosis. Clin. Rheumatol. 2023, 42, 203–214. [Google Scholar] [CrossRef]
- Gullón, B.; Gómez, B.; Martínez-Sabajanes, M.; Yáñez, R.; Parajó, J.C.; Alonso, J.L. Pectic oligosaccharides: Manufacture and functional properties. Trends Food Sci. Technol. 2013, 30, 153–161. [Google Scholar] [CrossRef]
- Blanco-Pérez, F.; Steigerwald, H.; Schülke, S.; Vieths, S.; Toda, M.; Scheurer, S. The Dietary Fiber Pectin: Health Benefits and Potential for the Treatment of Allergies by Modulation of Gut Microbiota. Curr. Allergy Asthma Rep. 2021, 21, 43. [Google Scholar] [CrossRef]
- Rodríguez, J.M.; Garranzo, M.; Segura, J.; Orgaz, B.; Arroyo, R.; Alba, C.; Beltrán, D.; Fernández, L. A randomized pilot trial assessing the reduction of gout episodes in hyperuricemic patients by oral administration of Ligilactobacillus salivarius CECT 30632, a strain with the ability to degrade purines. Front. Microbiol. 2023, 14, 1111652. [Google Scholar] [CrossRef]
- Yin, H.; Liu, N.; Chen, J. The Role of the Intestine in the Development of Hyperuricemia. Front. Immunol. 2022, 13, 845684. [Google Scholar] [CrossRef] [PubMed]
- Zhang, Y.; Chen, S.; Yuan, M.; Xu, Y.; Xu, H. Gout and Diet: A Comprehensive Review of Mechanisms and Management. Nutrients 2022, 14, 3525. [Google Scholar] [CrossRef]
- Lim, M.Y.; Rho, M.; Song, Y.; Lee, K.; Sung, J.; Ko, G. Stability of Gut Enterotypes in Korean Monozygotic Twins and Their Association with Biomarkers and Diet. Sci. Rep. 2014, 4, 7348. [Google Scholar] [CrossRef] [PubMed]
- Chu, Y.; Sun, S.; Huang, Y.; Gao, Q.; Xie, X.; Wang, P.; Li, J.; Liang, L.; He, X.; Jiang, Y.; et al. Metagenomic analysis revealed the potential role of gut microbiome in gout. npj Biofilms Microbiomes 2021, 7, 66. [Google Scholar] [CrossRef] [PubMed]
- Valeri, F.; Endres, K. How biological sex of the host shapes its gut microbiota. Front. Neuroendocrinol. 2021, 61, 100912. [Google Scholar] [CrossRef]
- Beisner, J.; Gonzalez-granda, A.; Basrai, M.; Damms-machado, A. Fructose-Induced Intestinal Microbiota Shift Following Two Types of Short-Term High-Fructose Dietary Phases. Nutrients 2020, 12, 3444. [Google Scholar] [CrossRef]
- Wang, Z.; Li, Y.; Liao, W.; Huang, J. Gut microbiota remodeling: A promising therapeutic strategy to confront hyperuricemia and gout. Front. Cell. Infect. Microbiol. 2022, 12, 935723. [Google Scholar] [CrossRef]
- Juraschek, S.P.; Yokose, C.; McCormick, N.; Miller, E.R.; Appel, L.J.; Choi, H.K. Effects of Dietary Patterns on Serum Urate: Results from a Randomized Trial of the Effects of Diet on Hypertension. Arthritis Rheumatol. 2021, 73, 1014–1020. [Google Scholar] [CrossRef] [PubMed]
- Pihelgas, S.; Ehala-Aleksejev, K.; Kuldjärv, R.; Jõeleht, A.; Kazantseva, J.; Adamberg, K. Short-term pectin-enriched smoothie consumption has beneficial effects on the gut microbiota of low-fiber consumers. FEMS Microbes 2024, 5, xtae001. [Google Scholar] [CrossRef]
- Beukema, M.; Faas, M.M.; de Vos, P. The effects of different dietary fiber pectin structures on the gastrointestinal immune barrier: Impact via gut microbiota and direct effects on immune cells. Exp. Mol. Med. 2020, 52, 1364–1376. [Google Scholar] [CrossRef]
- Kazantseva, J.; Malv, E.; Kaleda, A.; Kallastu, A.; Meikas, A. Optimisation of sample storage and DNA extraction for human gut microbiota studies. BMC Microbiol. 2021, 21, 158. [Google Scholar] [CrossRef]
- McDonald, J.E.; Larsen, N.; Pennington, A.; Connolly, J.; Wallis, C.; Rooks, D.J.; Hall, N.; McCarthy, A.J.; Allison, H.E. Characterising the canine oral microbiome by direct sequencing of reverse-transcribed rRNA molecules. PLoS ONE 2016, 11, e0157046. [Google Scholar] [CrossRef]
- Pitsi, T.; Zilmer, M.; Vaask, S.; Ehala-Aleksejev, K.; Kuu, S.; Lõhmus, K.; Nurk, E.; Al, E. Eesti Toitumis-ja Liikumissoovitused 2015; Tervise Arengu Instituut: Tallinn, Estonia, 2017. [Google Scholar]
- Kallion, K. Ühendlabori Analüüside Käsiraamat IV: Tartu, Estonia, 2012. Available online: https://www.kliinikum.ee/yhendlabor/kasiraamat/ (accessed on 1 May 2023).
- Kim, H.W.; Yoon, E.J.; Jeong, S.H.; Park, M.C. Distinct Gut Microbiota in Patients with Asymptomatic Hyperuricemia: A Potential Protector against Gout Development. Yonsei Med. J. 2022, 63, 241–251. [Google Scholar] [CrossRef] [PubMed]
- Engel, B.; Hoffmann, F.; Freitag, M.H.; Jacobs, H. Should we be more aware of gender aspects in hyperuricemia? Analysis of the population-based German health interview and examination survey for adults (DEGS1). Maturitas 2021, 153, 33–40. [Google Scholar] [CrossRef] [PubMed]
- Zi, E.; Fisc, A.; Karl, L.; Hans, C.; Nage, G. Sex- and age-specific variations, temporal trends and metabolic determinants of serum uric acid concentrations in a large population-based Austrian cohort. Sci. Rep. 2020, 10, 7578. [Google Scholar] [CrossRef]
- Mumford, S.L.; Dasharathy, S.S.; Pollack, A.Z.; Perkins, N.J.; Mattison, D.R.; Cole, S.R.; Wactawski-Wende, J.; Schisterman, E.F. Serum uric acid in relation to endogenous reproductive hormones during the menstrual cycle: Findings from the BioCycle study. Hum. Reprod. 2013, 28, 1853–1862. [Google Scholar] [CrossRef]
- Li, R.; Yu, K.; Li, C. Dietary factors and risk of gout and hyperuricemia: A meta-analysis and systematic review. Asia Pac. J. Clin. Nutr. 2018, 27, 1344–1356. [Google Scholar] [CrossRef]
- Johnson, R.J.; Lanaspa, M.A.; Sanchez-Lozada, L.G.; Tolan, D.; Nakagawa, T.; Ishimoto, T.; Andres-Hernando, A.; Rodriguez-Iturbe, B.; Stenvinkel, P. The fructose survival hypothesis for obesity. Philos. Trans. R. Soc. B Biol. Sci. 2023, 378, 20220230. [Google Scholar] [CrossRef] [PubMed]
- Tero-Vescan, A.; Ștefănescu, R.; Istrate, T.I.; Pușcaș, A. Fructose-induced hyperuricaemia–protection factor or oxidative stress promoter? Nat. Prod. Res. 2024, 39, 948–960. [Google Scholar] [CrossRef]
- Ayoub-Charette, S.; Chiavaroli, L.; Liu, Q.; Khan, T.A.; Zurbau, A.; Au-Yeung, F.; Cheung, A.; Ahmed, A.; Lee, D.; Choo, V.L.; et al. Different Food Sources of Fructose-Containing Sugars and Fasting Blood Uric Acid Levels: A Systematic Review and Meta-Analysis of Controlled Feeding Trials. J. Nutr. 2021, 151, 2409–2421. [Google Scholar] [CrossRef] [PubMed]
- Lubawy, M. High-Fructose Diet—Induced Hyperuricemia Accompanying Metabolic Syndrome—Mechanisms and Dietary Therapy Proposals. Int. J. Environ. Res. Public Health 2023, 20, 3596. [Google Scholar] [CrossRef] [PubMed]
- Koguchi, T.; Tadokoro, T. Beneficial Effect of Dietary Fiber on Hyperuricemia in Rats and Humans: A Review. Int. J. Vitam. Nutr. Res. 2019, 89, 89–108. [Google Scholar] [CrossRef]
- Koguchi, T.; Nakajima, H.; Koguchi, H.; Wada, M.; Yamamoto, Y.; Innami, S.; Maekawa, A.; Tadokoro, T. Suppressive Effect of Viscous Dietary Fiber on Elevations of Uric Acid in Serum and Urine Induced by Dietary RNA in Rats is Associated with Strength of Viscosity. Int. J. Vitam. Nutr. Res. 2003, 73, 369–376. [Google Scholar] [CrossRef]
- Liang, M.; Liu, J.; Chen, W.; He, Y.; Kahaer, M.; Li, R.; Tian, T.; Liu, Y.; Bai, B.; Cui, Y.; et al. Diagnostic model for predicting hyperuricemia based on alterations of the gut microbiome in individuals with different serum uric acid levels. Front. Endocrinol. 2022, 13, 925119. [Google Scholar] [CrossRef]
- Chung, W.S.F.; Walker, A.W.; Louis, P.; Parkhill, J.; Vermeiren, J.; Bosscher, D.; Duncan, S.H.; Flint, H.J. Modulation of the human gut microbiota by dietary fibres occurs at the species level. BMC Biol. 2016, 14, 3. [Google Scholar] [CrossRef]
- Larsen, N.; De Souza, C.B.; Krych, L.; Cahú, T.B.; Wiese, M.; Kot, W.; Hansen, K.M.; Blennow, A.; Venema, K.; Jespersen, L. Potential of pectins to beneficially modulate the gut microbiota depends on their structural properties. Front. Microbiol. 2019, 10, 223. [Google Scholar] [CrossRef]
- Pascale, N.; Gu, F.; Larsen, N.; Jespersen, L.; Respondek, F. The Potential of Pectins to Modulate the Human Gut Microbiota Evaluated by In Vitro Fermentation: A Systematic Review. Nutrients 2022, 14, 3629. [Google Scholar] [CrossRef]
- Yeoh, Y.K.; Sun, Y.; Ip, L.Y.T.; Wang, L.; Chan, F.K.L.; Miao, Y.; Ng, S.C. Prevotella species in the human gut is primarily comprised of Prevotella copri, Prevotella stercorea and related lineages. Sci. Rep. 2022, 12, 9055. [Google Scholar] [CrossRef] [PubMed]
- Larsen, J.M. The immune response to Prevotella bacteria in chronic inflammatory disease. Immunology 2017, 151, 363–374. [Google Scholar] [CrossRef]
- Martín, R.; Rios-Covian, D.; Huillet, E.; Auger, S.; Khazaal, S.; Bermúdez-Humarán, L.G.; Sokol, H.; Chatel, J.M.; Langella, P. Faecalibacterium: A bacterial genus with promising human health applications. FEMS Microbiol. Rev. 2023, 47, fuad039. [Google Scholar] [CrossRef] [PubMed]
- Takahashi, S.; Nakagawa, K.; Nagata, W.; Koizumi, A.; Ishizuka, T. A preliminary therapeutic study of the effects of molecular hydrogen on intestinal dysbiosis and small intestinal injury in high-fat diet-loaded senescence-accelerated mice. Nutrition 2024, 122, 112372. [Google Scholar] [CrossRef] [PubMed]
- Gaffo, A.L.; Jacobs, D.R.; Sijtsma, F.; Lewis, C.E.; Mikuls, T.R.; Saag, K.G. Serum urate association with hypertension in young adults: Analysis from the Coronary Artery Risk Development in Young Adults cohort. Ann. Rheum. Dis. 2013, 72, 1321–1327. [Google Scholar] [CrossRef]


Disclaimer/Publisher’s Note: The statements, opinions and data contained in all publications are solely those of the individual author(s) and contributor(s) and not of MDPI and/or the editor(s). MDPI and/or the editor(s) disclaim responsibility for any injury to people or property resulting from any ideas, methods, instructions or products referred to in the content. |
© 2025 by the authors. Licensee MDPI, Basel, Switzerland. This article is an open access article distributed under the terms and conditions of the Creative Commons Attribution (CC BY) license (https://creativecommons.org/licenses/by/4.0/).