Abstract
The hydration of phosphate ions, an essential component of many biological molecules, is studied using all-atom molecular dynamics (MD) simulation and quantum chemical methods. MD simulations are carried out by employing a mean-field polarizable water model. A good linear correlation between the self-diffusion coefficient and phosphate anion concentration is ascertained from the computed mean-square displacement (MSD) profiles. The HB dynamics of the hydration of the phosphate anion is evaluated from the time-dependent autocorrelation function CHB(t) and is determined to be slightly faster for the phosphate–anion system as compared to that of the water–water system at room temperature. The coordination number (CN) of the phosphate ion is found to be 15.9 at 298 K with 0.05 M phosphate ion concentration. The average CN is also calculated to be 15.6 for the same system by employing non-equilibrium MD simulation, namely, the well-tempered meta-dynamics method. A full geometry optimization of the PO43−·16H2O cluster is investigated at the ωB97X-D/aug-cc-pVTZ level of theory, and the hydration of the phosphate anion is observed to have both singly and doubly bonded anion–water hydrogen bonds and inter-water hydrogen bonds in a range between 0.169–0.201 nm and 0.192–0.215 nm, respectively. Modified Stokes–Einstein relation is used to calculate the conductivity of the phosphate ion and is found to be in good agreement with the experimentally observed value.
1. Introduction
Ion–water interaction is pivotal to many biophysical and biochemical reactivities at the developing stage. Water is unanimously recognized as the universal solvent and solely responsible for diverse chemical and complex biological processes [1,2]. During the process of ion dissolution, the hydrogen-bonded network of pure water is rearranged and attempts to capture the ion in the newly formed hydrogen-bonded network. The solvation of ions in water is dictated by various interactions, e.g., hydrogen bonding, van der Waals interaction, electrostatic interaction, etc. In the hydration process, solvent water forms a network surrounding the ions, commonly termed the hydration layer, sphere of hydration or hydration shell. Thus, the hydration of ions is controlled by the dynamic between the water–water and ion–water interactions. In the literature, the breaking and making of the water network, occurring at a picosecond (ps) time scale, have been attributed to water’s physical, chemical and structural properties [3,4,5,6,7]. Numerous experimental techniques, such as X-rays and neutron scattering, in addition to transient spectroscopy detecting in IR to THz frequency region and molecular dynamics (MD) simulations, have been used to depict the static and dynamic structural information of the solvation of ions in water [8,9,10,11,12,13,14,15,16,17,18]. These molecular-level studies have shown how crucial the hydration of ions is in imparting many biological and chemical functions. At the fundamental level, it is known that cations have a simple and rigid hydration structure in comparison to that of anions, as cations bind more strongly with the solvent molecules [1]. On the other hand, a more complex and flexible hydration structure for anions is observed due to the frequent exchange of water molecules among the solvation shells [1,17].
In recent times, the triply negatively charged phosphate anion (PO43−) is being considered for detailed investigation, given that it is an indispensable component of many solids, aerosols and electrolyte solutions. Moreover, phosphates are essential components of various biological polymers or molecules, such as DNA, RNA, AMP, ADP, ATP, etc. [18,19,20,21]. It is known that the phosphate anion does not exist in isolation, such as in the gas phase, due to Coulomb repulsion causing spontaneous electron loss. In nature, the existence of the PO43− anion requires bound water molecules where the ion–water interaction stabilizes against the spontaneous loss of the electron. MD simulations and quantum chemical methods are used to understand the hydration of the PO43− anion [22,23,24,25]. Existing molecular mechanical models cannot treat electronic polarizability explicitly as two-body additive terms are adopted. Thus, MD simulations on the hydration of PO43− are restricted to the non-polarizable water model. The computational cost of MD simulations is increased significantly due to the non-additive force fields in polarizable models. Inconsistency in dealing with intra- and intermolecular polarization is the major drawback of these models [26]. Thus, to accomplish a reasonable level of configurational sampling by including electronic polarizability compared to non-polarizable force fields, the mean-field polarizable (MFP) water model, namely MFP/TIP3P, is developed [27,28]. The MFP/TIP3P model is also effectively used in many biological systems [29,30,31].
The present study investigates the hydration of PO43− by employing classical MD with the MFP/TIP3P water model, and electronic structure calculations. The local solvation environment, microscopic structure, hydration shell, coordination number (CN) and energetics of the hydrated PO43− anion are presented in detail. Efforts are also given to building the potential of the mean force (PMF) by considering a suitable collective variable during the hydration process.
2. Computational Methods
Molecular Dynamics Simulation
A 60 Å × 60 Å × 60 Å cubical box is considered to solvate a phosphate anion having a concentration of 0.05 M. Another two cubical boxes of the same size are taken with phosphate anion concentrations of 0.025 M and 0.0125 M, respectively. For electrical charge neutrality, suitable numbers of sodium ions are added to the solvated system in each box. The polarizable water model, MFP/TIP3P, is used to model the solvent water. The local solvation environment in the MFP/TIP3P model is imitated self-consistently and on-the-fly by adjusting the charges on the three atoms of the solvent water molecule. A well-known damping scheme is used to attain the mean-field nature of the local polarization and is parameterized by an average over time. The force field parameters for phosphate are taken from the literature [22]. Presently, two different temperatures, namely, 298 K and 325 K, are considered to study the effect of temperature on the hydration of the phosphate anion. In each simulation box, the temperature is sustained by a Berendsen thermostat with a relaxation time of 2 fs. SHAKE algorithm is used in the present simulation. Initially, the solvent molecules are heated for 500 ps to reach the required temperature, and after that, the whole system is heated for 1 ns to acquire the required temperature. Each system is equilibrated in an NPT ensemble for 5 ns to attain atmospheric pressure. Each system goes through a 10 ns NVT equilibration run before the 100 ns production run in the NVT ensemble using GROMACS [32]. The CN of the phosphate anion is used as a collective variable (CV) to extract the potential of the mean force (PMF) profile at 298 K for an anion concentration of 0.05 M. It is defined as the number of contacts between the PO43− ion and water molecules as . A switching function is used to define the individual contribution, as [33].
Here, |ri − rj| = rij and |ri − rj| − d0 = r0. r0 and d0 are the full width at half maxima and the first peak position in the pair distribution function, respectively. The values of m and n are taken as 6 and 12, respectively. The enhanced sampling method, namely, a well-tempered version of meta-dynamics (WT-MtD), is considered to calculate the PMF profiles [34]. The NVT ensemble is used for all the WT-MtD runs, and the simulations are carried out for 50 ns. Gaussian hills height of 0.20 kJ/mol, width = 0.05, a bias factor of 10 and an initial deposition rate of the hills = 5 ps are used in all the WT-MtD simulations. The deposition rate is slightly higher than that used in more complex systems [35,36]. The PMF profiles are generated from the converged WT-MtD run [37,38].
3. Results and Discussion
3.1. Mean Square Displacement
The present study is aimed to investigate the distribution of water molecules around the phosphate anions at various temperatures and phosphate ion concentrations. Atoms in liquids are subject to a deviation from their average coordinates at any particular temperature, i.e., liquid particles move constantly. Although the displacement is very important, the trajectory followed by liquid particles resembles a random walker. Mean square displacement (MSD) is a better quantity than displacement to measure the liquid particles’ motion. MSD measures the deviation or “thermal” displacement of the coordinate of a particle for a reference coordinate over time. The MSD of a particle at time t is defined as:
where ri is the position of a heavy atom in the ith molecule at time t and N is the total number of such atoms. The MSD profiles for water and phosphate ion concentrations of 0.05 M, 0.025 M and 0.0125 M at 298 K and 0.05 M phosphate concentration at 325 K are shown in Figure 1 at 298 K.
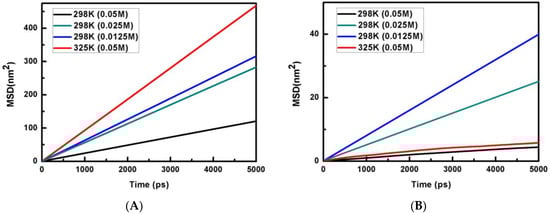
Figure 1.
Plots of MSD (nm2) vs. time are shown for (A) water and (B) phosphate anion.
It is known that the information about the diffusion of atoms can also be calculated from the knowledge of MSD. For a solid system, the kinetic energy of the particles needs to be adequate to reach the diffusive behavior and MSD to reach saturation. On the other hand, if the system is liquid, then the MSD of particles will grow linearly with time. For a liquid system, it is possible to explore the behavior of such a system from the knowledge of the slope of the MSD versus the time plot. The self-diffusion coefficient (D) is calculated from the long-time slope of the MSD versus the time plot by applying the Einstein relation [39]:
The calculated values of the self-diffusion coefficients of the phosphate ion at different concentrations (0.05 M, 0.025 M and 0.0125 M) and temperatures (298 K and 325 K) are shown in Table 1. Interestingly, the self-diffusion coefficient of water is also calculated from a simulation consisting of pure polarizable TIP3P water and is found to be 5.63 × 10⁻⁹ m2·s−1. It is clear from Table 1 that the self-diffusion coefficient of phosphate is at least one order of magnitude slower than that of water. It is observed that the self-diffusion coefficients of both water and phosphate increase with the rise in temperature. Similarly, self-diffusion coefficient values also increase with a decrease in phosphate ion concentration. The variation of the self-diffusion coefficients of water and phosphate are shown in Figure 2A and Figure 2B, respectively. We observe a good linear correlation between the self-diffusion coefficients and phosphate ion concentration (C) for both water and phosphate. The best-fitted linear expressions are D(water) = 5.58 × 10⁻⁹ − 31.49C and D(Phosphate) = 11.18 × 10⁻¹⁰ − 201.6C. On extrapolating to the infinite dilution (C → 0), the self-diffusion coefficient of water is obtained as 5.58 × 10⁻⁹ m2·s−1. This value is very close to the calculated self-diffusion coefficient of water in a polarizable TIP3P medium (5.63 × 10⁻⁹ m2·s−1) in the present study and a non-polarizable TIP3P water medium (5.65 × 10⁻⁹ m2·s−1) [40]. This justifies the robustness of the linear expressions, and the self-diffusion coefficients can be obtained for both water and phosphate ions at any phosphate ion concentration by using the above linear expressions.

Table 1.
The self-diffusion coefficients (D) of phosphate ion and water at different temperatures and phosphate ion concentrations.
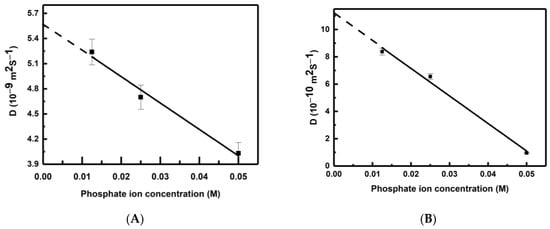
Figure 2.
Variation of self-diffusion coefficient (D) of (A) water and (B) phosphate with concentration at 298 K. Error bars (within ±1.5%) are also shown.
3.2. Hydrogen Bonding
The dynamic balance between water–water and phosphate–water interactions controls the hydration process of the phosphate ions. As the solvent water molecules interact with the phosphate anion by forming hydrogen bonds (SHB and DHB), and the water molecules interact by inter-water hydrogen bonding, the time-dependent behavior of HBs is investigated from MD simulations. The formations of HBs are investigated based on geometric criteria. If the distance between the HB donor (D) and acceptor (A) atom is less than 3.0 Å and the D–H–A angle is lower than 35˚, HB is accounted to be formed. The HB dynamics [41,42] are monitored through the HB autocorrelation function, CHB(t), which is defined as:
where n is the all possible hydrogen bond that forms between phosphate and water, A(0) and A(t) are the HB population operators at time, t = 0 and t = t, respectively. The value of the HB population operators A(t) is equal to 1 when the corresponding HB is intact at time t, and it is equal to zero when the associated HB bond breaks down.
The variations of the CHB(t) functions are also shown in Figure 3. The CHB(t) functions are fitted excellently with multi-exponential decay (χ2~10−4 and R > 0.99), and the fitting parameters, e.g., amplitude, time constants and average lifetime of HB bonds for water–water and phosphate–water are provided in Table 2. All the HB correlation functions show tri-exponential decay except for the correlation function at 0.0125 M and 298 K, which shows bi-exponential decay. The information on the fitting parameters of HB time correlation functions helps to comprehend the hydration process very effectively in polarizable and non-polarizable water mediums [3,29,30,31,43,44].
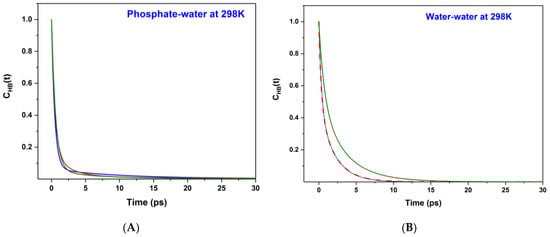
Figure 3.
Time-dependent HB lifetime correlation function, CHB(t) are shown for (A) Phosphate–water and (B) water–water systems at 298 K. Olive, red and blue color lines, respectively, represent the phosphate ion concentration of 0.05 M, 0.025 M and 0.0125 M.
Table 2.
Exponential fitting parameters (time constants and amplitude) of hydrogen bond time correlation functions and average hydrogen bonds lifetime (ps) for various systems. The general expression of the multiexponential fitting is .
We do observe a short HB correlation. The lifetime (τ) of each HB bond for water–water and phosphate–water systems is also measured from the knowledge of the HB time correlation function, . The HB lifetimes are also calculated from the CHB(t) versus time plots and are shown in Table 2. The HB lifetime of all phosphate–water systems is observed to be ~1 ps at 298 K. The HB lifetimes of the water–water system are varied from 2 ps to 1.2 ps at 298 K. At 325 K, the observed HB lifetimes for phosphate–water and water–water systems are 1.2 ps and 1.1 ps, respectively. It is clear from both Table 2 and Figure 3 that the phosphate–water HB autocorrelation functions decay slightly faster in comparison to that of the water–water HB autocorrelation functions at 298 K.
.
3.3. Microscopic Structure
It is known that phosphate ions are rare as an isolated species but are ubiquitous in electrolyte solutions, solids and aerosols. The dynamical balance between phosphate–water and water–water interactions leads to the solvation of the phosphate ion in the presence of water. Thus, it will be interesting to understand the microscopic structure of phosphate in a water medium. At first, the CN of the phosphate ion is calculated from the knowledge of the radial distribution function and is observed as 15.9 at 298 K for an anion concentration of 0.05 M. WT-MtD simulation is also employed to obtain the CN value at 298 K.
It is well understood that the original meta-dynamics (MtD) method is an enhanced sampling method and is very advantageous to construct the PMF profiles along a suitable CV. However, the original version of the MtD simulation method lacks true equilibrium information for a chemical system, and the “slow” build-up limit of Gaussian bias potential is implemented. Thus, due to the inherent non-equilibrium nature and well-known convergence problem, the practicality of the original version of the MtD technique is restricted. The presently implemented method, WT-MtD, has resolved these concerns by rescaling the height of the Gaussian bias potential with the bias grown over time at some fictitious higher temperature. Hence, the PMF profile is generated for the phosphate anion hydration by considering CN as a CV, as defined in Equation (1). The PMF profile is then constructed from the converged WT-MtD simulation at 298 K having 0.05 M phosphate ion concentration, and is shown in Figure 4A. The figure shows that the most probable average CN for a phosphate anion is 15.6. This value is very close to the previously obtained value of ~16 in a non-polarizable water medium [22]. Thus, a triply negatively charged phosphate ion is observed as a strong structure-making ion. In order to find the most preferred candidate of the phosphate ion with 16 water molecules at 298 K, quantum mechanical calculations are used. Full geometry optimization without any symmetry restrictions is carried out for the PO43−·16H2O cluster at the ωB97X-D/aug-cc-pVTZ level of theory [45]. The most stable structure of the PO43−·16H2O cluster is shown in Figure 4B. The PO43−·16H2O cluster consisted of single hydrogen bonding (SHB), having one of the hydrogen atoms of the water molecule bonding with the phosphate moiety, double hydrogen bonding (DHB) with water molecules using both the hydrogen atoms in bonding with the anion, and inter-water hydrogen bonding (WHB). The measured distances of the hydrogen bond (HB) formed between the phosphate anion and water vary from 0.169 to 0.201 nm. The same for the WHB ranges from 0.192 to 0.215 nm. The first peak of g(r) is dominated by ion–water hydrogen bonding (SHB & DHB) and water–water bonding (WHB), and the second and third peaks mainly consist of inter-water hydrogen bonding (see Figure 4B). The average distance of the P–O, P–H and O–O bonds between phosphate and water are observed to be 0.351 nm, 0.290 nm and 0.276 nm, respectively, for the most stable structure. The average POH angle is also observed to be 174°.
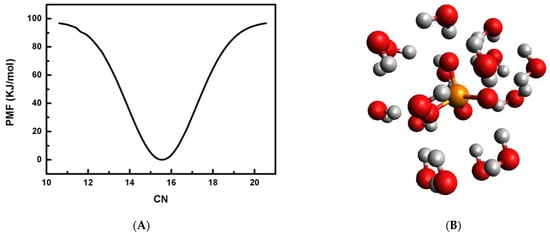
Figure 4.
(A) Plot of potential of mean force, PMF in kJ/mol by employing water CN as a CV in WT-MtD simulation at 298 K. (B) Most stable structure of PO43−·16H2O cluster.
3.4. Solvent-Berg Model
It is observed that the self-diffusion coefficient of phosphate is one order of magnitude slower than that of water, and it increases with decreases in phosphate ion concentration. The solvent-berg model can be invoked to explain this behavior [46]. In this model, the phosphate ion is moving as a solvent-berg, i.e., the ion along with the water molecules of the first solvation shell move together as the diffusing species. It is shown that 16 water molecules can form the first solvation shell of the phosphate ion (see Figure 4B). Thus, the solvent-berg consists of the ion and 16 solvent molecules and is bulkier than the free ion and solvent molecule. This may explain the slow diffusion of phosphate with respect to the water. Similarly, solvent-berg may also have more space to move freely in dilute ion concentration. Thus, the self-diffusion coefficient will increase with decreases in phosphate ion concentration. It will also be interesting to calculate the equivalent conductance of the phosphate ion by employing modified Stokes–Einstein relation. The ratio of the equivalent conductance () of two ions, namely, the phosphate anion and a known reference ion, having the same charge for a fixed solvent and at a given temperature can be expressed as . Here, and are the equivalent conductance of the phosphate anion and a known reference ion, respectively. Similarly, and are the solvent-berg radius of the phosphate anion and a known reference ion, respectively. The experimental measured values of the conductivity (70 S·cm2·eq−1) and hydrated radius (4.6 Å) of a ferric ion are used as the known reference system [47,48]. At present, the solvent-berg radius of the phosphate ion is considered as the radius of the phosphate ion with 16 solvent molecules, i.e., for the PO43−·16H2O cluster. The radius is found to be 4.83 Å. The calculated conductivity of the phosphate ion in water is 67 S cm2·eq−1. The present calculated value is very close (within 3%) to that of the experimentally observed value [48].
4. Conclusions
The hydration of the phosphate ion is investigated by employing all-atom molecular dynamics (MD) simulation and quantum mechanical methods. The equilibrium MD simulation is performed using the mean-field polarizable water model. The self-diffusion coefficient of phosphate is observed to be one order of magnitude slower than that of water, and it also increases with decreases in phosphate ion concentration and increases with the solution temperature. Using Einstein’s method, a good linear correlation between the self-diffusion coefficient and anion concentration is determined from mean-square displacement (MSD) as a time function. The HB dynamics of the hydration of the phosphate anion are obtained from time-dependent autocorrelation function CHB(t) analysis, and we observed a weak correlation. CHB(t) is calculated to be marginally faster for the phosphate–anion system in comparison to that of the water–water system at 298 K. A maximum computed CN value of 15.9 is observed for 0.05 M phosphate ion concentration at 298 K. We observed a decrease in CN with the rise in the temperature and saturation of CN with the dilution of anion concentration. The value of CN is also calculated to be 15.6 by employing non-equilibrium MD simulation, namely, the well-tempered meta-dynamics method. The structure of the PO43−·16H2O cluster is optimized with the ωB97X-D/aug-cc-pVTZ approach and is found to consist of both single and double–bonded anion–water HB along with inter-water HB in a range from 0.169 to 0.201 nm and from 0.192 to 0.215 nm, respectively. The conductivity of the phosphate ion is also calculated by employing modified Stokes–Einstein relation, and is found to be in good agreement with the experimentally observed value.
Author Contributions
Conceptualization, A.K.P.; Methodology, A.K.P.; Formal analysis, S.V.; Data curation, S.V.; Writing—original draft, A.K.P. and S.V.; Writing—review & editing, A.K.P. All authors have read and agreed to the published version of the manuscript.
Funding
The work was supported by DAE under project RBA4013.
Data Availability Statement
Data is contained within article.
Acknowledgments
Tyagi, A.K.; Kumar, A.; Bandyopadhyay, T.; Choudhury. N. and Ghosh, H.N. are gratefully acknowledged for their encouragement during the course of the work. BARC computer center is also acknowledged for providing ANUPAM computational facility.
Conflicts of Interest
The authors declare no conflict of interest.
References
- Ohtaki, H.; Radnai, T. Structure and dynamics of hydrated ions. Chem. Rev. 1993, 93, 1157–1204. [Google Scholar] [CrossRef]
- Bakker, H.J. Structural Dynamics of Aqueous Salt Solutions. Chem. Rev. 2008, 108, 1456–1473. [Google Scholar] [CrossRef] [PubMed]
- Pathak, A.K.; Bandyopadhyay, T. Solvation of arsenate anion: Combined quantum mechanics and molecular dynamics based investigation. Mol. Phys. 2016, 114, 2029–2036. [Google Scholar] [CrossRef]
- Smith, J.D.; Cappa, C.D.; Wilson, K.R.; Messer, B.M.; Cohen, R.C.; Saykally, R.J. Energetics of Hydrogen Bond Network Rearrangements in Liquid Water. Science 2004, 306, 851–853. [Google Scholar] [CrossRef] [PubMed]
- Boero, M.; Terakura, K.; Ikeshoji, T.; Liew, C.C.; Parrinello, M. Hydrogen Bonding and Dipole Moment of Water at Supercritical Conditions: A First-Principles Molecular Dynamics Study. Phys. Rev. Lett. 2000, 85, 3245–3248. [Google Scholar] [CrossRef] [PubMed]
- Eaves, J.D.; Loparo, J.J.; Fecko, C.J.; Roberts, S.T.; Tokmakoff, A.; Geissler, P.L. Hydrogen bonds in liquid water are broken only fleetingly. Proc. Natl. Acad. Sci. USA 2005, 102, 13019–13022. [Google Scholar] [CrossRef]
- Matsumoto, M.; Baba, A.; Ohmine, I. Topological building blocks of hydrogen bond network in water. J. Chem. Phys. 2007, 127, 134504. [Google Scholar] [CrossRef] [PubMed]
- Kim, S.J.; Born, B.; Havenith, M.; Gruebele, M. Real-Time Detection of Protein-Water Dynamics upon Protein Folding by Terahertz Absorption Spectroscopy. Angew. Chem. Int. Ed. 2008, 47, 6486–6489. [Google Scholar] [CrossRef]
- Wernet, P.; Nordlund, D.; Bergmann, U.; Cavalleri, M.; Odelius, M.; Ogasawara, H.; Naslund, L.A.; Hirsch, T.K.; Ojamae, L.; Glatzel, P.; et al. The structure of the first coordination shell in liquid water. Science 2004, 304, 995–999. [Google Scholar] [CrossRef]
- Winter, B.; Aziz, E.F.; Hergenhahn, U.; Faubel, M.; Hertel, I.V. Hydrogen bonds in liquid water studied by photoelectron spectroscopy. J. Chem. Phys. 2007, 126, 124504. [Google Scholar] [CrossRef]
- Omta, A.W.; Kropman, M.F.; Woutersen, S.W.; Bakker, H.J. Faculty Opinions recommendation of Negligible effect of ions on the hydrogen-bond structure in liquid water. Science 2003, 301, 347–349. [Google Scholar] [CrossRef] [PubMed]
- Park, S.; Fayer, M.D. Hydrogen bond dynamics in aqueous NaBr solutions. Proc. Natl. Acad. Sci. USA 2007, 104, 16731–16738. [Google Scholar] [CrossRef] [PubMed]
- Heugen, U.; Schwaab, G.; Bründermann, E.; Heyden, M.; Yu, X.; Leitner, D.M.; Havenith, M. Solute-induced retardation of water dynamics probed directly by terahertz spectroscopy. Proc. Natl. Acad. Sci. USA 2006, 103, 12301–12306. [Google Scholar] [CrossRef] [PubMed]
- Kropman, M.F.; Bakker, H.J. Dynamics of Water Molecules in Aqueous Solvation Shells. Science 2001, 291, 2118–2120. [Google Scholar] [CrossRef] [PubMed]
- Mancinelli, R.; Botti, A.; Bruni, F.; Ricci, M.A.; Soper, A.K. Hydration of Sodium, Potassium, and Chloride Ions in Solution and the Concept of Structure Maker/Breaker. J. Phys. Chem. B 2007, 111, 13570–13575. [Google Scholar] [CrossRef] [PubMed]
- Ebbinghaus, S.; Kim, S.J.; Heyden, M.; Yu, X.; Heugen, U.; Gruebele, M.; Leitner, D.M.; Havenith, M. An extended dynamical hydration shell around proteins. Proc. Natl. Acad. Sci. USA 2007, 104, 20749–20752. [Google Scholar] [CrossRef]
- Schmidt, D.A.; Birer, O.; Funkner, S.; Born, B.P.; Gnanasekaran, R.; Schwaab, G.W.; Leitner, D.M.; Havenith, M. Rattling in the Cage: Ions as Probes of Sub-picosecond Water Network Dynamics. J. Am. Chem. Soc. 2009, 131, 18512–18517. [Google Scholar] [CrossRef]
- Watson, J.D.; Crick, F.H. A Structure for Deoxyribose Nucleic Acid. Nature 1953, 171, 737–738. [Google Scholar] [CrossRef]
- Zoll, J.; Tessari, M.; Van Kuppeveld, F.J.; Melchers, W.J.; Heus, H.A. Breaking pseudo-twofold symmetry in the poliovirus 3′-UTR Y-stem by restoring Watson-Crick base pairs. RNA 2007, 13, 781–792. [Google Scholar] [CrossRef]
- Knowles, J.R. Enzyme-Catalyzed Phosphoryl Transfer Reactions. Annu. Rev. Biochem. 1980, 49, 877–919. [Google Scholar] [CrossRef]
- Törnroth-Horsefield, S.; Neutze, R. Opening and closing the metabolite gate. Proc. Natl. Acad. Sci. USA 2008, 105, 19565–19566. [Google Scholar] [CrossRef]
- Pathal, A.K. Evaluation of the detachment energy of hydrated phosphate anion over a wide range of cluster size and revisiting solvent–berg model: A theoretical study. Mol. Phys. 2014, 112, 3085–3091. [Google Scholar] [CrossRef]
- Pathak, A.K. Stepwise hydration of phosphate anion: A microscopic theory connecting domain of instability and stability. Int. J. Quantum Chem. 2015, 115, 413–418. [Google Scholar] [CrossRef]
- Pye, C.C.; Rudolph, W.W. An ab Initio, Infrared, and Raman Investigation of Phosphate Ion Hydration. J. Phys. Chem. A 2003, 107, 8746–8755. [Google Scholar] [CrossRef]
- VandeVondele, J.; Tröster, P.; Tavan, P.; Mathias, G. Vibrational Spectra of Phosphate Ions in Aqueous Solution Probed by First-Principles Molecular Dynamics. J. Phys. Chem. A 2012, 116, 2466–2474. [Google Scholar] [CrossRef]
- Ponder, P.J.; Case, D.A. Force fields for protein simulations. Adv. Protein Chem. 2003, 66, 27–85. [Google Scholar]
- Leontyev, I.V.; Stuchebrukhov, A.A. Polarizable Mean-Field Model of Water for Biological Simulations with AMBER and CHARMM Force Fields. J. Chem. Theory Comput. 2012, 8, 3207–3216. [Google Scholar] [CrossRef] [PubMed]
- Leontyev, I.V.; Stuchebrukhov, A.A. Polarizable molecular interactions in condensed phase and their equivalent nonpolarizable models. J. Chem. Phys. 2014, 141, 014103. [Google Scholar] [CrossRef]
- Pathak, A.K.; Bandyopadhyay, T. Protein–Drug Interactions with Effective Polarization in Polarizable Water: Oxime Unbinding from AChE Gorge. J. Phys. Chem. B 2015, 119, 14460–14471. [Google Scholar] [CrossRef]
- Pathak, A.K.; Bandyopadhyay, T. Unbinding of fluorinated oxime drug from the AChE gorge in polarizable water: A well-tempered metadynamics study. Phys. Chem. Chem. Phys. 2017, 19, 5560–5569. [Google Scholar] [CrossRef] [PubMed]
- Pathak, A.K.; Bandyopadhyay, T. Dynamic Mechanism of a Fluorinated Oxime Reactivator Unbinding from AChE Gorge in Polarizable Water. J. Phys. Chem. B 2018, 122, 3876–3888. [Google Scholar] [CrossRef] [PubMed]
- Hess, B.; Kutzner, C.; van der Spoel, D.; Lindahl, E. GROMACS 4: Algorithms for Highly Efficient, Load-Balanced, and Scalable Molecular Simulation. J. Chem. Theory Comput. 2008, 4, 435–447. [Google Scholar] [CrossRef]
- Bonomi, M.; Branduardi, D.; Bussi, G.; Camilloni, C.; Provasi, D.; Raiteri, P.; Donadio, D.; Marinelli, F.; Pietrucci, F.; Broglia, R.A.; et al. PLUMED: A portable plugin for free-energy calculations with molecular dynamics. Comput. Phys. Commun. 2009, 180, 1961–1972. [Google Scholar] [CrossRef]
- Barducci, A.; Bussi, G.; Parrinello, M. Well-Tempered Metadynamics: A Smoothly Converging and Tunable Free-Energy Method. Phys. Rev. Lett. 2008, 100, 020603. [Google Scholar] [CrossRef] [PubMed]
- Sun, Z.; Zheng, L.; Wang, K.; Huai, Z.; Liu, Z. Primary vs secondary: Directionalized guest coordination in β-cyclodextrin derivatives. Carbohydr. Polym. 2022, 297, 120050. [Google Scholar] [CrossRef]
- Sun, Z.; Huai, Z.; He, Q.; Liu, Z. A General Picture of Cucurbit[8]uril Host–Guest Binding. J. Chem. Inf. Model. 2021, 61, 6107–6134. [Google Scholar] [CrossRef]
- Tiwary, P.; Parrinello, M. A Time-Independent Free Energy Estimator for Metadynamics. J. Phys. Chem. B 2015, 119, 736–742. [Google Scholar] [CrossRef]
- Bonomi, M.; Barducci, A.; Parrinello, M. Reconstructing the equilibrium Boltzmann distribution from well-tempered metadynamics. J. Comput. Chem. 2009, 30, 1615–1621. [Google Scholar] [CrossRef] [PubMed]
- Allen, M.P.; Tildesley, D.J. Computer Simulation of Liquids; Oxford University Press: New York, NY, USA, 1987. [Google Scholar]
- Mark, P.; Nilsson, L. Structure and Dynamics of the TIP3P, SPC, and SPC/E Water Models at 298 K. J. Phys. Chem. A 2001, 105, 9954–9960. [Google Scholar] [CrossRef]
- Luzar, A.; Chandler, D. Hydrogen-bond kinetics in liquid water. Nature 1996, 379, 55–57. [Google Scholar] [CrossRef]
- Luzar, A.; Chandler, D. Effect of Environment on Hydrogen Bond Dynamics in Liquid Water. Phys. Rev. Lett. 1996, 76, 928–931. [Google Scholar] [CrossRef] [PubMed]
- Pathak, A.K.; Bandyopadhyay, T. Water isotope effect on the thermostability of a polio viral RNA hairpin: A metadynamics study. J. Chem. Phys. 2017, 146, 165104. [Google Scholar] [CrossRef] [PubMed]
- Mishra, V.; Pathak, A.K.; Bandyopadhyay, T. Binding of human serum albumin with uranyl ion at various pH: An all atom molecular dynamics study. J. Biomol. Struct. Dyn. 2022, 1–11. [Google Scholar] [CrossRef]
- Schmidt, M.W.; Baldridge, K.K.; Boatz, J.A.; Elbert, S.T.; Gordon, M.S.; Jensen, J.H.; Koseki, S.; Matsunaga, N.; Nguyen, K.A.; Su, S.; et al. General atomic and molecular electronic structure system. J. Comput. Chem. 1993, 14, 1347–1363. [Google Scholar] [CrossRef]
- Bogatko, S.A. Ion solvation structure and dynamical information via deviations from the solvent-berg diffusion model. Chem. Phys. Lett. 2013, 565, 148–150. [Google Scholar] [CrossRef]
- Kolb, M.; Seubert, M. Practical Ion Chromatography: An Introduction; Metrohm Ltd.: Herisau, Switzerland, 2001. [Google Scholar]
- Nightingale, E.R. Phenomenological Theory of Ion Solvation. Effective Radii of Hydrated Ions. J. Chem. Phys. 1959, 63, 1381–1387. [Google Scholar] [CrossRef]


Disclaimer/Publisher’s Note: The statements, opinions and data contained in all publications are solely those of the individual author(s) and contributor(s) and not of MDPI and/or the editor(s). MDPI and/or the editor(s) disclaim responsibility for any injury to people or property resulting from any ideas, methods, instructions or products referred to in the content. |
© 2023 by the authors. Licensee MDPI, Basel, Switzerland. This article is an open access article distributed under the terms and conditions of the Creative Commons Attribution (CC BY) license (https://creativecommons.org/licenses/by/4.0/).