Abstract
Purpose—This study aims to examine the links between transformational leadership, team-member exchange and job performance of people with disabilities in Hong Kong. Design/methodology/approach—Data were collected from a sample of 108 direct supervisors of people with disabilities via an online survey with validated scales. The structural equation modelling approach via SmartPLS (Version 3.0) was used to investigate the linear relations and the mediated effect amongst the variables. Findings—Transformational leadership was positively related to team-member exchange (p = 0.013), but its link with job performance was insignificant (p ≥ 0.05). Team-member exchange was positively related to job performance (p = 0.000). Hence, team-member exchange fully mediated the relationship between leaders’ transformational leadership and the job performance of people with disabilities. Originality/value—Transformational leadership is favorable for the job performance of people with disabilities, but its influence is indirect. High level of team-member exchange quality is necessary, as team-member exchange fully mediates the relationship between transformational leadership and the job performance of people with disabilities. Managers should demonstrate transformational leadership to all employees and not only pay attention to people with disabilities. This insight helps drive workplace disability inclusion.
1. Introduction
Hong Kong has one of the worst labor shortage problems globally. Close to 90 percent of Hong Kong employers indicated that labor shortage negatively affected their business [1]. People with disabilities (hereafter called “PWDs”) can form a rich source of labor [2]. They are defined by the HKSAR Government [3] as people who have at least one of the following disabilities: (i) restriction in body movement, (ii) seeing difficulty, (iii) hearing difficulty, (iv) speech difficulty, (v) mental illness or mood disorder, (vi) autism, (vii) specific learning difficulties, (viii) attention deficit or hyperactivity disorder, and (ix) intellectual disability. However, many PWDs remain unemployed persistently [4]. Only 17 percent of Hong Kong employers were interested in employing PWDs [5]. More than a quarter of Hong Kong employees were not willing to work with PWDs [6].
The key to successful PWD employment is an inclusive environment [7]. A right leadership style is a prerequisite to a truly inclusive workplace where employees can develop adaptive behaviors, appropriate attitude [8], and awareness of individual differences to help the organization meet employees’ intricate needs [9]. Transformational leadership (hereafter called “TFL”) is a leadership style that has dominated the Western leadership theory [10] (pp. 241–256). Its positive impact on favorable employee and organizational outcomes has been confirmed by many leadership authors [11]. It is often found to be positively related to employee performance [12,13,14,15].
Another major barrier is employees’ attitude toward PWD employment [16]. Team-member exchange quality (hereafter called “TMX”) measures the perceived quality of the reciprocity amongst team members in contributing information, ideas, feedback, help and assistance to each other [17]. It is a strong mediator between leader–member exchange and team performance [18]. A supportive work environment is a prerequisite for PWDs to maintain their jobs in an open market [19]. TFL facilitates employees to help each other [20] whilst TMX is positively related to helping behavior [21]. Besides, TFL was found to be directly related to PWDs’ job performance (hereafter called “JP”) [22].
However, there are cross-cultural variations in the effects of TFL [23,24] and TMX [25]. After a long colonial period, Hong Kong has developed a unique hybrid of Confucian and Western cultures [26], but there is a scarcity in research examining the influences of TFL and TMX on the performance of PWDs in Hong Kong [27]. Therefore, the current study aims to address this unfilled research gap and answer the following research questions:
- How does direct supervisors’ transformational leadership influence the job performance of people with disabilities?
- How does team-member exchange quality influence the job performance of people with disabilities?
- How does team-member exchange quality influence the relationship between transformational leadership and job performance?
PWD employment can ease the severe labor shortage problem in Hong Kong, but employers worry about PWDs’ performance. TFL has an impact on employee performance [11,20]. TMX also predicts performance [17,28]. However, TFL sometimes only has indirect influences on employee performance [29], whilst TMX sometimes mediates the relationships between leadership and individual outcomes [18,30]. Hence, the current study aims to examine how TFL and TMX influence PWDs’ JP to help Hong Kong employers, managers and employees understand how to support PWDs in the workplace.
2. Literature Review
2.1. Transformational Leadership
Transformational leadership (TFL), transactional leadership, and laissez-faire leadership are the three leadership styles in the full-range leadership model [31]. The positive impact of TFL is widely observed, though sometimes its positive impact is indirect and depends on certain mediators [29]. Idealized influence (or charisma), inspirational motivation, intellectual stimulation, and individualized consideration are the four dimensions under TFL [32].
Transformational leaders are role models [33] who use their idealized influence to facilitate employees’ identification with their organization [24] and transform employees’ personal values, beliefs, and attitudes [29]. Inspirational motivation helps managers create an emotional climate for employees to support coworkers [34] and positively influences employees’ collective social values and identity [35]. Intellectual stimulation facilitates employees to feel the obligation to work for the group and help each other [20]. Individualized consideration helps leaders build trust with their followers [36].
2.2. Team-Member Exchange
Seers [28] studied the lateral social exchange work relationships and the social interactions amongst employees to examine the impact of team-member exchange quality (TMX). TMX has a positive impact on coworker support and helping behavior [37]. With a high level of TMX, team members are more trusting and committed to each other [38]. TMX also mediates between leadership and employee performance [18].
Meeting, exchange, and cohesion are the three dimensions of TMX [28]. Meeting effectiveness is crucial to organizational success. The exchange dimension is associated with employees’ two-way reciprocal behaviors to share feelings and offer ideas, opinions, assistances, and recognitions. Effective cooperation, positive interdependence, commitment, and group identity are grouped under the dimension of cohesion. TMX facilitates team members to appreciate, recognize, encourage, respect, and trust each other and is positively related to employees’ performance [18,39] and organizational identification [40].
2.3. Job Performance
Employee performance is crucial to organizational success [41]. It is an important factor in predicting employees’ job-related outcomes and values that employees generate for the organization [42]. It has direct implications on organizational effectiveness, performance [43], and business outcomes [44]. Employees are expected to complete the tasks assigned to them, so their JP should measure the accomplishment of assigned tasks and their contribution to the desirable organizational outcomes according to the organizational standards [45]. Manager’s assessment on employees’ fulfilment of responsibilities according to the job descriptions is commonly used to measure JP [46].
2.4. Transformational Leadership and Team-Member Exchange
Wikaningrum [47] found a positive correlation between leader and followers’ exchange quality and the relationship amongst followers. TFL fosters positive relationships amongst followers [48] and has a positive impact on employees’ knowledge sharing, team learning and helping behavior [49]. Therefore, a positive relationship is expected between TFL and TMX.
H1.
TFL is positively related to TMX.
2.5. Transformational Leadership and Job Performance
TFL positively influences employee performance [15,50,51]. It has a positive impact on employees’ JP [52]. Therefore, a positive relationship is expected between TFL and PWDs’ JP.
H2.
TFL is positively related to JP.
2.6. Team-Member Exchange and Job Performance
TMX has a positive relationship with JP [39]. Employees with high-quality relationships with coworkers are more likely to go beyond their formal responsibilities and offer help to coworkers [53]. Hence, a positive relationship is expected between TMX and PWDs’ JP.
H3.
TMX is positively related to JP.
2.7. Team-Member Exchange as Mediator
TMX is a strong mediator between leader–member exchange and performance [18]. It often mediates the links between leadership and employee outcomes [30]. Therefore, TMX is expected to mediate the relationship between TFL and PWDs’ JP.
H4.
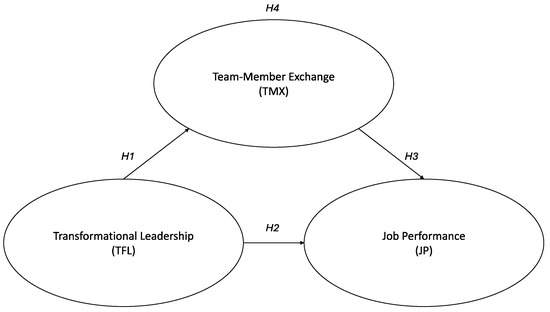
TMX mediates the relationship between TFL and JP (see Figure 1).
Figure 1.
Theoretical model.
3. Methods
To address the research questions, a quantitative and confirmatory approach was adopted to test the hypotheses with data collected through a survey. To understand how a mediator (TMX in the current study) affects the influence of an independent variable (TFL) on a dependent variable (JP), a mediation analysis was conducted to determine if the relationship between two variables is partially, fully, or not mediated by the mediator [54]. The structural equation modelling tool (hereafter called “SEM”) was used to analyze the structural relationships.
3.1. Data Collection
Ethical approval was obtained from SBS Swiss Business School. A cross-sectional survey questionnaire was used to collect direct supervisors’ assessments on their own TFL, the TMX of their team, and PWDs’ JP. Some demographic data were also collected through the questionnaire. Siddiqui [55] advised that at least 100 cases are needed for the SEM analysis. Purposive sampling was adopted to confine to a specific group of research subjects who were directly supervising PWDs at the time of data collection, since direct supervisors of PWDs are believed to be most advantageously placed to provide data regarding PWD employment. However, as all data came from direct supervisors, the survey results are open to common-sourced–common-method bias.
Five preventive remedies were adopted. Firstly, anonymity and confidentiality were guaranteed. Secondly, the questionnaire was bilingual with both English and Chinese wordings shown to respondents at the same time to facilitate their understanding of the survey questions. Thirdly, a pilot run was conducted to confirm that the wordings were straightforward and easy to understand. Fourthly, shortened versions of the scales were adopted to retain respondents’ attention. Lastly, the online questionnaire was divided into five separate pages. Respondents were not able to return to the previous pages upon completion of each page. The spatial and time separations of the sections reduced respondents’ desire for consistency.
Two non-government organizations (hereafter called “NGOs”) assisted in inviting PWDs’ direct supervisors to respond to the online survey. The first NGO was Hong Kong Council of Social Service that represents close to 500 other NGOs in Hong Kong. The second NGO was the SENsational Foundation which provides awareness and onboarding workshops to PWDs’ employers. The survey questionnaire was sent to 283 employers of PWDs. A total of 111 responses were collected between February and April 2020, amongst which 108 were valid responses, leading to a response rate of 38.2 percent. The three invalid responses were provided by direct supervisors who only had prior experience in supervising PWDs, but at the time of data collection, they no longer supervised any PWDs.
The structured questionnaire contained an introduction on the research background, anonymity and confidentiality, and an instruction for completing the questionnaire. It was bilingual with the two mostly used languages in Hong Kong, namely English and Traditional Chinese. The English version contained questions adapted from validated scales, which was then translated into Traditional Chinese by a PhD candidate in Translation from the Hong Kong Baptist University. A 7-point Likert scale was used as it is suitable for electronic distribution [56] and produces stronger correlations [57]. Respondents provided ratings, from 1—strongly disagree to 7—strongly agree, on five questions derived from the Multifactor Leadership Questionnaire developed by Bass [58], eight questions adapted from the TMX scale developed by Seers et al. [17], and five items from the JP scale developed by Williams and Anderson [59].
3.2. Sample
There was a slight gender imbalance in the sample. Most respondents were university graduates or above (78.70 percent). Most were from the age groups of 31–40 (33.33 percent) and 41–50 (37.96 percent). Three quarters of the respondents were working at the managerial level or above. Most respondents came from small organizations with less than 50 employees (37.04 percent) or large organizations with 300 or more employees (35.19 percent). The largest numbers of PWD subordinates had mental illness or mood disorder (35.19 percent), restriction in body movement or intellectual disability (32.41 percent each). The demographic profiles of the survey respondents and their PWD subordinates are shown in Table 1; Table 2, respectively.

Table 1.
Demographic profiles of survey respondents.
Table 2.
Profiles of survey respondents’ PWD subordinates.
4. Results
SEM partial least squares (hereafter called “PLS-SEM”) was used to investigate the causal relationships between the latent constructs in the theoretical model. PLS-SEM is usually used when there is a smaller sample size of around 100, which may not be normally distributed [60]. Survey data were first downloaded from the online survey platform to a Microsoft Excel file, which was then processed by SmartPLS (Version 3.0) to examine the relationships between TFL, TMX and JP, and investigate the mediating effect of TMX. A significance level of 5 percent (α < 0.05) was adopted in the current study. There are two major steps in PLS-SEM. The first step is the reflective measurement model to verify the internal consistency and the convergent and discriminant validity of the measurement. The second step aims to assess the collinearity, the path coefficients, and the coefficient of determination in the modelling structure [61].
4.1. Measurement Model
The reflective measurement model examines the reliability and validity of the latent constructs in a theoretical framework through assessing the composite reliability for internal consistency, the convergent validity by checking the indicator reliability, the average variance extracted (hereafter called “AVE”) and the discriminant validity through the Fornell–Larcker criterion and the cross-loadings [61]. As the model size increases, the sample size needs to be larger [62]. Shortened versions of well-established scales can be developed by removing scale items with a low factor loading. A minimum of three scale items per factor can yield reliable convergent solutions in confirmatory factor analysis [63]. Certain scale items may be problematic and should be deleted, so including an additional item to make it at least four scale items per factor wherever practical is prudent [64]. In the current study, three scale items with an outer loading value of less than 0.7 were dropped to ensure statistical significance [65].
After eliminating the three scale items, the Cronbach’s alpha values of TFL, TMX and JP were higher than 0.7, so the statistical reliability was confirmed. All constructs had a rho_A value higher than 0.7 [66], a composite reliability (hereafter called “CR”) value higher than 0.7, and an AVE value above 0.5; the internal reliability and convergent validity were confirmed [61]. The square roots of AVE of all latent variables were higher than their correlations with the other constructs [67]. All items had a cross-loading value above the threshold of 0.5 [68]. All heterotrait–monotrait ratio of correlation (hereafter called “HTMT”) values were below 0.9 [69]. The discriminant validity was confirmed. See Table 3 for the Cronbach’s alpha, CR, and AVE of the latent constructs, Table 4 for the square roots of AVE, Table 5 for the cross-loading analysis, and Table 6 for the HTMT values.
Table 3.
Internal reliability and convergent validity.
Table 4.
Construct correlations—square roots of AVE.
Table 5.
Cross-loading analysis.
Table 6.
HTMT values.
4.2. Structural Model
In the second stage, the structural model was tested to evaluate the statistical significance of the relationships between the constructs. The SEM analysis was used to confirm the predictive ability of the theoretical model. The reliability of the results from inferential statistics is affected by the inter-correlation between predictors as independent variables in a theoretical model. This phenomenon is called collinearity, which is a common issue in inferential statistics [70] (pp. 68–89). To confirm that the independent variables are not significantly correlated, the severity of collinearity is examined through measuring the variance inflation factor (hereafter called “VIF”), which, according to Hair, Sarstedt et al. [61], should have a value below 5.0 to confirm the reliability of a construct. Table 7 shows that all VIF values were below 5.0, which confirmed that there was no issue in the collinearity of all constructs.
Table 7.
VIF values.
The path coefficient, between 0 and 1, was then calculated to measure the strength of the relationship between two variables and examine the causal link between them. A positive value means a positive relationship, whilst a negative value means an inverse relationship between two variables. As the data being examined may not be normally distributed, a non-parametric bootstrapping for up to 5000 times was conducted to ensure that the result of the statistical analysis is significant [61]. As shown in Table 8, the path coefficient between TFL and JP was 0.060, showing a weak positive correlation. The p-value of 0.615 meant that the positive relationship was not significant. In the relationship between TFL and TMX, a path coefficient of 0.295 showed a statistically significant and positive relationship between the two variables (p < 0.05). Between TMX and JP, a path coefficient of 0.457 also showed a statistically significant and positive relationship between the two variables (p < 0.05).
Table 8.
Path coefficients and statistical significance.
In measuring the predictive accuracy of the structural models, the coefficient of determination (hereafter called “R2”) was calculated. The R2 values of the latent variables are shown in Table 9. The R2 values showed the predictive accuracy, or the proportion of variance in the dependent variables, TMX and JP, that TFL as the independent variable accounted for.
Table 9.
Coefficients of determination.
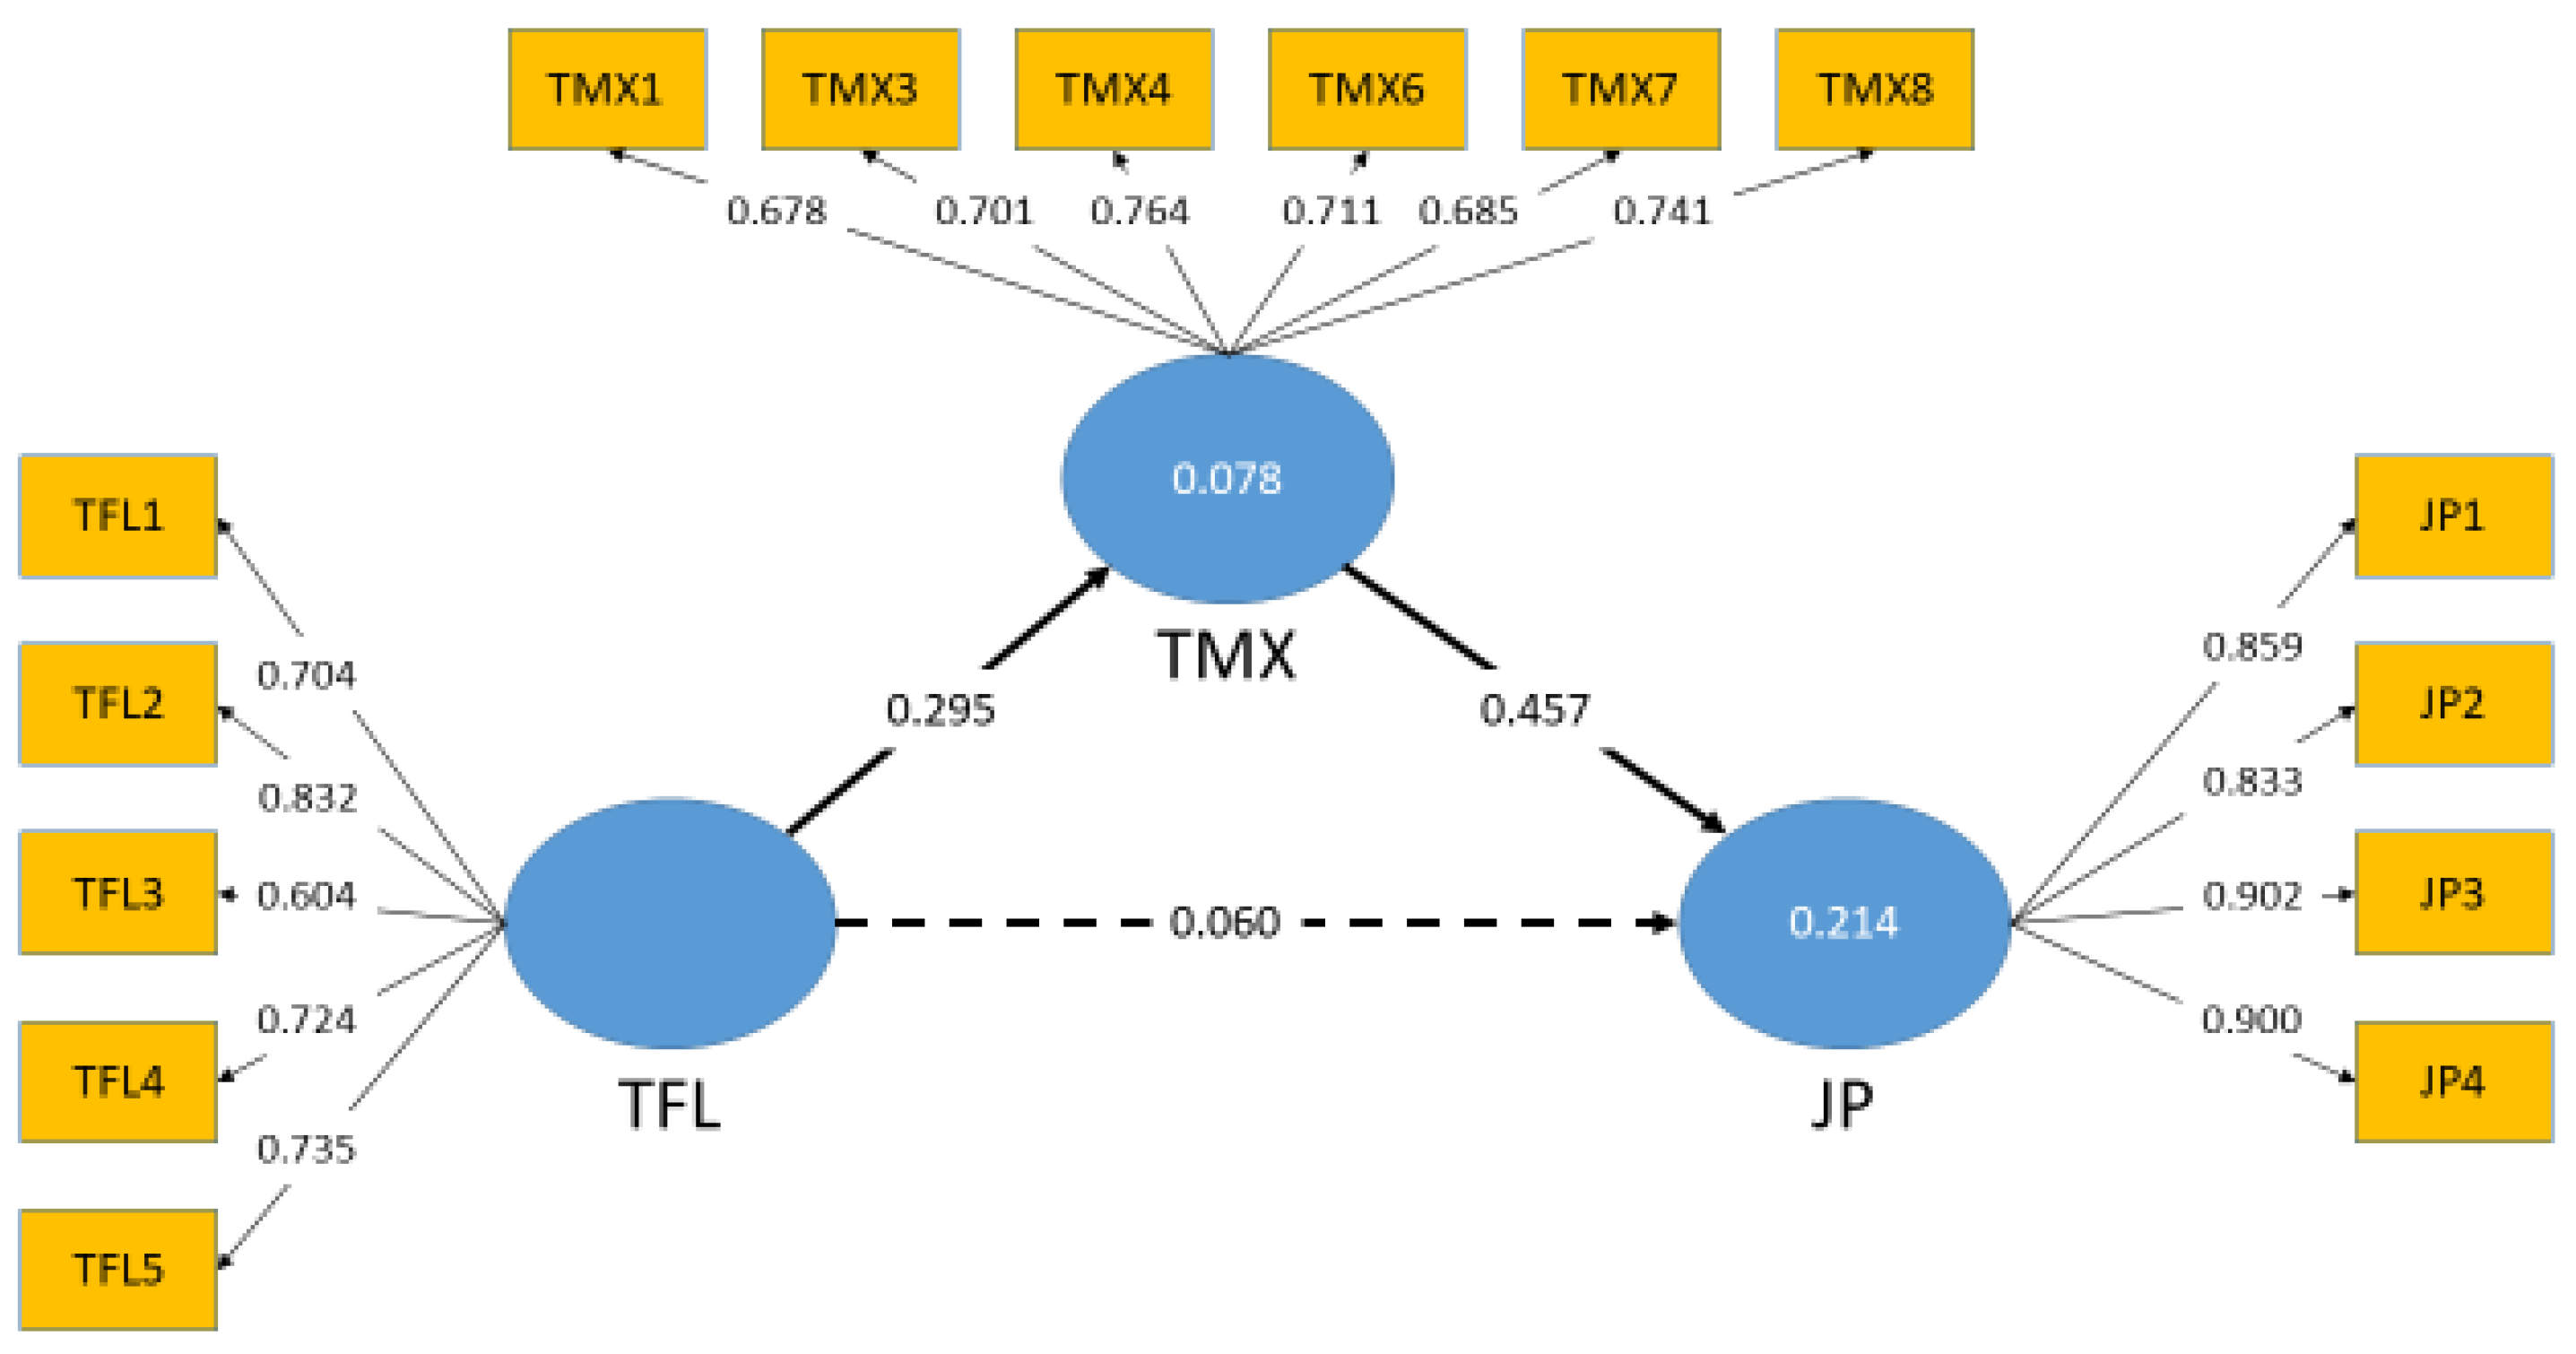
In Figure 2, the relationships between the latent variables are depicted. A solid line between two latent variables means that there exists a significant relationship (where p < 0.05), whilst a dotted line indicates an insignificant relationship (where p ≥ 0.05). The number on the line between two latent variables shows the respective path coefficient value, indicating the strength of the relationship. The number on a dependent variable shows the R2 value. The numbers on the lines connecting between a latent variable and its scale items are the outer loading values of the scale items.
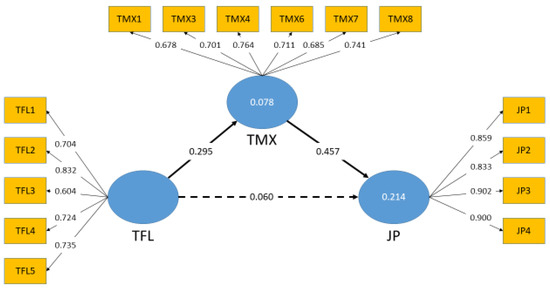
Figure 2.
Results of PLS-SEM analysis.
4.3. Hypothesis Testing
As shown in Table 8 and Figure 2, the path coefficient value for the relationship between TFL and TMX was 0.295 (where p < 0.05), indicating that TFL was positively related to TMX with statistical significance. The path coefficient value for the relationship between TFL and JP was 0.060 (where p ≥ 0.05), indicating that the positive relationship between TFL and JP was not statistically significant. The path coefficient value for the relationship between TMX and JP was 0.457 (where p < 0.05), indicating that TMX was positively related to JP with statistical significance.
Mediation analysis determines whether a dependent variable is influenced by an independent variable directly or indirectly to determine if a mediating factor exists in a structural model. It also evaluates the strength of a mediation and determines whether a mediation is full or partial [71]. In the current study, the direct relationship between TFL and JP was insignificant, but significant and positive relationships between TFL and TMX and between TMX and JP were found. Therefore, the mediation effect of TMX was confirmed. The positive relationship between TFL and JP was fully mediated by TMX. Table 10 shows the hypothesis testing results.
Table 10.
Results of hypothesis testing.
5. Discussion and Conclusions
PWD employment can be a solution to the severe labor shortage problem in Hong Kong. The current study aims to examine the relationships between leadership style, horizontal social exchange between team members, and PWDs’ job performance to produce empirical evidence on how leadership style and the horizontal social exchange quality influence PWDs’ performance.
5.1. Theoretical Implications
The current study addresses the scarcity of research on the relationships between organizational behaviors and PWD employment. TFL is often found to have a direct link with employee performance [15]. Contrary to prior research, the current study did not find any direct relationship between TFL and JP. On the other hand, prior research suggested that the impact of TFL on certain favorable employee outcomes may be mediated by a mediating factor [29]. The current study reconfirmed that the relationship between TFL and JP was fully mediated by TMX.
5.2. Practical Implications
Parr et al. [72] argued that amongst the four TFL dimensions, individualized consideration has the strongest positive impact on PWDs’ performance. Leaders tend to pay more attention to PWDs in their team. However, other employees may think leaders’ special attention is unfair [73]. They may even feel that their self-interest is affected [74]. A truly inclusive workplace requires employees’ adaptive behaviors toward PWDs [8]. Transformational leaders’ idealized influence and role modelling can transform employees’ personal values, beliefs, and attitudes [29], and influence them to provide support to PWDs [33]. Furthermore, inspirational motivation enhances a team’s inclusiveness [75] and positive diversity attitudes [76]. In conclusion, TFL is a favorable factor for PWD employment, but it does not have a direct link with PWDs’ performance. It drives TMX, which in turn supports PWDs’ performance. Leaders should adopt TFL as their leadership style, but they should demonstrate TFL behaviors toward all employees and not only pay attention to PWDs.
Employers are recommended to provide transformational leadership training to PWDs’ supervisors. They should also communicate the purpose of creating an inclusive workplace to employees and organize sensitizing training and team-building activities for PWDs’ coworkers to improve the team-member exchange quality of the team.
5.3. Limitations and Future Studies
Employee performance is best examined via longitudinal research [77]. However, the current research was a cross-sectional study due to the rarity of PWD employment cases and the difficulties in inviting employers to provide input more than once. Furthermore, employees’ true contributions can only be imperfectly evaluated [78]. Subjective performance evaluations by direct supervisors of PWDs may contain inconsistencies due to the contextual dissimilarity [79].
Transactional leaders use their bureaucratic powers to influence whilst transformational leaders use their charismas to lead [80]. TFL augments transactional leadership [81]. Both TFL and transaction leadership have positive relationships with favorable employee outcomes [82]. Furthermore, authentic leadership is a strong driver of inclusion [83]. It is positively related to PWDs’ performance [84] (pp. 281–302) and has more concrete and individualized approaches that may be more suitable for PWDs [72]. Future studies on the impact of transactional leadership and authentic leadership on PWD employment are recommended.
Funding
This research received no external funding.
Institutional Review Board Statement
The study was conducted in accordance with the Declaration of Helsinki, and approved by the Institutional Review Board (or Ethics Committee) of SBS Swiss Business School (protocol code 7598).
Informed Consent Statement
Informed consent was obtained from all subjects involved in the study.
Data Availability Statement
The raw data supporting the conclusions of this article will be made available by the authors on request.
Conflicts of Interest
The author declares no conflict of interest.
References
- CFO Innovation Asia. Hong Kong Employers Confident about Talent Search Despite Continuing Shortage; CFO Innovation Asia: Singapore, Singapore, 2018; p. 1. [Google Scholar]
- Herman, R. Where Have All the Workers Gone? American Drycleaner (Crain Communications Inc.): Detroit, MI, USA, 2001; Volume 68, pp. 110–111.
- The HKSAR Government. Social Data Collected via the General Household Survey: Special Topics Report-Report No.63-Persons with Disabilities and Chronic Diseases; Census and Statistics Department, The HKSAR Government: Hong Kong, China, 2021.
- Ashley, D.; Graf, N.M. The process and experiences of self-employment among people with disabilities: A qualitative study. Rehabil. Couns. Bull. 2018, 61, 90–100. [Google Scholar] [CrossRef]
- Yeung, R. Study Shows Hong Kong’s Disabled Face Harsh Employment Reality. South China Morning Post. 13 September 2016. Available online: https://www.scmp.com/news/hong-kong/health-environment/article/2019017/study-shows-hong-kongs-disabled-face-harsh (accessed on 11 April 2020).
- The Hong Kong Federation of Youth Groups. Press Release 2018-Youth Research Centre. 27 November 2018. Available online: https://yrc.hkfyg.org.hk/en/latest-news/press-release/press-release-2018/ (accessed on 28 February 2020).
- Dajnoki, K. Judgment of the factors influencing the integration of the employees with disabilities or reduced work capacity into workplaces in the Northern Great Plain Region. Ann. Univ. Oradea Econ. Sci. Ser. 2015, 24, 506–514. [Google Scholar]
- Moore, J.R.; Maxey, E.C.; Waite, A.M.; Wendover, J.D. Inclusive organizations: Developmental reciprocity through authentic leader-employee relationships. J. Manag. Dev. 2020, 39, 1029–1039. [Google Scholar] [CrossRef]
- Cubero, C.G. Situational leadership and persons with disabilities. Work 2007, 29, 351–356. [Google Scholar]
- Burns, J.M. Leadership; Harper & Row: New York, NY, USA, 1978; pp. 241–256. [Google Scholar]
- Bass, B.M. Face to face—Power to change: A conversation with Bernard M. Bass. Leadersh. Action 2003, 23, 9–11. [Google Scholar] [CrossRef]
- Barbinta, A.; Dan, I.S.; Muresan, C. Bernard Bass-Founder of the transformational leadership theory. Rev. Manag. Econ. Eng. 2007, 16, 758–762. [Google Scholar]
- Bjekic, R.; Jelaca, M.S.; Maric, S. The importance of active leadership style for organisational innovativeness. Econ. Themes 2019, 57, 481–495. [Google Scholar] [CrossRef]
- Lin, C.-C.; Lu, C.-S. Cultural differences and job performance in container shipping: A social exchange theory perspective. Marit. Policy Manag. 2021, 50, 157–181. [Google Scholar] [CrossRef]
- Neto, M.T.; de Araujo, R.N.; Ferreira, C.A. Leadership theories and individual performance. Pensam. Gest. 2019, 47, 148–179. [Google Scholar]
- Lengnick-Hall, M.L.; Gaunt, P.M.; Kulkarni, M. Overlooked and underutilized: People with disabilities are an untapped human resource. Hum. Resour. Manag. 2008, 47, 255–273. [Google Scholar] [CrossRef]
- Seers, A.; Petty, M.M.; Cashman, J.F. Team-member exchange under team and traditional management. Group Organ. Manag. 1995, 20, 18–38. [Google Scholar] [CrossRef]
- Tse, H.H. Linking leader-member exchange differentiation to work team performance. Leadersh. Organ. Dev. J. 2014, 35, 710–724. [Google Scholar] [CrossRef]
- Shier, M.; Graham, J.R.; Jones, M.E. Barriers to employment as experienced by disabled people: A qualitative analysis in Calgary and Regina, Canada. Disabil. Soc. 2009, 24, 63–75. [Google Scholar] [CrossRef]
- Lorinkova, N.M.; Perry, S.J. The importance of group-focused transformational leadership and felt obligation for helping and group performance. J. Organ. Behav. 2019, 40, 231–247. [Google Scholar] [CrossRef]
- Curcuruto, M.; Conchie, S.M.; Griffin, M.A. Safety citizenship behavior (SCB) in the workplace: A stable construct? Analysis of psychometric invariance across four European countries. Accid. Anal. Prev. 2019, 129, 190–201. [Google Scholar] [CrossRef]
- Kensbock, J.M.; Boehm, S.A. The role of transformational leadership in the mental health and job performance of employees with disabilities. Int. J. Hum. Resour. Manag. 2016, 27, 1580–1609. [Google Scholar] [CrossRef]
- Bass, B.M. Is there universality in the full range model of leadership? Int. J. Public Adm. 1996, 19, 731–761. [Google Scholar] [CrossRef]
- Koveshnikov, A.; Ehrnrooth, M. The cross-cultural variation of the effects of transformational leadership behaviors on followers’ organizational identification: The case of idealized influence and individualized consideration in Finland and Russia. Manag. Organ. Rev. 2018, 14, 747–779. [Google Scholar] [CrossRef]
- Kim, M.; Choi, L.; Borchgrevink, C.P.; Knutson, B.; Cha, J. Effects of gen Y hotel employee’s voice and team-member exchange on satisfaction and affective commitment between the U.S. and China. Int. J. Contemp. Hosp. Manag. 2018, 30, 2230–2248. [Google Scholar] [CrossRef]
- Szeto, E. How do principals’ practices reflect democratic leadership for inclusion in diverse school settings? A Hong Kong case study. Educ. Manag. Adm. Leadersh. 2021, 49, 471–492. [Google Scholar] [CrossRef]
- Zhu, X.; Law, K.S.; Sun, C.; Yang, D. Thriving of employees with disabilities: The roles of job self-efficacy, inclusion, and team-learning climate. Hum. Resour. Manag. 2019, 58, 21–34. [Google Scholar] [CrossRef]
- Seers, A. Team-member exchange quality: A new construct for role-making research. Organ. Behav. Hum. Decis. Process. 1989, 43, 118–135. [Google Scholar] [CrossRef]
- Podsakoff, P.M.; MacKenzie, S.B.; Moorman, R.H.; Fetter, R. Transformational leader behaviors and their effects on followers’ trust in leader, satisfaction, and organizational citizenship behaviors. Leadersh. Q. 1990, 1, 107–142. [Google Scholar] [CrossRef]
- Dwivedi, P.; Chaturvedi, V.; Vashist, J.K. Transformational leadership and employee efficiency: Knowledge sharing as mediator. Benchmarking Int. J. 2020, 27, 1571–1590. [Google Scholar] [CrossRef]
- Brown, S.; Marinan, J.; Partridge, M.A. The moderating effect of servant leadership on transformational, transactional, authentic, and charismatic leadership. J. Int. Bus. Discip. 2020, 15, 67–86. [Google Scholar]
- Judge, T.A.; Piccolo, R.F. Transformational and transactional leadership: A meta-analytic test of their relative validity. J. Appl. Psychol. 2004, 89, 755–768. [Google Scholar] [CrossRef]
- Van Knippenberg, D.; Sitkin, S.B. A critical assessment of charismatic-Transformational leadership research: Back to the drawing board? Acad. Manag. Ann. 2013, 7, 1–60. [Google Scholar] [CrossRef]
- Veshne, N.A.; Munshi, M.M. Enhancing employee engagement through emotionally intelligent leaders. Srusti Manag. Rev. 2020, 13, 32–39. [Google Scholar]
- Hirst, G.; van Dick, R.; van Knippenberg, D. A social identity perspective on leadership and employee creativity. J. Organ. Behav. 2009, 30, 963–982. [Google Scholar] [CrossRef]
- Martinez-Corcoles, M.; Stephanou, K.D.; Schobel, M. Exploring the effects of leaders’ individualized consideration in extreme contexts. J. Risk Res. 2020, 23, 167–180. [Google Scholar] [CrossRef]
- Settoon, R.P.; Mossholder, K.W. Relationship quality and relationship context as antecedents of person- and task-focused interpersonal citizenship behavior. J. Appl. Psychol. 2002, 87, 255–267. [Google Scholar] [CrossRef]
- Liden, R.C.; Wayne, S.J.; Sparrowe, R.T.; Liden, R.C.; Wayne, S.J.; Sparrowe, R.T. An examination of the mediating role of psychological empowerment on the relations between the job, interpersonal relationships, and work outcomes. J. Appl. Psychol. 2000, 85, 407–416. [Google Scholar] [CrossRef]
- Farh, C.I.; Lanaj, K.; Ilies, R. Resource-based contingencies of when team-member exchange helps member performance in teams. Acad. Manag. J. 2017, 60, 1117–1137. [Google Scholar] [CrossRef]
- Liu, Y.; Loi, R.; Lam, L.W. Linking organizational identification and employee performance in teams: The moderating role of team-member exchange. Int. J. Hum. Resour. Manag. 2011, 22, 3187–3201. [Google Scholar] [CrossRef]
- Sykes, T.A.; Venkatesh, V. Explaining post-implementation employee system use and job performance: Impacts of the content and source of social network ties. MIS Q. 2017, 41, 917–936. [Google Scholar] [CrossRef]
- Van Scotter, J.R.; Motowidlo, S.J.; Cross, T.C. Effects of task performance and contextual performance on systemic rewards. J. Appl. Psychol. 2000, 85, 526–535. [Google Scholar] [CrossRef]
- Dhammika, K.A.; Ahmad, F.B.; Sam, T.L. Job satisfaction, commitment and performance: Testing the goodness of measures of three employee outcomes. South Asian J. Manag. 2012, 19, 7–22. [Google Scholar]
- Koys, D.J. The effects of employee satisfaction, organisational citizenship behavior, and turnover on organisational effectiveness: A unit-level, longitudinal study. Pers. Psychol. 2001, 54, 101–114. [Google Scholar] [CrossRef]
- Eka, F.; Herminingsih, A. The effect of organizational communication and job satisfaction on employee engagement and employee performance at PT. Abyor International. Dinasti Int. J. Educ. Manag. Soc. Sci. 2020, 1, 479–489. [Google Scholar] [CrossRef]
- Fox, C.; Webster, B.D.; Casper, W.C. Spirituality, psychological capital and employee performance: An empirical examination. J. Manag. Issues 2018, 2, 194–213. [Google Scholar]
- Wikaningrum, T. Coworker exchange, leader-member exchange, and work attitudes: A study of coworker dyads. Gadjah Mada Int. J. Bus. 2007, 9, 187–215. [Google Scholar] [CrossRef]
- Trepanier, S.-G.; Fernet, C.; Austin, S. Social and motivational antecedents of perceptions of transformational leadership: A self-determination theory perspective. Can. J. Behav. Sci. 2012, 44, 272–277. [Google Scholar] [CrossRef]
- Yin, J.; Ma, Z.; Yu, H.; Jia, M.; Liao, G. Transformational leadership and employee knowledge sharing: Explore the mediating roles of psychological safety and team efficacy. J. Knowl. Manag. 2020, 24, 150–171. [Google Scholar] [CrossRef]
- Bass, B.M. From transactional to transformational leadership: Learning to share the vision. Organ. Dyn. 1990, 18, 19–31. [Google Scholar] [CrossRef]
- Bass, B.M.; Jung, D.I.; Avolio, B.J.; Berson, Y. Predicting unit performance by assessing transformational and transactional leadership. J. Appl. Psychol. 2003, 88, 207–218. [Google Scholar] [CrossRef]
- Imran, R.; Shabbir, M.S.; Mahmood, A. High-performance work system: An important link between transformational leadership and job performance. Pol. J. Manag. Stud. 2020, 22, 217–230. [Google Scholar] [CrossRef]
- De Stobbeleir, K.; Ashford, S.J. The power of peers: Antecedents and outcomes of peer feedback seeking behavior. Acad. Manag. Annu. Meet. Proc. 2014, 2014, 1058–1063. [Google Scholar] [CrossRef]
- Hayes, A.F.; Scharkow, M. The relative trustworthiness of inferential tests of the indirect effect in statistical mediation analysis: Does method really matter? Psychol. Sci. 2013, 24, 1918–1927. [Google Scholar] [CrossRef]
- Siddiqui, K. Heuristics for sample size determination in multivariate statistical techniques. World Appl. Sci. J. 2013, 27, 285–287. [Google Scholar]
- Lewis, J.R. Multipoint scales: Mean and median differences and observed significance levels. Int. J. Hum. Comput. Interact. 1993, 5, 383–392. [Google Scholar] [CrossRef]
- Finstad, K. The usability metric for user experience. Interact. Comput. 2010, 22, 323–327. [Google Scholar] [CrossRef]
- Bass, B.M. Leadership and Performance beyond Expectations; The Free Press: New York, NY, USA, 1985. [Google Scholar]
- Williams, L.J.; Anderson, S.E. Job satisfaction and organizational commitment as predictors of organizational citizenship and in-role behaviors. J. Manag. 1991, 17, 601–617. [Google Scholar] [CrossRef]
- Rigdon, E. Choosing PLS path modeling as analytical method in European management research: A realist perspective. Eur. Manag. J. 2016, 34, 598–605. [Google Scholar] [CrossRef]
- Hair, J.F.; Sarstedt, M.; Hopkins, L.; Kuppelwieser, V. Partial least squares structural equation modeling (PLS-SEM): An emerging tool for business research. Eur. Bus. Rev. 2014, 26, 106–121. [Google Scholar] [CrossRef]
- Koran, J. Indicators per factor in confirmatory factor analysis: More is not always better. Struct. Equ. Model. A Multidiscip. J. 2020, 27, 765–772. [Google Scholar] [CrossRef]
- Marsh, H.W.; Hau, K.-T.; Balla, J.R.; Grayson, D. Is more ever too much? The number of indicators per factor in confirmatory factor analysis. Multivar. Behav. Res. 1998, 33, 181–220. [Google Scholar] [CrossRef] [PubMed]
- Robinson, M.A. Using multi-item psychometric scales for research and practice in human resource management. Hum. Resour. Manag. 2017, 57, 739–750. [Google Scholar] [CrossRef]
- Hair, J.F.; Ringle, C.M.; Sarstedt, M. PLS-SEM: Indeed a silver bullet. J. Mark. Theory Pract. 2011, 19, 139–151. [Google Scholar] [CrossRef]
- Kline, R.B. Principles and Practice of Structural Equation Modeling, 4th ed.; The Guilford Press: New York, NY, USA, 2015; pp. 7–24. [Google Scholar]
- Fornell, C.; Larcker, D.F. Structural equation models with unobservable variables and measurement error: Algebra and statistics. J. Mark. Res. 1981, 18, 382–388. [Google Scholar] [CrossRef]
- Gefen, D.; Straub, D. A practical guide to factorial validity using PLSGraph: Tutorial and annotated example. Commun. Assoc. Inf. Syst. 2005, 16, 91–109. [Google Scholar]
- Henseler, J.; Ringle, C.M.; Sarstedt, M. A new criterion for assessing discriminant validity in variance-based structural equation modeling. J. Acad. Mark. Sci. 2015, 43, 115–135. [Google Scholar] [CrossRef]
- Huck, S.W. Reading Statistics and Research, 6th ed.; Pearson: Boston, MA, USA, 2012; pp. 68–89. [Google Scholar]
- Iacobucci, D. Mediation Analysis and Categorical Variables: The final frontier. J. Consum. Psychol. 2012, 22, 582–594. [Google Scholar] [CrossRef]
- Parr, A.D.; Hunter, S.T.; Ligon, G.S. Questioning universal applicability of transformational leadership: Examining employees with autism spectrum disorder. Leadersh. Q. 2013, 24, 608–622. [Google Scholar] [CrossRef]
- Tulk, C.; Mantler, J.; Dupre, K.E. The impact of job accommodations on stereotyping and emotional responses to coworkers with anxiety or depression. Can. J. Behav. Sci. 2021, 53, 138–151. [Google Scholar] [CrossRef]
- Harcourt, M.; Lam, H.; Harcourt, S. Discriminatory practices in hiring: Institutional and rational economic perspectives. Int. J. Hum. Resour. Manag. 2005, 16, 2113–2132. [Google Scholar] [CrossRef]
- Lauring, J.; Jonasson, C. Can leadership compensate for deficient inclusiveness in global virtual teams? Hum. Resour. Manag. J. 2018, 28, 392–409. [Google Scholar] [CrossRef]
- Homan, A.C.; Greer, L.L. Considering diversity: The positive effects of considerate leadership in diverse teams. Group Process. Intergroup Relat. 2013, 16, 105–125. [Google Scholar] [CrossRef]
- Guest, D.E. Human resource management and performance: Still searching for some answers. Hum. Resouce Manag. J. 2011, 21, 3–13. [Google Scholar] [CrossRef]
- Kragl, J.; Schottner, A. Wage floors, imperfect performance measures, and optimal job design. Int. Econ. Rev. 2014, 55, 525–550. [Google Scholar] [CrossRef]
- Speer, A.B.; Siver, S.R.; Christiansen, N.D. Applying theory to the black box: A model for empirically scoring biodata. Int. J. Sel. Assess. 2020, 28, 68–84. [Google Scholar] [CrossRef]
- Weber, M. The Theory of Social and Economic Organization; The Free Press: New York, NY, USA, 2009. [Google Scholar]
- Bass, B.M. Leadership: Good, better, best. Organ. Dyn. 1985, 13, 26–40. [Google Scholar] [CrossRef]
- Abasilim, U.D.; Gberevbie, D.E.; Osibanjo, A. Canonical analysis of perceived leadership styles and employees’ commitment in Nigeria. In Proceedings of the European Conference on Management, Leadership & Governance, Utrecht, The Netherlands, 2 October 2018; pp. 317–322. [Google Scholar]
- Boekhorst, J.A. The role of authentic leadership in fostering workplace inclusion: A social information processing perspective. Hum. Resour. Manag. 2015, 54, 241–264. [Google Scholar] [CrossRef]
- Hurley-Hanson, A.E.; Giannantonio, C.M. LMX and autism: Effective working relationships. In Leading Diversity in the 21st Century; Scandura, T.A., Mourino, E., Eds.; Information Age Publishing: Charlotte, NC, USA, 2017; pp. 281–302. [Google Scholar]

Disclaimer/Publisher’s Note: The statements, opinions and data contained in all publications are solely those of the individual author(s) and contributor(s) and not of MDPI and/or the editor(s). MDPI and/or the editor(s) disclaim responsibility for any injury to people or property resulting from any ideas, methods, instructions or products referred to in the content. |
© 2024 by the author. Licensee MDPI, Basel, Switzerland. This article is an open access article distributed under the terms and conditions of the Creative Commons Attribution (CC BY) license (https://creativecommons.org/licenses/by/4.0/).