
Application of Artificial Intelligence Methods Depending on the Tasks Solved during COVID-19 Pandemic

 , ,
, ,
Abstract
:1. Introduction
2. Materials and Methods
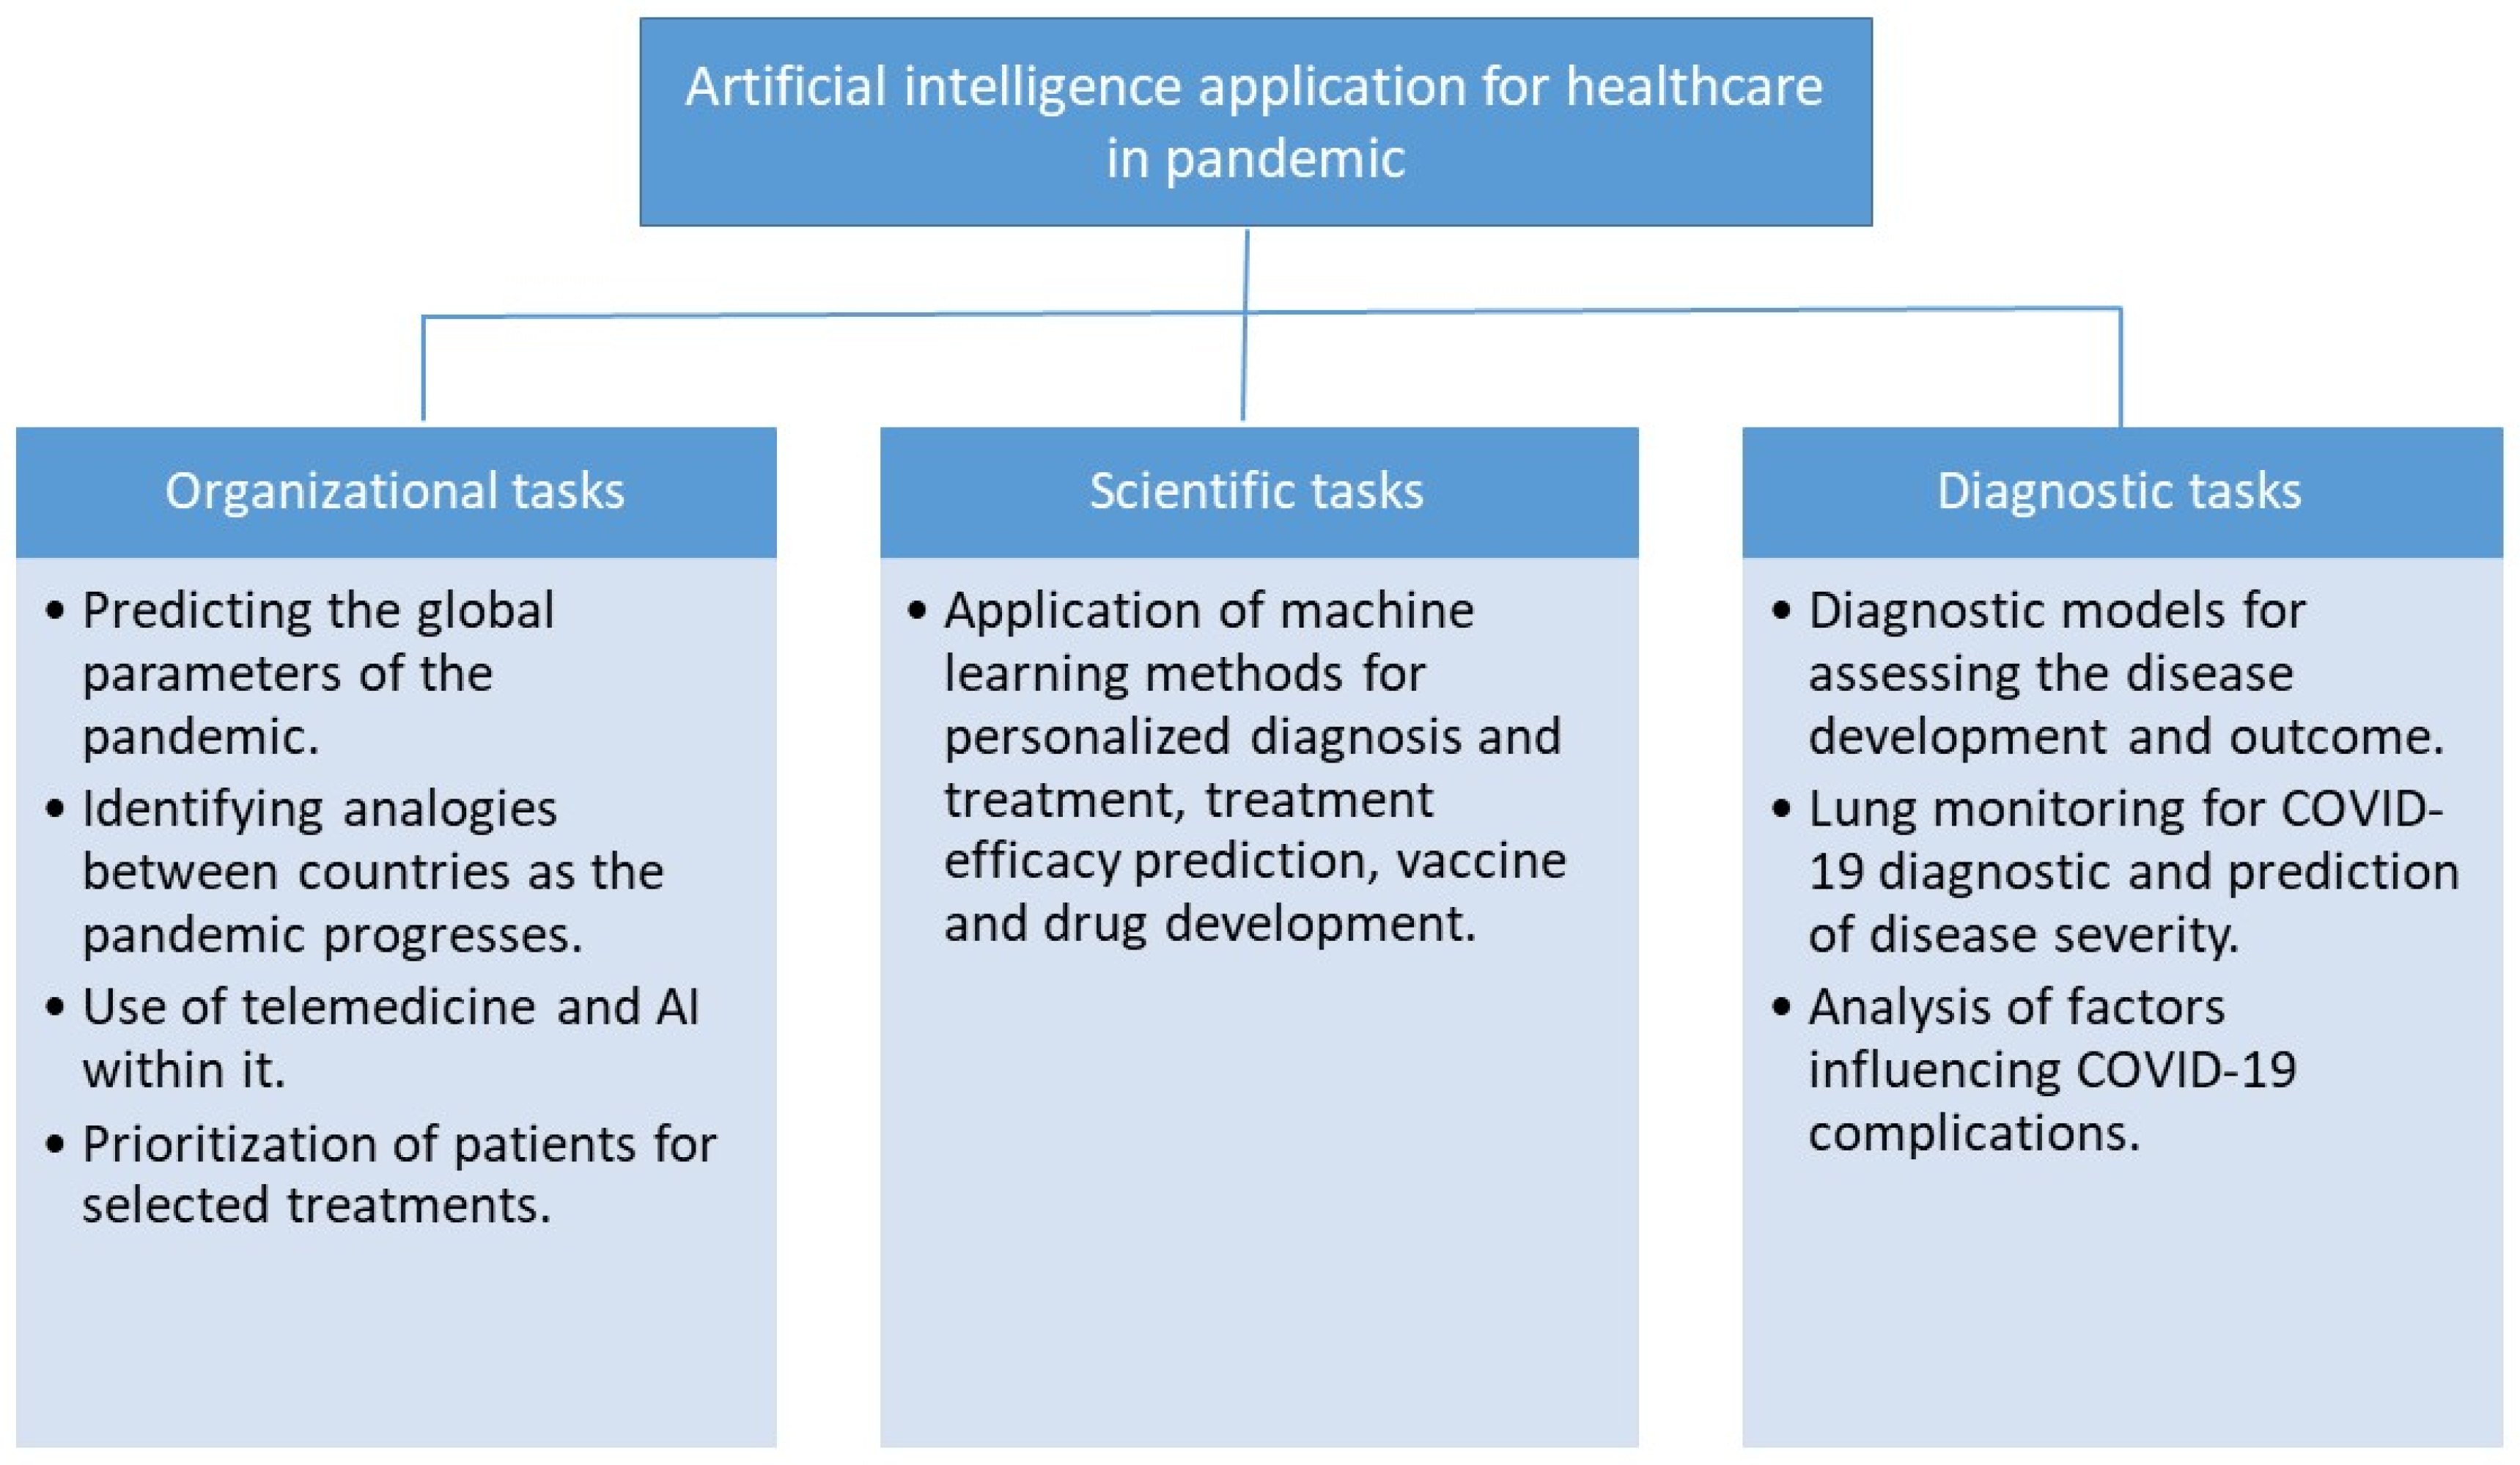
3. Results and Discussion
3.1. Organizational Task
3.1.1. Predicting the Global Parameters of the Pandemic
3.1.2. Research Identifies Similar Variants of the Disease Development When Comparing the Dynamics of Patients’ Treatment
3.1.3. General Review Papers on the Use of Telemedicine and AI within It Contain a Minimum of Specific Information on Solutions within the AI-Based CDSS
3.1.4. The Task to Prioritize Patients for Selected Treatments Based on Their Individual Characteristics (e.g., Blood Types) and the Severity of the Current Condition [27,28,29]
3.2. Research Tasks
Application of Machine Learning Methods in DNA Analysis for Mutation Detection, Personalized Diagnosis and Treatment, Treatment Efficacy Prediction [33,34], Vaccine Development [35] and Drug Development [36]
3.3. Diagnostics Tasks
3.3.1. Diagnostic Models Aimed at Assessing the Likelihood of Any Manifestation of the Disease, Its Development and Outcome
3.3.2. One of the Diagnostic Use of CDSS Is Lung Monitoring Based on Classical X-ray and CT Image Analysis Both for Direct Diagnosis of COVID-19 [55] and for Separating Pneumonia into Bacterial and Disease-Induced COVID-19 [56]
3.3.3. Analysis of Factors in the Diagnosis of COVID-19 and Complications [79]
- -
- Accuracy—the proportion of correctly defined examples. It is easy to understand and interpret. However, with unbalanced data sets it is not indicative and cannot be used as a quality criterion, because the less represented class, within which the greatest number of errors are made when targeting with a given metric, as a rule, is more important;
- -
- AUC (area under curve) is the area under the curve of the proportion of correct positive predictions versus the false positive predictions proportion;
- -
- Sensitivity and Specificity—the proportion of correctly predicted positive labels (true positives) and correctly predicted negative labels (true negative);
- -
- Coefficient of determination (R2)—proportion of the variance of the dependent variable, explained by the model under consideration;
- -
- Precision—shows what proportion of objects recognized as objects of a positive class is predicted correctly;
- -
- Recall—shows what proportion of objects that actually belong to the positive class is predicted correctly;
- -
- F1 is a metric that combines precision and recall with equal priority.
4. Conclusions
Author Contributions
Funding
Institutional Review Board Statement
Informed Consent Statement
Data Availability Statement
Conflicts of Interest
References
- ECDC. Rapid Risk Assessment: Novel Coronavirus Disease 2019 (COVID-19) Pandemic: Increased Transmission in the EU/EEA and the UK—Sixth Update. Available online: https://www.ecdc.europa.eu/en/publications-data/rapid-risk-assessment-novel-coronavirus-disease-2019-covid-19-pandemic-increased (accessed on 20 May 2022).
- WHO. Strengthening the Health Systems Response to COVID-19. Available online: https://apps.who.int/iris/handle/10665/332783?locale-attribute=pt& (accessed on 20 May 2022).
- Zubair, M. An Efficient K-Means Clustering Algorithm for Analysing COVID-19. Available online: http://arxiv.org/abs/2101.03140 (accessed on 20 May 2022).
- Indumathi, N.; Eswari, S.M.; Salau, A.O.; Ramalakshmi, R.; Revathy, R. Prediction of COVID-19 Outbreak with Current Substantiation Using Machine Learning Algorithms; Springer: Singapore, 2021; pp. 171–190. [Google Scholar]
- Mahmoud, K.; Bebiş, H.; Usman, A.G.; Salihu, A.N.; Gaya, M.S.; Dalhat, U.F.; Abdulkadir, R.A.; Jibril, M.B.; Abba, S.I. Prediction of the effects of environmental factors towards COVID-19 outbreak using AI-based models. IAES Int. J. Artif. Intell. (IJ-AI) 2021, 10, 35–42. [Google Scholar] [CrossRef]
- Ayyoubzadeh, S.M.; Zahedi, H.; Ahmadi, M.; Kalhori, S.R.N. Predicting COVID-19 Incidence Through Analysis of Google Trends Data in Iran: Data Mining and Deep Learning Pilot Study. JMIR Public Health Surveill. 2020, 6, e18828. [Google Scholar] [CrossRef] [PubMed]
- Bhat, M.; Suvarna, B.; Nandipati, B.L. Nirupama Support vector regression for predicting COVID-19 cases. Eur. J. Mol. Clin. Med. 2020, 7, 4882–4893. [Google Scholar]
- Khan, F.; Saeed, A.; Ali, S. Modelling and forecasting of new cases, deaths and recover cases of COVID-19 by using Vector Autoregressive model in Pakistan. Chaos Solitons Fractals. 2020, 140, 110189. [Google Scholar] [CrossRef]
- Dumitras, A. Forecasting the Stability of COVID-19 on Indian Dataset with Prophet Logistic Growth Model. Available online: https://www.researchsquare.com (accessed on 17 May 2022).
- Gupta, A.; Gharehgozli, A. Developing a Machine Learning Framework to Determine the Spread of COVID-19. Int. J. Data Min. Model. Manag. 2022, 14, 89–109. [Google Scholar] [CrossRef]
- Gupta, M.; Jain, R.; Arora, S.; Gupta, A.; Javed Awan, M.; Chaudhary, G.; Nobanee, H. AI-enabled COVID-9 Outbreak Analysis and Prediction: Indian States vs. Union Territories. Comput. Mater. Contin. 2021, 67, 933–950. [Google Scholar] [CrossRef]
- Behnood, A.; Golafshani, E.M.; Hosseini, S.M. Determinants of the infection rate of the COVID-19 in the U.S. using ANFIS and virus optimization algorithm (VOA). Chaos Solitons Fractals 2020, 139, 110051. [Google Scholar] [CrossRef]
- Uddin, M.I.; Shah, S.A.A.; Al-Khasawneh, M.A. A Novel Deep Convolutional Neural Network Model to Monitor People following Guidelines to Avoid COVID-19. J. Sens. 2020, 2020, 8856801. [Google Scholar] [CrossRef]
- Zeroual, A.; Harrou, F.; Abdelkader, D.; Sun, Y. Deep Learning Methods for Forecasting COVID-19 Time-Series Data: A Comparative Study. Chaos Solitons Fractals 2020, 140, 110121. [Google Scholar] [CrossRef]
- Farooq, J.; Bazaz, A. A novel adaptive deep learning model of Covid-19 with focus on mortality reduction strategies. Chaos Solitons Fractals 2020, 138, 110148. [Google Scholar] [CrossRef]
- Car, Z.; Baressi Šegota, S.; Anđelić, N.; Lorencin, I.; Mrzljak, V. Modeling the Spread of COVID-19 Infection Using a Multilayer Perceptron. Comput. Math. Methods Med. 2020, 2020, 5714714. [Google Scholar] [CrossRef] [PubMed]
- Pandianchery, M.S.; Ravi, V. Explainable AI Framework for COVID-19 Prediction in Different Provinces of India. arXiv 2022, arXiv:2201.06997. [Google Scholar]
- Guo, Q.; He, Z. Prediction of the confirmed cases and deaths of global COVID-19 using artificial intelligence. Environ. Sci. Pollut. Res. 2021, 28, 11672–11682. [Google Scholar] [CrossRef] [PubMed]
- Anđelić, N.; Baressi Šegota, S.; Lorencin, I.; Mrzljak, V.; Car, Z. Estimation of COVID-19 epidemic curves using genetic programming algorithm. Health Inform. J. 2021, 27, 1460458220976728. [Google Scholar] [CrossRef] [PubMed]
- Feng, S.; Feng, Z.; Ling, C.; Chang, C.; Feng, Z. Prediction of the COVID-19 epidemic trends based on SEIR and AI models. PLoS ONE 2021, 16, e0245101. [Google Scholar] [CrossRef]
- Hasan, I.; Dhawan, P.; Rizvi, S.A.; Dhir, S. Data analytics and knowledge management approach for COVID-19 prediction and control. Int. J. Inf. Technol. 2022, 11, 1–18. [Google Scholar] [CrossRef]
- Tiwari, D.; Bhati, B.S.; Al-Turjman, F.; Nagpal, B. Pandemic coronavirus disease (Covid-19): World effects analysis and prediction using machine-learning techniques. Expert Syst. 2022, 39, e12714. [Google Scholar] [CrossRef]
- Chatterjee, P.; Tesis, A.; Cymberknop, L.J.; Armentano, R.L. Internet of Things and Artificial Intelligence in Healthcare During COVID-19 Pandemic—A South American Perspective. Front. Public Health 2020, 8, 600213. [Google Scholar] [CrossRef]
- Jesmin, S.; Kaiser, M.S.; Mahmud, M. Artificial and Internet of Healthcare Things Based Alzheimer Care During COVID 19. In International Conference on Brain Informatics; Springer International Publishing: Manhattan, NY, USA, 2020; pp. 263–274. [Google Scholar]
- Almallah, Y.Z.; Doyle, D.J. Telehealth in the time of Corona: ‘doctor in the house’. Intern. Med. J. 2020, 50, 1578–1583. [Google Scholar] [CrossRef]
- Albert, L.; Capel, I.; García-Sáez, G.; Martín-Redondo, P.; Hernando, M.E.; Rigla, M. Managing gestational diabetes mellitus using a smartphone application with artificial intelligence (SineDie) during the COVID-19 pandemic: Much more than just telemedicine. Diabetes Res. Clin. Pract. 2020, 169, 108396. [Google Scholar] [CrossRef]
- Xu, W.; Sun, N.N.; Gao, H.N.; Chen, Z.Y.; Yang, Y.; Ju, B.; Tang, L.L. Risk factors analysis of COVID-19 patients with ARDS and prediction based on machine learning. Sci. Rep. 2021, 11, 2933. [Google Scholar] [CrossRef] [PubMed]
- Albahri, O.S.; Al-Obaidi, J.R.; Zaidan, A.A.; Albahri, A.S.; Zaidan, B.B.; Salih, M.M.; Qays, A.; Dawood, K.A.; Mohammed, R.T.; Abdulkareem, K.H.; et al. Helping doctors hasten COVID-19 treatment: Towards a rescue framework for the transfusion of best convalescent plasma to the most critical patients based on biological requirements via ml and novel MCDM methods. Comput. Methods Programs Biomed. 2020, 196, 105617. [Google Scholar] [CrossRef] [PubMed]
- Schwab, P.; Schütte, A.D.; Dietz, B.; Bauer, S. Clinical Predictive Models for COVID-19: Systematic Study. J. Med. Internet Res. 2020, 22, e21439, ISSN 1438-8871. [Google Scholar] [CrossRef]
- Tariq, A.; Celi, L.A.; Newsome, J.M.; Purkayastha, S.; Bhatia, N.K.; Trivedi, H.; Gichoya, J.W.; Banerjee, I. Patient-specific COVID-19 resource utilization prediction using fusion AI model. Npj Digit. Med. 2021, 4, 1–9. [Google Scholar] [CrossRef] [PubMed]
- Chung, H.; Ko, H.; Kang, W.S.; Kim, K.W.; Lee, H.; Park, C.; Song, H.-O.; Choi, T.-Y.; Seo, J.H.; Lee, J. Prediction and Feature Importance Analysis for Severity of COVID-19 in South Korea Using Artificial Intelligence: Model Development and Validation. J. Med. Internet Res. 2021, 23, e27060. [Google Scholar] [CrossRef] [PubMed]
- Sinha, A.; Rathi, M. COVID-19 prediction using AI analytics for South Korea. Appl. Intell. 2021, 51, 8579–8597. [Google Scholar] [CrossRef] [PubMed]
- Forkan, A.R.M.; Khalil, I.; Atiquzzaman, M. ViSiBiD: A learning model for early discovery and real-time prediction of severe clinical events using vital signs as big data. Comput. Netw. 2017, 113, 244–257. [Google Scholar] [CrossRef]
- Nawaz, M.S.; Fournier-Viger, P.; Shojaee, A.; Fujita, H. Using artificial intelligence techniques for COVID-19 genome analysis. Appl. Intell. 2021, 51, 3086–3103. [Google Scholar] [CrossRef]
- Arshadi, A.K.; Webb, J.; Salem, M.; Cruz, E.; Calad-Thomson, S.; Ghadirian, N.; Collins, J.; Diez-Cecilia, E.; Kelly, B.; Goodarzi, H.; et al. Artificial Intelligence for COVID-19 Drug Discovery and Vaccine Development. Front. Artif. Intell. 2020, 3, 65. [Google Scholar] [CrossRef]
- Huang, G. Potential COVID-2019 3C-like Protease Inhibitors Designed Using Generative Deep Learning Approaches. Neurocomputing. ChemRxiv, 2020; preprint. [Google Scholar]
- Malone, B. Potential 2019-nCoV 3C-like Protease Inhibitors designed using generative deep learning approaches. ChemRxiv, 2020; preprint. [Google Scholar]
- Zhavoronkov, A.; Zagribelnyy, B.; Zhebrak, A.; Aladinskiy, V.; Terentiev, V.; Vanhaelen, Q.; Ivanenkov, Y. Potential non-covalent SARS-CoV-2 3C-like protease inhibitors designed using generative deep learning approaches and reviewed by human medicinal chemist in virtual reality. ChemRxiv, 2020; preprint. [Google Scholar] [CrossRef]
- Malone, B.; Simovski, B.; Moliné, C. Artificial intelligence predicts the immunogenic landscape of SARS-CoV-2 leading to universal blueprints for vaccine designs. Sci. Rep. 2020, 10, 2237. [Google Scholar] [CrossRef] [PubMed]
- Kwok, C.S.; Loke, Y.K.; Woo, K.; Myint, P.K. Risk Prediction Models for Mortality in Community-Acquired Pneumonia: A Systematic Review. BioMed Res. Int. 2013, 2013, e0181448. [Google Scholar] [CrossRef] [Green Version]
- Nan, S. A Prognostic Model for Death in COVID-19 Patients Presenting to the Emergency Room: The Added Value of Computed Tomography. Available online: https://www.researchsquare.com/article/rs-100749/v1 (accessed on 17 May 2022).
- Das, A.K.; Mishra, S.; Gopalan, S.S. Predicting CoVID-19 community mortality risk using machine learning and development of an online prognostic tool. PeerJ. 2020, 8, e10083. [Google Scholar] [CrossRef]
- Campbell, T.W. Predicting Prognosis in COVID-19 Patients using Machine Learning and Readily Available Clinical Data. medRxiv, 2021; preprint. [Google Scholar] [CrossRef]
- Shang, Y.; Liu, T.; Wei, Y.; Li, J.; Shao, L.; Liu, M.; Zhang, Y.; Zhao, Z.; Xu, H.; Peng, Z.; et al. Scoring systems for predicting mortality for severe patients with COVID-19. EClinicalMedicine 2020, 24, 100426, ISSN 2589-5370. [Google Scholar] [CrossRef]
- McRae, M.P.; Simmons, G.W.; Christodoulides, N.J.; Lu, Z.; Kang, S.K.; Fenyo, D.; Alcorn, T.; Dapkins, I.P.; Sharif, I.; Vurmaz, D.; et al. Clinical decision support tool and rapid point-of-care platform for determining disease severity in patients with COVID-19. Lab Chip 2020, 20, 2075–2085. [Google Scholar] [CrossRef]
- Subudhi, S. Comparing Machine Learning Algorithms for Predicting ICU Admission and Mortality in COVID-19. medRxiv, 2020; preprint. [Google Scholar] [CrossRef]
- Wu, G.; Zhou, S.; Wang, Y.; Lv, W.; Wang, S.; Wang, T.; Li, X. A prediction model of outcome of SARS-CoV-2 pneumonia based on laboratory findings. Sci. Rep. 2020, 10, 14042. [Google Scholar] [CrossRef]
- Wu, G.; Yang, P.; Xie, Y.; Woodruff, H.C.; Rao, X.; Guiot, J.; Frix, A.N.; Louis, R.; Moutschen, M.; Li, J.; et al. Development of a Clinical Decision Support System for Severity Risk Prediction and Triage of COVID-19 Patients at Hospital Admission: An International Multicenter Study. Eur. Respir. J. 2020, 56, 2001104. [Google Scholar] [CrossRef] [PubMed]
- Wang, J.; Yu, H.; Hua, Q.; Jing, S.; Liu, Z.; Peng, X.; Luo, Y. A descriptive study of random forest algorithm for predicting COVID-19 patients outcome. PeerJ 2020, 8, e9945. [Google Scholar] [CrossRef] [PubMed]
- Karthikeyan, A.; Garg, A.; Vinod, P.K.; Priyakumar, U.D. Machine Learning Based Clinical Decision Support System for Early COVID-19 Mortality Prediction. Front Public Health 2021, 9, 626697. [Google Scholar] [CrossRef] [PubMed]
- Bogu, G.K.; Snyder, M.P. Deep learning-based detection of COVID-19 using wearables data. medRxiv 2021. [Google Scholar] [CrossRef]
- Maheshwari, V.; Mahmood, R.; Sravanthi, S.; Arivazhagan, N.; ParimalaGandhi, A.; Srihari, K.; Sagayaraj, R.; Udayakumar, E.; Natarajan, Y.; Bachanna, P.; et al. Nanotechnology-Based Sensitive Biosensors for COVID-19 Prediction Using Fuzzy Logic Control. J. Nanomater. 2021, 2021, 3383146. [Google Scholar] [CrossRef]
- Dang, T.; Han, J.; Xia, T.; Spathis, D.; Bondareva, E.; Siegele-Brown, C.; Chauhan, J.; Grammenos, A.; Hasthanasombat, A.; Floto, R.A.; et al. Exploring Longitudinal Cough, Breath, and Voice Data for COVID-19 Progression Prediction via Sequential Deep Learning: Model Development and Validation. J. Med. Internet Res. 2022, 24, e37004. [Google Scholar] [CrossRef]
- Conroy, B.; Silva, I.; Mehraei, G.; Damiano, R.; Gross, B.; Salvati, E.; Feng, T.; Schneider, J.; Olson, N.; Rizzo, A.G.; et al. Real-time infection prediction with wearable physiological monitoring and AI to aid military workforce readiness during COVID-19. Sci. Rep. 2022, 12, 3797. [Google Scholar] [CrossRef]
- Raajan, N.R.; Lakshmi, V.R.; Prabaharan, N. Non-Invasive Technique-Based Novel Corona (COVID-19) Virus Detection Using CNN. Natl. Acad. Sci. Lett. 2020, 44, 347–350. [Google Scholar] [CrossRef]
- Xu, M.; Ouyang, L.; Han, L.; Sun, K.; Yu, T.; Li, Q.; Tian, H.; Safarnejad, L.; Zhang, H.; Gao, Y.; et al. Accurately Differentiating between Patients with COVID-19, Patients with Other Viral Infections, and Healthy Individuals: Multimodal Late Fusion Learning Approach. J. Med. Internet Res. 2021, 23, e2553. [Google Scholar] [CrossRef]
- Sethy, R.K.; Behera, S.K.; Ratha, P.K.; Biswas, P. Detection of coronavirus Disease (COVID-19) based on Deep Features and Support Vector Machine. Int. J. Math. Eng. Manag. Sci. 2020, 5, 643–651. [Google Scholar] [CrossRef]
- Müller, D. Automated Chest CT Image Segmentation of COVID-19 Lung Infection based on 3D U-Net. arXiv 2020, arXiv:2007.04774. [Google Scholar]
- Nagifa, I.P.; Hossain, M.S.; Andersson, K.A. Deep Transfer Learning Approach to Diagnose Covid-19 using X-ray Images. In Proceedings of the IEEE 2020 International Women in Engineering (WIE) Conference on Electrical and Computer Engineering (WIECON-ECE), Bhubaneswar, India, 26–27 December 2020; pp. 177–182. [Google Scholar]
- Qjidaa, M.; Ben-Fares, A.; Mechbal, Y.; Amakdouf, H.; Maaroufi, M.; Alami, B.; Qjidaa, H. Development of a clinical decision support system for the early detection of COVID-19 using deep learning based on chest radiographic images. In Proceedings of the 2020 International Conference on Intelligent Systems and Computer Vision (ISCV), Fez, Morocco, 9–11 June 2020; pp. 1–6. [Google Scholar]
- He, K.; Zhao, W.; Xie, X.; Ji, W.; Liu, M.; Tang, Z.; Shi, Y.; Shi, F.; Gao, Y.; Liu, J. Synergistic learning of lung lobe segmentation and hierarchical multi-instance classification for automated severity assessment of COVID-19. Pattern Recognit. 2021, 113, 107828. [Google Scholar] [CrossRef] [PubMed]
- Osorno-Castillo, K.; Fonnegra, R.D.; Díaz, G.M. Integration of Machine Learning Models in PACS Systems to Support Diagnostic in Radiology Services. In Applied Computer Sciences in Engineering; Springer International Publishing: Manhattan, NY, USA, 2020; pp. 233–244. [Google Scholar]
- Rajkumar, S.; Rajaraman, P.V.; Meganathan, H.S.; Sapthagirivasan, V.; Tejaswinee, K.; Ashwin, R. COVID-detect: Adeep learning approach for classification of COVID-19 pneumonia from lung segmented chest X-rays. Biomed. Eng. Appl. Basis Commun. 2021, 33, 2150010. [Google Scholar] [CrossRef]
- El-Rashidy, N.; El-Sappagh, S.; Islam, S.M.; El-Bakry, H.M.; Abdelrazek, S. End-To-End Deep Learning Framework for Coronavirus (COVID-19) Detection and Monitoring. Electronics 2020, 9, 1439. [Google Scholar] [CrossRef]
- Karthik, R.; Menaka, R.; Hariharan, M. Learning distinctive filters for COVID-19 detection from chest X-ray using shuffled residual CNN. Appl. Soft Comput. 2020, 99, 106744. [Google Scholar] [CrossRef]
- Liang, S.; Liu, H.; Gu, Y.; Guo, X.; Li, H.; Li, L.; Wu, Z.; Liu, M.; Tao, L. Fast automated detection of COVID-19 from medical images using convolutional neural networks. Commun. Biol. 2021, 4, 35. [Google Scholar] [CrossRef]
- Lorencin, I.; Šegota, S.B.; Anđelić, N.; Blagojević, A.; Šušteršić, T.; Protić, A.; Arsenijević, M.; Ćabov, T.; Filipović, N.; Car, Z. Automatic Evaluation of the Lung Condition of COVID-19 Patients Using X-ray Images and Convolutional Neural Networks. J. Pers. Med. 2021, 11, 28. [Google Scholar] [CrossRef]
- Ahrabi, S.S.; Scarpiniti, M.; Baccarelli, E.; Momenzadeh, A. An Accuracy vs. Complexity Comparison of Deep Learning Architectures for the Detection of COVID-19 Disease. Computation 2021, 9, 3. [Google Scholar] [CrossRef]
- Sheykhivand, S.; Mousavi, Z.; Mojtahedi, S.; Rezaii, T.Y.; Farzamnia, A.; Meshgini, S.; Saad, I. Developing an efficient deep neural network for automatic detection of COVID-19 using chest X-ray images. Alex. Eng. J. 2021, 60, 2885–2903. [Google Scholar] [CrossRef]
- Zhang, Y.-D.; Satapathy, S.C.; Liu, S.; Li, G.-R. A five-layer deep convolutional neural network with stochastic pooling for chest CT-based COVID-19 diagnosis. Mach. Vis. Appl. 2020, 32, 1. [Google Scholar] [CrossRef]
- Ismael, A.M.; Şengür, A. Deep learning approaches for COVID-19 detection based on chest X-ray images. Expert Syst. Appl. 2020, 164, 114054. [Google Scholar] [CrossRef] [PubMed]
- Pan, F.; Li, L.; Liu, B.; Ye, T.; Li, L.; Liu, D.; Ding, Z.; Chen, G.; Liang, B.; Yang, L.; et al. A novel deep learning-based quantification of serial chest computed tomography in Coronavirus Disease 2019 (COVID-19). Sci. Rep. 2021, 11, 417. [Google Scholar] [CrossRef] [PubMed]
- Varela-Santos, S.; Melin, P. A new approach for classifying coronavirus COVID-19 based on its manifestation on chest X-rays using texture features and neural networks. Inf. Sci. 2020, 545, 403–414. [Google Scholar] [CrossRef] [PubMed]
- Wang, R.; Jiao, Z.; Yang, L.; Choi, J.W.; Xiong, Z.; Halsey, K.; Tran, T.M.L.; Pan, I.; Collins, S.A.; Feng, X.; et al. Artificial intelligence for prediction of COVID-19 progression using CT imaging and clinical data. Eur. Radiol. 2021, 32, 205–212. [Google Scholar] [CrossRef]
- Huang, L.; Ruan, S.; Denoeux, T. Covid-19 Classification with Deep Neural Network and Belief Functions. In Proceedings of the the Fifth International Conference on Biological Information and Biomedical Engineering, Hangzhou, China, 20–22 July 2021. [Google Scholar] [CrossRef]
- Rajpal, S.; Agarwal, M.; Rajpal, A.; Lakhyani, N.; Saggar, A.; Kumar, N. COV-ELM classifier: An Extreme Learning Machine based identification of COVID-19 using Chest X-ray Images. arXiv 2020, arXiv:2007.08637. [Google Scholar] [CrossRef]
- Manocha, A.; Bhatia, M. A novel deep fusion strategy for COVID-19 prediction using multimodality approach. Comput. Electr. Eng. 2022, 103. [Google Scholar] [CrossRef]
- Kim, C.K.; Choi, J.W.; Jiao, Z.; Wang, D.; Wu, J.; Yi, T.Y.; Halsey, K.C.; Eweje, F.; Tran, T.M.L.; Liu, C.; et al. An automated COVID-19 triage pipeline using artificial intelligence based on chest radiographs and clinical data. Npj Digit. Med. 2022, 5, 5. [Google Scholar] [CrossRef]
- Shi, W.; Peng, X.; Liu, T.; Cheng, Z.; Lu, H.; Yang, S.; Zhang, J.; Wang, M.; Gao, Y.; Shi, Y.; et al. A deep learning-based quantitative computed tomography model for predicting the severity of COVID-19: A retrospective study of 196 patients. Ann. Transl. Med. 2021, 9, 216. [Google Scholar] [CrossRef]
- Chen, C.; Lin, W.; Yang, H. Diagnosis of ventilator-associated pneumonia using electronic nose sensor array signals: Solutions to improve the application of machine learning in respiratory research. Respir. Res. 2020, 21, 45. [Google Scholar] [CrossRef]
- D’Ambrosia, C.; Christensen, H.; Aronoff-Spencer, E. Computing SARS-CoV-2 Infection Risk from Symptoms, Imaging, and Test Data: Diagnostic Model Development. J. Med. Internet Res. 2020, 22, e24478. [Google Scholar] [CrossRef]
- Rawson, T.M.; Hernandez, B.; Wilson, R.C.; Ming, D.; Herrero, P.; Ranganathan, N.; Skolimowska, K.; Gilchrist, M.; Satta, G.; Georgiou, P.; et al. Supervised machine learning to support the diagnosis of bacterial infection in the context of COVID-19. JAC-Antimicrob. Resist. 2021, 3, dlab002. [Google Scholar] [CrossRef] [PubMed]
- Shaban, W.M.; Rabie, A.H.; Saleh, A.I.; Abo-Elsoud, M.A. A new COVID-19 Patients Detection Strategy (CPDS) based on hybrid feature selection and enhanced KNN classifier. Knowl.-Based Syst. 2020, 205, 106270. [Google Scholar] [CrossRef] [PubMed]
- Dugdale, C.M.; Rubins, D.M.; Lee, H.; McCluskey, S.M. COVID-19 Diagnostic Clinical Decision Support: A Pre-Post Implementation Study of CORAL (COvid Risk cALculator). Clin. Infect. Dis. Off. Publ. Infect. Dis. Soc. Am. 2021, 73, 2248–2256. [Google Scholar] [CrossRef] [PubMed]
- Halilaj, I.; Chatterjee, A.; van Wijk, Y.; Wu, G.; van Eeckhout, B.; Oberije, C.; Lambin, P. Covid19Risk. ai: An open source repository and online calculator of prediction models for early diagnosis and prognosis of COVID-19. BioMed 2021, 1, 41–49. [Google Scholar] [CrossRef]
- Shanbehzadeh, M.; Nopour, R.; Kazemi-Arpanahi, H. Determination of the Most Important Diagnostic Criteria for COVID-19: A Step forward to Design an Intelligent Clinical Decision Support System. J. Adv. Med. Biomed. Res. 2021, 29, 176–182. [Google Scholar] [CrossRef]
- Mansour, N.A.; Saleh, A.I.; Badawy, M.; Ali, H.A. Accurate detection of Covid-19 patients based on Feature Correlated Naïve Bayes (FCNB) classification strategy. J. Ambient Intell. Humaniz. Comput. 2021, 13, 41–73. [Google Scholar] [CrossRef]
- Silahudin, D.; Holidin, A. Model Expert System for Diagnosis of Covid-19 Using Naïve Bayes Classifier. In IOP Conference Series: Materials Science and Engineering; IOP Publishing: Bristol, UK, 2020; Volume 1007. [Google Scholar]
- Orozco-del-Castillo, M.G.; Novelo-Cruz, R.A.; Hernández-Gómez, J.J.; Mena-Zapata, P.A.; Brito-Borges, E.; Álvarez-Pacheco, A.E.; García-Gutiérrez, A.E.; Yáñez-Casas, G.A. Fuzzy Logic-Based COVID-19 and Other Respiratory Conditions Pre-clinical Diagnosis System. In Telematics and Computing Cham; Springer International Publishing: Manhattan, NY, USA, 2020; pp. 402–419. [Google Scholar]
- Nan, S.; Tang, T.; Feng, H.; Wang, Y.; Li, M.; Lu, X.; Duan, H. A Computer-Interpretable Guideline for COVID-19: Rapid Development and Dissemination. JMIR Med. Inform. 2020, 8, e21628. [Google Scholar] [CrossRef]
- AlJame, M.; Ahmad, I.; Imtiaz, A.; Mohammed, A. Ensemble learning model for diagnosing COVID-19 from routine blood tests. Inform. Med. Unlocked 2020, 21, 100449. [Google Scholar] [CrossRef]
- Rehm, G.B.; Woo, S.H.; Chen, X.L. Leveraging IoTs and Machine Learning for Patient Diagnosis and Ventilation Management in the Intensive Care Unit. IEEE Pervasive Comput. 2020, 19, 68–78. [Google Scholar] [CrossRef]
- Abdulkareem, K.H.; Mohammed, M.A.; Salim, A.; Arif, M.; Geman, O.; Gupta, D.; Khanna, A. Realizing an Effective COVID-19 Diagnosis System Based on Machine Learning and IOT in Smart Hospital Environment. IEEE Internet Things J. 2021, 8, 15919–15928. [Google Scholar] [CrossRef]

| Task Class | Input Data | Output Data | Decision Method | Data Sets | Accuracy | Reference |
|---|---|---|---|---|---|---|
| AI-based CDSS for organizational problem solving | ||||||
| 1.1 Predicting the Global Parameters of the Epidemic | Time series of sick/recovered patients | The number of sick and recovered patients in 6 countries. | Simple recurrent neural network (RNN), long-term short-term memory (LSTM), Bidirectional LSTM (BiLSTM), Gated Repeating Units (GRU), and Variational Autoencoder (VAE). | From COVID-19 outbreak for corresponding countries (from 22 January 2020 to 17 June 2020) | Root mean square error (RMSE), mean absolute percentage error (MAPE), mean absolute error (MAE), explained variance (EV), and log mean squared error (RMSLE). Separately for 6 countries. | [14] |
| Interest in search terms “Corona”, “COVID-19”, “Coronavirus”, “Antiseptic sale”, “Antiseptic purchase”, “Hand washing”, “Hand sanitizer”, “Ethanol”, “Antiseptic” in Persian for the previous day The incidence of COVID-19 the day before (Iran). | Similar parameters for the current day, of particular importance, the incidence of COVID-19 (in Iran). | Linear regression and long-term short-term memory (LSTM). | From 10 February 2020 to 18 March 2020 | The mean square value for the linear regression model was 7.562. (SD 6.492). The root mean square LSTM was 27.187 (SD 20.705). | [6] | |
| Time series of cases/recoveries/deaths (India) Number of new cases, deaths and consequences; vaccinations (α). | Number of sick/recovered/dead (India) SIRVD (Susceptible, Infected, Recovered, Vaccinated and Dead) Model Parameters, on their basis—predictive values. | Artificial Neural Network based Adaptive Incremental Learning (ANNAIL). | From 30 January to 13 June, India. | Not separately identified | [15] | |
| Time series of sick/recovered/dead | Number of sick/recovered/dead | MLP | Information about infected, recovered and deceased patients in 406 locations for 51 days (from 22 January 2020 to 12 March 2020) | Coefficient of determination (R2) 0.94 for confirmed cases, 0.781 for recovered patients and 0.986 for models of deceased patients | [16] | |
| Population density, average temperature, maximum temperature, minimum temperature, precipitation, wind speed, humidity. their minimum, maximum, mean, standard deviation, skewness, kurtosis | Minimum, maximum, mean, standard deviation, skewness, kurtosis of the infection rate | Combination of Virus Optimization Algorithm (VOA) and Adaptive Network Fuzzy Inference System (ANFIS) | A total of 1657 records from various administrative divisions of the USA | R2 = 0.8338 | [12] | |
| The number of COVID-19 cases and deaths around the world and in India by day from 1 January 2020 to 19 June 2020 | Number of upcoming COVID-19 cases and forecast of deaths over the next 365 days | Support Vector Regression and Linear Regression | The number of cases and deaths around the world and in India by day from 01 January 2020 to 19 June 2020 | R2 = 0.80 | [7] | |
| Country, date, cancellation of public events (due to public awareness), severity index, testing policy (category of test facility available to the general population), total positive cases per million, new cases per million, total deaths per million, number new deaths per million, cardiovascular disease mortality rate, available hospital beds per thousand people, life expectancy, risk awareness (rate) about COVID-19, level of hazard and exposure, people using at least basic sanitation services (ratio), awareness about vulnerability (ratio), awareness about health status (ratio), awareness about vulnerability to epidemics (ratio), mortality rate, prevalence of malnutrition, lack of coping capacity, access to health care, physician number, current health care expenditure per capita, maternal mortality | Similarity clusters | K-means | Owid-covid-data, COVID-19-testing-policy, public-events-covid, covid-containment-and-health-index, inform-covid-indicators | Absence of reference clusters | [3] | |
| Daily data on new confirmed, deaths and recoveries of COVID-19 cases in Pakistan | Forecast of the number of sick, recovered and dead for 10 days in Pakistan | Models of vector autoregression of time series | Daily data on new confirmed, deaths and recoveries of COVID-19 cases in Pakistan from 8 March to 27 June 2020 has been downloaded from the World Health Organization | Not evaluated | [8] | |
| Total number of confirmed cases in India for the period 30 January 2020 to 29 April 2020 (showing the usefulness of 8 values for predicting the next day) | Forecast of the number of cases for the next day | A Logistic Growth Model to determine the stability of a pandemic and a Prophet Model to predict the total number of infections in India | Total number of confirmed cases in India for the period 30 January 2020 to 29 April 2020 | Not evaluated | [9] | |
| Average age, PM 2.5 (air pollution level), population density, GDP per capita, average temperature and average humidity | R0 (infection index, more than 1—growth, less—decline) | Linear Regression, Linear Kernel Support Vector Machine (SVM), Radial Kernel SVM, Polynomial Kernel SVM, and Decision Tree | US state statistics | R2 = 0.473 | [10] | |
| Image of the situation from the cameras | Type of violation of the regime (no mask, gloves, violation of social distance, contact, coughing, sneezing, spitting, hugging) | CNN | A total of 11,175 photos with/without described situations | F1 = 0.82 | [13] | |
| Statistical data about COVID-19 cases in Indian states | Total cases/Discharges/Total deaths | Polynomial Regression, Decision Tree Regression, and Random Forest Regression | Number of Total cases, Discharges, Total deaths is various Indian states | RMSE value of 0.08 | [11] | |
| Several factors including age, gender, province, epidemical data | Prediction of COVID-19 severeness | Deep learning models with autoencoder-based approach, SVM | Data Science for COVID-19 in South Korea dataset. Training includes 5165 coronavirus instances, validation—1533 quarantined patients | Average accuracy of 99% | [32] | |
| Daily number of confirmed, deceased, and recovered COVID-19 cases in 401 locations, over 78 days | Estimation of confirmed, deceased, and recovered cases and the estimation of epidemiology curve for specific countries | Genetic algorithms | Repository by the Johns Hopkins University Center for Systems Science and Engineering | R2 scores of 0.999 | [19] | |
| Demographics, medication, past medical procedures, comorbidities, and laboratory results | Prediction of COVID-19 by multimodal fusion | Multimodal fusion AI model. XGBoost and multi-branched deep dense network | A total of 3194 COVID-19 patients | 84% overall F1-score [CI 82.1–86.1] | [30] | |
| Risk factors were lymphocyte level, platelet count, and shortness of breath or dyspnea from medical records | Low and high severity of COVID-19 | Deep neural network with 5 layers | A total of 5601 COVID-19 patients | balanced accuracy 90.3%, and AUC 0.96 | [31] | |
| Statistical information from World Health Organization | Prediction of confirmed cases and deaths of COVID-19 | ANN | Cases and deaths data are collected from 20 January to 11 November 2020 by the World Health Organization | Correlation coefficient R is 0.9948 | [18] | |
| Temperature, humidity and wind as the independent variables | The relationship between COVID-19 spread and environmental factors | Adaptive Neuro-Fuzzy Inference System, CNN, Multiple Linear Regression | Data taken from another work [Pirouz, Behrouz, et al. “Investigating a serious challenge in the sustainable development process: analysis of confirmed cases of COVID-19 (new type of coronavirus) through a binary classification using artificial intelligence and regression analysis.” Sustainability 12.6 (2020): 2427.] | Average R-values of 0.90 | [5] | |
| The epidemic data | Epidemic trend | Susceptible-Exposed-Infected-Removed (SEIR) model, Deep neural network, Recursive Neural Network (RNN) | COVID-19 data including the number of confirmed, cured and deaths from 23 January to 6 March 2020, combined with Baidu population migration data and relevant city data of the National Bureau of Statistics | Good graphical correspondence with real data | [20] | |
| Time-series data extracted from integrated Command and Control Center, Delhi, India | Forecasting of COVID-19 spread | ARIMA and Deep Convolutional Neural Network | Data from iCCC dashboard (https://covid.dashboard.jantasamvad.org/ accessed on 25 August 2022) was used | Root Mean Squared Error (RMSE) and Mean Absolute Error (MAE) are 57.093, 7.859 | [21] | |
| Real time-series dataset of global record of confirmed, recovered, deaths and active cases of COVID-19 outbreak | COVID-19 future trends | Naïve Bayes, Support Vector Machine (SVM) and Linear Regression | Two datasets: the first contains a cumulative count of worldwide recovered, confirmed and death cases of COVID-19 from 22 January 2020 to 19 May 2020 and the second contains the global time-series records of COVID-19 from 22 January 2020 to 19 May 2020 | MAE = 488,806.7492 and MSE = 400,919,367,451.7439 | [22] | |
| John Hopkins’s COVID-19 dataset | Prediction of active cases of COVID-19 | Recurrent Neural Network and Long short-term memory neural network | The dataset for 28 states and 8 union territories of India extracted from John Hopkins’s dataset | Good graphical correspondence between real data and modeled one | [17] | |
| Medical COVID-19 data from Virudhunagar district, India | COVID-19 affected regions classified into: danger, moderate, and safe zone | Deep neural network and decision trees | COVID-19 dataset of Virudhunagar district from the period of March to July 2020 | Accuracy of 98.06% | [4] | |
| 1.2 Prescribing treatment by identifying similar patients and their dynamics/identifying analogies between countries as the pandemic progresses | Country, date, cancellation of public events (due to public awareness), severity index, testing policy, pandemic statistics | Similarity clusters | K-means | Owed-covid-data (number of infected), COVID-19-testing-policy (detection of COVID-19) public-events-covid (reaction to COVID-19 infections), covid-containment-and-health-index, inform-covid-indicators | Absence of reference clusters | [3] |
| Adverse effects, route of administration, cost, plasma turnover, fever rate, age, pregnancy, and renal function | Evaluation of current treatment options, including favipiravir (FPV), lopinavir/ritonavir, hydroxychloroquine, interleukin-1 blocker, intravenous immunoglobulin (IVIG), and plasmapheresis | Fuzzy methods PROMETHEE and VIKOR | Not given | Ranked methods: Plasmapheresis was the most preferred alternative, followed by FPV and IVIG, and hydroxychloroquine was the least favorable | [43] | |
| 1.3 General review papers on the use of telemedicine and AI within it | Not applicable | General analysis for early detection and forecasting of the global dynamics of the pandemic in South America. | Not applicable | Not applicable | Not applicable | [23] |
| Ketonuria, diet disorders and blood glucose values | Correction of diet/insulin adjustments | Algorithm not presented, ready-made SineDie solution | A total of 5108 patients, follow-up for diabetes | During follow-up, the system allowed for dietary adjustments in 20% of patients, 12 patients started insulin treatment, and 41.7% of them subsequently required therapy adjustments. 45.2% of insulin proposals submitted by the system were accepted, 29.0% shelved, and 25.8% rejected | [26] | |
| Not applicable | Follow-up of patients with Alzheimer’s disease during a pandemic | Not applicable | Not applicable | Not applicable | [24] | |
| Not applicable | Clinical, technical, financial and cultural barriers to telemedicine, and discusses expected benefits, including those using AI in telemedicine | Not applicable | Not applicable | Not applicable | [25] | |
| 1.4 Prioritization of patients for selected treatments based on their individual characteristics (such as blood types) and the severity of their condition | Age, gender, body mass index, medical staff, history of pregnancy, history of smoking, history of exposure, family history, number of cases among family members, people who were in Wuhan, ICU stay, interval between contact date and start date, Interval between start date and visit date, interval between start date and hospitalization date, interval between start date and date of antiviral therapy, blood parameters, etc. Based on the results of the analysis, the following criteria were selected as informative: gender (male vs. female), age > 70 years, temperature > 39 °C, cough, shortness of breath, hypertension, diabetes, secondary bacterial infection, lung injury, leukocyte count (10 × 109), neutrophils/lymphocytes (<3 vs. ≥3), alanine aminotransferase (≤40 vs. >40 U/L), aspartate aminotransferase (≤40 vs. >40 U/L), creatine kinase (≤185 vs. >185 U/L), lactate dehydrogenase (≤250 vs. >250 U/L), C-reactive protein (≤10 vs. >10 mg/L) | Prognosis of the likelihood of ARDS in patients with COVID-19 | Logistic regression (LR), random forest (RF), support vector machine (SVM), decision tree (DT) and deep neural networks (DNN) | Clinical data of 659 COVID-19 patients from 11 regions in China | AUC = 0.99, Accuracy = 0.97 | [27] |
| Photo to determine the blood type. Biomarkers albumin, IgM/IgG, cytokines/chemokines, peroxiredoxin II, C-reactive protein, PaO2/FiO2 for prioritization using subjective and objective decision by opinion evaluation method and use in decision matrix. | Prioritization of plasma transfusion treatment based on donor and patient parameters. | Decision matrix, subjective and objective decision by opinion evaluation method. CNN for blood typing by image interaction with control groups. | Not applicable | Not performed | [28] | |
| Demographic, clinical and blood test data. | Prediction of which patients may have positive for SARS-CoV-2 test or require hospitalization or intensive care. | Logistic regression, neural networks, SVM, random forests and gradient boosting. | A total of 5644 patients | Patients positive for SARS-CoV-2 a priori with a sensitivity of 75% (95% CI 67%-81%) and a specificity of 49% (95% CI 46–51%), patients with SARS- Positive for CoV-2 requiring hospitalization with an area of 0.92 under the receiver operator characteristic curve (AUC; 95% CI 0.81–0.98), and SARS-CoV-2 positive patients requiring intensive care with an AUC of 0.98 (95% CI 0.95–1.00). | [29] | |
| AI-based CDSS for research problem solving | ||||||
| 2.1 Application of machine learning methods in DNA analysis for mutation detection, personalized diagnosis and treatment, treatment efficacy prediction, vaccine and drug development | DNA nucleotide sequence. | Prediction of the next nucleotide in a DNA sequence | Variations of Hidden Markov Models | A total of 1492 sequences | Up to 20% | [34] |
| SARS-CoV-2 proteome, 100 most common HLA-A, HLA-B and HLA-DR alleles in the human population | Predictive schemes for the development of universal vaccines against SARS-CoV-2, which contain a sufficiently wide repertoire of T-cell epitopes that can provide coverage and protection to the entire population of the world | Monte Carlo method | About 22,000 people to create a “digital twin”, GISAID database at the stage of genome analysis | Not applicable | [39] | |
| Genome sequences | Search for genomic biomarkers that may predispose to more severe infection or death. Search for genomic biomarkers of response in patients treated during infection. Prognostic stratification of patients | Not conducted | Sample of 7000 patients, subgroup of 300 patients for sequencing | Not applicable | [38] | |
| Crystal structure of 2019-nCoV 3C-like protease, ‘Potency’, ‘IC50’, ‘Ki’, ‘EC50’, ‘Kd’ (assay confidence score ≥ 8). | Potential analogues of existing drugs with a different composition | GAN network. | Crystal structure of the 3C-like protease 2019-nCoV. The protease dataset was assembled with molecules active against various proteases in enzymatic assays extracted from the Integrity database, experimental pharmacology module, and ChEMBL. Total—60,293 unique structures | Not done | [36] | |
| AI-based CDSS for diagnostic problem solving | ||||||
| 3.1 Diagnostic models aimed at assessing the likelihood of any manifestation of the disease, its development and outcome. | Myo (myoglobin), CD8, age, LDH (lactate dehydrogenase), C-reactive protein, CD45, Th/Ts, dyspnoea, NLR, D-dimer, creatine, etc | Survival/death. | RF | A total of 126 patients, Wuhan. | AUC 0.9905 | [49] |
| Age, diabetes, coronary heart disease (CHD), lymphocyte percentage (LYM%), procalcitonin (PCT), serum urea, C-reactive protein and D-dimer (DD) (old age, CAD, LYM%, procalcitonin selected as independent) | Survival/death | Least Absolute Shrinkage and Selection Operator (LASSO), multivariate analysis | A total of 2529 patients/452 severe cases | AUC 0.919 | [44] | |
| Neutrophil count, lymphocyte count, lactate dehydrogenase (LDH), highly sensitive C-reactive protein (CRP), and age | Survival/death | KNN | A total of 1766 points from 370 patients | Accuracy 90% 16 days before the outcome | [50] | |
| Levels of C-reactive protein (CRP), lactate dehydrogenase (LDH), leukocyte, lymphocyte, neutrophil and platelet counts, oxygen saturation level (SpO2), CT results | Survival/death | Statistical methods | A total of 866 patients | AUC 0.927 | [41] | |
| Age group, gender, province, source of information about the disease (hospital admission, physician visit, etc.) | Survival/death | Logistic regression, support vector machine, nearest K neighbors, random forest and gradient boosting | A total of 3524 patients, Korea | Max accuracy 0.96 | [42] | |
| C-reactive protein (CRP), N-terminal pro-B natriuretic peptide (NT-proBNP), myoglobin (MYO)), D-dimer, procalcitonin (PCT), myocardial creatine kinase band (CK-MB), and cardiac troponin I (cTnI) | Survival/death | LASSO | A total of 160 patients, Wuhan | AUC 0.94 | [45] | |
| For age group 80–89 years old: use of ventilation, GFR less than 60 mL/min/1.72 m2 potassium. For age group: 90+: alanine aminotransferase, white blood cells count, pulse rate, procalcitonin, respiratory rate, C-reactive protein, history of congestive heart failure lymphocytes, sodium, hemoglobin. For age group: 70–79 years blood glucose, dementia neutrophils, anticoagulants | Survival/death | Ensembles, Gaussian process, linear models, naive Bayes, nearest neighbors, SVM, decision tree, discriminant analysis | A total of 1478 patients | AUC 0.84 | [46] | |
| Prothrombin activity, urea, leukocytes, interleukin-2 receptor, indirect bilirubin, myoglobin and fibrinogen breakdown products | Pneumonia prognosis | Maximum Relevance and Minimum Redundancy (mRMR) algorithm and logistic regression model with least absolute compression and choice operator | A total of 110 patients | A percentage of 98% sensitivity and 91% specificity | [47] | |
| Evaluation of sequential organ failure, urea, respiratory rate, blood pressure, age, acute and chronic health state assessment, confusion, etc | Logistic regression | A total of 725 patients | AUC 0.89 | [48] | ||
| Gender, severity score at admission, temperature > 39 °C, cough, dyspnea, hemoptysis, hypertension, diabetes, secondary bacterial infection, lung consolidation, blood parameters | Survival/death | Decision Tree, Logistic Regression, Random Forest, Support Vector Machine, Deep Neural Networks | A total of 659 patients | Accuracy 0.97 | [27] | |
| CRP (C-reactive protein), LDH (lactate dehydrogenase) and D-dimer | Survival/death | Deep Learning | Totally, 229 patients | Depends on factors, there is no integral assessment | [43] | |
| Patient characteristics (age, gender, immunosuppression and kidney disease), clinical parameters (pulse rate, blood pressure, respiratory rate, temperature, presence of shock and confusion), laboratory measurements (urea/blood urea nitrogen, leukocyte count, SpO2, hematocrit, glucose, sodium, and pH), radiological findings (pleural effusion and multilobar pneumonia on chest X-ray), and medical opinion (need for mechanical ventilation) | Survival/death | Models based mainly on regression statistical methods | Various datasets | Max AUC = 0.82 | [40] | |
| X-ray data | Healthy/COVID-19/Pneumonia | COV-ELM (ELM modification) | COVID-19 Image Data Collection (760), COVID-19 Radiography Database (2905), Mendeley Chest X-ray Images (5856) | F1 = 0.94 ± 0.02 | [76] | |
| X-ray data | Healthy/COVID-19/Pneumonia | CNN (the best—ResNet50) + SVM | COVID-19 Image Data Collection (760), COVID-19 Radiography Database (2905) | Max accuracy 98.66% | [57] | |
| Heart rate and steps interval data from wearable device | Healthy/COVID-19/non-COVID-19 illness | LSTM-based Autoencoder | A total of 25 COVID-positive, 11 non-COVID-19 illness, and 70 healthy patients | Average precision score of 0.91 (SD 0.13, 95% CI 0.854–0.967), a recall 0.36 (0.295, 0.232–0.487) | [51] | |
| Nanotechnology-based IOT biosensors data | Healthy/COVID-19 | Fuzzy-based decision tree | Cord-19 dataset | Accuracy is up to 99% | [52] | |
| 9381 United States Department of Defense personnel wearing Garmin and Oura devices, totaling 599,174 user-days of service and 201 million hours of data | Real-time infection prediction | Custom gradient boosting ensemble learning method | A total of 491 COVID-19 patients | AUC of 0.82 | [54] | |
| Audio data (cough, breathing, and voice) | COVID-19 progression prediction and recovery trend prediction | Deep learning–enabled tracking tool using gated recurrent units | Crowdsourced respiratory audio data, including breathing, cough, and voice samples, from 212 individuals over 5–385 days | AUROC of 0.79, a sensitivity of 0.75, and a specificity of 0.71 | [53] | |
| 3.2 Lung monitoring based on classical radiograph and CT image analysis for both direct diagnosis of COVID-19 and prediction of disease severity | CT scan | Segmentation (affected segments) | CNN (3D U-Net) | A total of 20 CT results | F1 0.956 for unaffected and 0.761 for affected areas | [58] |
| X-ray data | Healthy/COVID-19/Pneumonia | CNN (VGG/MobileNet) | The COVID-19 radiography database consists of 219 COVID-19 image samples, 1345 viral pneumonia image samples, and 1341 normal chest X-rays | Max accuracy 98.75% | [59] | |
| X-ray data | Healthy/COVID-19/Pneumonia | CNN (VGG) | Cohen Dataset (230 samples) + Wang Dataset (100 + 100 samples) | Max accuracy 92.5% | [60] | |
| CT scan | Segmentation and assessment of disease severity based on it | CNN (M2UNet) | A total of 666 KT | Max F1 0.785, Max accuracy 0.985. | [61] | |
| X-ray data | Healthy/COVID-19/Pneumonia | CNN | CXRI + 382 cases with COVID-19 | AUC = 0.84–0.88 | [62] | |
| X-ray data | COVID-19/its absence | CNN (ResNet) | Zhao + Kaggle Dataset | Accuracy and specificity 95.09% and 81.89% sensitivity 100% | [55] | |
| X-ray data | Healthy/COVID-19/Pneumonia | CNN | Open-source COVID-19 + private data (pneumonia and normal cases) | Accuracy 0.96 | [63] | |
| CT scans + 10 lab parameters + 23 observational features | Healthy/COVID-19– Light/COVID-19 –Complicated/Pneumonia | CNN + kNN/RF/SVM | Cumulatively, 689 CT examples (214 patients with non-severe COVID-19, 148 patients with severe COVID-19, 198 uninfected healthy participants, and 129 patients with non-COVID viral pneumonia.). | Accuracy 95.4–97.7% | [56] | |
| Fever, cough, diarrhea, vomiting, shortness of breath, have a chronic illness, work in health care, travel in the last 14 days. Blood test data CT (at different stages of diagnosis) | Prediction of COVID-19 infection | CNN + kNN/RF/SVM | A total of 689 CT scans (214 patients with non-severe COVID-19, 148 patients with severe COVID-19, 198 uninfected healthy participants, and 129 patients with non-COVID viral pneumonia.) | Accuracy 95.4–97.7% | [56] | |
| Fever, cough, diarrhea, vomiting, shortness of breath, presence of chronic illness, work in health care, travel in the last 14 days. Blood test data, CT (at different stages of diagnosis) | Prediction of COVID-19 infection | At the presented experimental stage—CNN | A total of 622 observations (122—COVID-19, 500—healthy) in terms of CT analysis | Accuracy 97.78% for CT | [64] | |
| CT scans | Formation of parameters, Diagnosis of COVID-19 | Selection + selection of parameters (GLCM + HFSM) + KNN | A total of 498 + test sample | Accuracy 96% | [83] | |
| Lung CT images (manual analysis), age, sex, number of days before hospitalization; Impact on the area of the source of the epidemic; hypertension, cardiovascular disease, diabetes mellitus, current smoking, high fever, dry cough, expectoration, blood parameters | Prognosis of the severity of the disease | LASSO, MOTct, POIct and PSI levels | A total of 196 patients | AUC = 0.890 | [79] | |
| COVID-CT dataset (https://github.com/UCSDAI4H/COVID-CT accessed on 24 August 2022) | COVID-19/non-COVID-19 | Belief function-based convolutional neural network with semi-supervised training | There were 746 instances from 216 patients | Accuracy of 0.81, an F1 of 0.812 and an AUC of 0.875. | [75] | |
| X-ray data | Healthy/COVID-19 | CNN (ResNet18, ResNet50, ResNet101, VGG16, and VGG19 for feature extraction), SVM | A total of 180 COVID-19 and 200 healthy patients | 94.7% accuracy score | [71] | |
| X-ray data | Healthy/Pneumonia/COVID-19 | shuffled residual CNN | 558 COVID-19, 1437 Bacterial Pneumonia, 1216 Viral Pneumonia and 10,434 Healthy | F1-score of 97.20% and an accuracy of 99.80% | [65] | |
| X-ray, CT scans, and clinical indicators data | Healthy/Pneumonia/COVID-19 | CNN-based classification framework | Large hybrid dataset available at https://drive.google.com/drive/folders/1-tXCaPtv0vupjXeLvrEX2cGt3tCOqyiv?usp=sharing accessed on 24 August 2022) | F1 scores > 96.72% (0.9307, 0.9890) and specificity > 99.33% (0.9792, 1.0000) | [66] | |
| X-ray data | Mild/ Moderate/ Severe/ Critical clinical picture. | CNN (ResNet152) | A total of 185 images with data augmentation procedure applied | AUC up to 0.94 | [67] | |
| CT scans | Moderate/Severe COVID-19 groups | Combination of U-net and fully convolutional networks | A total of 465 scans | Spearman’s Correlation coefficient is more than 0.920 between radiologists and DL | [72] | |
| X-ray data | Healthy/COVID-19 | CNN | A total of 253 images with augmentation procedure applied. Total 500 COVID-19 and 500 healthy | Overall accuracy of 99.8% | [68] | |
| X-ray data | Healthy/Pneumonia/COVID-19 | CNN | A total of 2923 healthy, 371 COVID-19, 2778 bacterial, and 2840 viral pneumonia patients | 99% accuracy for COVID-19 vs. health, >90% accuracy for other scenarios | [69] | |
| X-rays and CT scans | Healthy/Pneumonia/COVID-19 | Feed-Forward and neural network and CNN, SVM | A total of 255 COVID-19, 255 healthy patients | Accuracy 84–100, AUC 0.85–1 depending on scenario | [73] | |
| CT scans | Healthy/COVID-19 | The CNN was 5-layer deep | A total of 142 healthy, 142 COVID-19 patients | Accuracy of 93.64% ± 1.42% | [70] | |
| CT scans and clinical data | COVID-19 severity (high-risk and low-risk groups) | Deep convolutional neural network, random survival forest | A total of 1051 patients with RT-PCR confirmed COVID-19 | C-index of 0.80 | [74] | |
| CT scans and acoustic data | Symptoms of COVID-19 | Deep Learning-assisted Multi-modal Data Analysis | A total of 276 and 502 samples belong to speech and breath audio samples; 1252 COVID-19 and 1229 healthy CT scans | Accuracy of 95.64% | [77] | |
| X-rays data along with radiology reports and RT-PCR data | COVID-19 severity | EfficientNet-B0 initialized on ImageNet pretrained weights | A total of 6500 non-public chest X-rays comprising diverse COVID-19 severities, along with radiology reports and RT-PCR data | 95% diagnostic accuracy | [78] | |
| 3.3 Analysis of factors in the COVID-19 diagnosis and its complications | Counting blood cells, neutrophils, eosinophils, monocytes, platelets, lymphocytes, basophils, lactate dehydrogenase, aspartate aminotransferase, alkaline phosphatase, gamma-glutamyltranspeptidase, alanine aminotransferase, C-reactive protein, age | Selection of parameters, Diagnostics COVID-19 | FCNB (Bayes) | A total of 207 patients | Max accuracy = 0.99 | [87] |
| Blood tests | Diagnostics of COVID-19 | XGBoost + KNN+ iForest + SMOTE | A total of 5644 data samples with 559 confirmed cases of COVID-19 | Accuracy 99.88% | [91] | |
| (1) Fever (Fe), (2) Headache (H), (3) Myalgia (M), (4) Fatigue (Fa), (5) Nasal congestion (NC), (6) Sneeze (S), (7) Sore throat (ST), (8) Difficult breathing (DB) and (9) Rhinorrhea (R). | Diagnostics of COVID-19 | Fuzzy inference system. | A total of 272 patients. | Not performed | [89] | |
| Blood test (erythrocytes, hemoglobin, platelets, hematocrit, aspartate transaminase, lymphocytes, monocytes, sodium, urea, basophils, creatinine, serum glucose, alanine transaminase, leukocytes, potassium, eosinophils, C-reactive protein and neutrophils) | Diagnostics of COVID-19 | NB + RF + SVM | A total of 600 (520 healthy + 80 COVID-19 confirmed) patients. | Accuracy 95% | [93] | |
| Age, gender, smoking, blood test | Diagnosis of pneumonia ventilator-associated pneumonia (VAP) | KNN, NB, DT, ANN, SVM, RF | A total of 59 patients | Accuracy 0.81 ± 0.04. | [80] | |
| Thirteen symptoms, estimated local prevalence, image analysis, and molecular diagnostics | Diagnostics of COVID-19 | Bayesian inference network (BN) and set-cover models (SC) | A total of 55 patients, including those with fever (78%) or cough (77%), who applied for outpatient (n = 11) or inpatient treatment (n = 44). 51% (n = 28) were women, 49% were <60 years of age. Common comorbidities included diabetes (22%), hypertension (27%), cancer (16%), and cardiovascular disease (13%) | Sensitivity (81.6–84.2%) and specificity (58.8–70.6%) | [81] | |
| Symptoms found as the results of the examination, data on contacts | Diagnostics of COVID-19 | COvid Risk cALculator (CORAL) CDSS, using a modified Delphi method | A total of 2443 patients | 0.2% of false negative results | [84] | |
| Epidemiological history; Wedge-shaped/fan-shaped lesion, bilateral lower lobes; Opacity, chaotic paving pattern | Diagnostics of COVID-19 | TRIPOD type 3 or 2b | Undefined | Not shown | [85] | |
| Diagnostic manuals in text form + specialists able to interpret it | Manuals interpreted by a computer to carry out diagnostics | Data analysis based on the developed rules | Not shown | Not shown | [90] | |
| Blood tests | Diagnostics of COVID-19 | GNB, SVM, ANN | A total of 1186 patients | AUC 0.913, sensitivity 0.801 and specificity 0.890 | [82] | |
| 40 features, 12 selected: Lung involvement, cough, fever, dyspnea, oxygen deficiency in the blood, features of digestion, history of ARDS, history of contacts, disability, history of pulmonary infection, respiratory rate, rhinorrhea | Diagnostics of COVID-19 | Binary logistic regression (BLR) method and Forward Wald method | A total of 800 patients | Accuracy = 90.25% AUC = 0.835 | [86] | |
| A history of fever or presence of fever. Symptoms and signs of respiratory distress syndrome (cough, cold, sore throat, fatigue). Severe pneumonia or acute respiratory viral infections (ARVI) No other causes based on convincing clinical descriptions. A history of travel or residence abroad that reported local infection transmission | Diagnostics of COVID-19 | Naive Bayes Classifier | Not shown | Not shown | [88] | |
| Patient data, ventilator wave parameters. Patient blood saturation (SpO2), inspiratory volume (TVi), Expiratory tidal volume (TVe), Positive end expiratory pressure (PEEP) | Breath (cycle) recording classification: Normal, Artifact (does not contain Patient-Ventilator Asynchrony (PVA)), Double Trigger Asynchrony (DTA), or Breath Accumulation Asynchrony (BSA) Detection of acute respiratory distress syndrome (ARDS, ARDS) | Ensemble of extremely random trees classifier (ERTC), gradient boosted classifier (GBC), and multilayer perceptron (MLP) | A total of 9715 breath records from 35 ventilated patients | For the first classification accuracy is more than 0.97 for all three classes For the second classification AUC 0.88 | [92] | |
Publisher’s Note: MDPI stays neutral with regard to jurisdictional claims in published maps and institutional affiliations. |
© 2022 by the authors. Licensee MDPI, Basel, Switzerland. This article is an open access article distributed under the terms and conditions of the Creative Commons Attribution (CC BY) license (https://creativecommons.org/licenses/by/4.0/).
Share and Cite
Tolmachev, I.; Kaverina, I.; Vrazhnov, D.; Starikov, I.; Starikova, E.; Kostuchenko, E. Application of Artificial Intelligence Methods Depending on the Tasks Solved during COVID-19 Pandemic. COVID 2022, 2, 1341-1378. https://doi.org/10.3390/covid2100098
Tolmachev I, Kaverina I, Vrazhnov D, Starikov I, Starikova E, Kostuchenko E. Application of Artificial Intelligence Methods Depending on the Tasks Solved during COVID-19 Pandemic. COVID. 2022; 2(10):1341-1378. https://doi.org/10.3390/covid2100098
Chicago/Turabian StyleTolmachev, Ivan, Irina Kaverina, Denis Vrazhnov, Iurii Starikov, Elena Starikova, and Evgeny Kostuchenko. 2022. "Application of Artificial Intelligence Methods Depending on the Tasks Solved during COVID-19 Pandemic" COVID 2, no. 10: 1341-1378. https://doi.org/10.3390/covid2100098
APA StyleTolmachev, I., Kaverina, I., Vrazhnov, D., Starikov, I., Starikova, E., & Kostuchenko, E. (2022). Application of Artificial Intelligence Methods Depending on the Tasks Solved during COVID-19 Pandemic. COVID, 2(10), 1341-1378. https://doi.org/10.3390/covid2100098