Brief Report

The Role of Climate in the Spread of COVID-19 in Different Latitudes across the World

1
Department of Geography, Soran University, Soran, Erbil 44008, Iraq
2
Centre for Landscape and Climate Research, School of Geography, Geology and the Environment, University of Leicester, University Road, Leicester LE1 7RH, UK
3
National Centre for Earth Observation, University of Leicester, Space Park Leicester, 92 Corporation Road, Leicester LE4 5SP, UK
*
Author to whom correspondence should be addressed.
COVID 2022, 2(9), 1183-1192; https://doi.org/10.3390/covid2090085
Submission received: 14 July 2022 / Revised: 11 August 2022 / Accepted: 17 August 2022 / Published: 23 August 2022

Abstract

:
Most transmittable diseases appear in a specific season and the effect of climate on COVID-19 is of special interest. This study aimed to investigate the relationship between climatic variables and the R0 of COVID-19 cases in a list of areas in different latitudes around the world. The daily confirmed cases of COVID-19 and climatic data of each area per day from January 2020 to March 2021 were utilized in the study. The GWR and MLR methods were used to identify the relationship between the R0 of COVID-19 cases and climatic variables. The MLR results showed a significant (p-value < 0.05) weak inverse relationship between the R0 of COVID-19 cases and wind speed, but a positive significant (p-value < 0.01) relationship with precipitation. This implies that lower COVID-19 cases were recorded with high wind speed and low precipitation. Based on GWR, the R0 of COVID-19 infection assessed against air temperature, rh, and precipitation was found to be statistically significant using the Monte Carlo p-value test, and the effect of climatic variables on COVID-19 infection appears to vary geographically. However, besides climatic variables, many socioeconomic factors could influence the virus’s transmission and will need to be considered in future studies.

1. Introduction

The coronavirus disease COVID-19 emerged in China between the end of 2019 and early 2020. Since then it has rapidly spread to other countries around the world, and the World Health Organization declared COVID-19 a pandemic [1,2]. The number of confirmed cases and casualties of SARS-CoV2 has exceeded the number of SARS-CoV1 and MERS-CoV casualties [3].
Most transmittable diseases appear in a specific season; for instance, influenza is not readily transmitted in hot and humid situations and shows seasonality in the regions with a temperate and climate where the peak of infections happens during winter [1,4]. Likewise, SARS-CoV1 and MERS-CoV also showed seasonal patterns and correlations with temperature. The peak of the first occurred during the spring while the second was transmitted in warm climates during spring and summer seasons [5]. People stay indoors more in winter, which can assist the spread of diseases; and vitamin D levels in people tend to drop in winter, which may reduce their immunity [6]. These may be among the reasons for the more rapid spread of infectious diseases in winter.
R naught or zero (R0) refers to the reproduction number or the effective reproduction number (Re) of the virus. It describes the average number of people each infected person will infect where there is no pre-existing immunity in the community, based on three factors: the duration, the likelihood of infection and the frequency of contact [7]. R0 is an exponent of the spread of a virus, firstly used to evaluate the capability of a disease to infect society, and secondly to locate the fraction of the society which should be vaccinated [8].
Even though cultural factors and population density are influencing the growth and spread of COVID-19, the effect of climate on the virus is of special interest [5] and cannot be neglected. Visual assessment of the global maps of COVID-19 infection display that the disease is less prevalent in hot and humid countries that lie on the Equator [6]. At the local scale, Ahmadi et al. [9] detected that COVID-19 infection in Iran is high in cities with low degrees of wind speed, humidity, and solar radiation. Rasul and Ibrahim [10] assessed the influence of climatic variables and sociodemographic characteristics on COVID-19 infections in Iraqi cities. In China, Wang et al. [11] used linear regression to reveal that high temperature and high humidity significantly decreased the spread of COVID-19 in 100 cities. However, further research is essential to assess the influence of climatic elements on the virus in different latitude areas on the global scale using multivariate methods instead of univariate approaches.
Therefore, this study aimed to investigate the relationship between climatic variables and the R0 of detected COVID-19 cases by comparing the transmission performance of the virus in small regions around the world. The novel contribution of this research is the quantitative analysis of relationships between SARS-CoV2 spread and principal climatic elements in a list of areas in different latitudes around the world using the multivariate regression method. The research results will support policymakers in monitoring and improving climate-related health in cities, states, and small countries.

2. Materials and Methods

2.1. Data

A list of states, provinces (e.g., states of Canada, China, and Australia that provide COVID-19 data at the state level), and small countries (smaller than 20,000 km2; e.g., Malta, Qatar, Fiji, Lebanon, Kuwait, and Gambia) was selected for this study. The reason for selecting small regions was that COVD-19 infection data on the city scale are not available in all countries, so we ignored large countries where only COVID-19 data at the country scale were available.
Data of daily confirmed COVID-19 from January 2020 to March 2021 in selected areas were downloaded from Humdata.org (2020) [12]. Daily data of weather components (air temperature, relative humidity, atmospheric pressure, visibility, and wind speed) across weather stations in the study areas were obtained using the Worldmet package of R programming [13]. Surface meteorological data of regional weather stations were downloaded via the Worldmet package from the NOAA Integrated Surface Database (ISD).

2.2. Statistical Analysis

To obtain an accurate rate of transmission, only those data collected after 30 cases of COVID-19 were reported in each region were used in the R0 production [14]. The basic R0 transmissibility projected by Cori et al. [15] framework was used to estimate each COVID-19 patient spread to how many individuals. The method generates robust analytical speculates of R. When the result of R0 is higher than 1, this means the virus spreads fast and has a larger spread with a higher number of R0 values [16]. This tool estimates Rt from the time series of cases and therefore reproduces the R0 of the pandemic [15].
The association between the R0 of the daily confirmed cases of COVID-19 of selected regions and daily weather variables was assessed. We converted the hourly data of downloaded weather stations to daily data before data analyses. Geographically weighted regression (GWR) and multiple linear regression (MLR) approaches were used to quantify the linear and spatial regression analyses.
Statistical processing was performed in R programming (i.e., spgwr [17] and sp [18] packages). GWR multivariate regression was performed and preferred over univariate regression because in multivariate regression it is possible to quantify the partial contributions of each variable and obtain a robust assessment correlation between the R0 of COVID-19 infection and explanatory climatic variables. GWR is the localized regression suggested by Brunsdon et al. [19], which assesses non-stationary variables [20]. The model is stated as Equation (1) and MLR is expressed as Equation (2). The GWR Gaussian weights function was applied for modeling GWR in Equation (3), while sp, ggplot2 [21] and some other packages were used for visualization results of the study.
y i   = β 0 ( u i ,   v i ) + k β k ( u i ,   v i ) x i k + ε i
where ( u i ,   v i ) implies the coordinates of the i th point in space, β 0 and β k are parameters to be estimated, and ε i is the random error term at point i .
y = b 0 + b 1 x 1 + b 2 x 2 + + b n x n + e  
where y is the dependent variable, b 0 is the y-intercept, x the explanatory variables, b n slop coefficient for x n , and e model error.
w ( g ) = e ( d / h ) 2
where d is the distance and h is the bandwidth.

3. Results and Discussion

The research aimed to display the influence of climatic variables on COVID-19 at state and country levels in different latitudes around the world. Results on this association will assist researchers to better compare the conditions favoring the new virus. Based on the daily climatic variables and R0 of confirmed COVID-19 case analyses, the results are as follows.

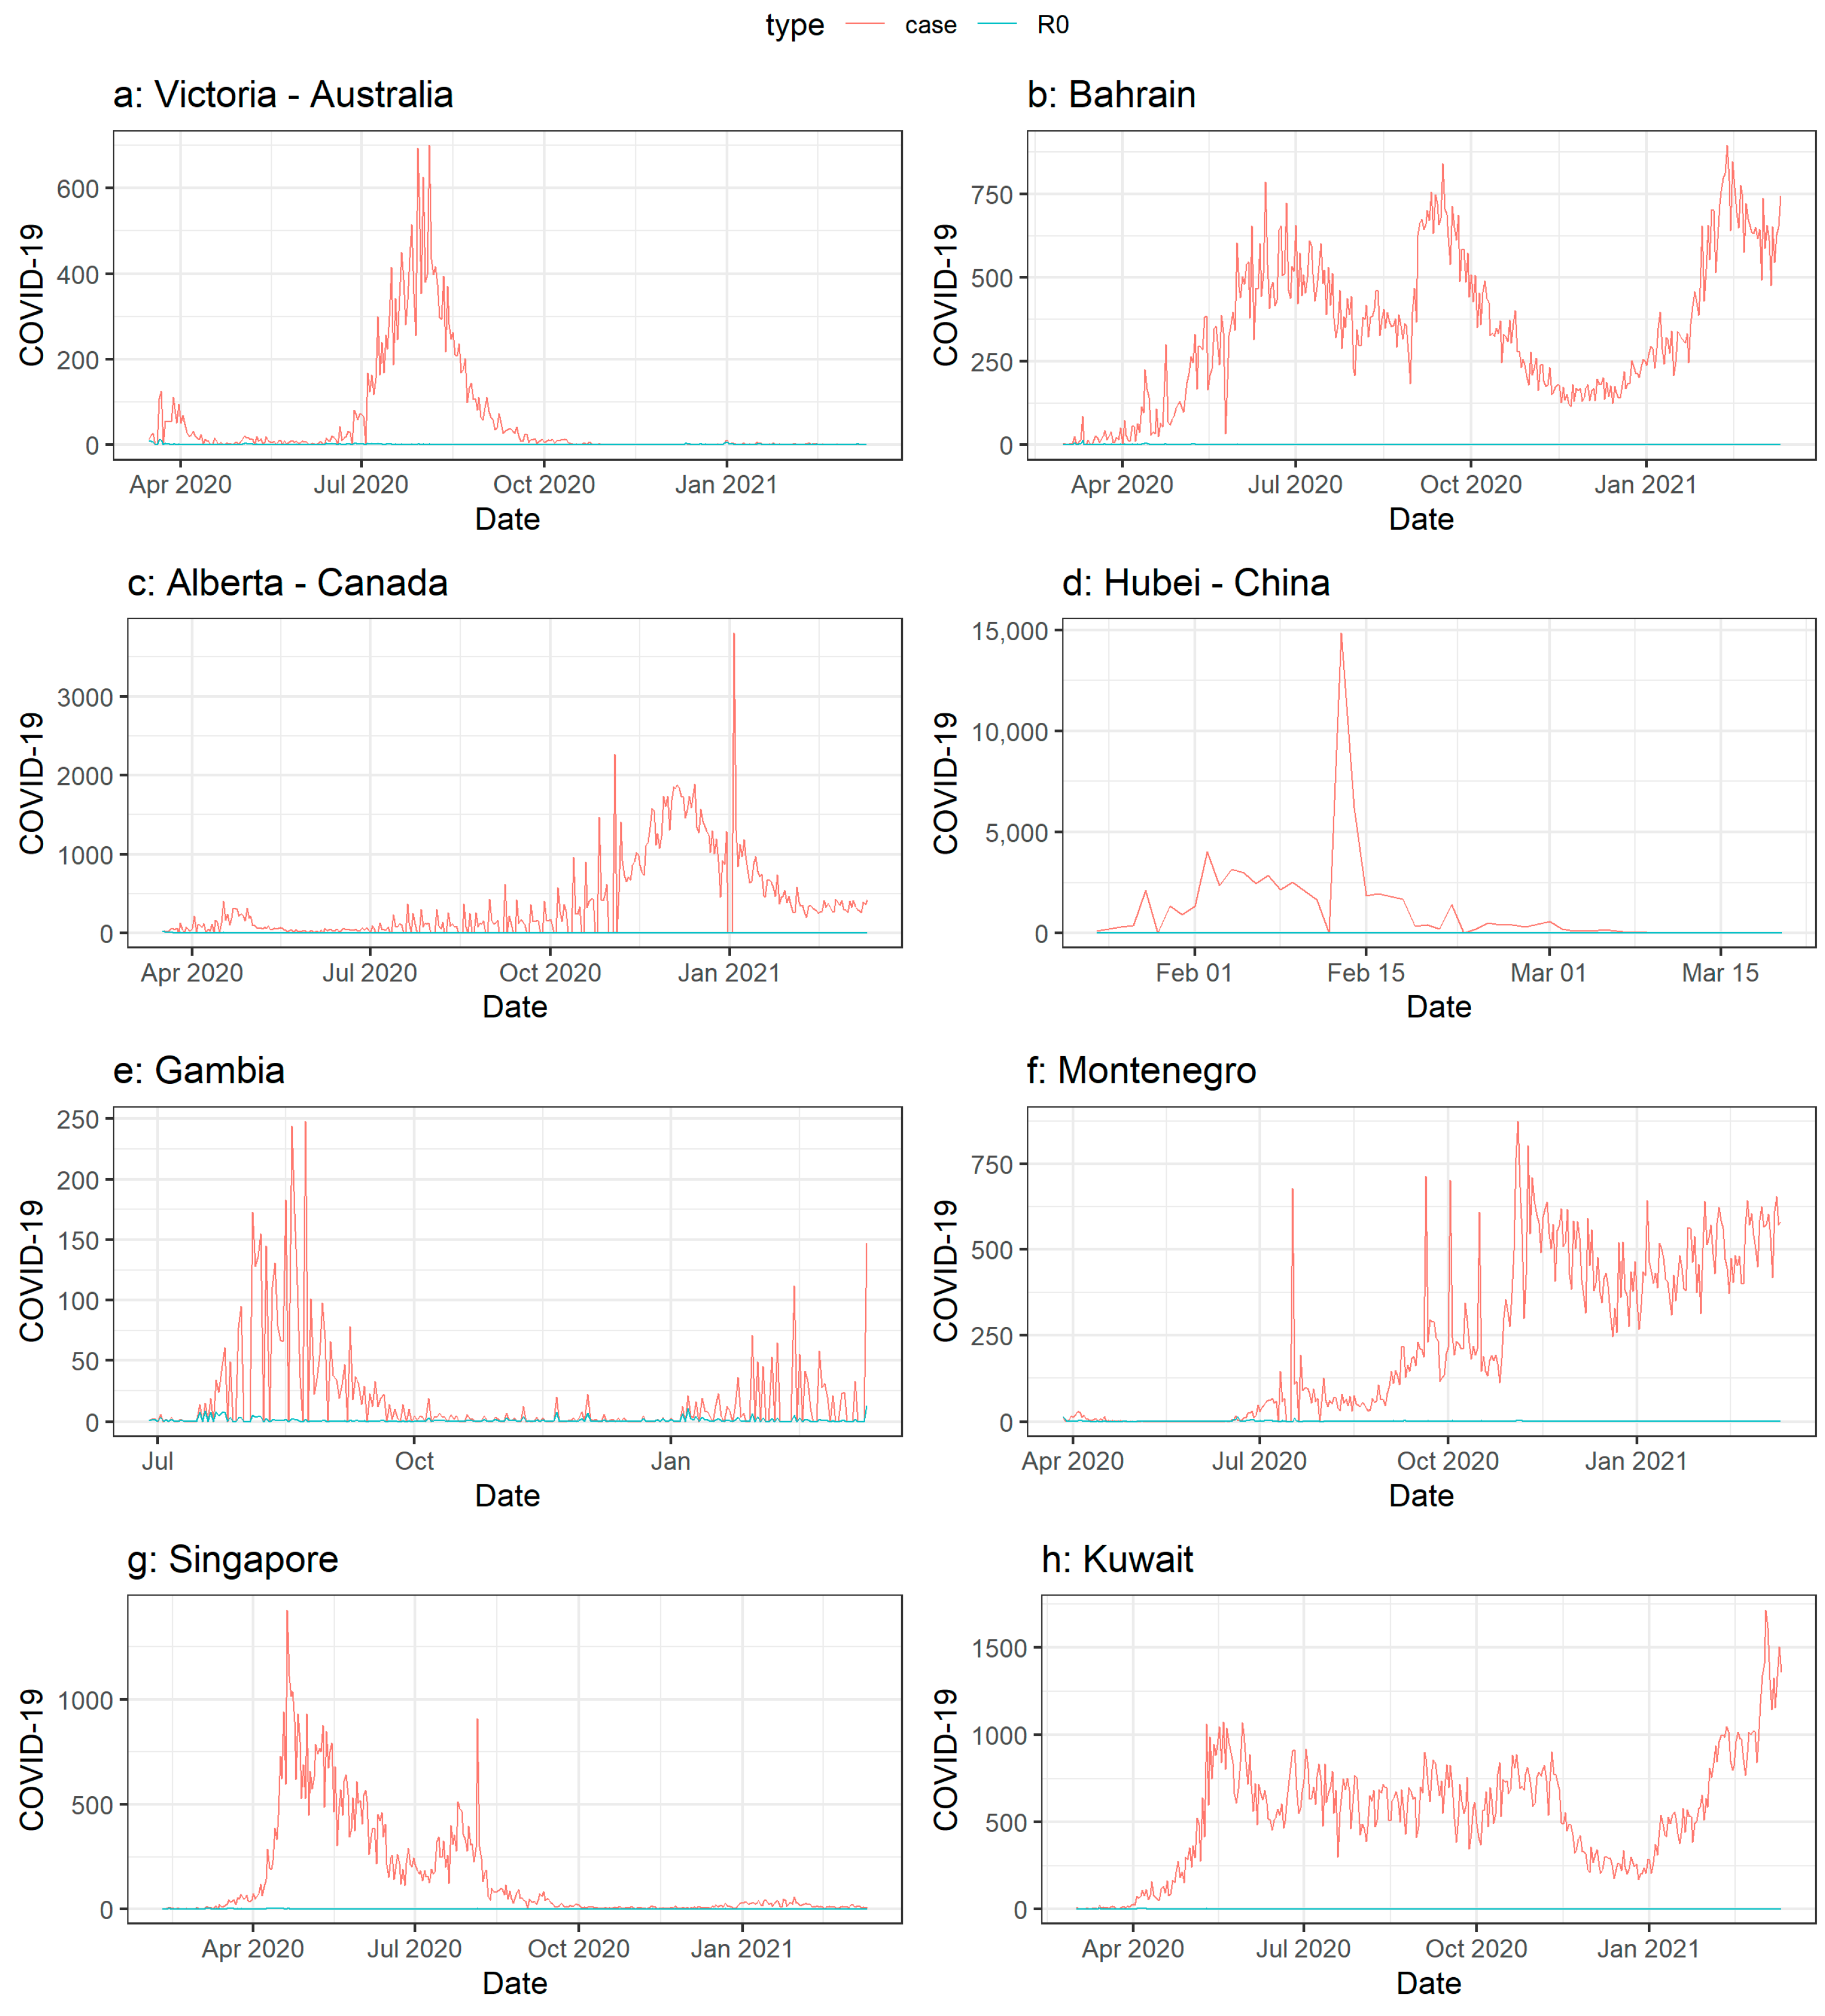
3.1. Number of Cases and R0 of COVID-19 Infection

As an example of areas examined in the study, Figure 1 displays the number of recorded cases and the R0 in eight areas. In Victoria Australia (37.81 S), the peak occurred at the end of July and the start of August 2020 (700 people per day) while the highest R0 occurred on 22 March 2020 when R0 reached 11.6. Figure 1 displays three peaks in Bahrain (26.27 N): 12 February 2021 (896 cases per day), 16 September 2020 (841 cases per day), and 15 June 2020 (786 people per day). In terms of R0, it reached the highest rank on 11 March 2020, which was 15.1. The figure displays the peak of cases in January 2021 and fluctuation in the number in Alberta Canada (53.08 N). The highest R0 occurred at the beginning of the disease, in March 2020 (R0 = 16.8). In May 2020 it fell to less than one, then increased to more than one during June and July 2020.
In the Hubei Province of China (31.37 N), which includes Wuhan, the first center of the pandemic, cases started at the end of January 2020 and reached a high on 13 February 2020, which was 14,840 cases per day. One of the highest R0 rates occurred on 28 January 2020 (R0 = 28.9). In Gambia (13.34 N), two peaks occurred in the number of cases, while the number of cases start rising during July 2020 in Montenegro (42.37 N). The figure displays fluctuations in the number of cases and the highest peak (1716 cases per day) on 4 March 2021, while the R0 during the same day was 1.77. It stayed at more than one during the final day of the period of our research study but the highest R0 was 7.47 during 14 March 2020. In Singapore, two peaks in the number of cases occurred, then the rate fell. The highest number of cases was 1426, recorded on 20 April 2020, but the highest R0 (5.3) occurred on 10 February 2020 with the beginning of spread of the disease in the country.

3.2. Relationship of R0 of COVID-19 Infection and Climatic Variables Based on MLR Method

“Pr(>|t|)” in Table 1 refers to significance and 0.05 has been used as a threshold for the statistical significance of associations. A small p-value indicates that we can reject the null hypothesis, which allows us to conclude that there is a relationship between the R0 of COVID-19 spread and examined climatic variables. The model of MLR is significant (p < 0.01) in general, while at variables level, only precipitation and wind speed are significantly correlated with lag7 of the R0 COVID-19 infection. This result is in agreement with Sajadi et al. [5], who found a close relationship between COVID-19 R0 cases and climatic drivers exists. In particular, wind speed was negatively correlated with COVID-19 infection and increasing wind speed could potentially decrease COVID-19 infection by 0.016 per unit. In contrast, precipitation was found to be positively correlated with COVID-19 infection, meaning that an increase in rainfall could increase COVID-19 infection by 0.008 per mm unit (Table 1). In order to improve the model, after we removed insignificant variables and ran the model again, based on the MLR method, precipitation was the main variable found to influence the spread of COVID-19 (coefficient = 0.008842; p < 0.01).

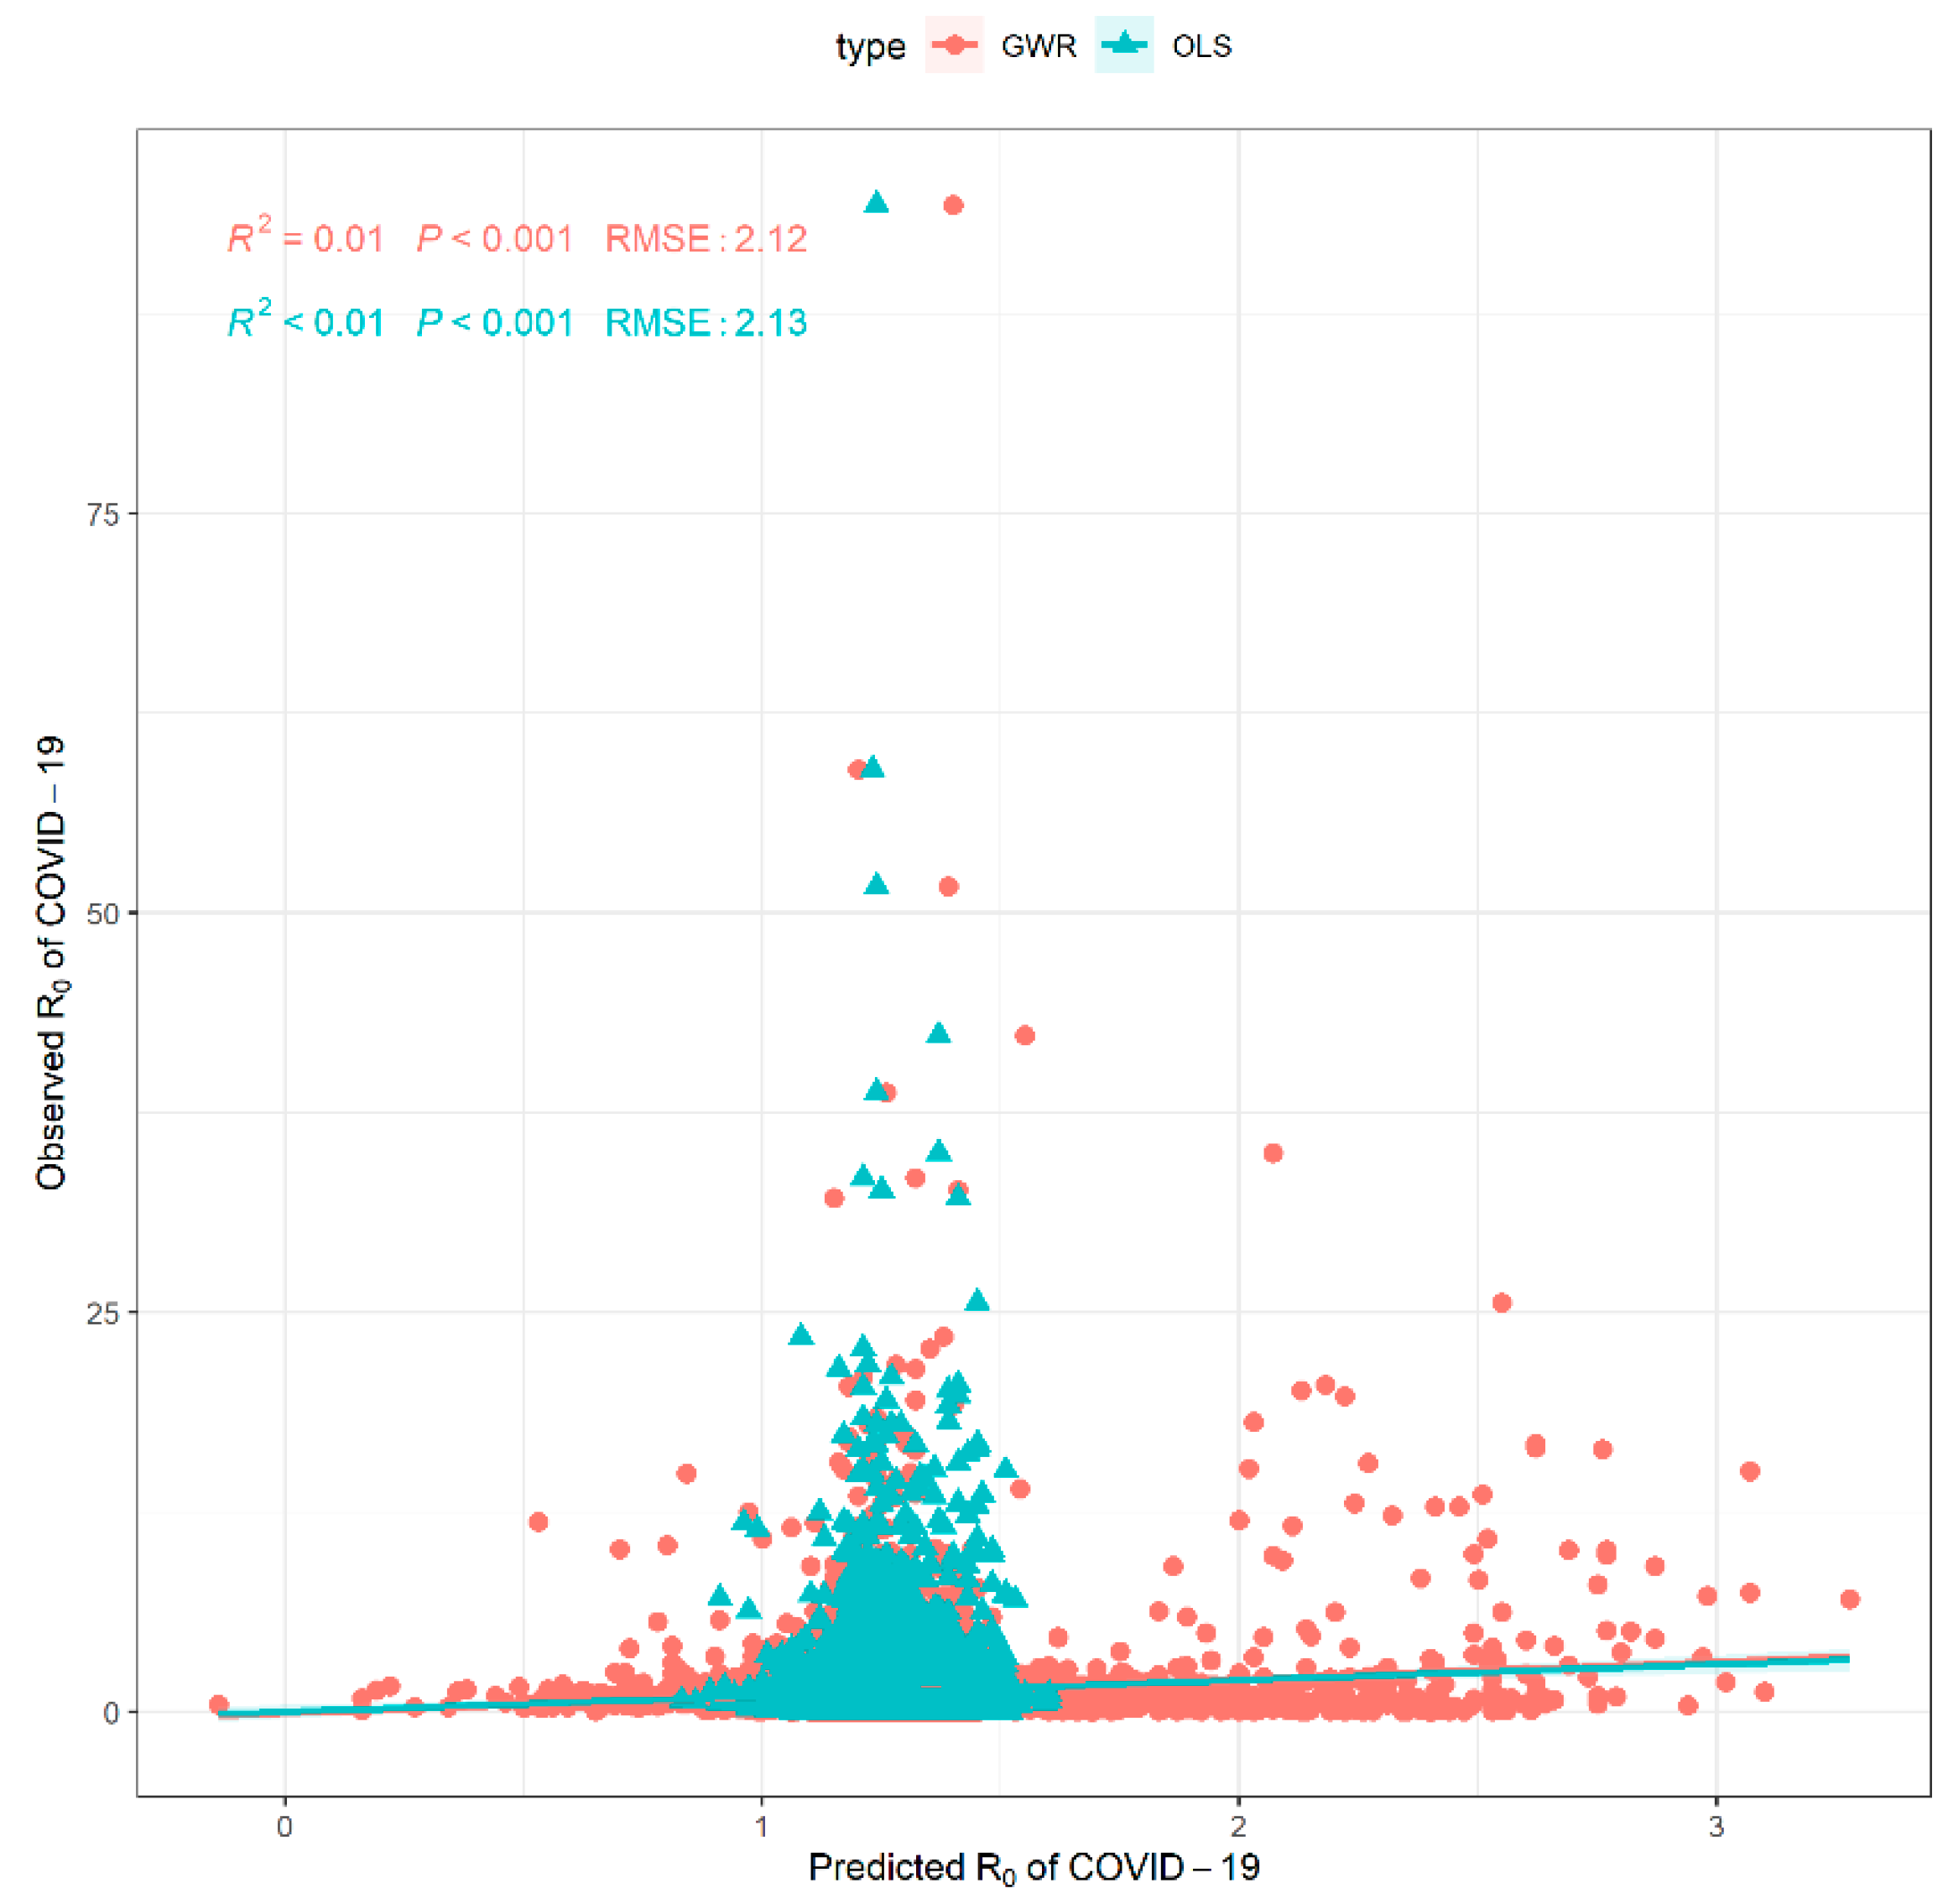
3.3. Relationship between R0 of COVID-19 Infection and Climatic Variables Based on GWR Method

The R0 of COVID-19 infection assessed against precipitation, rh, and average air temperature was found statistically significant using the Monte Carlo p-value test. Generally, the GWR method showed a negative relationship between R0 and wind speed (insignificant) and air temperature (significant) while the relationship was positive with precipitation and relative humidity (Table 2). However, this negative relationship was changed to positive in some areas (Table 3).
Regarding the spatial variation of regression, the effects of wind speed, temperature, humidity, precipitation, and air pressure on COVID-19 infection appear to vary geographically. Table 3 displays that increasing air temperature led to decreasing R0 of COVID-19 in some areas; for instance, in the Chinese provinces, Aruba, Brunei, and New Brunswick in Canada (negative regression), while it led to increasing infection in some areas such as Qatar, Mayotte, and Western Australia (positive regression, Table 3). Wind speed was (statistically insignificantly) negatively correlated to COVID-19 infection in most examined areas in Asia, Australia, and Caribbean Islands while positively correlated with COVID-19 infection in the Isle of Man, Luxembourg, Channel Islands, and Montenegro. Relative humidity was found to be negatively related to infection in Europe (e.g., Gibraltar, Malta, Luxembourg, and Montenegro), while increasing relative humidity led to an increase in COVID-19 infection in the most examined areas, (e.g. Jilin, Ontario, Lebanon, and Hubei province). Air pressure was found insignificant in a negative relationship with infection of COVID-19 in areas such as Canada, Aruba, and Jamaica while in a positive relationship in countries such as Australia, Gambia, and Gibraltar. Precipitation was found to have a significant positive influence on the R0 of COVID-19 in most examined areas, for instance in China, Brunei, and the Maldives, while having a minor negative influence in Gibraltar, Alberta, and Saskatchewan provinces in Canada.
Based on both MLR at the global scale and GWR at local levels, precipitation was significantly correlated with R0 spread of COVID-19 and high rainfall was associated with increasing cases. In our research, comparing OLS and GWR, based on Brunsdon, Fotheringham, and Charlton’s (2002) ANOVA test, the GWR (SS residuals = 49,865, AICc = 33,514.041) provides a statistically significant (p-value 0.3) improvement over OLS (SS residuals = 5,0431, AICc = 33,591.833).
Figure 2 shows the GWR-based predicted R0 of COVID-19 infection, the standard error of predicted R0, and localR2. High pred_se was observed in East of Asia. In general, localR2 was low and less than 0.1. The highest localR2 values were 0.053 and 0.052 in Zhejiang and Hong Kong provinces in China, respectively. Figure 3 displays that predicted and observed R0 was statistically significantly correlated and predicted R0 based on GWR had less rmse (2.12) than the rmse of predicted R0 based on OLS (2.13). The low R square values in Figure 3 (while the relationship was significant statistically), may be the reason only a small portion of y (COVID-19 spread) was explained by x (climatic variables). There are many measurements and socioeconomic factors that could be responsible for COVID-19 spread and are not included in our model.

4. Conclusions

While the cases and deaths of COVID-19 have risen, assessing the influence of climate on the spread of the virus in different latitude areas on the global scale is essential, using multivariate methods (e.g., GWR) instead of univariate approaches.
Our results report that based on both MLR and GWR methods, precipitation is the main significant climatic driver of the R0 of COVID-19 cases both at the global and local scale. Based on GWR, the R0 of COVID-19 infection assessed against precipitation, rh, and average air temperature was found statistically significant; however, the effect of climatic variables appears to vary geographically. In our research, comparing OLS and GWR, the GWR provides a statistically significant (p-value 0.3) improvement over OLS.
Previous studies focusing on socioeconomic parameters have shown that population density, hospital, diabetes, and aged patients have been found to be the main drivers controlling the R0 of COVID-19 cases. In future research, we recommend examining the combined effects of socioeconomic and climatic parameters to assess sustainable cities, countries, and societies.

Author Contributions

Conceptualization, A.R.; data curation, A.R.; formal analysis, A.R.; investigation, A.R.; methodology, A.R.; resources, A.R.; software, A.R.; visualization, A.R.; writing—original draft, A.R. and H.B.; writing—review and editing, A.R. and H.B. All authors have read and agreed to the published version of the manuscript.

Funding

This research received no external funding. H.B. is supported by the National Centre for Earth Observation in the UK with a grant from the Natural Environment Research Council.

Institutional Review Board Statement

Not applicable, because this article does not contain any studies with human or animal subjects.

Informed Consent Statement

Not applicable. Used COVID-19 data are open access and available at: Humdata.org (2020) [12].

Data Availability Statement

Produced and used data available online on GitHub: https://github.com/Azad77/Relationship_Climate_and_R0_Covid19, accessed on 18 August 2022.

Acknowledgments

The authors would like to thank Benjamin Zaitchik at Johns Hopkins University for insightful critiques and suggestions. Many thanks go to Humdata.org for providing COVID-19 infection data.

Conflicts of Interest

The authors declare no conflict of interest.

References

  1. Bukhari, Q.; Jameel, Y. Will Coronavirus Pandemic Diminish by Summer? SSRN Electron. J. 2020. Available online: http://dx.doi.org/10.2139/ssrn.3556998 (accessed on 18 August 2022). [CrossRef]
  2. Wu, D.; Wu, T.; Liu, Q.; Yang, Z. The SARS-CoV-2 Outbreak: What We Know. Int. J. Infect. Dis. 2020, 94, 44–48. [Google Scholar] [CrossRef] [PubMed]
  3. Johns Hopkins University COVID-19 Map. Available online: https://coronavirus.jhu.edu/map.html (accessed on 30 June 2021).
  4. Sajadi, M.M.; Habibzadeh, P.; Vintzileos, A.; Shokouhi, S.; Miralles-Wilhelm, F.; Amoroso, A. Temperature and Latitude Analysis to Predict Potential Spread and Seasonality for COVID-19. SSRN Electron. J. 2020. Available online: http://dx.doi.org/10.2139/ssrn.3550308 (accessed on 18 August 2022). [CrossRef] [PubMed]
  5. Caspi, G.; Shalit, U.; Kristensen, S.L.; Aronson, D.; Caspi, L.; Rossenberg, O.; Shina, A.; Caspi, O. Climate Effect on COVID-19 Spread Rate: An Online Surveillance Tool. MedRxiv 2020. [Google Scholar] [CrossRef] [Green Version]
  6. Chen, S.; Prettner, K.; Kuhn, M.; Geldsetzer, P.; Wang, C.; Bärnighausen, T.; Bloom, D.E. Climate and the Spread of COVID-19. Sci. Rep. 2021, 11, 9042. [Google Scholar] [CrossRef] [PubMed]
  7. Mahase, E. COVID-19: What is the R number? BMJ 2020, 369, m1891. [Google Scholar] [PubMed]
  8. Dharmaratne, S.; Sudaraka, S.; Abeyagunawardena, I.; Manchanayake, K.; Kothalawala, M.; Gunathunga, W. Estimation of the Basic Reproduction Number (R0) for the Novel Coronavirus Disease in Sri Lanka. Virol. J. 2020, 17, 144. [Google Scholar] [CrossRef] [PubMed]
  9. Ahmadi, M.; Sharifi, A.; Dorosti, S.; Ghoushchi, S.J.; Ghanbari, N. Investigation of Effective Climatology Parameters on COVID-19 Outbreak in Iran. Sci. Total Environ. 2020, 729, 138705. [Google Scholar] [CrossRef] [PubMed]
  10. Rasul, A.; Ibrahim, S. Relationship between Weather and Sociodemographic Indicators and COVID-19 Infection in Iraq; Social Science Research Network: Rochester, NY, USA, 2020. [Google Scholar]
  11. Wang, J.; Tang, K.; Feng, K.; Lv, W. Impact of Temperature and Relative Humidity on the Transmission of COVID-19: A Modeling Study in China and the United States. SSRN Electron. J. 2021. Available online: http://dx.doi.org/10.2139/ssrn.3551767 (accessed on 18 August 2022). [CrossRef] [PubMed]
  12. Novel Coronavirus (COVID-19) Cases Data—Humanitarian Data Exchange. Available online: https://data.humdata.org/dataset/novel-coronavirus-2019-ncov-cases (accessed on 20 April 2020).
  13. Carslaw, D. Worldmet: Import Surface Meteorological Data from NOAA Integrated Surface Database (ISD). GitHub Repos. 2020. Available online: https://davidcarslaw.github.io/worldmet/ (accessed on 18 August 2022).
  14. Smit, A.J.; Fitchett, J.M.; Engelbrecht, F.A.; Scholes, R.J.; Dzhivhuho, G.; Sweijd, N.A. Winter Is Coming: A Southern Hemisphere Perspective of the Environmental Drivers of SARS-CoV-2 and the Potential Seasonality of COVID-19. Int. J. Environ. Res. Public Health 2020, 17, 5634. [Google Scholar] [CrossRef] [PubMed]
  15. Cori, A.; Ferguson, N.M.; Fraser, C.; Cauchemez, S. A New Framework and Software to Estimate Time-Varying Reproduction Numbers during Epidemics. Am. J. Epidemiol. 2013, 178, 1505–1512. [Google Scholar] [CrossRef] [PubMed] [Green Version]
  16. Team, W.E.R. Ebola Virus Disease in West Africa—the First 9 Months of the Epidemic and Forward Projections. N. Engl. J. Med. 2014, 371, 1481–1495. [Google Scholar] [CrossRef] [PubMed] [Green Version]
  17. Bivand, R.; Yu, D.; Nakaya, T.; Garcia-Lopez, M.-A.; Bivand, M.R. Package ‘Spgwr’. R Softw. Package 2020. Available online: https://CRAN. R-project. org/package= spgwr (accessed on 18 August 2022).
  18. Pebesma, E.; Bivand, R.; Rowlingson, B.; Gomez-Rubio, V.; Hijmans, R.; Sumner, M.; MacQueen, D.; Lemon, J.; Lindgren, F.; O’Brien, J.; et al. Gomez-Rubio Classes and Methods for Spatial Data [R Package Sp Version 1.4-5]. Available online: https://CRAN.R-project.org/package=sp (accessed on 8 June 2021).
  19. Brunsdon, C.; Fotheringham, A.S.; Charlton, M.E. Geographically Weighted Regression: A Method for Exploring Spatial Nonstationarity. Geogr. Anal. 1996, 28, 281–298. [Google Scholar] [CrossRef]
  20. Zhou, X.; Wang, Y.-C. Dynamics of Land Surface Temperature in Response to Land-Use/Cover Change. Geogr. Res. 2011, 49, 23–36. [Google Scholar] [CrossRef]
  21. Wickham, H.; Chang, W.; Wickham, M.H. Package ‘Ggplot2’: Create Elegant Data Visualisations Using the Grammar of Graphics. R Softw. Package 2020, 2, 1–189. [Google Scholar]
Figure 1. Examples of the number of cases and R0 of COVID-19 infection. The red line is the number of recorded cases and the blue line is the R0. (a) Victoria—Australia, (b) Bahrain, (c) Alberta—Canada, (d) Hubei—China, (e) Gambia, (f) Montenegro, (g) Singapore, (h) Kuwait.
Covid 02 00085 g001
Figure 2. GWR-based predicted R0 of COVID-19 infection (a), standard error of predicted R0 (b), and localR2 (c) in different latitudes.
Covid 02 00085 g002
Figure 3. Validation of predicted R0 of COVID-19 infection based on OLS and GWR methods.
Covid 02 00085 g003
Table 1. Statistics of regression between climatic variables and lag7 R0 of COVID-19 based on the multiple linear regression method.
EstimateStd.ErrortvaluePr(>|t|)
Intercept−7.1331513.209931−2.220.0263 *
Wind Speed−0.0161020.009561−1.680.0922.
Average Temperature−0.0022820.001980−1.150.2492
Precipitation0.0082560.0031302.640.0084 **
Rh0.0015590.0015041.040.3000
Air Pressure0.0001010.0004640.220.8276
After Removing Insignificant Variables
Intercept−7.6581603.023472−2.5330.01133 *
Wind Speed−0.0154460.009546−1.6180.10567
Precipitation0.0088420.0029712.9760.00293 **
Signif. codes: 0 ‘***’ 0.001 ‘**’ 0.01 ‘*’ 0.05 ‘.’ 0.1 ‘ ’ 1.
Table 2. Summary statistics of GWR coefficient parameter estimates between daily climatic variables and lag7 R0 of COVID-19.
Min.MedianMax.GlobalMonte Carlo p-Value
Intercept.−62.7119−5.27362.2711−7.1330.00
Wind Speed−0.078−0.00260.006−0.0160.33
Average Temperature−0.016−0.00270.022−0.0020.03
Rh−0.00470.00650.01390.0020.00
Precipitation−0.001370.00580.06270.0080.00
Air Pressure−0.00053−0.00020.001370.00010.15
After Removing Insignificant Variables
Intercept.−65.8430−5.43952.2491−8.24810.00
Average Temperature−0.0140−0.00260.0182−0.00210.04
Rh−0.00450.00630.01460.00160.00
Precipitation−0.00070.00600.06550.00930.00
Table 3. GWR coefficient estimates between daily climatic variables and lag7 R0 of COVID-19 in different latitudes.
AreaLatitudeLongitudeX.Intercept.Wind SpeedAverage Air TemperatureRelative HumidityPrecipitationAir Pressure
French Guiana64.1667–51.7500–4.1572–0.0034–0.00560.00880.0048–0.0004
Isle of Man54.0833–4.62391.68140.0062–0.0039–0.0047–0.00010.0003
Alberta53.5667–113.51672.2667–0.0224–0.00020.0065–0.0014–0.0004
Saskatchewan50.2000–104.70001.2325–0.0163–0.00080.0065–0.0004–0.0004
Manitoba49.8833–97.13330.3030–0.0120–0.00130.00660.0005–0.0004
Luxembourg49.62666.21151.60830.0059–0.0012–0.0044–0.0001–0.0001
Channel Islands49.4350–2.60201.76680.0051–0.0029–0.0045–0.00020.0004
Newfoundland and Labrador47.6186–52.7519–4.7149–0.0026–0.00460.00900.0053–0.0004
Liechtenstein47.13339.51671.51500.0053–0.0001–0.0040–0.0000–0.0002
Prince Edward Island46.2833–63.1333–4.2993–0.0022–0.00390.00890.0049–0.0005
New Brunswick45.9200–66.6000–3.9759–0.0023–0.00360.00870.0046–0.0005
Jilin43.9964125.6808–62.7119–0.0785–0.01600.01240.06280.0002
Ontario43.6772–79.6306–2.4008–0.0039–0.00270.00760.0031–0.0005
Montenegro42.366719.25001.06830.00380.0030–0.00280.0003–0.0003
Xinjiang41.733385.8167–52.2264–0.0167–0.00370.01110.0522–0.0001
Liaoning40.6667122.2000–62.2737–0.0679–0.01550.01280.06230.0002
Hebei40.0801116.5846–61.7733–0.0566–0.01490.01330.06170.0002
Shanxi37.7469112.6284–61.5048–0.0453–0.01390.01370.06140.0002
Ningxia37.4833105.6833–60.8694–0.0317–0.01210.01400.06070.0001
Shandong36.1833118.1500–61.7997–0.0536–0.01460.01320.06170.0002
Gibraltar36.1512–5.34972.0293–0.0002–0.0013–0.0035–0.00050.0010
Malta35.857514.47751.46100.00150.0031–0.0027–0.00010.0001
Cyprus35.150033.40000.2711–0.00040.0070–0.00060.0009–0.0002
Lebanon33.820935.48840.1218–0.00170.0074–0.00030.0010–0.0001
Jiangsu32.8500120.2833–61.4212–0.0524–0.01460.01300.06140.0002
Bermuda32.3667–64.6833–4.6579–0.0013–0.00350.00890.0052–0.0005
Hubei31.1667112.6333–61.2376–0.0355–0.01310.01360.06110.0002
Sichuan29.9833103.0000–60.7495–0.0179–0.01010.01390.06050.0001
Kuwait29.383348.0000–2.5896–0.00990.00750.00090.0036–0.0000
Zhejiang28.4500119.9167–60.3267–0.0450–0.01420.01270.06030.0002
Hunan27.1833111.4500–60.6136–0.0277–0.01230.01350.06040.0001
Jiangxi27.1167114.9667–60.3716–0.0339–0.01310.01310.06020.0002
Guizhou26.5385106.8007–60.6065–0.0192–0.01090.01370.06040.0001
Bahrain26.270850.6336–4.1320–0.01380.00730.00130.00510.0000
Qatar25.261151.5651–4.8284–0.01510.00730.00140.00580.0000
Yunnan25.0167101.5167–60.1998–0.0108–0.00880.01360.05990.0001
Guangxi24.3500109.4000–60.0336–0.0205–0.01130.01330.05980.0001
Guangdong23.3924113.2988–59.3091–0.0258–0.01230.01290.05920.0002
Hong Kong22.4000114.2000–58.7490–0.0261–0.01230.01270.05860.0002
Cayman Islands19.6870–79.8828–3.5209–0.0014–0.00270.00750.0042–0.0005
Hainan19.5167109.5833–58.1775–0.0152–0.01070.01270.05800.0001
Sint Maarten18.0458–63.1147–5.2734–0.0006–0.00320.00900.0058–0.0005
Jamaica17.9357–76.7875–3.9823–0.0010–0.00280.00780.0046–0.0005
Saint Lucia17.3112–62.7187–5.3245–0.0006–0.00320.00910.0059–0.0005
Dominica15.3330–61.3830–5.4704–0.0006–0.00320.00910.0060–0.0005
Cabo Verde14.9333–23.48330.3947–0.0098–0.00190.00190.00070.0008
Martinique14.6000–61.0000–5.5158–0.0006–0.00320.00920.0060–0.0005
Gambia13.3380–16.65221.8652–0.0113–0.0006–0.0001–0.00060.0014
Aruba12.5000–70.0170–4.9454–0.0004–0.00290.00850.0055–0.0005
Curacao12.2000–68.9670–5.0529–0.0004–0.00300.00860.0056–0.0005
Bonaire, Sint Eustatius and Saba12.1500–68.2830–5.1142–0.0004–0.00300.00870.0057–0.0005
Grenada12.0000–61.7830–5.5728–0.0004–0.00310.00920.0061–0.0005
Trinidad and Tobago10.5833–61.3500–5.6484–0.0004–0.00310.00920.0062–0.0004
Brunei4.9442114.9284–42.5733–0.0138–0.00890.00710.04300.0002
Maldives4.191873.5291–38.9624–0.02460.00750.00450.03940.0001
Seychelles–4.674355.5218–16.8494–0.05270.01690.00140.01760.0001
Comoros–11.533743.2719–9.2050–0.07020.02130.00130.01010.0000
Mayotte–12.804745.2811–11.1706–0.07200.02230.00090.01200.0001
Fiji–18.0433178.5592–11.8107–0.02270.0081–0.00370.01300.0007
New Caledonia–22.0146166.2130–11.7658–0.02200.0091–0.00330.01290.0009
Western Australia–31.9403115.9669–10.1166–0.00750.0074–0.00230.01120.0010
Australian Capital Territory–35.3069149.1950–11.4782–0.01850.0113–0.00270.01250.0013
Publisher’s Note: MDPI stays neutral with regard to jurisdictional claims in published maps and institutional affiliations.

