
Retrospective Evaluation of the Effectiveness of COVID-19 Control Strategies Implemented by the Victorian Government in Melbourne—A Proposal for a Standardized Approach to Review and Reappraise Control Measures

Abstract
:1. Introduction
2. Method
3. Results
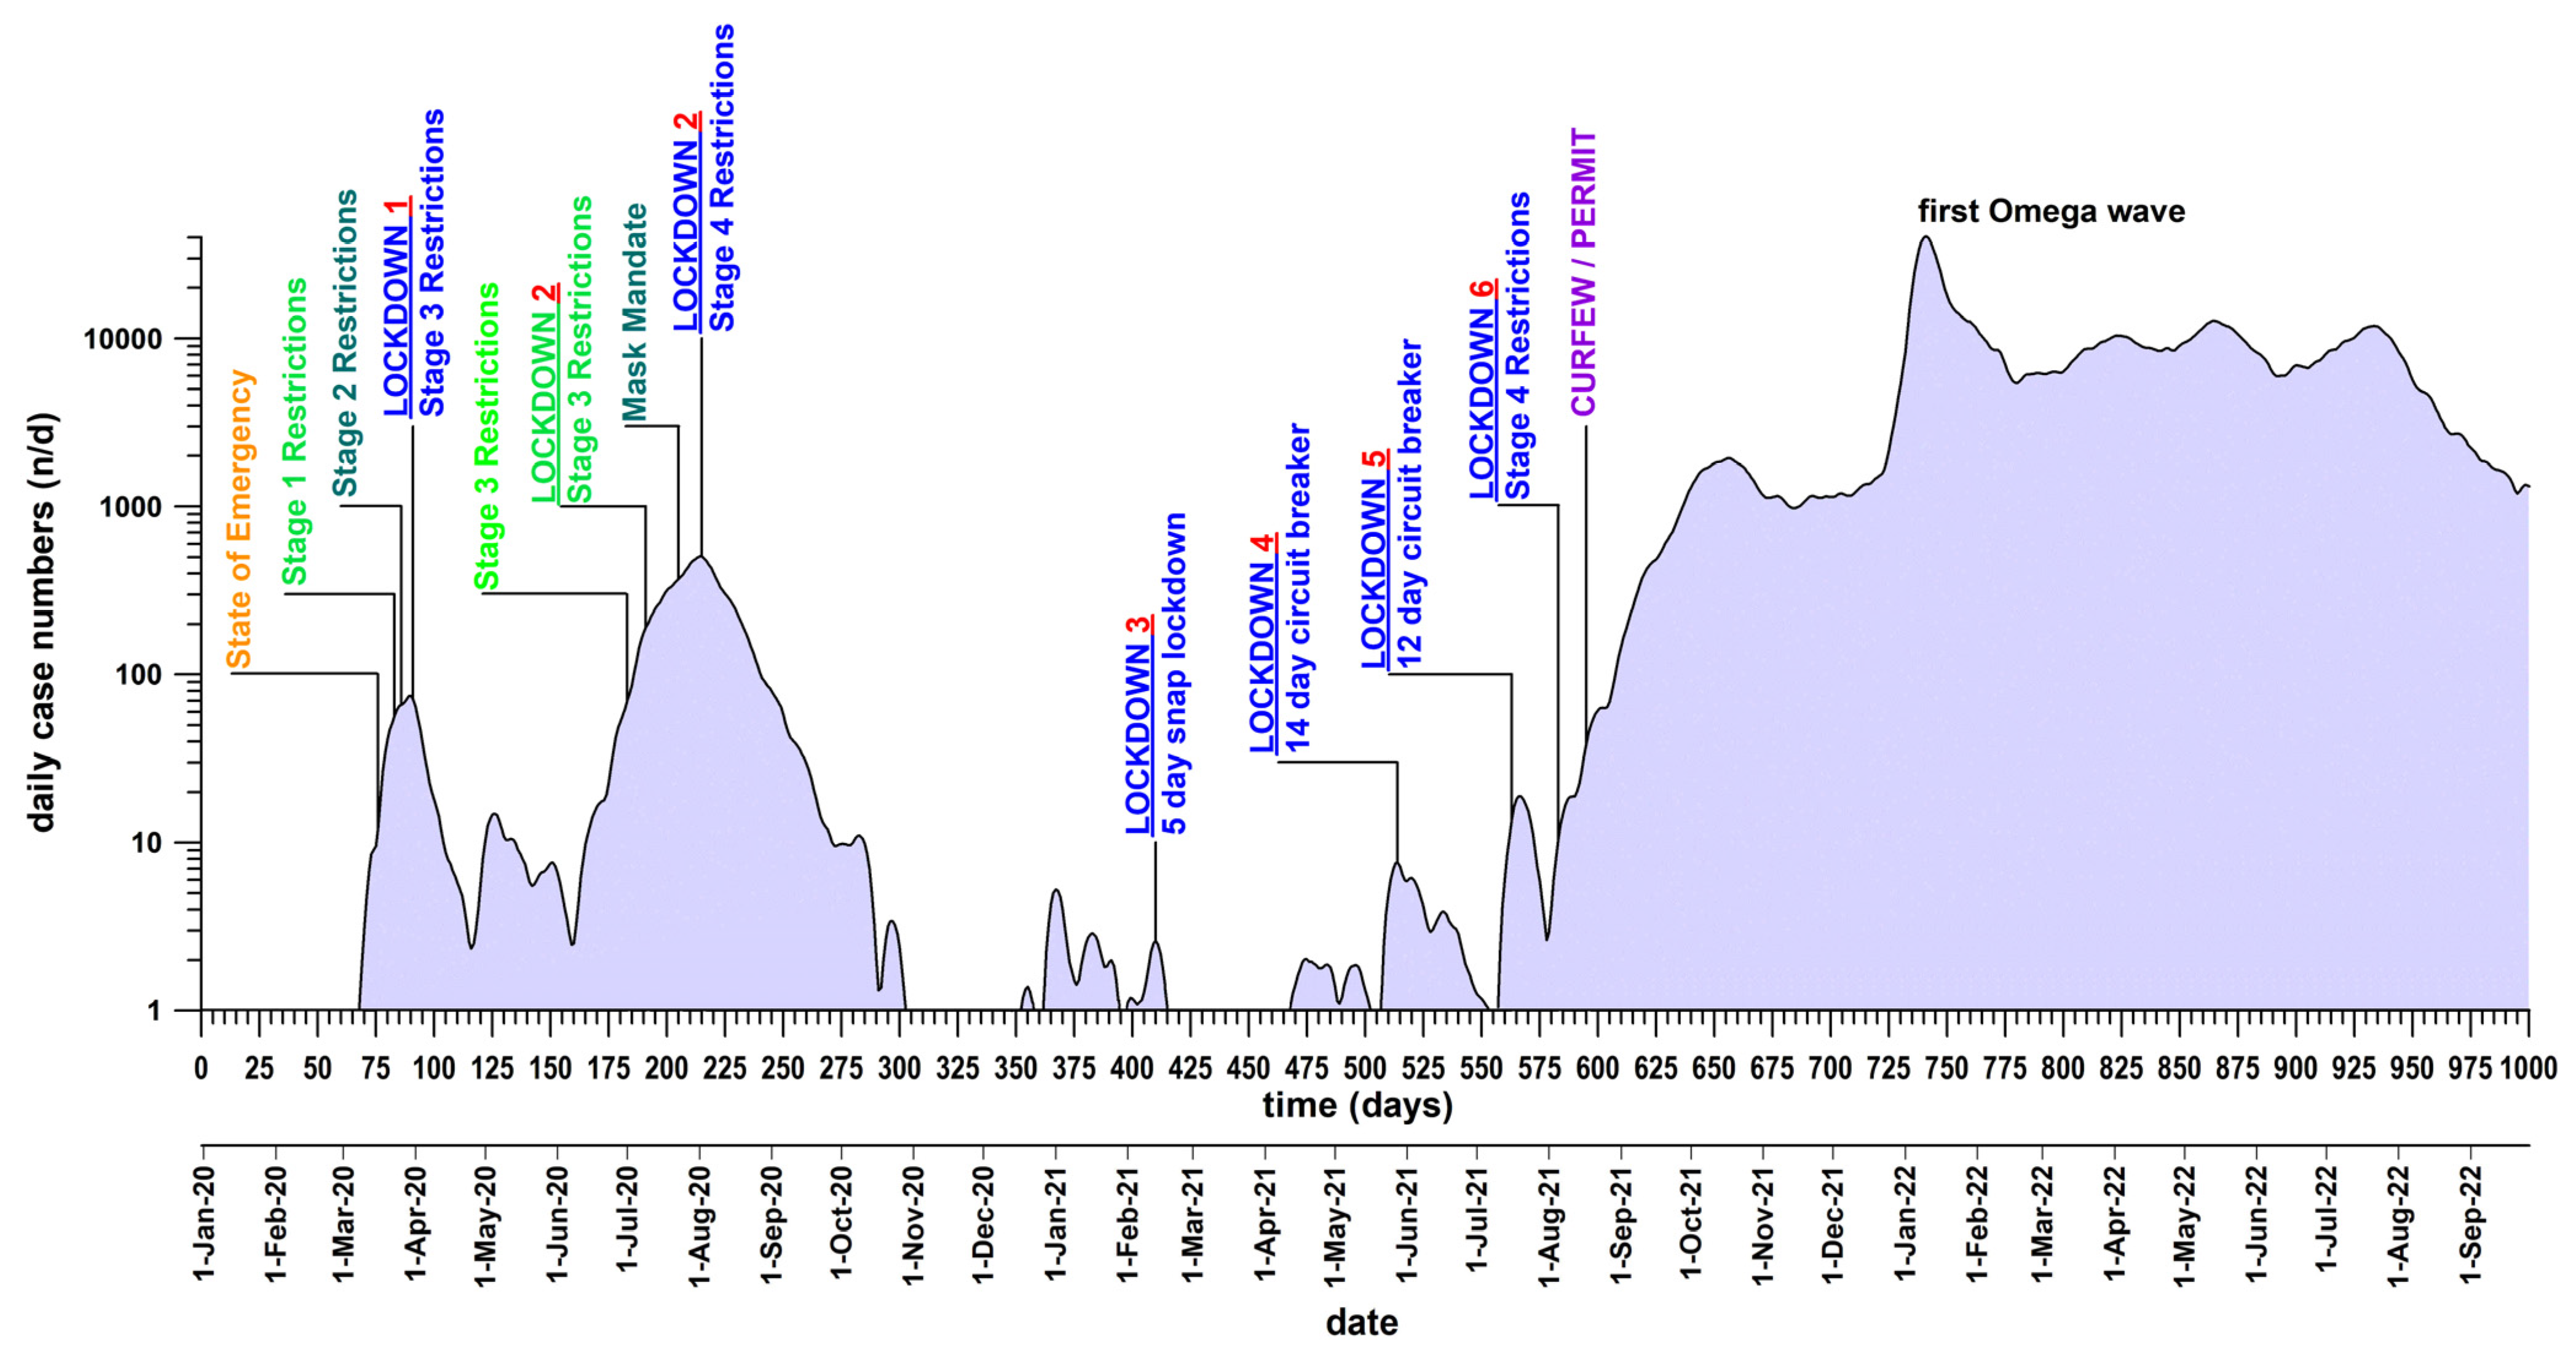
3.1. Lockdown 1
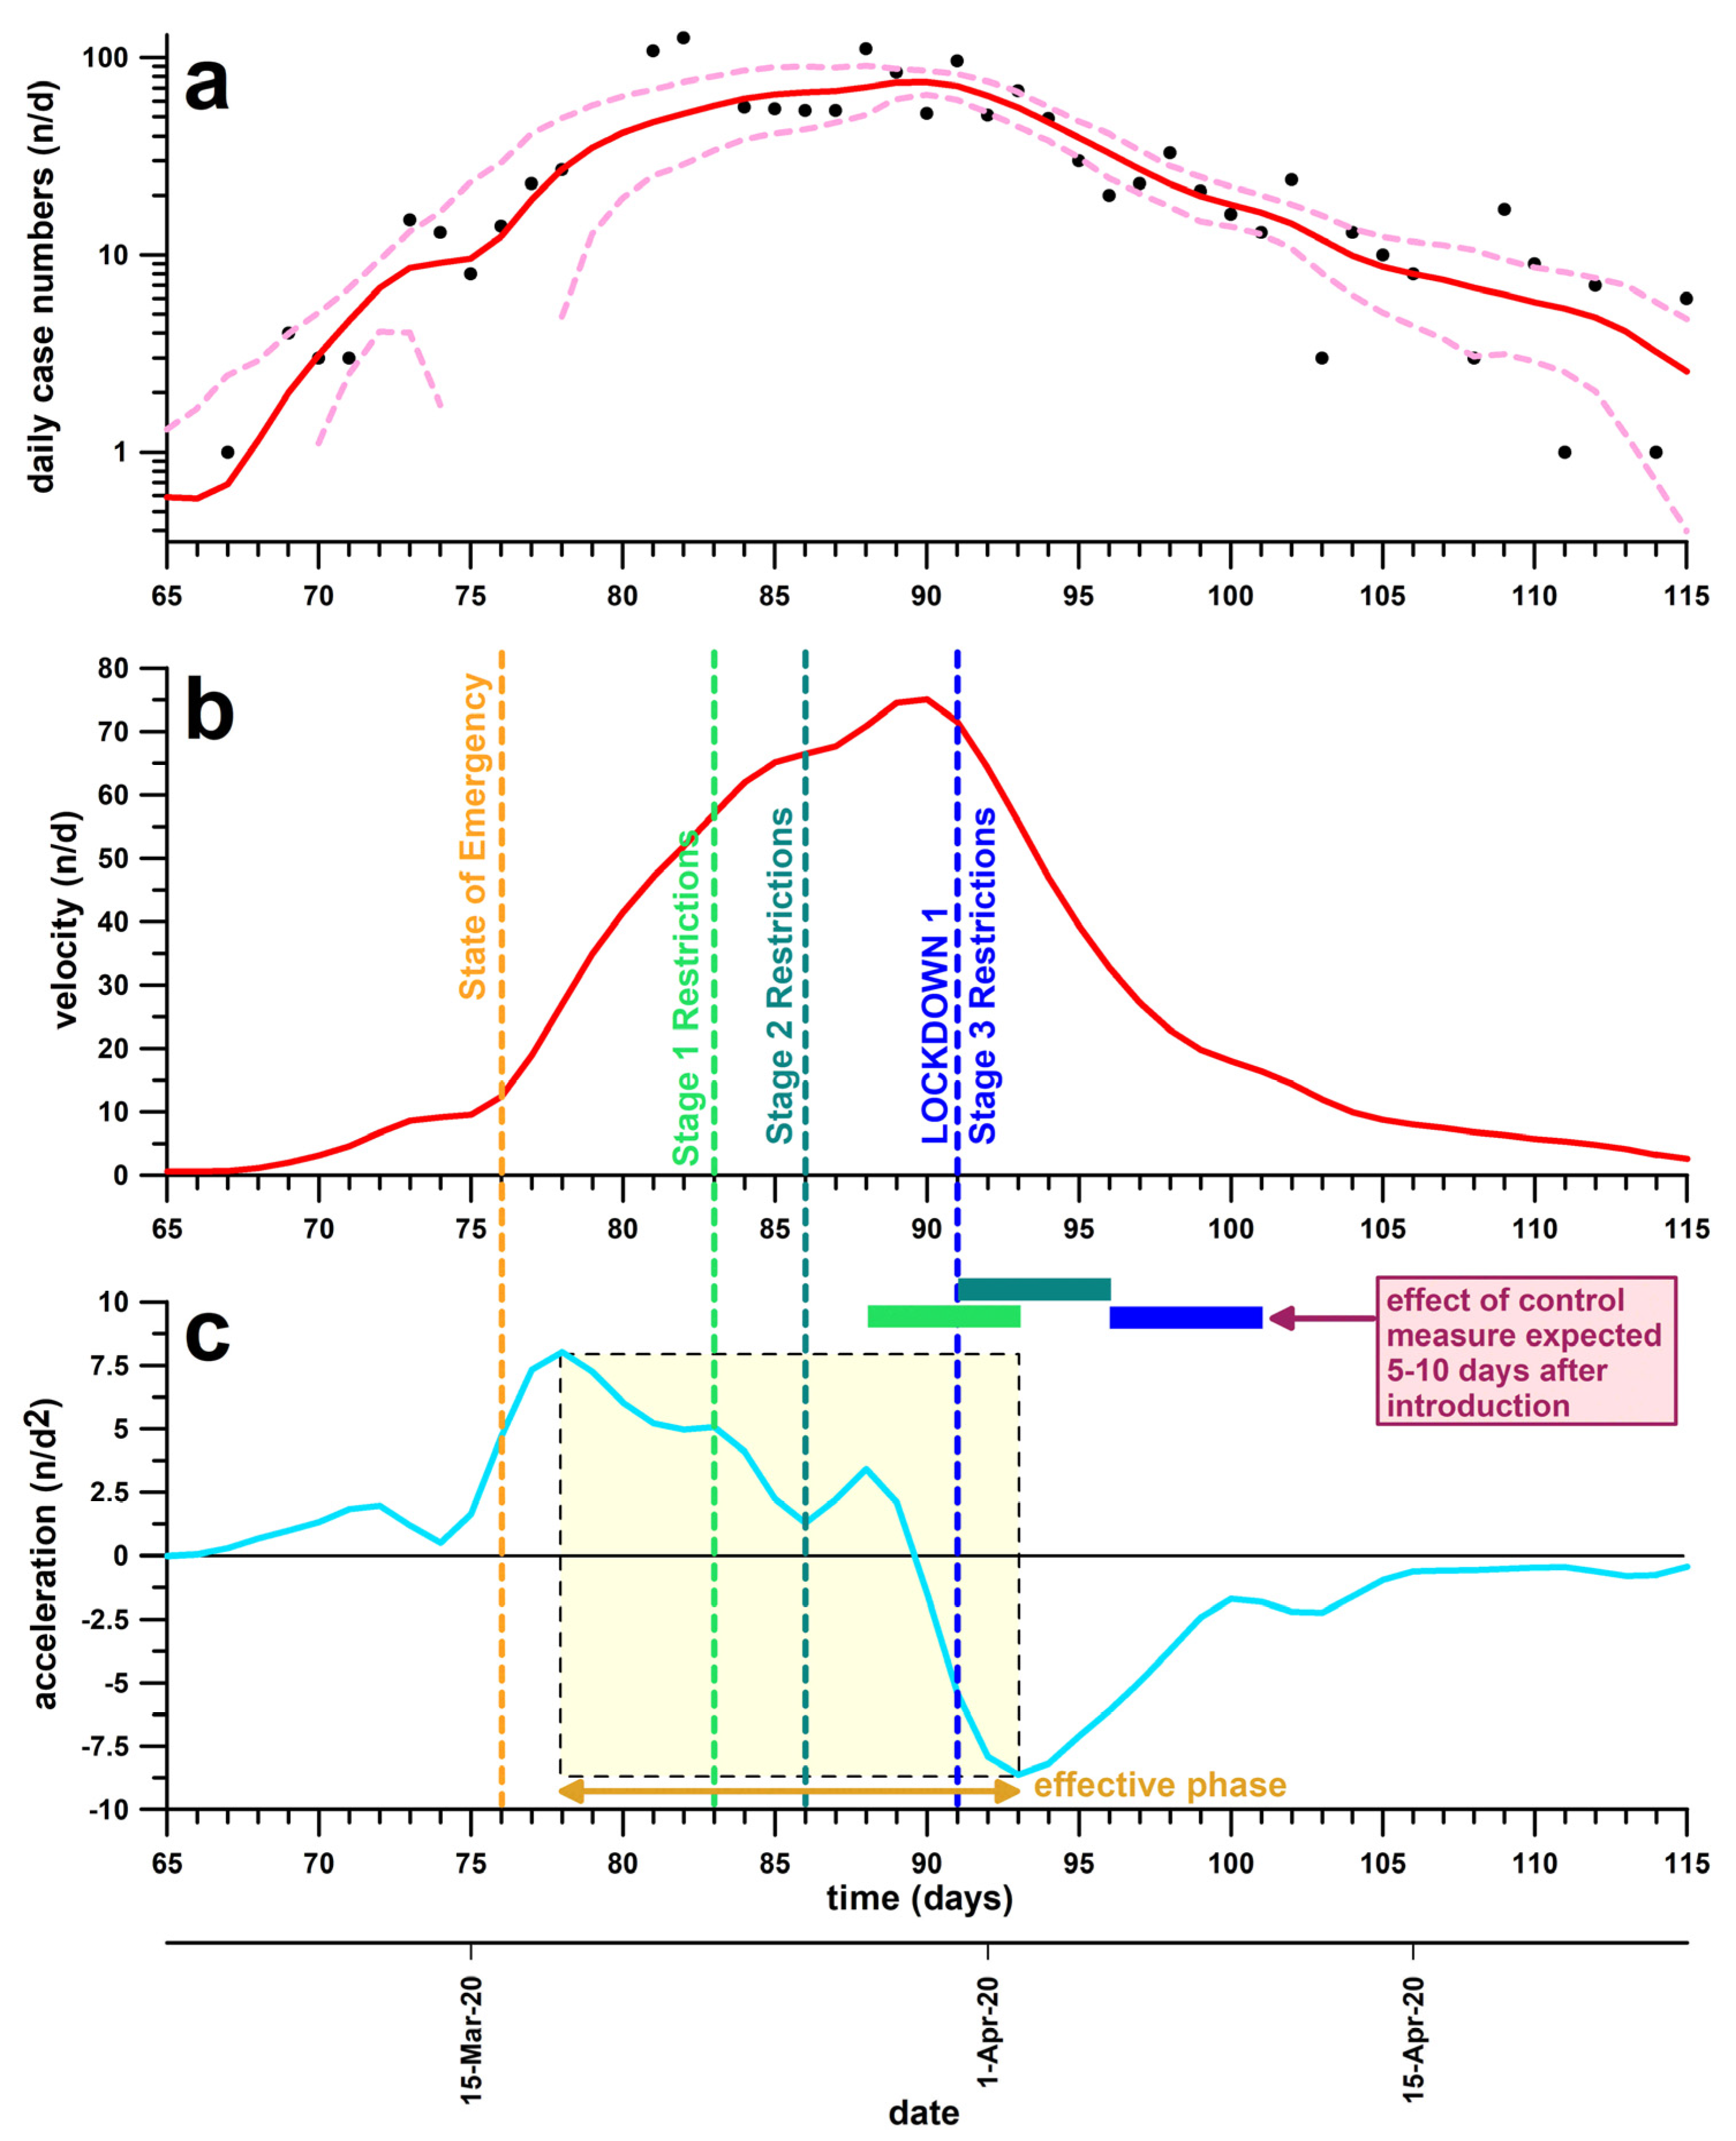
3.2. Lockdown 2
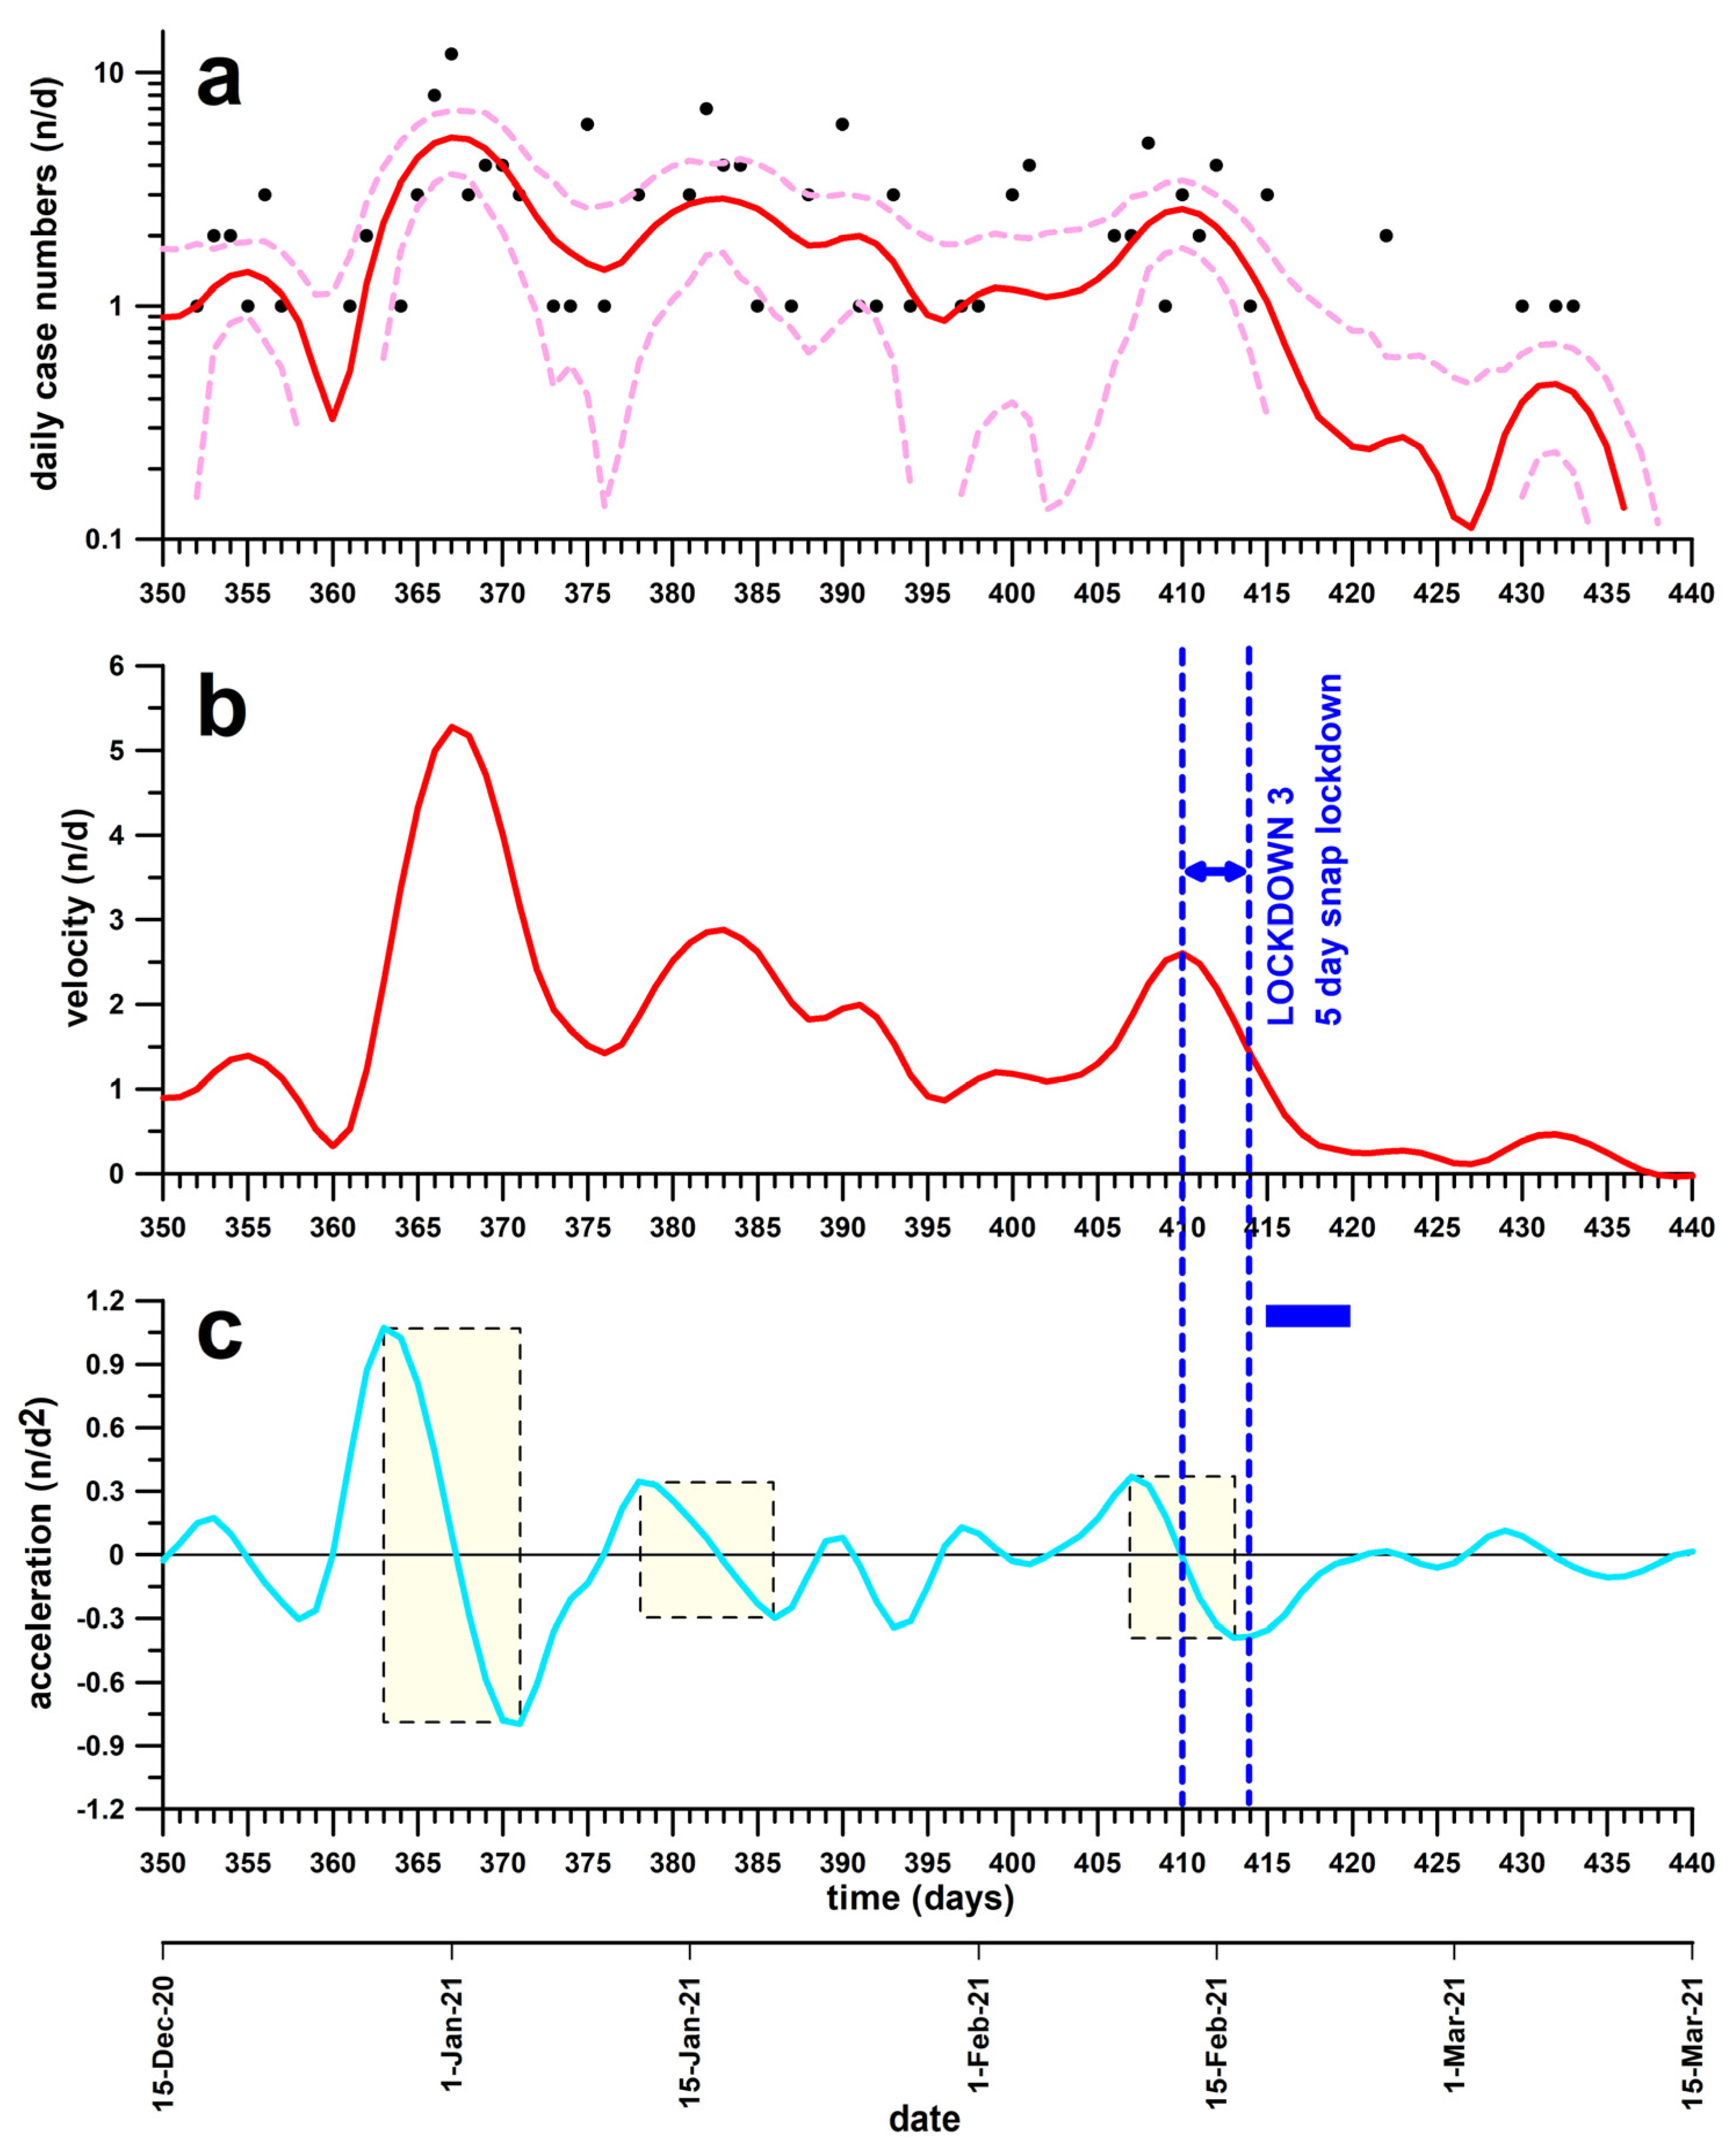
3.3. Lockdown 3
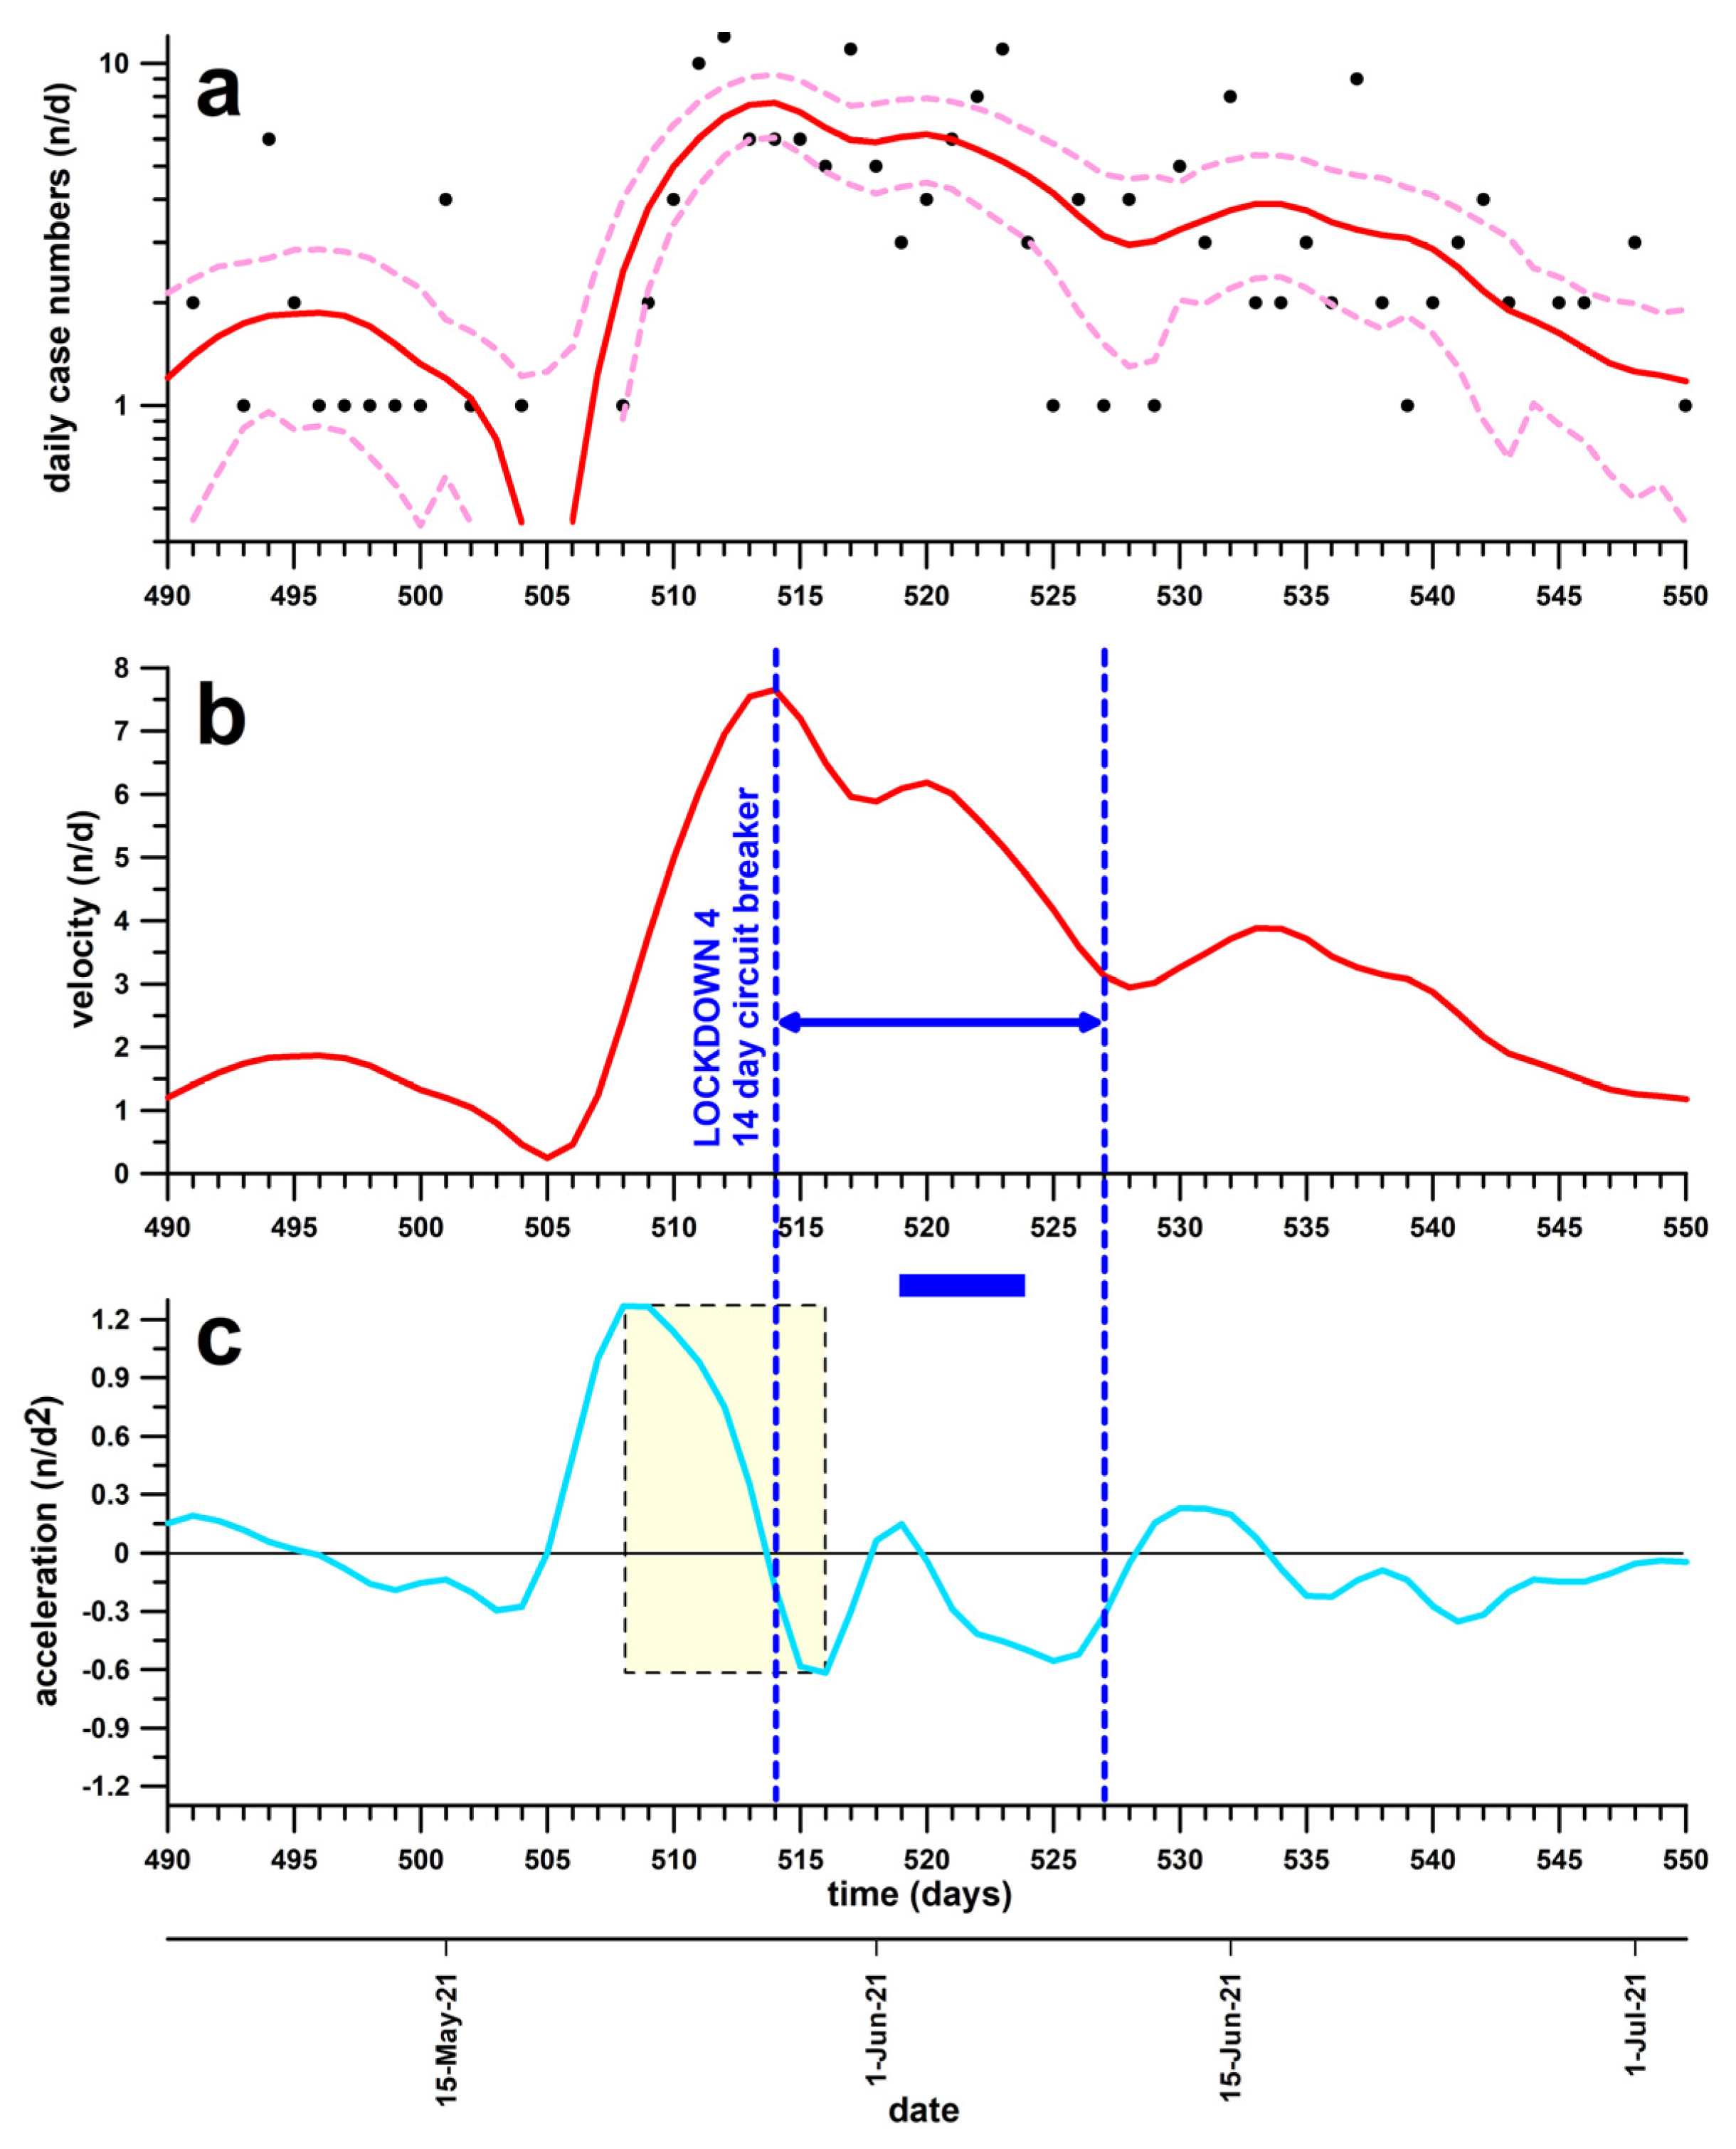
3.4. Lockdown 4
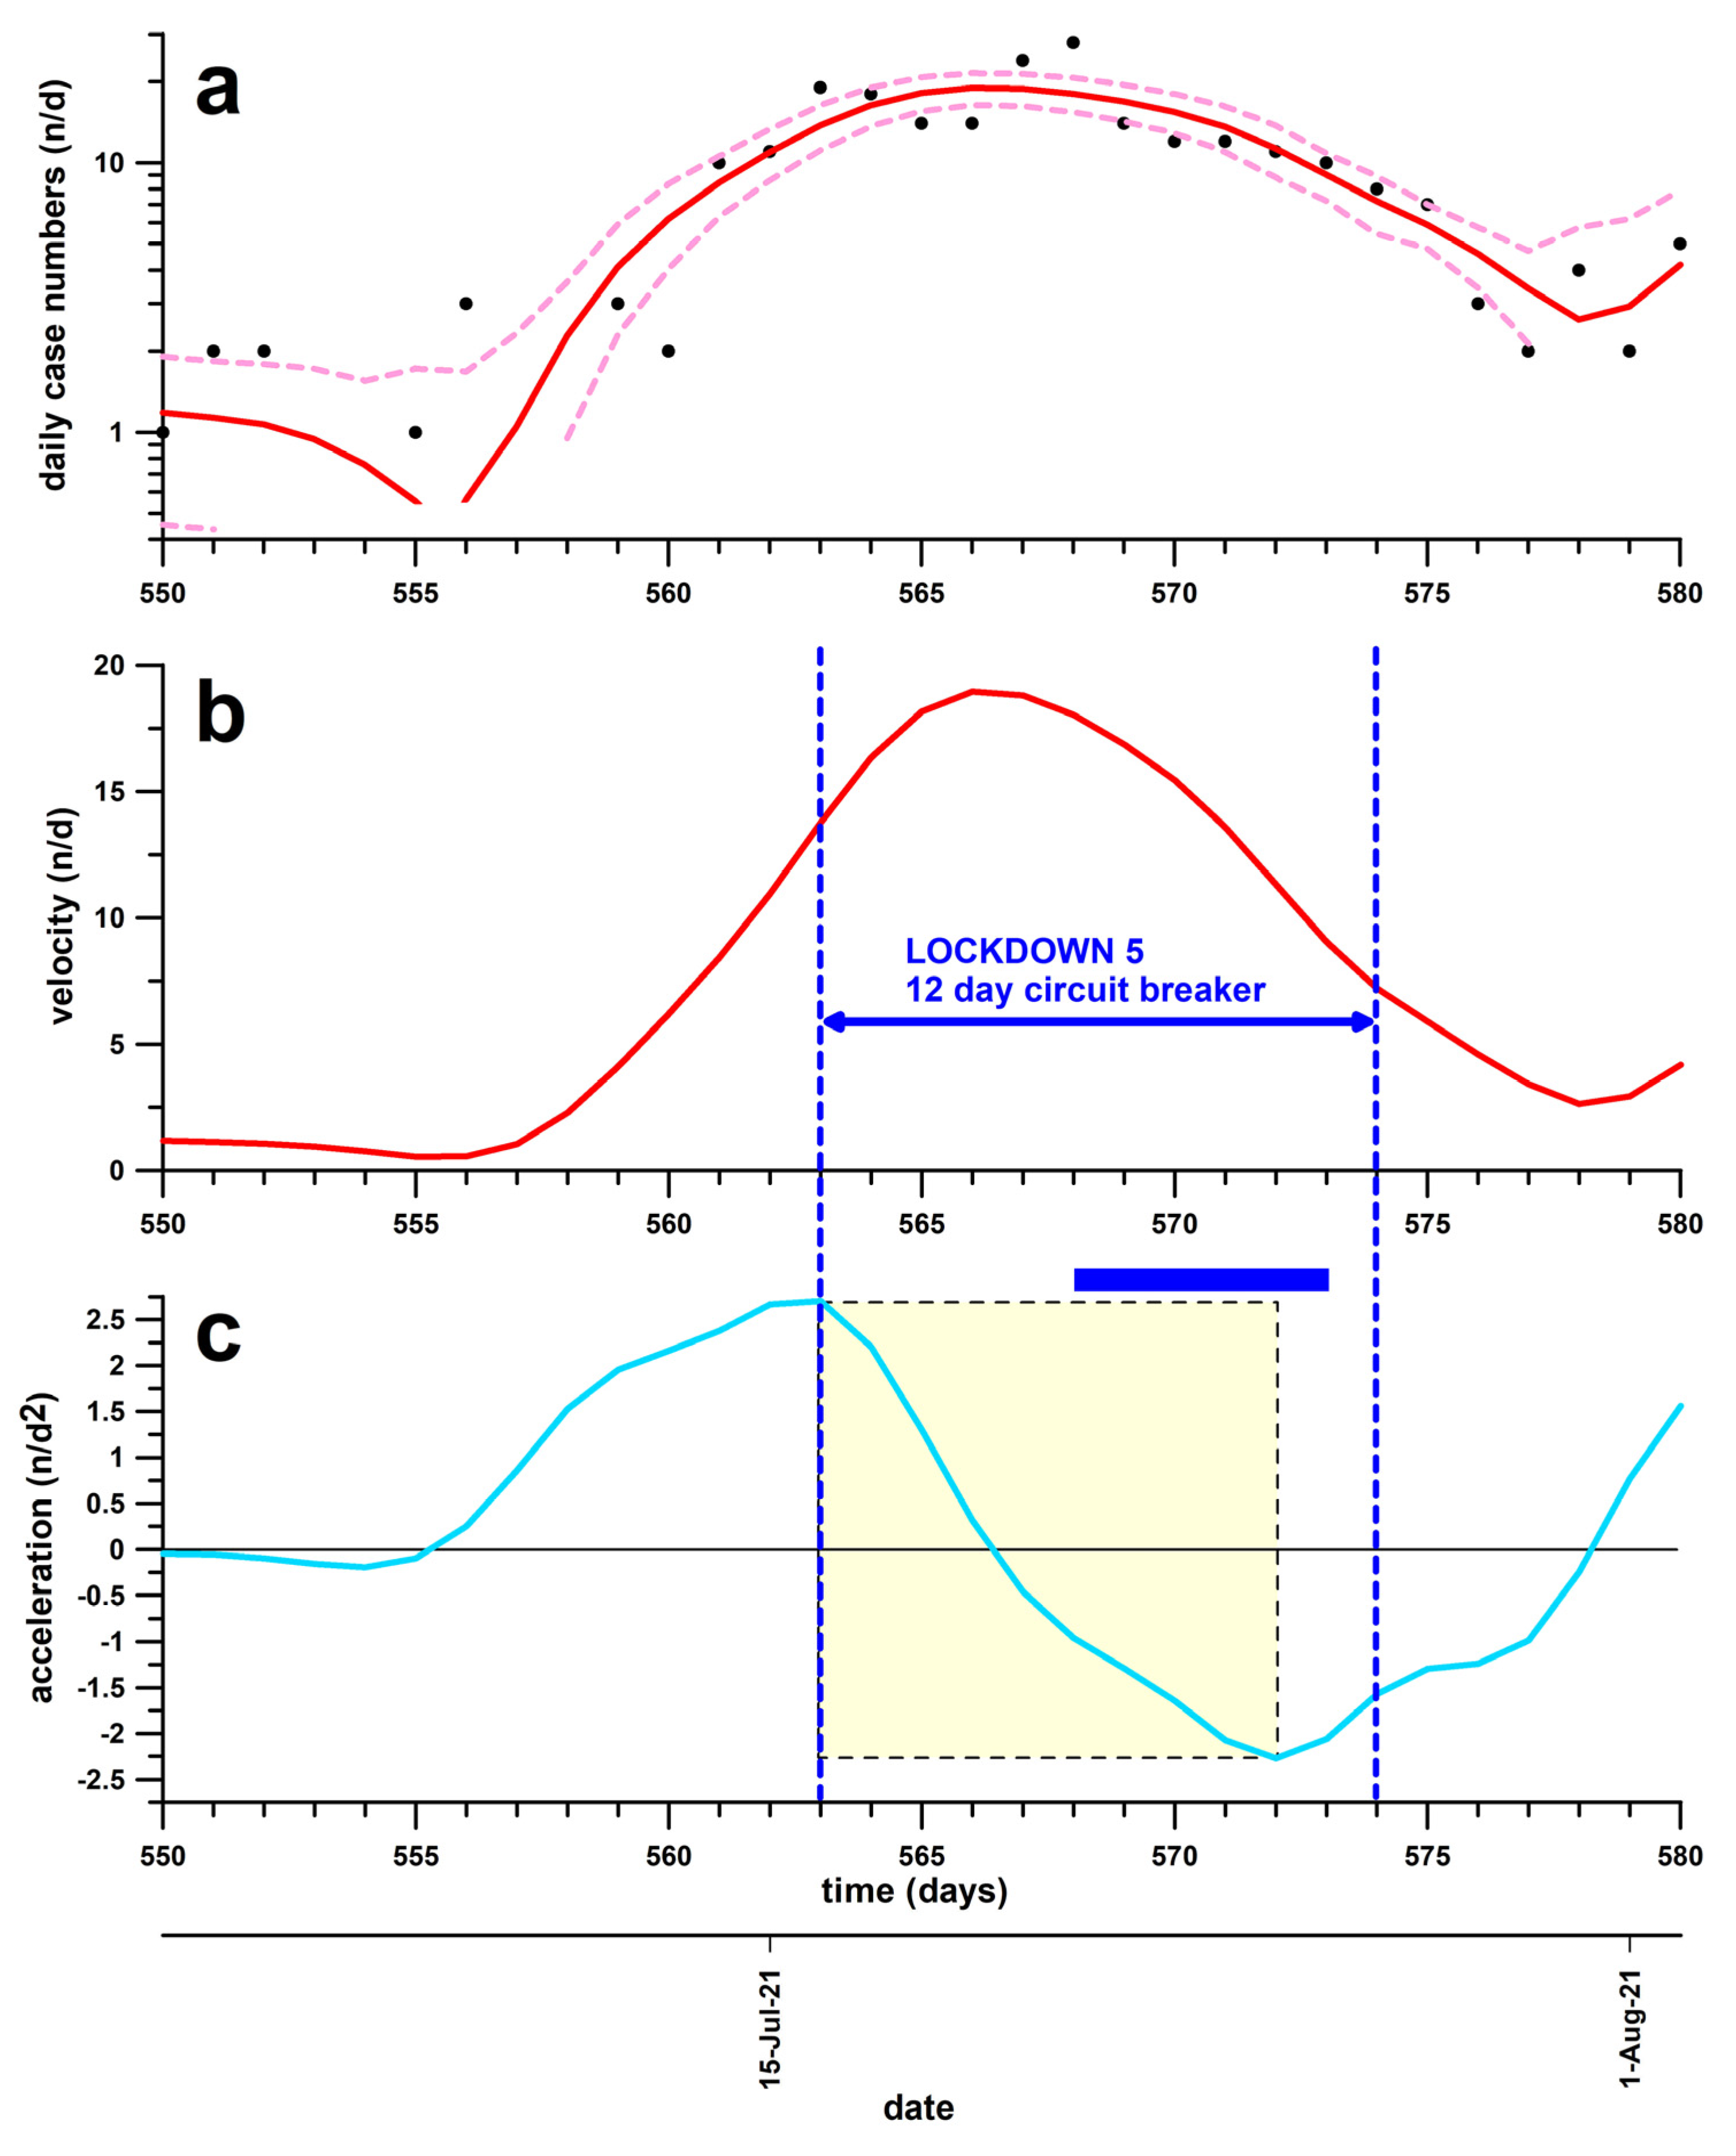
3.5. Lockdown 5
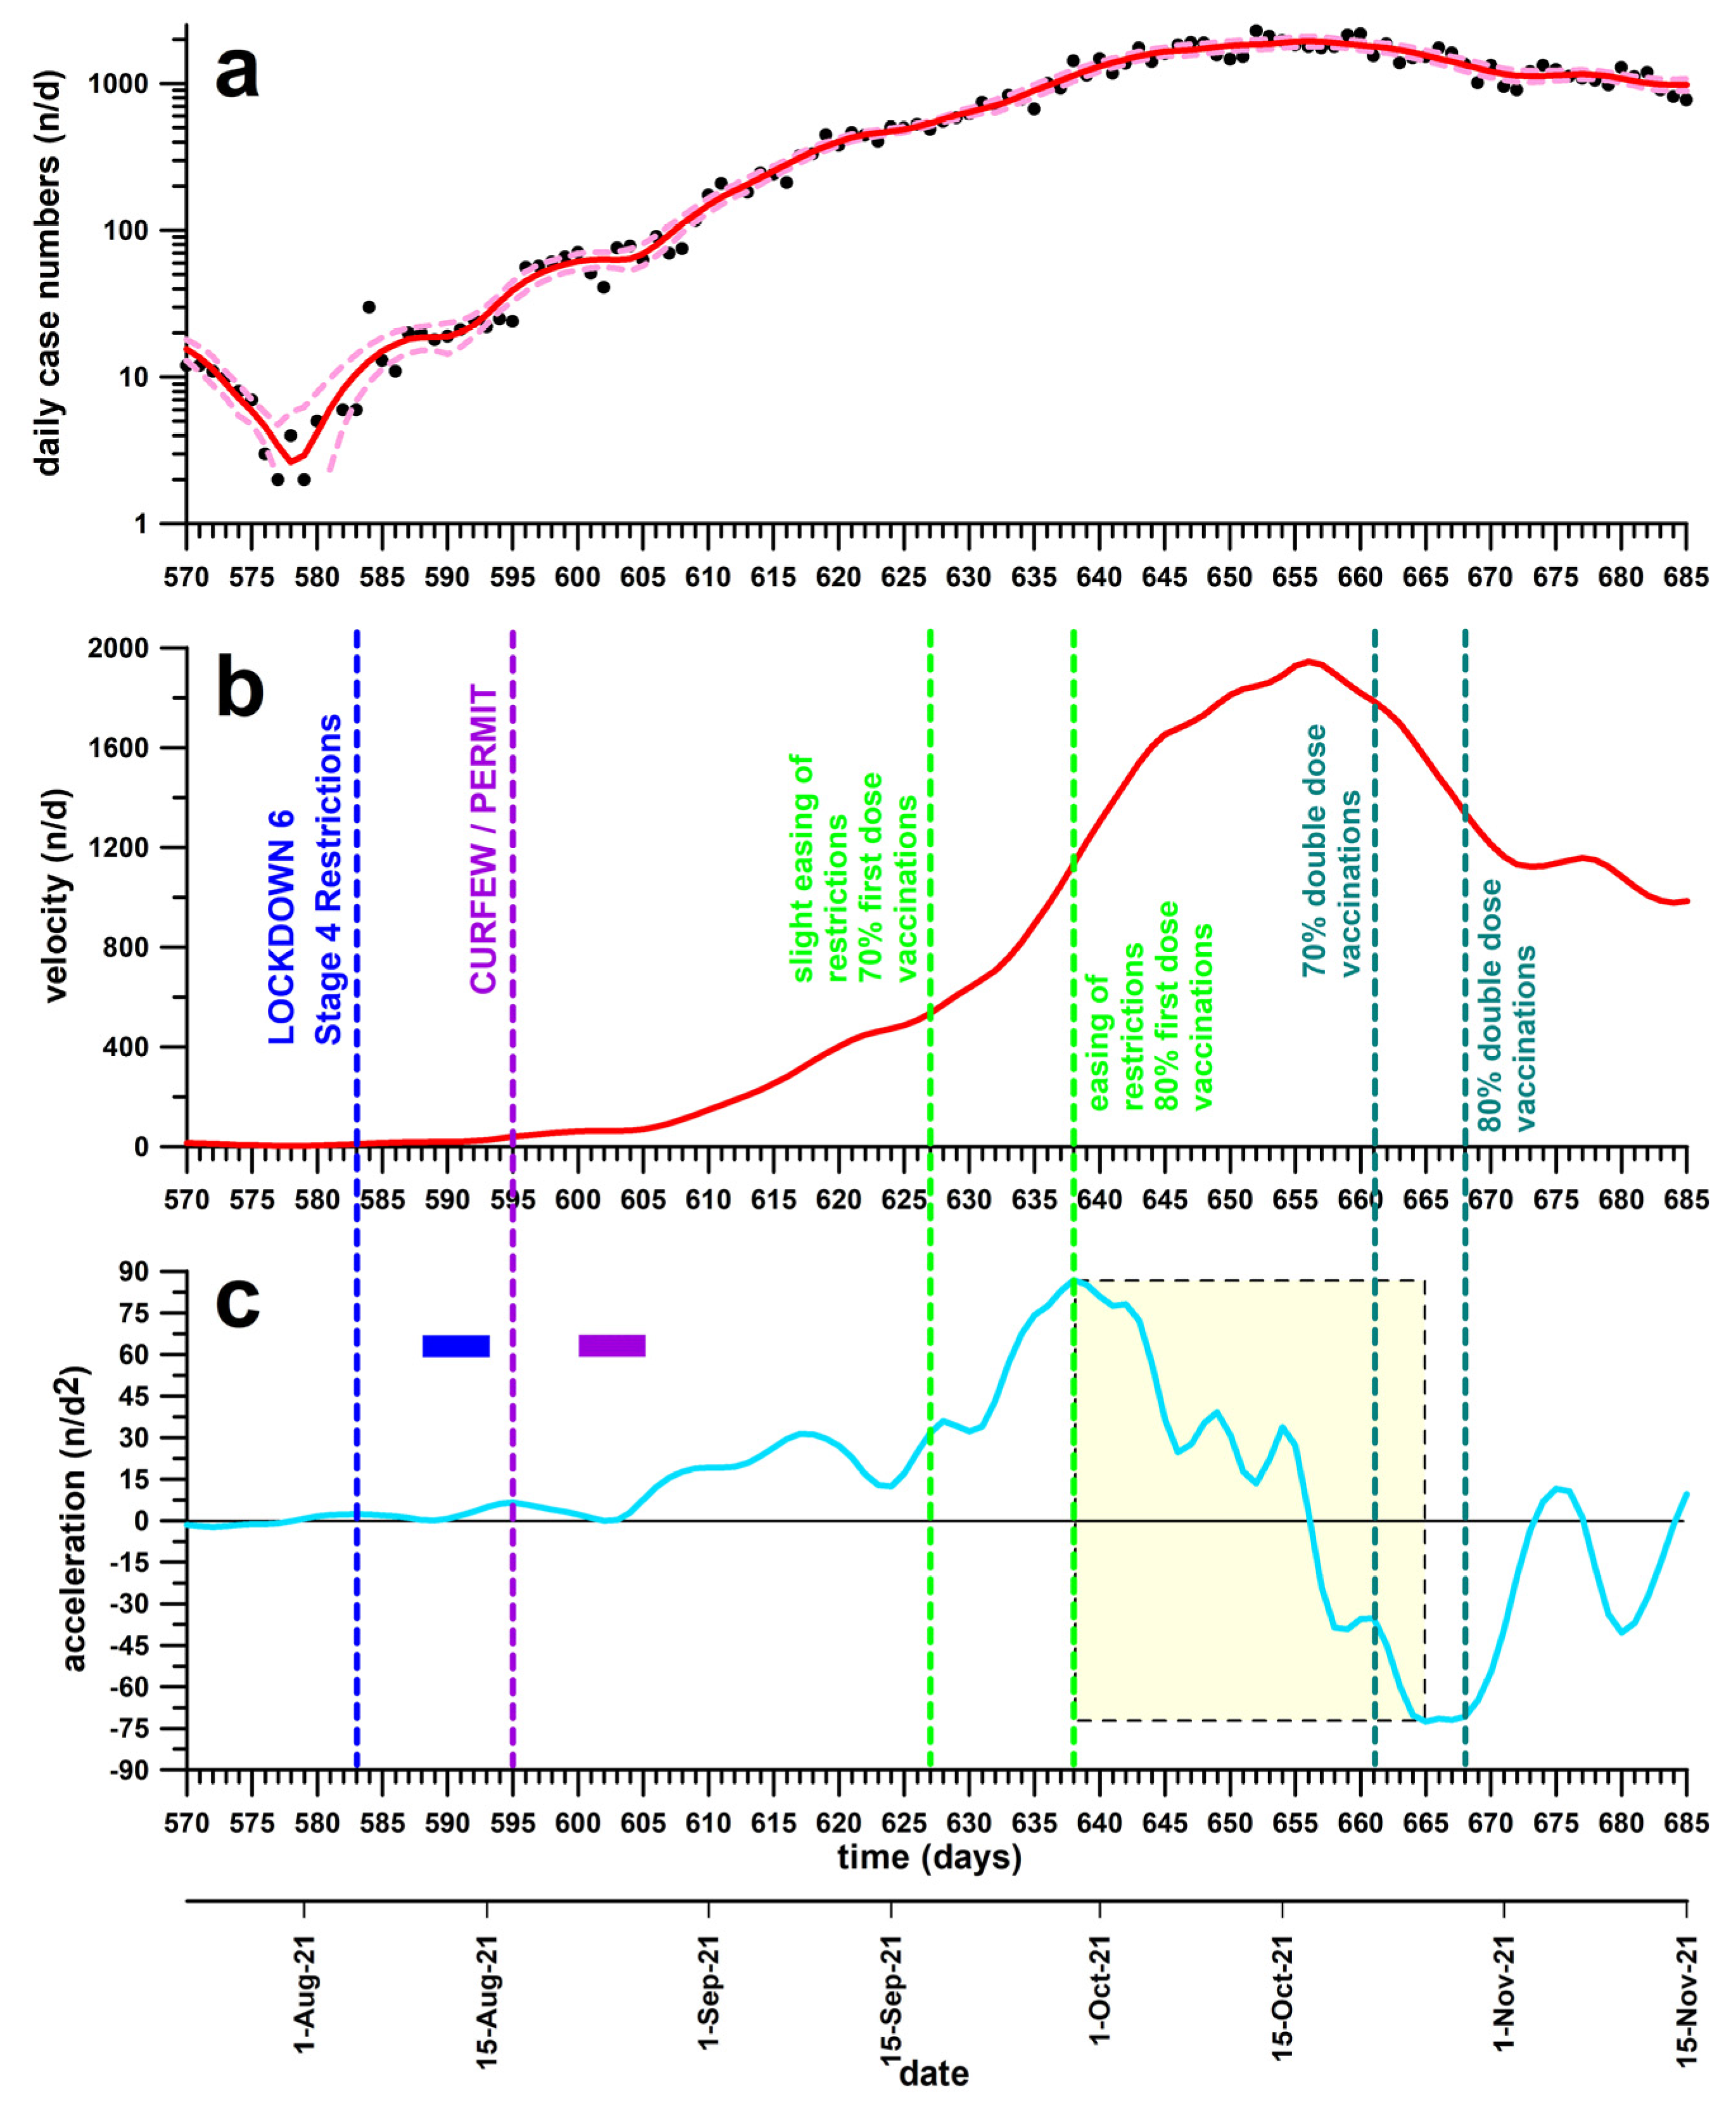
3.6. Lockdown 6
4. Discussion
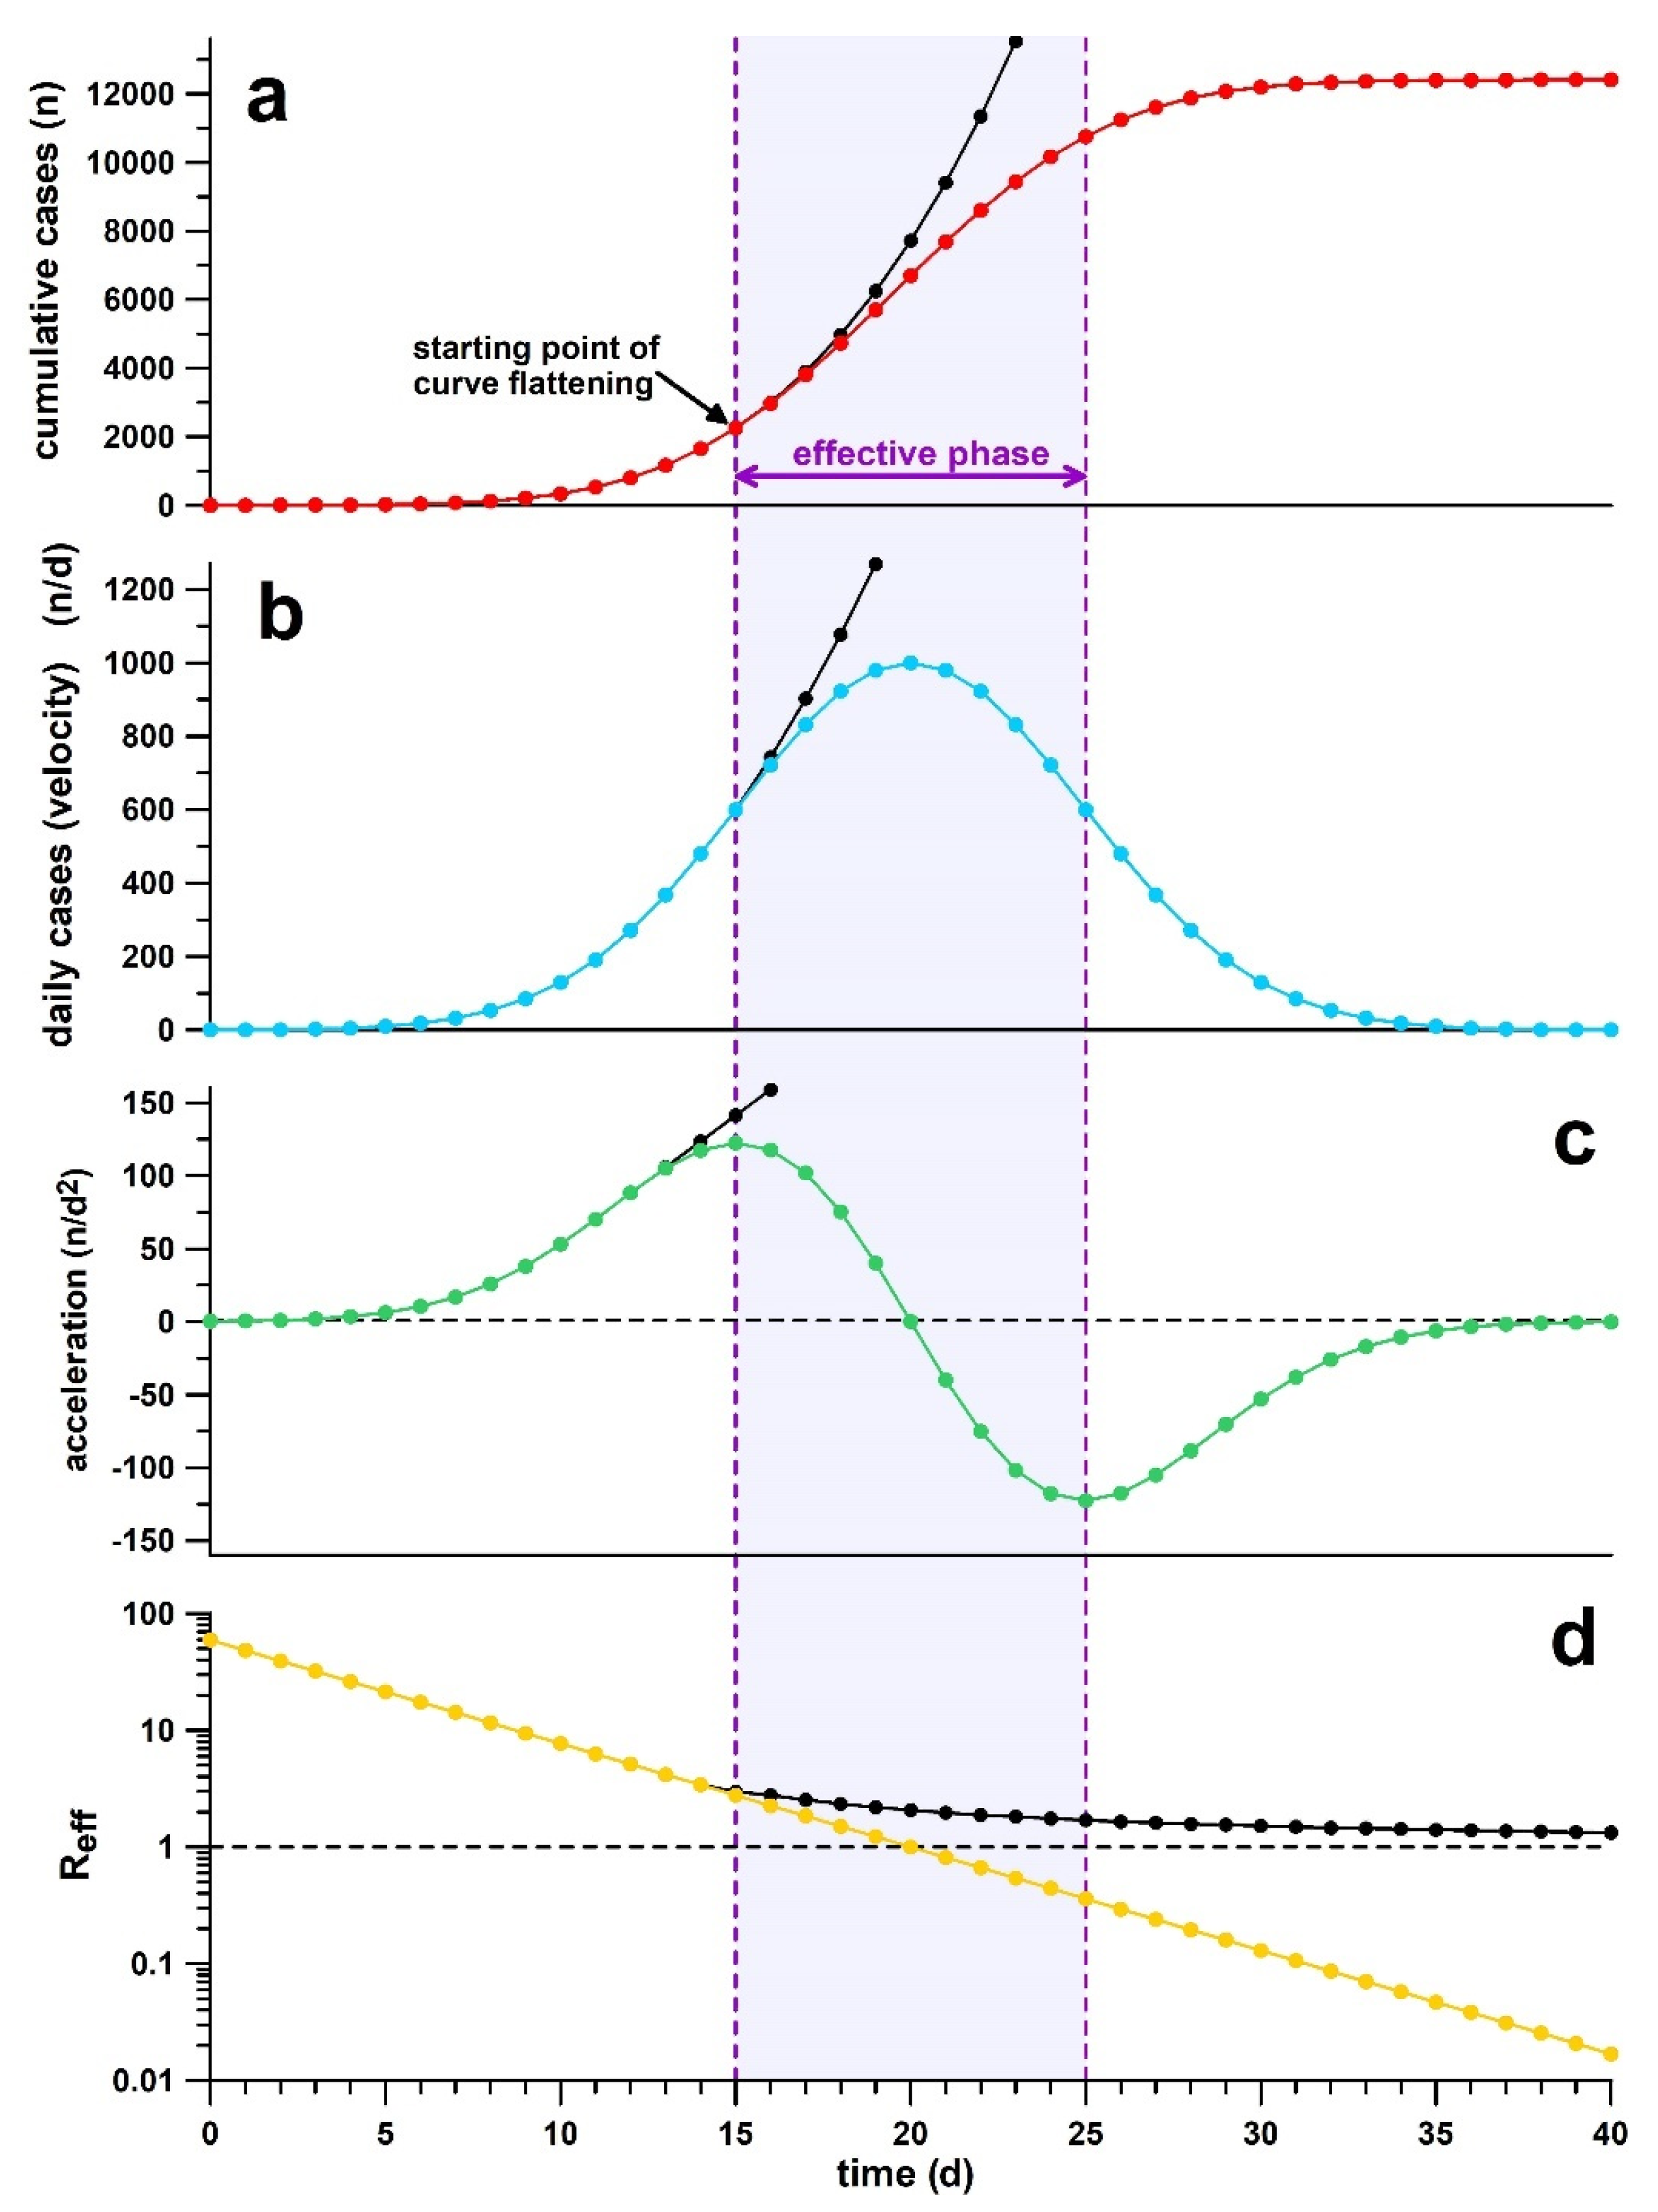
- If the effective phase starts before or on the day the control measure is introduced, there is no causal connection between the control measure and the initiation of the effective phase.
- If the effective phase starts within one average SI after the day the control measure is introduced, there is an unlikely causal connection as the relationship between epidemiological indicators of infection cannot be an immediate one due to the serial interval (SI).
- If the effective phase starts between the end of SI and the following 5 days, there is very likely a connection.
- If the effective phase starts after the end of one SI + 5 days, there is an unclear connection, depending on the circumstances, which could be interpreted as a severe delay of the intervention’s effect, or even as an unsuccessful effect not entirely connected to the intervention, considering that relaxed measures (comparable to the ones introduced in Sweden) also initiated the effective phase.
- (1)
- First, we have the advantage of being able to rely on data rather than belief. The acceleration data provide stronger evidence of the causal relationship between measures and data changes than the Reff.
- (2)
- Second, even if the onset of the effect occurs at the expected time, there is always some probability that the apparent association is not real (and, rather, an illusion) if the latent factor mentioned above, explaining the flattening of the curve without control measures, outweighs all of the other control measures (i.e., self-imposed compliance rather than government-imposed compliance).
- (1)
- They were introduced too late, with effects expected towards the end, or even after the end, of the effective phase.
- (2)
- Alternatively, if introduced before the start of the effective phase, the compliance was poor. Murphy et al. [31] investigated the compliance of Australian citizens during the first lockdown, and they concluded that it was as low as 50% due to citizens socialising in-person with friends or relatives they did not live with and also leaving the house without a good reason.
- (1)
- The causal relationship between the control measure and the start of effectiveness is construed by circumstantial evidence. This evidence fails if the latent factor mentioned above could have prepared the flattening of the curve over a longer period of time, so that a timely and quickly initiated control measure cannot do much to help.
- (2)
- The evaluation of a control measure with regard to its effectiveness, based on the method proposed in this study, is only a retrospective, and, therefore, it cannot be used for forecasting. It is thus not surprising that the timing of a control measure can fail in the sense that it is introduced too late and therefore proves ineffective. The reason that the method is a retrospective method is explained by the window width of the 13 data applied to the daily case data (velocity) filtering with a running quadratic filter. The optimal window width of 13 data was determined from a convergence test [11].
5. Conclusions
Author Contributions
Funding
Institutional Review Board Statement
Informed Consent Statement
Data Availability Statement
Conflicts of Interest
References
- Fuss, F.K.; Weizman, Y.; Tan, A.M. The Difference in Wave Dynamics between SARS-CoV-2 Pre-Omicron and Omicron Variant Waves. COVID 2023, 3, 2. [Google Scholar] [CrossRef]
- Shergold, P.; Broadbent, J.; Marshall, I.; Varghese, P. Fault Lines—An Independent Review into Australia’s Response to COVID-19, 20 October 2022. Available online: https://www.paulramsayfoundation.org.au/news-resources/fault-lines-an-independent-review-into-australias-response-to-covid-19#:~:text=News-,Fault%20lines%3A%20An%20independent%20review%20into%20Australia’s%20response%20to%20COVID,schools%20should%20have%20remained%20open (accessed on 1 July 2023).
- Achenza, M.; McLeod, C. Qld and Vic Premiers Defend Decisions after Damning Review of Australia’s COVID-19 Response. 20 October 2022. Available online: https://www.news.com.au/finance/economy/damning-review-into-covid-response-reveals-how-government-failed-communities/news-story/961ba6276f9f33eb115209f573d97875 (accessed on 26 June 2023).
- British Medical Association. The Public Health Response by UK Governments to COVID-19 (BMA COVID Review 4), 7 July 2023. Available online: https://www.bma.org.uk/advice-and-support/covid-19/what-the-bma-is-doing/the-public-health-response-by-uk-governments-to-covid-19 (accessed on 26 June 2023).
- Singaporean Government. White Paper on Singapore’s Response to COVID-19: Lessons for the Next Pandemic. 8 March 2023. Available online: https://www.gov.sg/article/covid-19-white-paper (accessed on 26 June 2023).
- MDR AKTUELL. Kassenärzte-Chef Fordert Aufarbeitung der Corona-Pandemie. 7 April 2023. Available online: https://www.mdr.de/nachrichten/deutschland/gesellschaft/corona-gassen-kassenaerzte-massnahmen-aufarbeitung-102.html (accessed on 26 June 2023).
- Tschiderer, M. Regierung Will bis Jahresende Aufarbeitung der Corona-Pandemie Vorlegen. The Standard, 4. May 2023. Available online: https://www.derstandard.de/story/2000146110696/regierung-will-bis-jahresende-aufarbeitung-der-corona-pandemie-vorlegen (accessed on 26 June 2023).
- Taschwer, K. Warum Die Aufarbeitung der COVID-19-Maßnahmen so Komplex Ist. Der Standard, 16 February 2023. Available online: https://www.derstandard.de/story/2000143585049/welche-massnahmen-gut-gegen-die-pandemiegewirkt-haben (accessed on 2 July 2023).
- Trauer, J.M.; Lydeamore, M.J.; Dalton, G.W.; Pilcher, D.; Meehan, M.T.; McBryde, E.S.; Cheng, A.C.; Sutton, B.; Ragonnet, R. Understanding how Victoria, Australia gained control of its second COVID-19 wave. Nat. Commun. 2021, 12, 6266. [Google Scholar] [CrossRef] [PubMed]
- Haug, N.; Geyrhofer, L.; Londei, A.; Loreto, V.; Pinior, B.; Thurner, S.; Klimek, P. Ranking the effectiveness of worldwide COVID-19 government interventions. Nat. Hum. Behav. 2020, 4, 1303–1312. [Google Scholar] [CrossRef] [PubMed]
- Fuss, F.K.; Weizman, Y.; Tan, A.M. COVID-19 pandemic: How effective are preventive control measures and is a complete lockdown justified? A comparison of countries and states. COVID 2022, 2022, 3. [Google Scholar] [CrossRef]
- Fuss, F.K.; Weizman, Y.; Tan, A.M. Which Preventive Control Measure Initiated the ‘Flattening of the Curve’: A Comparison of Austria and Victoria during the 2nd Wave of the COVID-19 Pandemic. Wien. Klin. Wochenschr. (Cent. Eur. J. Med.) 2022, 134, 831–841. [Google Scholar] [CrossRef] [PubMed]
- Paterlini, M. Q&A: Sweden’s coronavirus strategist. Nature 2020, 580, 574. [Google Scholar] [PubMed]
- Macreadie, I. Reflections from Melbourne, the world’s most locked-down city, through the COVID-19 pandemic and beyond. Microbiol. Aust. 2022, 43, 3–4. [Google Scholar] [CrossRef]
- CSSEGISandData, Coronavirus COVID-19 Global Cases, Center for Systems Science and Engineering (CSSE), Johns Hopkins University, Baltimore, MD, USA. Available online: https://github.com/CSSEGISandData/COVID-19/blob/master/csse_covid_19_data/csse_covid_19_time_series/time_series_covid19_confirmed_global.csv (accessed on 22 February 2023).
- Ganyani, T.; Kremer, C.; Chen, D.; Torneri, A.; Faes, C.; Wallinga, J.; Hens, N. Estimating the generation interval for coronavirus disease (COVID-19) based on symptom onset data. Eurosurveillance 2020, 25, 2000257. [Google Scholar] [CrossRef] [PubMed]
- Du, Z.; Xu, X.; Wu, Y.; Wang, L.; Cowling, B.J.; Meyers, L.A. Early Release—Serial Interval of COVID-19 among publicly reported confirmed cases. Emerg. Infect. Dis. 2020, 26, 1341–1343. [Google Scholar] [CrossRef] [PubMed]
- Böhmer, M.; Buchholz, U.; Corman, V.M.; Hoch, M.; Katz, K.; Marosevic, D.V.; Böhm, S.; Woudenberg, T.; Ackermann, N.; Konrad, R.; et al. Investigation of a COVID-19 outbreak in Germany resulting from a single travel-associated primary case: A case series. Lancet Infect. Dis. 2020, 20, 920–928. [Google Scholar] [CrossRef] [PubMed]
- Richter, L.; Schmid, D.; Chakeri, A.; Maritschnik, S.; Pfeiffer, S.; Stadlober, E. Schätzung des Seriellen Intervalles von COVID19, Österreich. AGES (Österreichische Agentur für Gesundheit und Ernährungssicherheit), Vienna, Austria. 2020. Available online: https://www.ages.at/forschung/wissen-aktuell/detail/schaetzung-des-seriellen-intervalles-von-covid19-oesterreich (accessed on 18 May 2023).
- Nishiura, H.; Linton, N.M.; Akhmetzhanov, A.R. Serial Interval of Novel Coronavirus (2019-nCoV) Infections. Int. J. Infect. Dis. 2020, 93, 284–286. [Google Scholar] [CrossRef] [PubMed]
- Li, Q.; Guan, X.; Wu, P.; Wang, X.; Zhou, L.; Tong, Y.; Ren, R.; Leung, K.S.M.; Lau, E.H.Y.; Wong, J.Y.; et al. Early transmission dynamics in Wuhan, China, of novel coronavirus-infected pneumonia. N. Engl. J. Med. 2020, 382, 1199–1207. [Google Scholar] [CrossRef] [PubMed]
- Victoria State Government, Department of Health & Human Services, Coronavirus Update for Victoria—31 March 2020. Available online: https://www.dhhs.vic.gov.au/coronavirus-update-victoria-31-march-2020 (accessed on 31 March 2020).
- Victoria in Stage 3 Coronavirus Shutdown Restrictions as Cases Climb to 821. ABC News, 29 March 2020. Available online: https://www.abc.net.au/news/2020-03-30/victoria-stage-3-coronavirus-restrictions-as-cases-rise/12101632 (accessed on 31 March 2020).
- Victorian Government, Vaccine History Timeline. Available online: https://www.health.vic.gov.au/immunisation/vaccine-history-timeline (accessed on 26 June 2023).
- Premier of Victoria, New Freedoms When 70 Per Cent First Dose Target Reached. 16 September 2021. Available online: https://www.premier.vic.gov.au/new-freedoms-when-70-cent-first-dose-target-reached (accessed on 26 June 2023).
- Premier of Victoria, Victorians’ Hard Work Means Hitting Target Ahead of Time. 17 October 2021. Available online: https://www.premier.vic.gov.au/victorians-hard-work-means-hitting-target-ahead-time (accessed on 26 June 2023).
- Amer, F.; Hammoud, S.; Farran, B.; Boncz, I.; Endrei, D. Assessment of Countries’ Preparedness and Lockdown Effectiveness in Confronting COVID-19. Disaster. Med. Pub. Health Prep. 2020, 15, 15–22. [Google Scholar] [CrossRef] [PubMed]
- Scott, N.; Saul, A.; Spelman, T.; Stoove, M.; Pedrana, A.; Saeri, A.; Grundy, E.; Smith, L.; Toole, M.; McIntyre, C.R.; et al. The introduction of a mandatory mask policy was associated with significantly reduced COVID-19 cases in a major metropolitan city. PLoS ONE 2021, 16, e0253510. [Google Scholar] [CrossRef] [PubMed]
- ABC NEWS. Victoria’s Coronavirus Modelling Says Stage 4 Lockdown and Restrictions Should Stay in Place in Melbourne for Weeks. This Is the Report. 6 September 2020. 2020. Available online: https://www.abc.net.au/news/2020-09-06/victoria-coronavirus-covid-19-lockdown-restrictionsmodelling/12633906 (accessed on 14 January 2021).
- Rothman, K.J.; Greenland, S. Causation and causal inference in epidemiology. Am. J. Public Health. 2005, 95 (Suppl. S1), S144–S150. [Google Scholar] [CrossRef] [PubMed] [Green Version]
- Murphy, K.; Williamson, H.; Sargeant, E.; McCarthy, M. Why people comply with COVID-19 social distancing restrictions: Self-interest or duty? Austr. N. Z. J. Criminol. 2020, 53, 477–496. [Google Scholar] [CrossRef]
- Melbourne Public Housing Tower Residents Offered $5m Payout over COVID Lockdown. The Guardian, 9 May 2023. Available online: https://www.theguardian.com/australia-news/2023/may/09/melbourne-public-housing-tower-residents-win-5m-payout-over-covid-lockdown (accessed on 9 May 2023).

| Control Measure | Date | Timing | Effect |
|---|---|---|---|
| Stage 1 restrictions Stage 2 restrictions | 23 March 2020 26 March 2020 | Did not initiate the effective phase | Likely supporting the second half of the effective phase |
| Lockdown 1 | 31 March 2020 | Introduced too late; effect expected after effective phase; and did not flatten the curve | NONE |
| Stage 3 restrictions | 1 July 2020 | Did not initiate the effective phase; did not flatten the curve | Acceleration did not increase further but was constant on average |
| Lockdown 2, Stage 3 | 9 July 2020 | Did not initiate the effective phase or reduce the constant acceleration; and did not flatten the curve | NONE |
| Mask Mandate | 23 July 2020 | Initiated the effective phase | Flattened the curve, likely in combination with preceding measures |
| Lockdown 2, Stage 4 | 3 August 2020 | Introduced too late; effect expected at end of effective phase; and did not flatten the curve | NONE |
| Lockdown 3 | 13 February 2021 | Introduced too late; effect expected after effective phase; and did not flatten the curve | NONE |
| Lockdown 4 | 28 May 2021 | Introduced too late; effect expected after effective phase; and did not flatten the curve | Likely supported faster return to zero cases after the effective phase |
| Lockdown 5 | 16 July 2021 | Introduced too late; effect expected in 2nd half of effective phase but invisible; and did not flatten the curve | NONE |
| Lockdown 6 (curfew, permits) | 5 August 2021 17 August 2021 | Introduced far before the effective phase; did not flatten the curve | NONE |
Disclaimer/Publisher’s Note: The statements, opinions and data contained in all publications are solely those of the individual author(s) and contributor(s) and not of MDPI and/or the editor(s). MDPI and/or the editor(s) disclaim responsibility for any injury to people or property resulting from any ideas, methods, instructions or products referred to in the content. |
© 2023 by the authors. Licensee MDPI, Basel, Switzerland. This article is an open access article distributed under the terms and conditions of the Creative Commons Attribution (CC BY) license (https://creativecommons.org/licenses/by/4.0/).
Share and Cite
Fuss, F.K.; Tan, A.M.; Weizman, Y. Retrospective Evaluation of the Effectiveness of COVID-19 Control Strategies Implemented by the Victorian Government in Melbourne—A Proposal for a Standardized Approach to Review and Reappraise Control Measures. COVID 2023, 3, 1063-1078. https://doi.org/10.3390/covid3080078
Fuss FK, Tan AM, Weizman Y. Retrospective Evaluation of the Effectiveness of COVID-19 Control Strategies Implemented by the Victorian Government in Melbourne—A Proposal for a Standardized Approach to Review and Reappraise Control Measures. COVID. 2023; 3(8):1063-1078. https://doi.org/10.3390/covid3080078
Chicago/Turabian StyleFuss, Franz Konstantin, Adin Ming Tan, and Yehuda Weizman. 2023. "Retrospective Evaluation of the Effectiveness of COVID-19 Control Strategies Implemented by the Victorian Government in Melbourne—A Proposal for a Standardized Approach to Review and Reappraise Control Measures" COVID 3, no. 8: 1063-1078. https://doi.org/10.3390/covid3080078