Article

Effect of SARS-CoV-2 Infection on Renal and Hepatic Function after NSAID and Paracetamol Therapy

by
Aurélie Pahud de Mortanges
,
Evangelia Liakoni
,
Verena Schöning
and
Felix Hammann
*,†
Clinical Pharmacology and Toxicology, Department of General Internal Medicine, Inselspital, Bern University Hospital, University of Bern, 3012 Bern, Switzerland
*
Author to whom correspondence should be addressed.
These authors contributed equally to this work.
COVID 2024, 4(7), 910-920; https://doi.org/10.3390/covid4070063
Submission received: 17 May 2024 / Revised: 20 June 2024 / Accepted: 25 June 2024 / Published: 27 June 2024

Abstract

:
NSAIDs and paracetamol are commonly used as antipyretic treatments, which may impair renal and hepatic function, respectively. Both organ systems are also negatively affected by COVID-19. In two retrospective case–control studies, we investigated whether COVID-19 is a risk factor for the development of renal or hepatic function impairment after NSAID and paracetamol use, respectively. In the NSAID study, we defined cases as patients with a decrease of ≥15% in the estimated glomerular filtration rate (eGFR). We matched them using a 1:2 ratio with controls who did not show a decrease in the eGFR. For the paracetamol study, we matched patients with ALT or ALP ≥ 3x, the upper limits of normal, using a 1:3 ratio with controls whose liver enzymes did not increase. In both studies, we selected demographic data, comorbidities, drug doses, and laboratory values as predictors in addition to SARS-CoV-2 test status. We applied different machine learning models to predict renal and hepatic function impairment. From the cohort of 12,263 unique adult inpatients, we found 288 cases of renal function impairment, which were matched with 576 controls, and 213 cases of liver function impairment, which were matched with 639 controls. In both case–control studies, testing positive for SARS-CoV-2 was not an independent risk factor for the studied adverse drug effects.

1. Introduction

Non-steroidal anti-inflammatory drugs (NSAIDs) and paracetamol are commonly used and safe antipyretic treatments for acute infections. However, renal and hepatic impairments, respectively, are well known side effects of these drugs with well-explained modes of action.
The blockade of cyclooxygenase-1 (COX-1) and cyclooxygenase-2 (COX-2) by NSAIDs leads to a decrease in prostaglandin levels, which regulate a variety of renal functions and negatively influence the renin-angiotensin system (RAAS) [1,2]. It was found that patients taking NSAIDs were 73% more likely to develop acute kidney injury (AKI) than the control group (OR 1.73; 95% confidence interval (CI) 1.44 to 2.07) [3]. This corresponds to a prevalence of 1–5% of nephrotoxic syndromes in patients receiving NSAIDs—which is substantial, considering the wide application of these substances [4].
Paracetamol (acetaminophen) can be an adequate alternative to NSAIDs for antipyretic purposes. It generally has a favorable safety profile, yet it can cause drug-induced liver injury (DILI). Paracetamol is metabolized by the liver enzyme CYP2E1 into a toxic metabolite called N-acetyl-p-benzoquinone imine (NAPQI), which is detoxified by glutathione. However, if NAPQI accumulates, e.g., due to glutathione store depletion or CYP2E1 induction, it causes oxidative damage to liver cells, resulting in acute liver failure [5]. This may limit its use in patients with hepatic and non-hepatic risk factors (e.g., alcohol abuse, malnutrition, the usage of certain co-medications, including inducers of CYP2E1 like isoniazid and other drugs with high DILI potential like methotrexate), and even healthy individuals may experience significant liver enzyme elevation while receiving therapeutic doses. In a study by Watkins et al., up to 44% of participants receiving 4 g of paracetamol daily alone or in combination with opioids exhibited alanine aminotransferase (ALT) elevation > 3x the upper limits of normal (ULN) [6].
In March 2020, controversy revolved around the potential risks of using ibuprofen and other NSAIDs in light of the coronavirus disease 2019 (COVID-19) pandemic [7,8]. Though supporting evidence was lacking, it was hypothesized that NSAIDs increase the risk of infection with severe acute respiratory syndrome coronavirus 2 (SARS-CoV-2) and increase the risk of severe disease because of the upregulation of the angiotensin-converting enzyme 2 (ACE 2) receptor, which is used by SARS-CoV-2 to enter cells [9,10,11,12].
For other drugs, it has been shown that such controversies and how drugs are portrayed in the media may impact the perception of substances by the public and the prescription practices carried out by physicians [13,14]. This may be reflected by transient increases or decreases in drug prescriptions. In the case of antipyretics in COVID-19, the media controversy may have increased the perceived risk of NSAIDs in the absence of guidelines and experience, leading to a decrease in NSAID prescriptions and a potential compensatory increase in paracetamol prescriptions as a perceived safer alternative.
Eventually, it was shown that NSAIDs do not increase the severity of a COVID-19 infection nor the likelihood of infection [15,16]. Even though paracetamol was not in the spotlight, its safety was demonstrated in patients with COVID-19 [17].
However, while NSAIDs do not increase the severity of COVID-19, the influence of COVID-19 on the occurrence of renal side effects of NSAIDs need also to be considered. COVID-19 negatively influences kidney function, causing renal tubular degeneration, necrosis, and thrombotic microangiopathy. This may lead to acute renal failure in up to 27% of hospitalized patients with COVID-19 [18]. It is therefore imaginable that, as an accumulation of risks, COVID-19 might exacerbate renal function impairment after NSAID treatment.
Additionally, an elevation of transaminases was observed in two-thirds of hospitalized patients with COVID-19 [19]. In COVID-19, the folate and one-carbon metabolism are modified to accommodate virus replication. Reduced glutathione (GSH) is essential for inactivating the toxic paracetamol metabolite N-Acetyl-p-benzoquinone imine (NAPQI). The total GSH blood levels are decreased in patients with COVID-19, with lower levels being observed in more severely ill patients [20]. This might put patients with COVID-19 at a higher risk of developing liver function impairment after paracetamol treatment than individuals without COVID-19.
Therefore, we examined in two retrospective case–control studies whether SARS-CoV-2 infection is an independent risk factor for the development of renal and hepatic impairment after NSAIDS and paracetamol use, respectively. For the analysis, we applied different machine learning (ML) algorithms, which may serve as a use case of how ML can contribute to personalized treatment choices in predictive clinical toxicology. Additionally, we investigated possible differences between in-hospital administrations of paracetamol and NSAIDs in patients who tested positive for SARS-CoV-2 and the general patient population to gain insights into the interference of media controversy with prescription practices.

2. Materials and Methods

2.1. Study Population

We conducted this study at the Insel Hospital Group, Bern, Switzerland, which comprised, at the time of data collection, the University Hospital of Bern and five locations in the surrounding area, treating approximately 860,000 patients every year. The overall study cohort consisted of all adult (≥18 years) inpatients for whom age and sex were recorded and who underwent diagnostic testing for SARS-CoV-2 between 1 January 2020 and 6 November 2021 regardless of the outcome of the test (Figure 1). We retrieved patient data on demographics, laboratory analyses, and administered medication from the electronic health records (EHRs) for 90 days before and 42 days after diagnostic testing for SARS-CoV-2. The data recorded in the EHRs determined the time window of 90 days prior to testing, and the 42 days after testing cover the average duration of illness in hospitalized patients plus a safety margin [21,22]. Diagnostic tests were performed as nasopharyngeal swabs and evaluated through reverse-transcriptase polymerase chain reaction (RT-PCR) assays. We excluded patients who did not provide general research consent from the analyses. For patients without a registered general research consent status, the Cantonal Ethics Committee of Bern granted a waiver of consent (Project-ID 2020-00973).

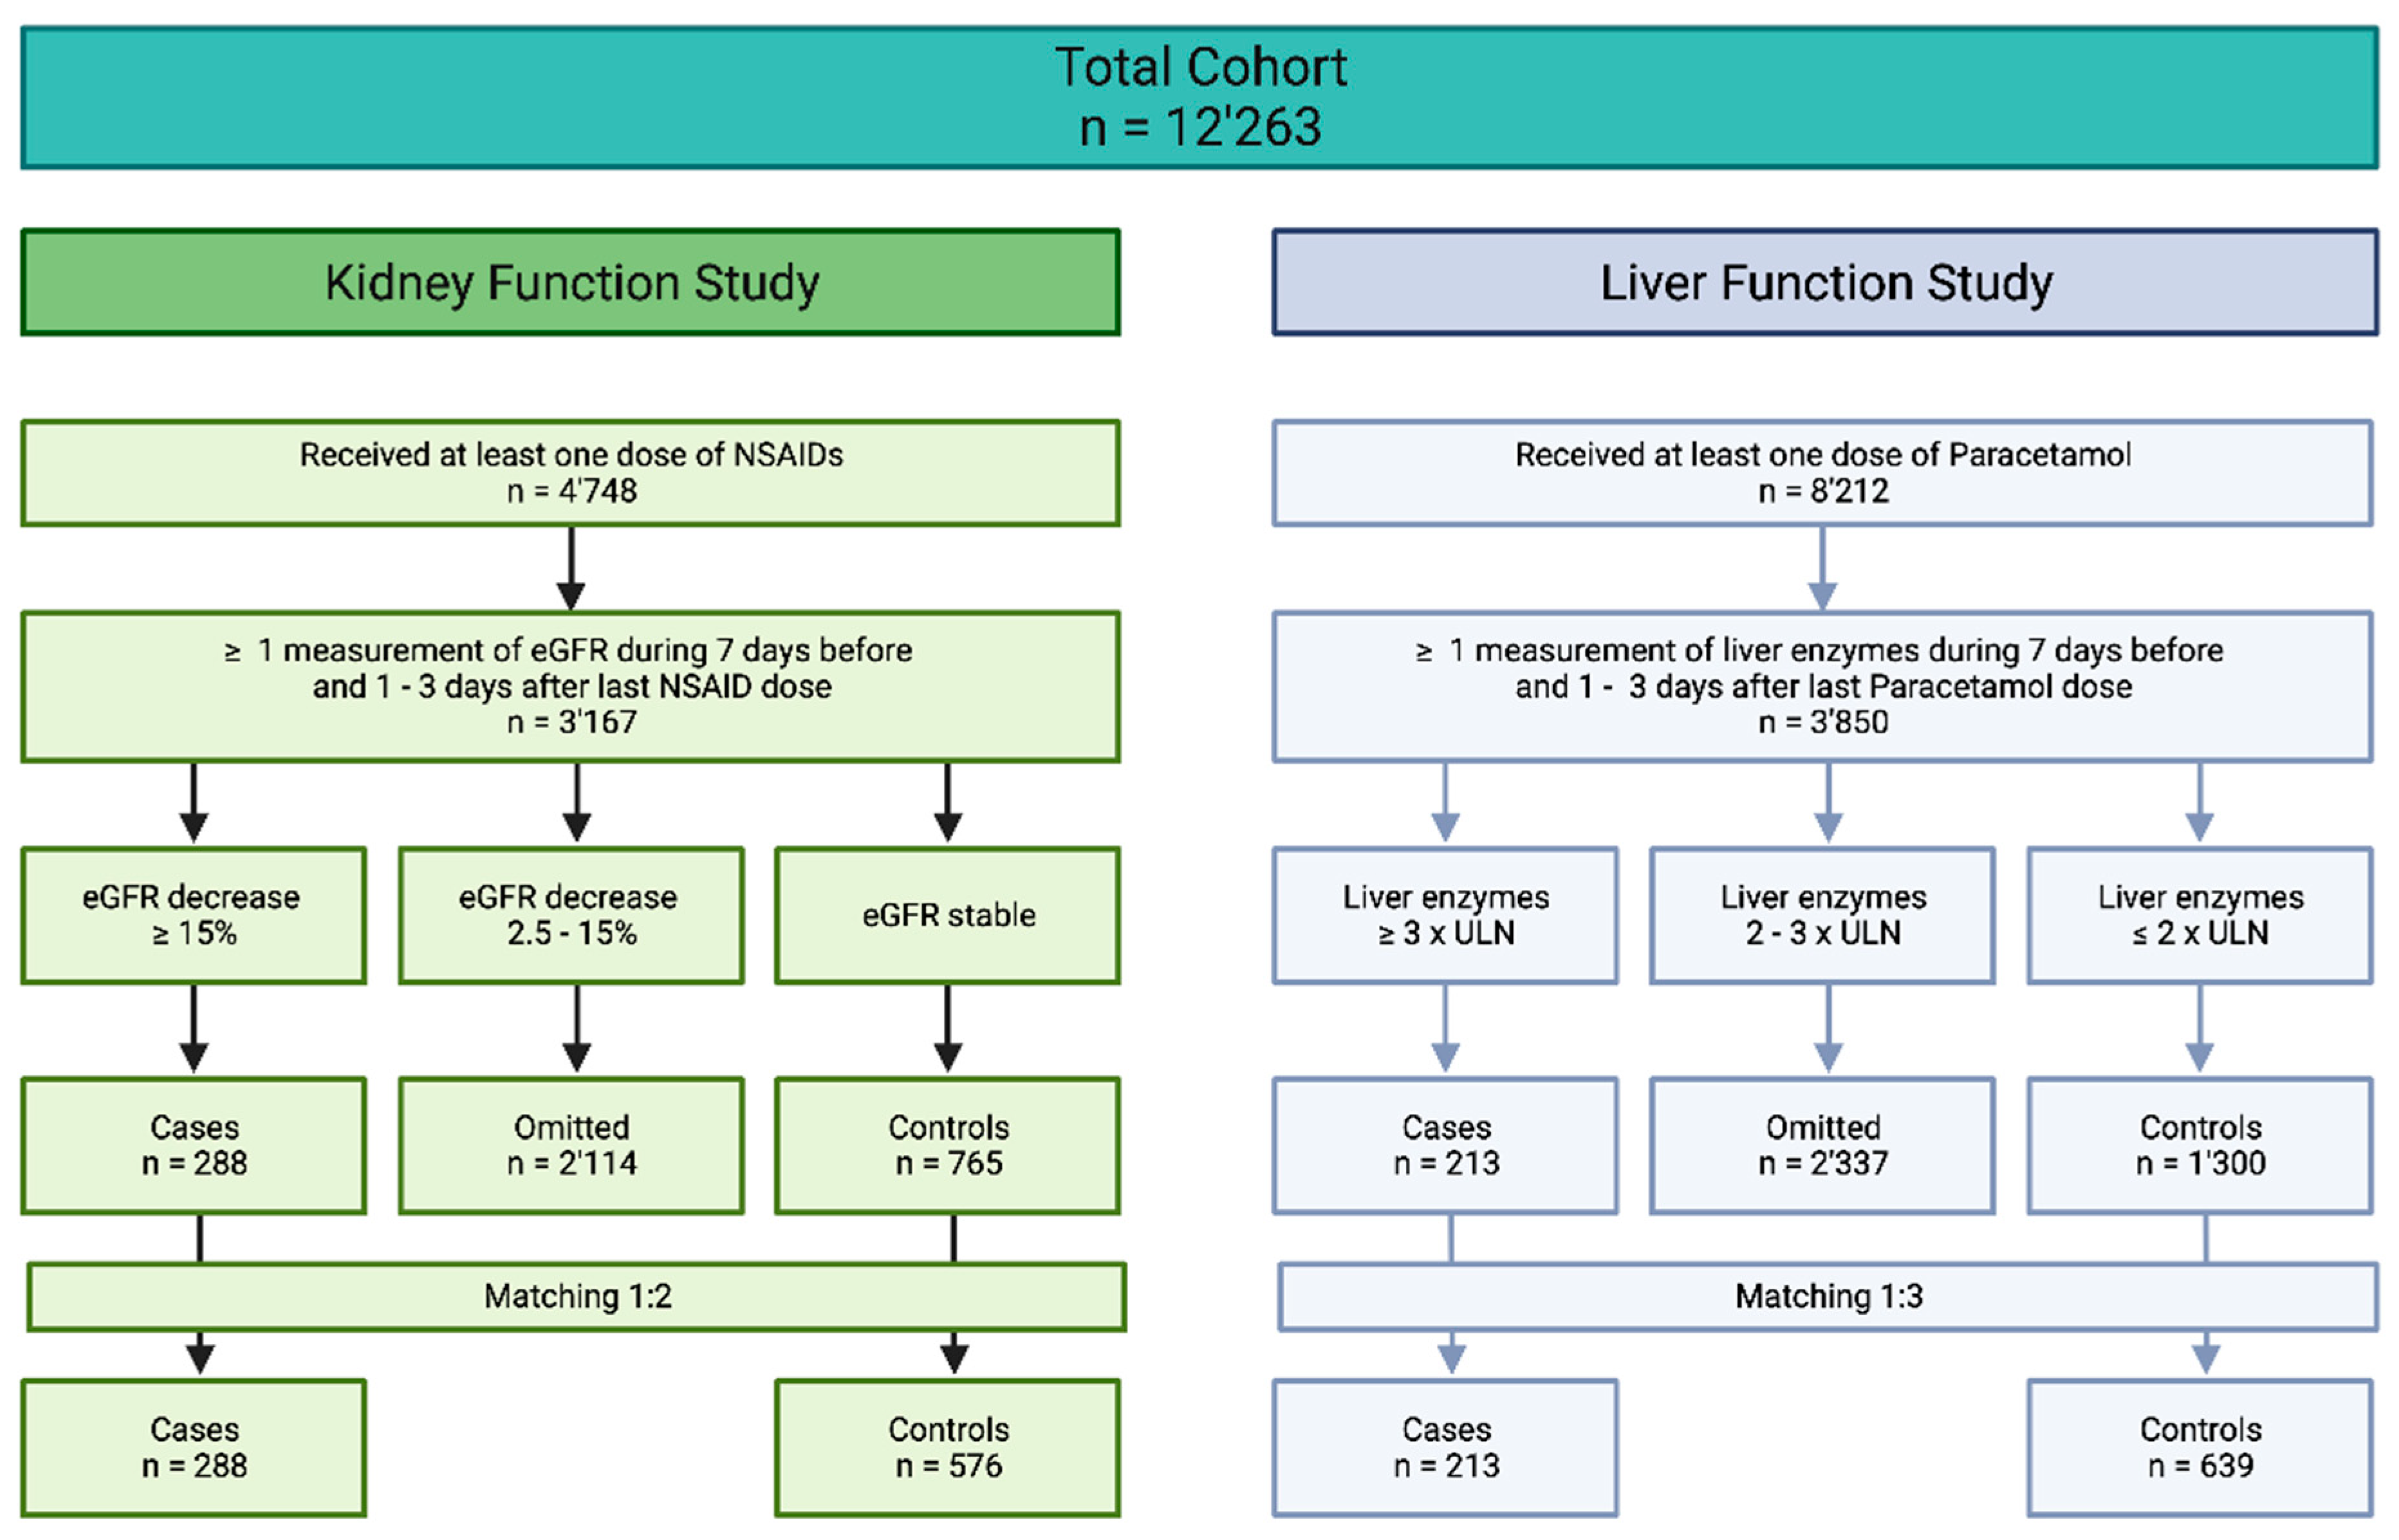
2.2. Case–Control Studies

We conducted two retrospective case–control studies. One was conducted for the evaluation of AKI risk after NSAID use, and one was conducted for the evaluation of DILI risk after paracetamol use. In both studies, we defined the case group as patients with a significant decline in the function of the respective organ while receiving study drugs.

2.2.1. Definitions of Cases and Controls

For the case–control analysis predicting AKI after NSAID use, we identified individuals from the overall study population who received one or more doses of NSAIDs, including ibuprofen, acetylsalicylic acid, naproxen, and diclofenac, as well as COX-2 selective inhibitors. The case group constituted individuals who exhibited an eGFR of ≥75 mL/min within the seven days before the start of NSAID intake and a subsequent decrease in the GFR of ≥15% within or up to three days after NSAID intake. The control group constituted individuals who also exhibited an eGFR of ≥75 mL/min within the seven days before the start of NSAID intake but showed no significant decrease within and up to three days after NSAID intake. We defined ‘no significant decrease in eGFR’ as an increase, stable values, or a decrease of no more than 2.5%, which accounts for the biological intra-individual variability of the eGFR [23,24]. The hospital group uses the Chronic Kidney Disease Epidemiology Collaboration (CKD-EPI) equation to estimate the eGFR [25]. We extracted available eGFR directly from the EHRs or calculated it from plasma creatinine measurements by applying the CKD-EPI formula when data were missing.
For the case–control analysis on paracetamol, we identified individuals who received one or more doses of paracetamol. We included patients with measurements of alanine transaminase (ALT) ≤ 2× the upper limit of the norm (ULN) (90 IU/L) and alkaline phosphatase (ALP) ≤ 2× the ULN (200 IU/L) before paracetamol treatment. We defined cases as subjects with ALT > 3× ULN (135 IU/L) or ALP > 3× ULN (300 IU/L) within or up to 3 days after paracetamol treatment. Controls remained at ALT and ALP ≤ 2× ULN during and after paracetamol treatment [26]. We matched cases and controls using nearest neighbor matching based on age and sex using a logistic regression propensity score [27] with a 1:2 ratio for the AKI analysis and a 1:3 ratio for the DILI analysis.

2.2.2. Data Preparation

We split both case–control cohorts into a training and internal hold-out validation set in an 80:20 ratio stratified by outcome. The initial selection of features included the manual identification of demographic data, COVID-19 testing status, drug dose, comorbidities, and laboratory variables with pathophysiological relevance and high data availability. We calculated the daily mean, minimum, and maximum for all variables. We considered demographic variables stable if no newer information was available (last observation carried forward). We imputed missing variables for a maximum of 20% of data points per row and column using Random Forest imputation (missForest package version 1.5) [28]. If the columns (features) contained fewer data points, we removed them; there were no rows (individual patients) with more than 20% of missing values. Subsequently, we checked features for collinearity by calculating the Spearman correlation coefficient for all pairs. If two variables showed a correlation of ≥0.3 (two-sided), we removed the variable with the larger mean absolute correlation.
If patients were diagnosed with COVID-19, we set the disease duration to 21 days if not otherwise indicated within the EHRs.
To account for the significant variation in dosages across the different drugs within the NSAIDs group, we categorized dosages into four distinct levels: low, normal, high, and supratherapeutic (Table 1). This classification was necessary due to the diverse dosing requirements of the included medications, ensuring a consistent framework for comparison and analysis. This stratification allows for a more accurate comparison of dosages and their effects across different medications, facilitating a clearer understanding of their therapeutic profiles.
We identified pre-existing comorbidities based on their respective ICD-10 codes. We specifically focused on diseases which are known risk factors for renal and hepatic impairment: hypertension (I.10–I.15), ischemic heart disease (I.20–I.25), pulmonary heart disease (I.26–I.28), diseases of the circulatory system (I.7), diabetes E.10–E.15), obesity (E.65–E.68), and other virus infections (A.15–A.19, B.15–B.24).

2.2.3. Model Building

We fitted different ML models for both datasets, respectively, as follows: (1) logistic regression (LogReg), (2) classification and regression trees (CART), (3) Random Forest (RF), (4) K-nearest neighbor (Knn), and (5) Adaptive Boosting (AdaBoost). To build the LogReg, Knn, and AdaBoost models, we used the caret package (version 6.0.94). We trained them using fivefold internal cross-validation and weights to account for class imbalance owing to the case–control matching. For CART and RF, we custom-built the models using the randomForest (version 4.7.1.1) and rpart (version 4.1.19) packages, respectively, to enable hyperparameter tuning beyond the functionalities of caret.

2.3. Software

We performed all analyses using R statistical software (version 4.3.1, R Foundation for Statistical Computing, http://www.R-project.org, Vienna, Austria).

3. Results

3.1. Study Population

The overall study population consisted of 12,263 adult inpatients for whom age and sex were recorded and who underwent nasopharyngeal swab testing between 1 January 2020 and 6 November 2021, corresponding to the first four waves of COVID-19 in Switzerland (Figure 1).

3.2. Case–Control Study on Renal Function

A total of 288 cases and 576 matched controls were included and 18 features were chosen for modeling. The mean age of the patients in both groups was 65.5 years, and 63.3% were female. Regarding the differences in baseline characteristics for the selected features between the case group and the control group, there were significantly more patients who were positive for COVID-19 in the control group (4.4% vs. 1.1%, p = 0.017). Furthermore, the patients in the control group had a significantly higher CRP (mean (SD) 58.57 IU/L (73.41) vs. 40.20 IU/L (61.07), p = 0.001). For all other features, there were no statistically significant differences (Table 2).
The different ML algorithms showed low predictive performance to identify patients who developed AKI after NSAID intake. The balanced accuracy in the training sets ranged from 0.57 in LogReg to 0.98 in AdaBoost. In the testing sets, the balanced accuracy ranged from 0.56 in LogReg to 0.73 in AdaBoost (Table 4). The difference in accuracy between the training and testing sets in AdaBoost is indicative of overfitting to the training data, which is not a sign of good model performance. The analysis of relative variable importance based on the Gini coefficient for AdaBoost, the best performing model, showed that leukocytes, body weight, glucose, age, and thrombocytes had the most influence on the prediction. Most importantly, we saw that testing positive for SARS-CoV-2 was not an independent risk factor for the development of AKI after NSAID administration.

3.3. Case–Control Study on Hepatic Function

We included 213 cases and 639 matched controls, and we selected 20 features for modeling. Regarding differences in the baseline characteristics for the chosen features between the control group and the case group, there were significant differences in the minimum BMI (mean (SD) 25.85 kg/m2 (5.6) vs. 24.61 kg/m2 (5.47), p = 0.009), in maximum erythrocytes (4.19 1012/L (0.85) vs. 3.91 1012/L (0.91), p < 0.001), in maximum thrombocytes (2472.6 109/L (1769.65) vs. 211.61 109/L (123.31), p = 0.005)), in the mean ALT (26.05 IU/L (14.53) vs. 31.88 IU/L (18.57), p < 0.001), in the min ALP (82.92 IU/L (28.86) vs. 93.44 IU/L (37.64), p < 0.001), and in the mean potassium (3.98mg/L (0.46) vs. 4.07mg/L (0.67), p = 0.033). For the other baseline features, there were no statistically significant differences (Table 3).
Just as for the prediction of AKI, we were not able to train the ML algorithms with sufficient predictive power to identify patients who developed DILI after paracetamol intake. The balanced accuracy ranged from 0.68 in LogReg to 0.83 in AdaBoost. In the testing sets, the balanced accuracy ranged from 0.59 in LogReg to 0.75 in Knn (Table 4). AdaBoost could distinguish cases and controls with high accuracy within the training dataset but again showed a decreased performance in the testing dataset. This indicates massive overfitting during training, resulting in low generalizability. The analysis of relative variable importance based on the Gini coefficient for AdaBoost, the best performing model, showed that erythrocytes, ALAT, potassium, thrombocytes, AP, and dose had the most influence on the prediction. Also, the SARS-CoV-2 test status was not an independent risk factor for predicting the development of DILI after paracetamol administration.

4. Discussion

In these two retrospective case–control studies, we found that testing positive for SARS-CoV-2 did not increase the risk of drug-induced renal or hepatic impairment after NSAID or paracetamol treatment. With our limited set of features consisting of routine demographic data, comorbidities, drug dose, and laboratory parameters, we were overall not able to train the ML models with sufficient predictive power.
Within the paracetamol cohort, several selected features significantly differed between the cases and controls, which were used by the ML models for prediction. The patients who developed DILI after paracetamol intake had significantly lower erythrocyte and thrombocyte counts than the controls, which might be explainable by a pathophysiological mechanism. Anemia is a common finding among patients with chronic liver disease, which is attributable to multiple mechanisms such as increased splenic sequestration due to portal hypertension and gastrointestinal bleeding [29].
Additionally, decreased thrombopoietin production by the liver and immune-mediated phenomena may contribute to thrombocytopenia [30,31]. Furthermore, the weight values differed significantly at baseline between the cases and controls. Since there is a strong correlation between weight and non-alcoholic fatty liver disease (NAFLD) [32], weight might be viewed as a proxy for NAFLD. Therefore, the erythrocyte count, thrombocyte count, and weight may be indicators of impaired liver function, even if the patient has no diagnosed liver disease, and they could serve in personalized decision making for antipyretic treatment, as they are readily available markers. However, it is impossible to reliably predict DILI after paracetamol administration using those features, including the SARS-CoV-2 testing status, as shown and confirmed by four ML algorithms.
In addition, in the case–control study predicting AKI after NSAID intake, very different features for the cases and controls were selected: the controls had a significantly higher baseline CRP than the cases. This difference between groups is likely an artifact attributable to transfer practice: the University Hospital of Bern is much larger than the other surrounding institutions, so it can be assumed that the majority of cases and controls were treated at the university hospital, which serves as a tertiary care center for a large proportion of the country. We assume that among the patients transferred from smaller institutions, those without COVID-19 might have been more severely ill than those with COVID-19, as increased caution was taken in the patients with COVID-19 at the beginning of the pandemic.
From a pathophysiological point of view, an aggravation of adverse effects of NSAIDs and paracetamol by SARS-CoV-2 is plausible both because of organ-specific risk accumulation as well as through direct interaction mechanisms. Yet, our results of COVID-19 diagnosis contributing only marginally to the classification are in line with a large retrospective cohort study comprising 19,746 COVID-19 cases and an equal number of matched controls from 38 centers [33]. This study found that among the patients with COVID-19, NSAID users were less likely (odds ratio: 0.67) to develop AKI than the patients who were not treated with NSAIDs. To the best of our knowledge, there are currently no studies that have evaluated whether paracetamol-related liver toxicity is more frequent in patients with COVID-19.
A current popular application of ML in pharmacology is, for example, the prediction of drug-induced liver injury (DILI) in drug development. The primary goals are, among others, an early assessment of the DILI risk of drug candidates before they enter the clinical trial phase and the identification of molecular features that are related to DILI [34,35,36]. Taking the prediction of DILI from drug development into the post-marketing phase to gain insights into the DILI risk in patients with different characteristics and under different clinical circumstances offers great potential for personalized treatment choices to minimize adverse drug effects. In this sense, our approach to predicting AKI and liver enzyme elevation in patients with SARS-CoV-2 can be translated to the prediction of adverse drug effects in various scenarios.
Our study has several strengths. First, our analyses included all applicable patients who were tested for SARS-CoV-2 between 1 January 2020 and 6 November 2021. We thus cover an extensive sample that can be regarded as representative of the local population. Second, we applied a wide range of ML algorithms, which are emerging as valuable tools in predictive toxicology [37]. This offers methodological novelty and increased confidence in the results when viewed in synopsis.
Regarding the limitations of our study, we did not consider the severity of COVID-19 disease in our analyses because this these data are not systematically recorded in our EHRs. It is therefore possible that in specific subgroups of patients with COVID-19, such as intubated patients, the effect of COVID-19 on the medication-associated impairment of renal and hepatic function is more pronounced than in patients with less severe illness. Additionally, given the requirement of multiple renal and hepatic laboratory parameter measurements within a short time frame, our studies only capture inpatients. We therefore cannot draw reliable conclusions for COVID-19 outpatients. Furthermore, the share of patients with comorbidities is very low, which leads us to the conclusion that the cohort set was incomplete in that regard. Therefore, we were not able to appreciate the effect of comorbidities on drug-induced renal or hepatic failure.

5. Conclusions

The development of AKI after NSAID intake and the development of DILI after paracetamol intake could not be reliably predicted from a limited set of demographic and routine laboratory parameters. Testing positive for SARS-CoV-2 was not found to be an independent risk factor for AKI nor DILI after antipyretic drug use; rather, the overall condition of the patient needs to be considered in personalized decision making.

Author Contributions

Conceptualization: F.H.; Data Curation: A.P.d.M. and V.S.; Methodology: A.P.d.M., V.S., and F.H.; Writing—Original Draft: A.P.d.M.; Writing—Review and Editing: A.P.d.M., V.S., E.L., and F.H.; Visualization: A.P.d.M. and V.S.; Supervision: V.S., E.L., and F.H.; Project Administration: F.H. All authors have read and agreed to the published version of the manuscript.

Funding

This research received no external funding.

Institutional Review Board Statement

This study was approved by the local human research ethics committee (Kantonale Ethikkommission Bern, ID 2020-00973, first approval 27 April 2020).

Informed Consent Statement

The local human research ethics committee (Kantonale Ethikkommission Bern, ID 2020-00973) waived the need for general consent in view of the retrospective nature of this study and all of the data being collected as a part of routine care.

Data Availability Statement

The demographic, laboratory, and medication administration data on which this study is based are available on Github at the following link: https://github.com/VSchoening/Antipyretics_Covid-19. The data on COVID-19 case counts are available from the Federal Office of Public Health of Switzerland and can be downloaded from the following link: https://www.covid19.admin.ch/de/epidemiologic/case.

Acknowledgments

The authors would like to thank Noel Frey and Sebastian Werthemann from the Insel Data Science Center for their support in data extraction and Jürgen Barth for his advice on scientific writing.

Conflicts of Interest

The authors declare no conflicts of interest.

References

  1. Hörl, W.H. Nonsteroidal Anti-Inflammatory Drugs and the Kidney. Pharmaceuticals 2010, 3, 2291–2321. [Google Scholar] [CrossRef] [PubMed]
  2. Harris, R.C. COX-2 and the kidney. J. Cardiovasc. Pharmacol. 2006, 47 (Suppl. S1), S37–S42. [Google Scholar] [CrossRef] [PubMed]
  3. Zhang, X.; Donnan, P.T.; Bell, S.; Guthrie, B. Non-steroidal anti-inflammatory drug induced acute kidney injury in the community dwelling general population and people with chronic kidney disease: Systematic review and meta-analysis. BMC Nephrol. 2017, 18, 256. [Google Scholar] [CrossRef] [PubMed]
  4. Whelton, A. Nephrotoxicity of nonsteroidal anti-inflammatory drugs: Physiologic foundations and clinical implications. Am. J. Med. 1999, 106, 13s–24s. [Google Scholar] [CrossRef] [PubMed]
  5. Mazaleuskaya, L.L.; Sangkuhl, K.; Thorn, C.F.; FitzGerald, G.A.; Altman, R.B.; Klein, T.E. PharmGKB summary: Pathways of acetaminophen metabolism at the therapeutic versus toxic doses. Pharmacogenet. Genom. 2015, 25, 416–426. [Google Scholar] [CrossRef] [PubMed]
  6. Watkins, P.B.; Kaplowitz, N.; Slattery, J.T.; Colonese, C.R.; Colucci, S.V.; Stewart, P.W.; Harris, S.C. Aminotransferase elevations in healthy adults receiving 4 grams of acetaminophen daily: A randomized controlled trial. JAMA 2006, 296, 87–93. [Google Scholar] [CrossRef] [PubMed]
  7. Pan American Health Organization. Ibuprofen and COVID-19; Pan American Health Organization: Washington, DC, USA, 2020. [Google Scholar]
  8. Day, M. COVID-19: Ibuprofen should not be used for managing symptoms, say doctors and scientists. BMJ 2020, 368, m1086. [Google Scholar] [CrossRef] [PubMed]
  9. Moore, N.; Bosco-Levy, P.; Thurin, N.; Blin, P.; Droz-Perroteau, C. NSAIDs and COVID-19: A Systematic Review and Meta-analysis. Drug Saf. 2021, 44, 929–938. [Google Scholar] [CrossRef] [PubMed]
  10. Hoffmann, M.; Kleine-Weber, H.; Schroeder, S.; Krüger, N.; Herrler, T.; Erichsen, S.; Schiergens, T.S.; Herrler, G.; Wu, N.H.; Nitsche, A.; et al. SARS-CoV-2 Cell Entry Depends on ACE2 and TMPRSS2 and Is Blocked by a Clinically Proven Protease Inhibitor. Cell 2020, 181, 271–280.e278. [Google Scholar] [CrossRef]
  11. Valenzuela, R.; Pedrosa, M.A.; Garrido-Gil, P.; Labandeira, C.M.; Navarro, G.; Franco, R.; Rodriguez-Perez, A.I.; Labandeira-Garcia, J.L. Interactions between ibuprofen, ACE2, renin-angiotensin system, and spike protein in the lung. Implications for COVID-19. Clin. Transl. Med. 2021, 11, e371. [Google Scholar] [CrossRef]
  12. Kuba, K.; Imai, Y.; Rao, S.; Gao, H.; Guo, F.; Guan, B.; Huan, Y.; Yang, P.; Zhang, Y.; Deng, W.; et al. A crucial role of angiotensin converting enzyme 2 (ACE2) in SARS coronavirus–induced lung injury. Nat. Med. 2005, 11, 875–879. [Google Scholar] [CrossRef]
  13. Webster, F.; Rice, K.; Sud, A. A critical content analysis of media reporting on opioids: The social construction of an epidemic. Soc. Sci. Med. 2020, 244, 112642. [Google Scholar] [CrossRef]
  14. Webster, F.; Rice, K.; Katz, J.; Bhattacharyya, O.; Dale, C.; Upshur, R. An ethnography of chronic pain management in primary care: The social organization of physicians’ work in the midst of the opioid crisis. PLoS ONE 2019, 14, e0215148. [Google Scholar] [CrossRef]
  15. Kushner, P.; McCarberg, B.H.; Grange, L.; Kolosov, A.; Haveric, A.L.; Zucal, V.; Petruschke, R.; Bissonnette, S. The use of non-steroidal anti-inflammatory drugs (NSAIDs) in COVID-19. npj Prim. Care Respir. Med. 2022, 32, 35. [Google Scholar] [CrossRef]
  16. Drake, T.M.; Fairfield, C.J.; Pius, R.; Knight, S.R.; Norman, L.; Girvan, M.; Hardwick, H.E.; Docherty, A.B.; Thwaites, R.S.; Openshaw, P.J.M.; et al. Non-steroidal anti-inflammatory drug use and outcomes of COVID-19 in the ISARIC Clinical Characterisation Protocol UK cohort: A matched, prospective cohort study. Lancet Rheumatol. 2021, 3, e498–e506. [Google Scholar] [CrossRef] [PubMed]
  17. Lapi, F.; Marconi, E.; Grattagliano, I.; Rossi, A.; Fornasari, D.; Magni, A.; Lora Aprile, P.; Cricelli, C. To clarify the safety profile of paracetamol for home-care patients with COVID-19: A real-world cohort study, with nested case-control analysis, in primary care. Intern. Emerg. Med. 2022, 17, 2237–2244. [Google Scholar] [CrossRef]
  18. Trypsteen, W.; Van Cleemput, J.; Snippenberg, W.v.; Gerlo, S.; Vandekerckhove, L. On the whereabouts of SARS-CoV-2 in the human body: A systematic review. PLOS Pathog. 2020, 16, e1009037. [Google Scholar] [CrossRef] [PubMed]
  19. Leo, M.; Galante, A.; Pagnamenta, A.; Ruinelli, L.; Ponziani, F.R.; Gasbarrini, A.; De Gottardi, A. Hepatocellular liver injury in hospitalized patients affected by COVID-19: Presence of different risk factors at different time points. Dig. Liver Dis. 2022, 54, 565–571. [Google Scholar] [CrossRef] [PubMed]
  20. Perła-Kaján, J.; Jakubowski, H. COVID-19 and One-Carbon Metabolism. Int. J. Mol. Sci. 2022, 23, 4181. [Google Scholar] [CrossRef]
  21. Zhou, F.; Yu, T.; Du, R.; Fan, G.; Liu, Y.; Liu, Z.; Xiang, J.; Wang, Y.; Song, B.; Gu, X.; et al. Clinical course and risk factors for mortality of adult inpatients with COVID-19 in Wuhan, China: A retrospective cohort study. Lancet 2020, 395, 1054–1062. [Google Scholar] [CrossRef]
  22. Adams, D. The Hitch Hiker’s Guide to the Galaxy; Pan Books: London, UK, 1979. [Google Scholar]
  23. Thöni, S.; Keller, F.; Denicolò, S.; Buchwinkler, L.; Mayer, G. Biological variation and reference change value of the estimated glomerular filtration rate in humans: A systematic review and meta-analysis. Front. Med. 2022, 9, 1009358. [Google Scholar] [CrossRef]
  24. Carobene, A.; Aarsand, A.K.; Bartlett, W.A.; Coskun, A.; Diaz-Garzon, J.; Fernandez-Calle, P.; Guerra, E.; Jonker, N.; Locatelli, M.; Plebani, M.; et al. The European Biological Variation Study (EuBIVAS): A summary report. Clin. Chem. Lab. Med. 2022, 60, 505–517. [Google Scholar] [CrossRef]
  25. Pugliese, G.; Solini, A.; Bonora, E.; Orsi, E.; Zerbini, G.; Giorgino, F.; Cavalot, F.; Pontiroli, A.E.; Baroni, M.G.; Morano, S.; et al. The Chronic Kidney Disease Epidemiology Collaboration (CKD-EPI) equation provides a better definition of cardiovascular burden associated with CKD than the Modification of Diet in Renal Disease (MDRD) Study formula in subjects with type 2 diabetes. Atherosclerosis 2011, 218, 194–199. [Google Scholar] [CrossRef] [PubMed]
  26. Aithal, G.P.; Watkins, P.B.; Andrade, R.J.; Larrey, D.; Molokhia, M.; Takikawa, H.; Hunt, C.M.; Wilke, R.A.; Avigan, M.; Kaplowitz, N.; et al. Case definition and phenotype standardization in drug-induced liver injury. Clin. Pharmacol. Ther. 2011, 89, 806–815. [Google Scholar] [CrossRef] [PubMed]
  27. Ho, D.; Imai, K.; King, G.; Stuart, E.A. MatchIt: Nonparametric Preprocessing for Parametric Causal Inference. J. Stat. Softw. 2011, 42, 1–28. [Google Scholar] [CrossRef]
  28. Stekhoven, D.J.; Bühlmann, P. MissForest—Non-parametric missing value imputation for mixed-type data. Bioinformatics 2011, 28, 112–118. [Google Scholar] [CrossRef] [PubMed]
  29. Gonzalez-Casas, R.; Jones, E.A.; Moreno-Otero, R. Spectrum of anemia associated with chronic liver disease. World J. Gastroenterol. 2009, 15, 4653–4658. [Google Scholar] [CrossRef] [PubMed]
  30. Peck-Radosavljevic, M. Thrombocytopenia in liver disease. Can. J. Gastroenterol. 2000, 14 (Suppl. D), 60d–66d. [Google Scholar] [CrossRef]
  31. Giannini, E.G. Review article: Thrombocytopenia in chronic liver disease and pharmacologic treatment options. Aliment. Pharmacol. Ther. 2006, 23, 1055–1065. [Google Scholar] [CrossRef]
  32. Loomis, A.K.; Kabadi, S.; Preiss, D.; Hyde, C.; Bonato, V.; St Louis, M.; Desai, J.; Gill, J.M.; Welsh, P.; Waterworth, D.; et al. Body Mass Index and Risk of Nonalcoholic Fatty Liver Disease: Two Electronic Health Record Prospective Studies. J. Clin. Endocrinol. Metab. 2016, 101, 945–952. [Google Scholar] [CrossRef]
  33. Reese, J.T.; Coleman, B.; Chan, L.; Blau, H.; Callahan, T.J.; Cappelletti, L.; Fontana, T.; Bradwell, K.R.; Harris, N.L.; Casiraghi, E.; et al. NSAID use and clinical outcomes in COVID-19 patients: A 38-center retrospective cohort study. Virol. J. 2022, 19, 84. [Google Scholar] [CrossRef] [PubMed]
  34. Xu, Y.; Dai, Z.; Chen, F.; Gao, S.; Pei, J.; Lai, L. Deep Learning for Drug-Induced Liver Injury. J. Chem. Inf. Model. 2015, 55, 2085–2093. [Google Scholar] [CrossRef] [PubMed]
  35. He, S.; Ye, T.; Wang, R.; Zhang, C.; Zhang, X.; Sun, G.; Sun, X. An In Silico Model for Predicting Drug-Induced Hepatotoxicity. Int. J. Mol. Sci. 2019, 20, 1897. [Google Scholar] [CrossRef] [PubMed]
  36. Zhang, H.; Ding, L.; Zou, Y.; Hu, S.Q.; Huang, H.G.; Kong, W.B.; Zhang, J. Predicting drug-induced liver injury in human with Naïve Bayes classifier approach. J. Comput. Aided Mol. Des. 2016, 30, 889–898. [Google Scholar] [CrossRef]
  37. Wang, M.W.H.; Goodman, J.M.; Allen, T.E.H. Machine Learning in Predictive Toxicology: Recent Applications and Future Directions for Classification Models. Chem. Res. Toxicol. 2021, 34, 217–239. [Google Scholar] [CrossRef]
Figure 1. Inclusion flowchart for both case–control studies.
Covid 04 00063 g001
Table 1. Drug dose ranges for categorized dosage levels.
DrugLow DoseMedium DoseHigh DoseSupratherapeutic
Acetylsalicylic acid≤300 mg300–1000 mg1000–4000 mg>4000 mg
Ibuprofen≤400 mg400–1200 mg1200–2400 mg>2400 mg
Diclofenac≤50 mg50–150 mg150–200 mg>200 mg
Naproxen≤500 mg500–1250 mg1250–1500 mg>1500 mg
Coxibe≤60 mg60–90 mg90–400 mg>400 mg
Paracetamol≤500 mg500–2000 mg2000–4000 mg>4000 mg
Table 2. The baseline characteristics of the study population in the case–control study on renal function.
FeatureOverall (n = 864)Control (n = 576)Case (n = 288)p-Value
Min. eGFR [mL/min]
mean (SD)
[range]
before NSAIDS91.53 (11.61)
[75.0–148.76]
90.46 (12.19)
[75.0–148.76]
91.17 (11.81)
[75.0–138.93]
0.211
after
NSAIDS
90.05 (24.47)
[6.57–156.43]
101.32 (15.26)
[73.84–156.43]
59.28 (17.46)
[6.57–110.60]
<0.001 *
Sex male (%)317 (36.7)213 (37.0)104 (36.1)0.861
Age mean (SD)65.51 (14.30)65.0 (14.08)66.54 (14.72)0.136
Positive COVID-19 status (%)27 (3.1)24 (4.2)3 (1.0)0.023 *
Max. weight [kg] mean (SD)77.93 (18.98)76.83 (19.39)80.02 (18.04)0.023
Mean glucose [mmol/L] mean (SD)7.24 (2.18)7.50 (2.21)7.32 (2.19)0.121
Max. hemoglobin [g/L] mean (SD)131.10 (19.36)128.88 (21.68)130.36 (20.17)0.132
Mean leukocytes [109/L] mean (SD)10.47 (9.83)9.56 (3.95)10.17 (8.35)0.135
Min. INR mean (SD)1.09 (0.20)1.11 (0.25)1.09 (0.22)0.298
Mean CRP [mg/L] mean (SD)58.57 (73.41)40.20 (61.07)52.69 (70.19)0.001 *
Mean sodium [mg/L] mean (SD)137.11 (7.04)136.70 (7.87)136.98 (7.33)0.441
Mean potassium [mg/L] mean (SD)3.96 (0.35)4.00 (0.40)3.98 (0.37)0.125
Hypertension (%)38 (4.4)28 (4.4)7 (3.3)0.618
Ischemic heart disease (%)18 (2.1)14 (2.4)4 (1.4)0.448
Pulmonary heart disease (%)6 (0.7)5 (0.9)1 (0.3)0.664
Diseases circulatory system (%)11 (1.3)6 (1.0)5 (1.7)0.592
Diabetes (%)13 (1.5)8 (1.4)5 (1.7)0.921
Obesity (%)4 (0.5)2 (0.3)2 (0.7)0.859
Other virus infections000NA
CRP: C-reactive protein, eGFR: estimated glomerular filtration rate, INR: international normalized ratio. * statistically significant (p < 0.05).
Table 3. The baseline characteristics of the study population in the case–control study on hepatic function.
FeatureOverall (n = 852)Control (n = 639)Case (n = 213)p-Value
Max. ALT [IU/L] mean (SD)
[range]
Before paracetamol26.2 (16.33)
[4.0–90.0]
25.08 (15.55)
[4.0–89.0]
33.09 (19.12)
[6.0–90.0]
<0.001 *
After paracetamol73.29 (270.20)
[3.0–8223.0]
31.7 (19.64)
[3.0–90.0]
327.1 (665.58)
[13.0–8223.0]
<0.001 *
Max. ALP [IU/L] mean (SD)
[range]
Before paracetamol89.39 (33.36)
[22.0–200.0]
88.09 (32.21)
[22.0–200]
97.33 (38.81)
[28.0–194.0]
0.001 *
After paracetamol131.8 (132.96)
[24.0–1784.0]
97.87 (38.06)
[24.0–200.0]
343.1 (258.95)
[41.0–1784.0]
<0.001 *
Sex male (%)321 (37.7)242 (37.9)79 (37.1)0.903
Age mean (SD)60.97 (17.26)60.94 (17.12)60.65 (17.47)0.832
Positive COVID-19 status (%)31 (3.6)26 (4.1)5 (2.3)0.342
Min. BMI [kg/m2] mean (SD)25.54 (5.59)25.85 (5.60)24.61 (5.47)0.009 *
Mean glucose [mmol/L] mean (SD)7.39 (2.72)7.47 (2.85)7.16 (2.27)0.173
Max. erythrocytes [g/L] mean (SD)4.12 (0.87)4.19 (0.85)3.91 (0.91)<0.001 *
Max. thrombocytes [109/L] mean (SD)238.37 (160.03)247.26 (169.65)211.61 (123.31)0.005 *
Min. INR mean (SD)1.15 (0.29)1.15 (0.32)1.14 (0.17)0.446
Mean ALT [IU/L] mean (SD)27.50 (15.83)26.05 (14.53)31.88 (18.57)<0.001 *
Min. ALP [IU/L] mean (SD)85.55 (31.60)82.92 (28.96)93.46 (37.64)<0.001 *
Mean sodium [mg/L] mean (SD)135.58 (10.17)135.43 (10.35)136.03 (9.62)0.455
Mean potassium [mg/L] mean (SD)4.00 (0.52)3.98 (0.46)4.07 (0.67)0.033 *
Max. eGFR [mL/min] mean (SD)81.56 (36.18)82.4 (32.58)78.93 (45.30)0.222
Hypertension (%)35 (4.1)28 (4.4)7 (3.3)0.618
Ischemic heart disease (%)15 (1.8)12 (1.9)3 (1.4)0.880
Pulmonary heart disease (%)9 (1.1)7 (1.1)2 (0.9)1.000
Diseases circulatory system (%)18 (2.1)14 (2.2)4 (1.9)1.000
Diabetes (%)17 (2.0)9 (1.4)8 (3.8)0.066
Obesity (%)12 (1.4)9 (1.4)3 (1.4)1.000
Other virus infections1 (0.1)0 (0.0)1 (0.5)0.563
ALT: alanine aminotransferase, ALP: alkaline phosphatase, eGFR: estimated glomerular filtration rate, INR: international normalized ratio. * statistically significant (p < 0.05).
Table 4. The metrics of the training and testing results for the different algorithms applied.
LogReg DT RF Knn AdaBoost
TrainingTestingTrainingTestingTrainingTestingTrainingTestingTrainingTesting
Renal function
Accuracy
(95% CI)
0.57
(0.53–0.61)
0.56
(0.48–0.63)
0.77
(0.74–0.81)
0.6 (0.52–0.67)0.69
(0.66–0.73)
0.62
(0.55–0.69)
0.68
(0.64–0.72)
0.65
(0.57–0.72)
0.98
(0.96–0.99)
0.73
(0.65–0.79)
Balanced Accuracy0.580.550.710.520.650.580.540.510.970.64
Sensitivity0.610.540.520.30.540.440.120.110.940.39
Specificity0.550.570.90.750.770.710.960.9110.9
F1 Score0.490.450.60.330.540.430.20.160.960.48
Hepatic function
Accuracy
(95% CI)
0.68
(0.65–0.72)
0.59
(0.51–0.67)
0.8
(0.77–0.83)
0.69
(0.62–0.76)
0.78
(0.74–0.81)
0.62
(0.54–0.69)
0.76
(0.73–0.79)
0.75
(0.68–0.81)
0.83
(0.8–0.86)
0.74
(0.67–0.8)
Balanced Accuracy0.680.550.650.50.730.530.550.520.690.55
Sensitivity0.660.480.350.120.630.360.110.070.40.17
Specificity0.690.630.960.880.830.70.980.980.980.93
F1 Score0.510.370.470.160.590.320.190.120.540.24
CI: confidence interval, DT: decision tree, Knn: k-nearest neighbor, LogReg: logistic regression.
Disclaimer/Publisher’s Note: The statements, opinions and data contained in all publications are solely those of the individual author(s) and contributor(s) and not of MDPI and/or the editor(s). MDPI and/or the editor(s) disclaim responsibility for any injury to people or property resulting from any ideas, methods, instructions or products referred to in the content.

