Article

Assessing the Intention to Use a First-Generation Vaccine against COVID-19 Using Quantile Regression: A Cross-Sectional Study in Spain

by
Jorge de Andrés-Sánchez
1,*,
Mario Arias-Oliva
2 and
Jorge Pelegrín-Borondo
3
1
Social and Business Research Laboratory, Business Management Department, Campus de Bellissens, Universitat Rovira i Virgili, 43204 Reus, Spain
2
Management and Marketing Department, Faculty of Economics and Business, UCM, Campus de Somosaguas, Complutense University of Madrid, 28223 Madrid, Spain
3
Department of Economics and Business, University of La Rioja, Edificio Quintiliano, C/La Cigüeña 60, 26006 Logroño, Spain
*
Author to whom correspondence should be addressed.
COVID 2024, 4(8), 1211-1226; https://doi.org/10.3390/covid4080086
Submission received: 18 June 2024 / Revised: 1 August 2024 / Accepted: 3 August 2024 / Published: 5 August 2024

Abstract

:
Understanding the factors that influence the intention to use vaccines is crucial for implementing effective public health policies. This study examined the impact of various cognitive, affective, normative, and sociodemographic variables on the intention to be vaccinated against COVID-19 with the first-generation AstraZeneca vaccine. A survey of 600 residents of Spain was used to assess the influence and hierarchy of the drivers of the intention to vaccinate via least-squares and quantile regressions. The most significant factors were the perceptions of efficacy and social influence, both of which had positive impacts (p < 0.0001). The positive influence of fear of COVID-19 and the negative influence of fear of the vaccine were also significant in shaping the central tendency toward vaccination. However, these fear-related variables, particularly the fear of COVID-19, lost importance in quantile adjustments outside the central tendency. Among the sociodemographic variables, only the negative impact of income was statistically significant. These results are valuable for the development of vaccination policies because they measure the sensitivity of attitudes toward vaccination to exogenous variables not only in the central values, as is common in similar studies, but also across the entire range of responses regarding the intention to vaccinate. This additional analysis, which is not commonly performed in studies on vaccine acceptance, allows us to distinguish between variables which are consistently related to the intention to vaccinate and those that influence only expected responses.

1. Introduction

COVID-19 cases and deaths have continued unabated since the pandemic caused by severe acute respiratory syndrome coronavirus 2 (SARS-CoV-2) began in late 2019. As of November 2021, the number of people affected worldwide has surpassed 251 million, with over 5.07 million confirmed deaths across 216 countries, areas, and territories [1]. By June 2024, the number of affected individuals had risen to 775 million, resulting in more than 7 million deaths. The impact of the pandemic has extended beyond its impact on human health [1]. A significant portion of economic projections indicate that most countries will experience lower economic growth than expected before the pandemic for several years [2].
The most effective way to return to pre-pandemic conditions and embark on a sustained path of economic recovery is to control the spread of the virus with effective treatments and vaccines. Without these tools, restrictive measures on gatherings and movements were the only effective means to limit COVID-19 transmission. Unfortunately, these measures have hindered economic development [2] and caused social and familial collateral damage [3]. These reasons explain why, in an exceptionally short period (practically one year after the identification of SARS-CoV-2), the first vaccines were fully developed and ready for use in many countries. By June 2021, there were more than 125 vaccine candidates worldwide, 365 ongoing vaccine trials, and 18 COVID-19 vaccines approved in at least one country [4].
Given the importance of vaccines in controlling any pandemic, including that caused by SARS-CoV-2, identifying the factors which determine their intention to use and quantify their impact is crucial for effective health policies [4]. Searches conducted in Scopus indicate that this issue will remain a hot topic in 2024, although COVID-19 would cease to become a global health emergency by 2023. On 17 June 2024, a search for ‘COVID-19 AND vaccine AND factors AND hesitancy’ yielded 2950 documents. Specifically, 1087 scientific documents would be published by 2022, 921 by 2023, and 313 by 2024. Similarly, exploring ‘COVID-19 AND vaccine AND factors AND acceptance’ returned 626 documents in 2022, 463 in 2023, and 132 in 2024. Although these results could be further refined, we believe that they are sufficiently indicative.
This study evaluated the factors which induce the intention to use or reject the COVID-19 vaccine through an analysis of a survey in Spain, ranking these factors accordingly. The first group of variables commonly evaluated in the literature relates to the perception of vaccine effectiveness and risk, the perceived severity of COVID-19, and social influence on vaccination [5]. These variables were modeled in this study via the cognitive-affective-normative (CAN) psychometric model [6], which has been applied in the context of SARS-CoV-2 vaccination [7]. Additionally, we assessed sociodemographic factors such as sex, income, and age, which are also commonly evaluated in studies such as ours [5].
The novelty of this study lies in the use of quantile regression (QR), whose application in the social sciences was proposed in the seminal work by Koenker and Basset [8] as a complement to regression focused on predicting the expected response, which is often used in this type of analysis. QR offers robust statistical estimates which ordinary least squares regression (OLS) does not provide when the assumptions of normality and homoscedasticity of errors are violated. Moreover, quantile regression is less sensitive to outliers [8]. QR allows us to describe not only how the explanatory factors impact the response variable near the central distribution values but also at the minimum and maximum responses. Thus, QR provides a more comprehensive picture of the relationships between variables than methods focused on predicting the expected response, such as OLS, logistic regression, or Poisson regression [9], allowing us to determine not only which variables are relevant for explaining the central tendency of the response variable but also whether the evaluated factors influence responses outside the central tendency. We believe this aspect is crucial for obtaining a more complete understanding of the determinants of attitudes toward vaccination, as QR will enable us to not only establish which factors are relevant but also rank their importance.
In OLS regression, which only fits the mean of the response variable, we observed that perceived efficacy, social influence, and fear (both of the vaccine and of COVID-19) were statistically significant in explaining the intention to get vaccinated. Additionally, among the socioeconomic variables analyzed—sex, age, and monthly income—only the negative relationship between income and the intention to use the vaccine was relevant. However, this analysis did not allow us to determine which variables consistently influenced all possible responses for a set of input factor values.
The use of quantile regression allowed us to obtain more insightful conclusions about how the assessed explanatory factors were linked with vaccine acceptance. While the relationship between efficacy and social influence was significant across the entire range of vaccination intention responses (not just at the central values), this was not the case for variables related to fear, especially that related to COVID-19. In response to vaccine acceptance, which was far from the central values, these variables may not be significant. Therefore, we can conclude that while the perception of efficacy and social influence consistently influence any respondent, the variables associated with fear have less or even no relevance in people whose interest in getting vaccinated is far from the expected level, and thus they are less relevant in explaining the intention to get vaccinated. Similarly, with respect to the socioeconomic variables, we found that while monthly income is significant in explaining some percentiles of the response variable, it is not significant for all. Thus, this link is not entirely consistent. In contrast, both gender and age consistently had no statistically significant effect on the intention to get vaccinated.
The remainder of this paper is organized as follows. Section 2 presents the theoretical background of the explanatory factors used in this study. Section 3 describes the materials and methods used in this study. The results are presented in Section 4. Finally, we discuss our findings.

2. Theoretical Groundwork

2.1. Previous Considerations

The cognitive-affective-normative (CAN) model posits that the intention to use new health technology can be explained by cognitive, affective, and normative factors [6,10]. This theoretical framework has been applied to evaluate the factors which induce the intention to use new medical technologies such as brain implants [6] and COVID-19 vaccines [7,11]. Specifically, Pelegrín-Borondo et al. [7] evaluated the impact of affective variables, such as fear of contracting COVID-19 (FCOVID) and fear of the vaccine (FVAC), where the cognitive factor was perceived efficacy (EFFIC) and the normative variable was social influence (SOCINF) on the intention to get vaccinated (IVAC).
The use of this group of variables aligns with the findings of numerous studies evaluating the intention to receive the COVID-19 vaccine, in which the factors commonly reported as relevant for explaining attitudes toward vaccination are related to the perception of the vaccine, attitudes and beliefs about COVID-19, and informants regarding COVID-19 and its vaccines [5]. Figure 1 shows the proposed framework for explaining the intention to use the COVID-19 vaccine.

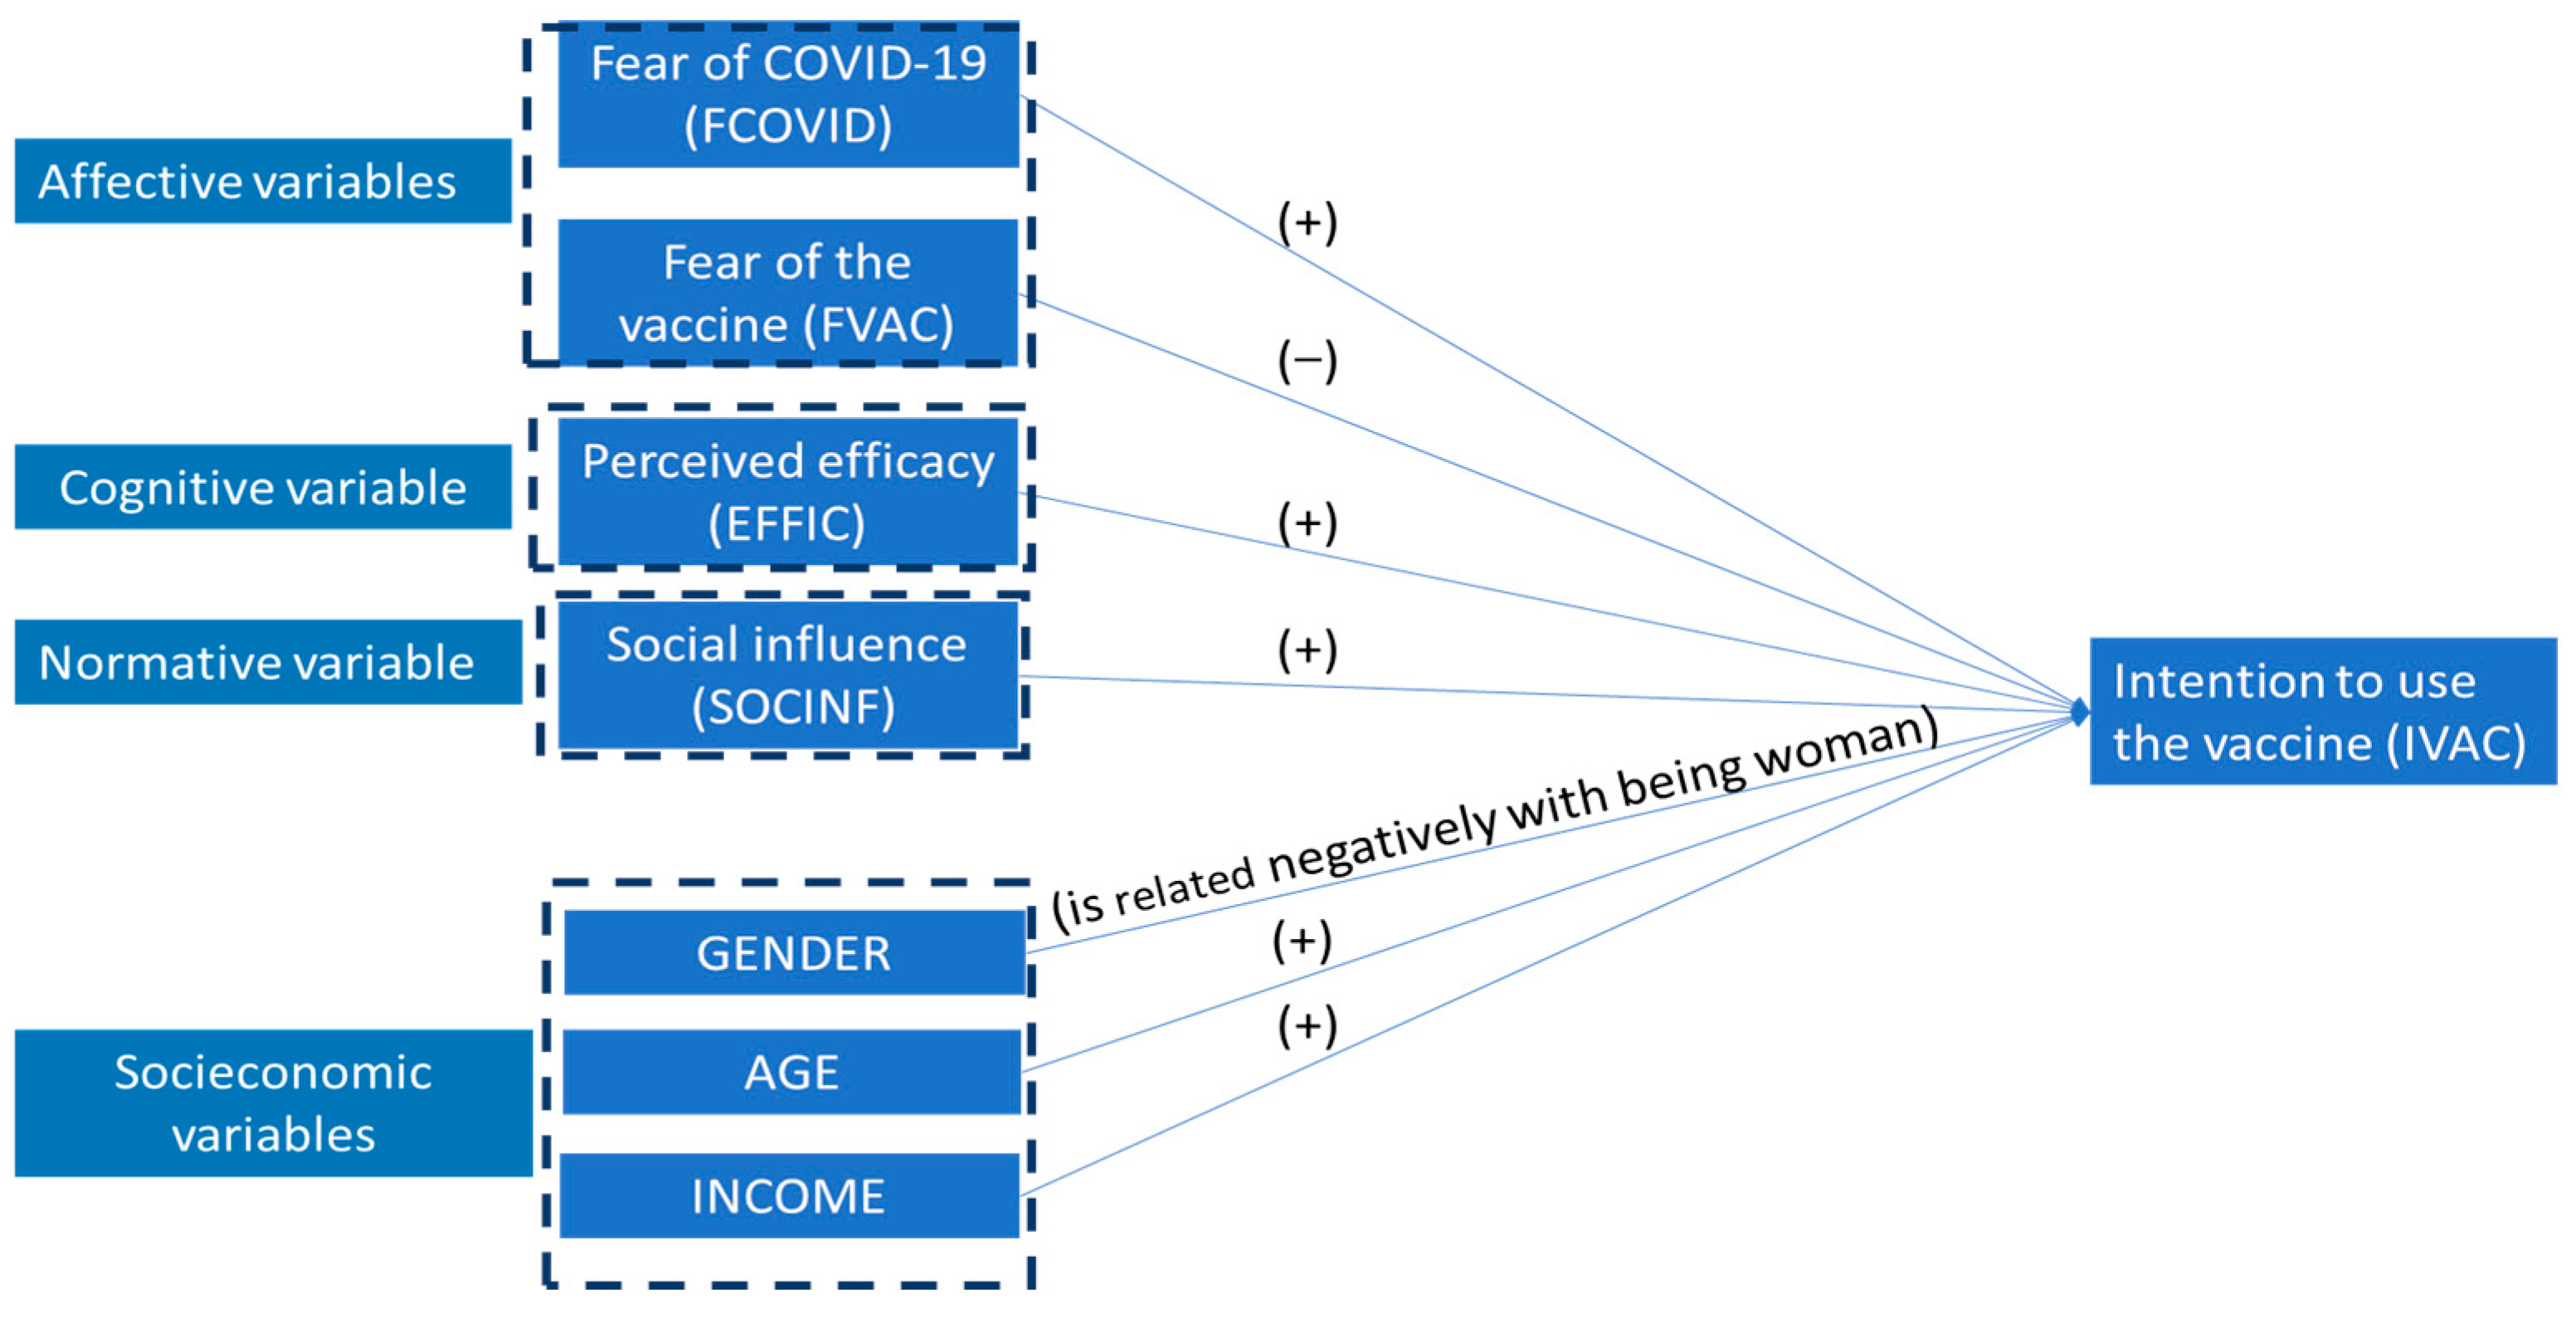
2.2. Affective and Cognitive Variables

A key variable in explaining the intention to be vaccinated against a given illness is fear of its consequences [12]. Therefore, perceiving COVID-19 as a potentially severe illness increases the willingness to use a vaccine and reduces hesitancy [7,13,14,15,16,17,18]. Conversely, many people perceive any vaccine as potentially risky, owing to possible side effects; consequently, this fear stimulates vaccine hesitancy [12,19,20]. The literature widely reports that this variable is also significant in explaining rejection of the COVID-19 vaccine [7,11,17,21,22,23,24,25].
The efficacy of vaccines is an important factor in motivating people to accept them [26]. In fact, attitudes toward any vaccine can be negatively affected if the perceived efficacy is low [27]. In the context of SARS-CoV-2, the importance of EFFIC has been demonstrated across different groups and countries [7,11,13,15,17,22,25,28,29,30].

2.3. Normative Variable: Social Influence

When people belong to social groups, the opinions of other group members about a product can encourage or discourage its consumption [10]. In the vaccination context, this influence remains true [31,32] and, consequently, can be extended to SARS-CoV-2 vaccines [7,11,18,25,28,33]. Recommendations from doctors, health providers, and institutions are expected to have a strong positive effect on people’s intention to be vaccinated. Trusting doctors’ recommendations to receive influenza vaccines has the greatest impact on acceptance [34]. This finding can also be extrapolated to the opinions of physicians and health providers regarding COVID-19 [16,30,35].
A positive attitude toward vaccination is also linked to trust in the government and opinion leaders [14,17,36]. On the other hand, misinformation [37] and conservative political ideologies tend to inhibit the intention to be vaccinated against COVID-19 [37]. It has also been reported that the spread of conspiracy theories [24,38] has a significantly positive influence on vaccination hesitancy.

2.4. Socioeconomic Variables

In addition to the CAN variables, we considered three control factors which are quite common sociodemographic variables in studies, such as sex, age, and income level [5]. With respect to sex (SEX), the main findings showed that being female (male) could be significantly related to rejection (intention to use) of vaccination [15,16,18,21,22,23,39,40,41,42]. This could be because men are more likely to become seriously ill and die from COVID-19 [43] and because of a plausible link between menstrual disturbances and vaccination [44]. However, it should be noted that a significant number of reports did not find a significant relationship between sex and attitudes toward vaccination [11,13,14,17,33] or even a positive relationship between vaccine use and being female [36].
Age (AGE) is often a relevant variable for explaining attitudes toward COVID-19 vaccination [5]. However, no clear pattern has been reported in the literature. Various reports have shown a positive relationship between age and the intention to be vaccinated [14,35,38,39,40,41,42]. A reasonable argument is that the risk of severe illness and death increases with age [45]. However, some studies have shown that age is negatively associated with the intention to be vaccinated [13,15,17,21,23]. Notably, a set of studies suggested that the relationship between age and the intention to use a vaccine follows a “U” shape; that is, vaccine hesitancy is found among middle-aged individuals [17,18,22].
A significant portion of the literature suggests a possible influence of income level (INCOME) on attitudes toward vaccination. If the cost of vaccination must be financed individually, it is reasonable to assume that income level has a positive link with the willingness to be vaccinated [14,15,22,36,40,42]. However, some studies have shown that income level has a nonsignificant effect on the intention to receive a vaccine [11,23,33].
On the basis of the information presented in this section, Figure 1 summarizes the relationships between the exogenous and endogenous variables analyzed in this study and the expected direction of the relationship between them.

3. Materials and Methods

3.1. Sample and Sampling

This study analyzed a self-administered online survey conducted via Google Forms. Responses were collected from residents in Spain between 9 September 2020 and 16 September 2020.
The study population comprised individuals residing in Spain. The participants were contacted through digital means in an effort to ensure that the number of responses met the sex quotas (at least 40% men and women) and age quotas. Specifically, there were equal numbers of participants in the 17–30 years old, 31–50 years old, and >50 years old age groups.
As a secondary criterion, we sought to ensure that the distribution of responses across the different autonomous communities into which Spain is divided had some correlation with their share of the total Spanish population. In this way, responses were obtained from predominantly urban regions as well as from those whose economies are based on agricultural or livestock activities.
From the total number of responses received (827), the first 600 who met the sex and age quotas were selected. Among the unused responses, the first group contained at least one incomplete item, either left blank voluntarily or involuntarily (87). These items, in addition to those linked to the CAN model, more commonly included personal income. Additionally, we discarded 56 items which failed to meet two attention check items designed to ensure respondent attentiveness. Finally, we discarded 84 responses from those who unbalanced the proposed age and sex quotas; these responses came from persons under the age of 50 or females. Thus, the final sample of 600 responses adhered to the proposed quotas.
The sample size (N = 600), although not excessive, was believed to be adequate, providing a good balance between resource constraints and a size which ensured statistically reliable results. We used two widely accepted statistical criteria to make this judgment: a priori power analysis and analysis of the minimum detectable effect sizes [46]. In these assessments, we considered that the regression analyses would be conducted with 7 exogenous variables, as shown in Figure 1:
  • A common criterion is the completion of an a priori power analysis (β) for a predefined significance level (α), used to reject the null hypothesis that the proposed regression or the coefficient of interest is not significant [46]. This analysis was performed with the software GPower 3.1 [47]. Thus, we confirmed that this sample size ensured that the statistical power for testing both the overall significance of the model and the significance of the individual coefficients exceeded 99% at the 5% significance level.
  • Second, with the software GPower 3.1, we found that the sample size was sufficient for analyzing small effect sizes (greater than 0.05). For a predefined statistical power level of β = 85% and a statistical significance level of α = 5%, the sample size was suitable for effect sizes of 0.021 for the coefficients and 0.036 for the overall regression model.
Table 1 shows the sample profile. A total of 45% (269) of the respondents were men, and 55% (331) were women. The average age of the respondents was 41.97 years, with a standard deviation of 15.52 years. The age distribution was 33.33% for those up to 30 years old, 32.83% for those between 31 and 50 years old, and 33.83% for those over 50 years old. The distribution of incomes shows that 24.83% reported a monthly income greater than EUR 3000, 13% reported between EUR 2500 and 3000, 25% reported between EUR 1750 and 2500, 22.33% reported between EUR 1000 and 1750, and 6.33% reported less than EUR 1000.
Regarding education level, nearly 57% reported having a university degree, 34.39% had secondary education, and the remaining 9.02% had primary school education. With respect to the geographical distribution of responses, we can observe that they were diversified across the various regions which make up Spain, with the most populated regions, such as Catalonia, accumulating the largest proportion of responses, whereas the least populated areas, such as the islands (Balearic and Canary Islands) or Ceuta and Melilla, were represented the least. Additionally, the sample included both predominantly urban areas like Madrid as well as those with economies based on the agricultural and livestock sectors, such as the center of Spain (Castilla and León, Castilla-la Mancha, and La Rioja) and regions with highly diversified rural and urban environments (Catalonia).

3.2. Measurement of Variables

The questionnaire was redacted in Spanish. All the questionnaire items were answered on an 11 point Likert scale (0–10), as shown in Table 2. The descriptive statistics of the responses are shown in Table 3. Regarding the response variable of the intention to vaccinate (IVAC), the questions focused on the vaccine developed by AstraZeneca. According to the news in September 2020, it was the most advanced and likely to be used vaccine in Spain. We started the survey immediately after the trials for the Oxford-AstraZeneca vaccine were temporarily suspended because of a “serious adverse event” in one volunteer. Therefore, the survey was as follows: “Imagine that the COVID-19 vaccine currently being developed by the University of Oxford and AstraZeneca is the first vaccine approved by the European Union health authority after adverse effects have been addressed. Please note that the trials for this vaccine were suspended on September 9, following a report of a ‘serious adverse event’ in a volunteer. Please respond to the following questions on a scale from 0 (strongly disagree) to 10 (strongly agree)”.
IVAC was measured via the scale proposed by Venkatesh et al. [48] to quantify behavioral intention toward new technologies. The cognitive variable related to perceived efficacy was measured using the scale developed by Remschmidt et al. [49], which has been widely used in the context of vaccination [7,11,50]. The fear of contracting COVID-19 was measured with the scale from Nguyen et al. [12], whereas the FVAC was modeled via the scale from Borena et al. [51]. Finally, SOCINF was measured using questions proposed by Venkatesh et al. [48].
Table 2. Items used in this paper.
VariableItemSource
Intention to use AstraZeneca vaccine (IVAC)IVAC1. I will try to get vaccinated with the Oxford-AstraZeneca vaccine.
IVAC2. I will use the Oxford-AstraZeneca vaccine.
Based on [48]
Fear of COVID-19 (FCOVID)FCOVID1: I will use the Oxford-AstraZeneca vaccine.
FCOVID2. I am worried about transmitting COVID-19.
Based on [12]
Fear of AstraZeneca vaccine (FVAC)FVAC1. I am worried about the temporary effects of the COVID-19 vaccine.
FVAC2. I am worried about the permanent effects of the COVID-19 vaccine.
Based on [51]
Perceived efficacy (EFFIC)EFFIC1. I am convinced of the efficacy of the Oxford vaccine.
EFFIC2. The Oxford vaccine will protect me from COVID-19.
EFFIC3. With the Oxford vaccine, I have a lower probability of contracting COVID-19.
EFFIC4. The Oxford vaccine will prevent me from needing other treatments for COVID-19.
Based on [49,50]
Social influence (SOCINF)SOCINF1. People who are important to me think I should use the Oxford vaccine.
SOCINF2. People who influence me think I should use the Oxford vaccine.
SOCINF3. People whose opinions I value think I should use the Oxford vaccine.
Based on [48]
SEXDichotomous variable coded 0 for men and 1 for women.
AGEVariable coded 0 for those under 40 years old and 1 for those over 60 years old. For those between 40 and 60 years old, it is linearly graduated in the interval [0, 1].
Net monthly income (INCOME)Variable ranging from 0 (for monthly income less than EUR 1000) to 1 (for monthly income greater than EUR 3000). Between these income levels, it is linearly graduated.
Table 3. Descriptive statistics of items related to the response variable, CAN explanatory variables, and measures of internal consistency and convergent reliability of all the constructs.
ItemMeanSDFactor
Loading
CACRAVE
Intention to be vaccinated (IVAC) 0.950.950.90
IVAC15.073.480.95
IVAC24.963.40.95
Fear of COVID (FCOVID) 0.7340.8830.799
FCOVID16.602.720.889
FCOVID27.862.740.889
Fear of vaccine (FVAC) 0.920.9610.926
FVAC16.753.020.962
FVAC27.233.040.962
Efficacy (EFFIC) 0.9330.9530.836
EFFIC14.932.810.920
EFFIC25.312.800.950
EFFIC35.952.970.935
EFFIC44.892.940.849
Social influence (SOCINF) 0.9710.9810.945
SOCINF14.852.950.964
SOCINF24.642.950.979
SOCINF34.683.030.974
Note: SD = standard deviation; CA = Cronbach’s alpha; CR = convergent reliability; AVE = average variance extracted.

3.3. Data Analysis

Data analysis was performed by implementing the following steps.
  • First step. We verified the internal consistency and convergent validity of the scales used for the IVAC and CAN variables (FCOVID, FVAC, EFFIC, and SOCINF) using standard measures: Cronbach’s alpha (CA), convergent reliability (CR), average variance extracted (AVE), and factor loading.
  • Second step. We quantified the variables involved in our analysis as follows:
    • IVAC, FCOVID, FVAC, EFFIC, and SOCINF were quantified as the standardized scores obtained via factor analysis.
    • SEX was a dummy variable which took a value of 1 if the observation came from a woman and was 0 otherwise.
    • AGE: We based our approach on the fact that the probability of suffering a severe illness or even death due to contracting SARS-CoV-2 increases with age in individuals older than 40 years [45]. Therefore, we transformed age into a value in the interval [0, 1] as follows:
    • A G E ( x ) = 0   x 40   years x 40 25 40 < x 65   years , 1   otherwise
    • Here, x is the age (in years) of the surveyed person.
    • INCOME was obtained by transforming the categories in Figure 1 into a value within the [0, 1] interval:
    • I N C O M E ( y ) = 1   y 3000 0.8 2500 y > 3000 0.5 1750 y > 2500 0.2 1000 y > 1750 0   otherwise
    • Here, y is the monthly income.
  • Third step. We fitted a linear regression to IVAC via OLS, which was explained by FVAC, FCOVID, EFFIC, SOCINF, SEX, AGE and INCOME:
    IVAC = a0 + a1 × FVAC + a2 × FCOVID + a3 × EFFIC + a4 × SOCINF + a5 × SEX + a6 × AGE + a7 × INCOME
We also performed tests to verify compliance with the conditions of homoscedasticity and normality of the error term necessary for the OLS estimation to be robust.
  • Fourth step. We estimated the same quantile regression model as in the third step for various probability levels: τ = 0.2, 0.25, 0.3, 0.45, 0.5, 0.55, 0.7, 0.75, and 0.8. This allowed us to assess the influence of the variables near the central positions of the intention to use the vaccine for τ = 0.45, 0.5, and 0.55 and to evaluate the influence of the factors on responses which showed strong rejection (intention to use) compared with the central tendency for τ = 0.2, 0.25, and 0.3 (τ = 0.7, 0.75, and 0.8).

4. Results

The results corresponding to validation of the scales (Table 3) show that all the constructs had a Cronbach’s alpha and composite reliability >0.7 and an average variance extracted >0.5. In addition, the factor loadings of all the items in the first principal component were >0.7. Therefore, we have robust evidence of the internal consistency of IVAC, FCOVID, FVAC, EFFICACY, and SOCINF. Thus, it is reasonable to consider the standardized factor scores of these variables as observations in the following steps [52].
Table 4 presents the OLS fit results. We obtained significant positive coefficients in the regressions (CR) for the CAN variables FCOVID (CR = 0.07436, p = 0.0024), EFFIC (CR = 0.5227, p < 0.0001), and SOCINF (CR = 0.3484, p < 0.001). We also found a significant negative relationship between IVAC and FVAC (CR = −0.0984, p < 0.0001) and between IVAC and INCOME (CR = −0.1379, p = 0.0142). AGE (CR = 0.0293, p = 0.6435) and SEX (CR = 0.0049, p = 0.9102) were not relevant for explaining IVAC. The estimated model was significant (adjusted R-squared = 0.7456, Snedecor’s F = 250.21, p < 0.0001). However, the fit violated the assumptions of homoscedasticity and normality of residuals. The White test rejected the presence of homoscedasticity (p < 0.0001), and the chi-squared test rejected the normality of the residuals (p = 0.0015). These results support the ability to test a method that is robust to the absence of homoscedasticity and the normality of errors, such as quantile regression.
The results of the IVAC adjustment near the other central trend, the median, provided in Table 5, yielded results similar to those of the OLS estimation but with nuances. The CAN variables were the most relevant ones, while the sociodemographic variables, including INCOME, were not statistically significant. Thus, the positive relationship between EFFIC and SOCINF and the negative relationship between FVAC and IVAC were consistently highly significant (p < 0.01). Additionally, FCOVID lost explanatory power, as its positive impact was significant only at the p < 0.01 level in the regression conducted for τ = 0.45 and was not significant at conventional statistical levels for τ = 0.55.
Regarding the quantile regressions at τ = 0.2, 0.25, and 0.3 (i.e., lower quantiles of IVAC), Table 6 shows that FVAC, EFFIC, and SOCINF consistently had a significant impact (p < 0.01) with the expected sign across all τ levels. Additionally, FCOVID (INCOME) was positively (negatively) related to IVAC, although with weaker levels of significance. For fear of COVID-19, the statistical results were τ = 0.2 (CR = 0.0730, p = 0.0658), τ = 0.25 (CR = 0.0863, p = 0.0023), and τ = 0.3 (CR = 0.0485, p = 0.0402). Regarding INCOME, we observe that its significance depended on the percentile. When τ = 0.2, it was significant (CR = −0.2295, p = 0.0128), but when τ = 0.25 (CR = −0.1242, p = 0.0577), τ = 0.3 (CR = −0.1006, p = 0.0667) was not significant. Finally, the associations of age and sex with IVAC were not significant at conventional levels.
Referring to the regressions adjusted at the upper quantiles (τ = 0.7, 0.75, 0.8), Table 7 shows that only EFFIC and SOCINF consistently had a significant impact (p < 0.0001), with the expected sign across all τ levels. Compared with the adjustments made at τ levels near the median or lower quantiles, the significance of FVAC decreased. Thus, FVAC was significant only at conventional levels for the adjustments made at τ = 0.7 (CR = −0.0263, p = 0.0128) and τ = 0.8 (CR = −0.0547, p = 0.0147). Finally, INCOME was negatively related to IVAC at all levels but was statistically significant only at τ = 0.7 (CR = −0.1022, p = 0.0455). In addition to AGE and SEX, fear of contracting COVID-19 ceased to be significant at all the adjusted regression levels.
The overall result of the quantile adjustments, measured by Koenker and Machado’s pseudo-R2 [53], yielded values consistently above 55%, which indicates results which were satisfactory but inferior to those obtained with ordinary least squares regression.
Figure 2 shows the value and significance of the coefficients of the explanatory variables in the OLS estimation and in the quantile regressions at the 0.2, 0.5, and 0.75 levels. The results provide a much more comprehensive view than other regression methods, such as OLS, Poisson regression, or logistic regression. Thus, we can observe the following.
Perceived efficacy and social influence were always significant at p < 0.0001, regardless of whether we evaluated responses situated at central values (OLS and QR at τ = 0.5) or at percentiles substantially below or above those values (QR at τ = 0.2, τ = 0.75). On the other hand, neither SEX nor AGE were consistently significant in explaining IVAC.
In contrast, the affective variables related to fear of COVID-19 and vaccine effects were not necessarily relevant across the range of intention to use. Both FCOVID and FVAC were significant at central values. However, extreme responses lost significance, especially for FCOVID. This variable did not have a significant influence on the intention to use the vaccine in either the QR τ = 0.2 or the estimate for τ = 0.75.
Among the sociodemographic variables, only income level had a significant relationship with the intention to use. However, this relationship was not consistent across the entire range of responses regarding the intention to get vaccinated.

5. Discussion

This study examined the explanatory power of cognitive-affective-normative (CAN) theory in predicting the intention to receive the AstraZeneca vaccine. Statistical analysis was conducted via ordinary least squares (OLS) and quantile regression (QR). We observed that the OLS regression provided a good fit for the intention to receive the AstraZeneca vaccine (IVAC) (R2 = 74.56%). All cognitive-affective-normative (CAN) variables—fear of SARS-CoV-2 (FCOVID), fear of the vaccine (FVACC), perceived efficacy (EFFIC), and social influence (SOCINF)—were significant in explaining IVAC. Moreover, the direction of their relationship with IVAC was as expected. Among the sociodemographic variables, only income level (INCOME) showed a significant relationship with IVAC but not in the expected direction.
The significant positive relationship between FCOVID-19 and IVAC aligns with the majority of the reviewed reports [7,13,14,15,16,17,18]. The significant negative relationship between FVACC and IVAC is supported by much of the literature, which shows similar results regarding the influence of fear and perceived risk related to the COVID-19 vaccine [7,11,17,21,22,23,24,25]. As expected, our results revealed a significant positive influence of EFFIC on IVAC, which is consistent with the literature [7,11,12,13,15,17,18,24,25,29,30]. With respect to the SOCINF variable, the significant positive relationship also matched the literature [7,11,18,25,28,33].
Regarding sociodemographic variables, we found that sex did not have a significant relationship with the intention to vaccinate, which contradicts the main trend of reports which tend to observe greater resistance among women. However, this result is not an exception, as there is a significant number of reports along this line [11,13,14,33,35]. Additionally, we did not find a significant relationship between age and IVAC. However, the literature does not provide clear results regarding the relationship between AGE and IVAC. Surprisingly, we obtained a significant negative relationship between INCOME and IVAC, despite the literature usually observing a positive link [14,15,22,35,36,40]. This could be because Spain has a public healthcare system with extensive coverage, which makes vaccination virtually free for individuals. Additionally, the consequences of contracting SARS-CoV-2 may be perceived as more severe by people with lower incomes. For example, quarantine may occur under poorer conditions (smaller houses), or their job contracts may result in less illness coverage. These findings align with those indicating that, in Spain, fear of contracting COVID-19 is negatively related to income level [54].
The reviewed literature predominantly employed regression methods which adjusted only the expected value of the response variable for a given level of the exogenous variables. The most common method was logistic regression [12,13,16,19,26,27,31,33,39,40,51]. Other methods used include Poisson regression [12,23,24,38], structural equation modeling [7,28,37,50], and OLS [19,29,32]. Thus, the assessment of the significance of explanatory factors in these studies was binary (significant or not significant) and linked only to the expected response instead of the entire range of possible values. In our study, the use of OLS led us to conclude that, with the exception of sex and age, all the assessed explanatory variables were significant.
However, OLS did not capture whether the variables identified as significant for explaining the expected response consistently explained the entire possible range of the degree of intention to be vaccinated or only a portion. Additionally, the results from OLS did not reveal the main determinants of the degree of intention to use which were under the expected level. These responses are also of great interest because they are related to higher-than-expected vaccine hesitancy. To the best of our knowledge, these types of analyses were not conducted in the reviewed literature.
QR provides a complementary perspective to OLS estimation of the relationships of CAN variables and sociodemographic factors with IVAC. This approach allowed us to prioritize the significance of the evaluated factors on the basis of their consistency in explaining the entire range of the response variable. We observed that not all CAN variables were equally relevant in explaining attitudes toward vaccination. Although perceptions of efficacy and social influence were always highly significant across all quantiles (p < 0.0001), this assertion could not be extended to the fear of contracting COVID-19 or the perceived risk of the vaccine on the basis of regressions associated with the lower and upper quantiles. Specifically, the fear of contracting COVID-19 lost significance in the lower percentiles compared with the adjustments near the median of IVAC and did not have a significant effect on IVAC in the adjustments for τ = 0.7, 0.75, and 0.8. Similarly, the negative impact of fear of the vaccine also lost explanatory power in the noncentral quantiles, particularly in the upper quantiles, compared with that recorded near the central tendency of the IVAC.
Compared with the CAN variables, the sociodemographic variables tested in this study exhibited much lower explanatory power. Neither SEX nor AGE had a significant effect on IVAC. QR analysis revealed that this lack of significance was consistent across all IVAC outcomes. Income was negatively associated with all quantiles of the IVAC response. However, this association was statistically significant only in some of the lower and upper quantiles but not near the median.
Given that quantile regression analysis of the variables inducing the intention to use a COVID-19 first-generation vaccine has not previously been conducted, we believe that these results are highly valuable for specific vaccination issues. Unlike more common studies on epidemic diseases (e.g., influenza) and widely tested vaccines, this study focused on first-generation COVID-19 vaccines, in which both the disease and vaccines were completely new.
These findings have potential implications for public health policies related to the implementation of new vaccines during pandemics. While EFFIC and SOCINF appeared to be the most relevant variables explaining the intention to vaccinate and symmetrically impact all quantiles of the response variable, fear of COVID-19 and the vaccine lost explanatory power in attitudes toward vaccination which deviated from the central tendency, especially in those showing an unexpected favorable attitude. Thus, contrary to the reviewed literature, which only differentiates between significant and nonsignificant factors, this work distinguished between primary variables (efficacy and social influence) and secondary factors (those linked to fear) among the explanatory factors.
Therefore, public policies aimed at encouraging vaccination should emphasize the efficacy of vaccines and normative variables. For example, the requirement for an immunity passport against COVID-19, which was established in many countries to enjoy certain activities or greater mobility, should be understood as a health measure aimed at increasing vaccination through social influence. The success of this measure in boosting vaccination rates [55] aligns with the importance of social influence on the intention to vaccinate, as observed in our sample. Conversely, reports indicating the reduced efficacy of existing vaccines against new SARS-CoV-2 variants, such as Omicron [56], would negatively impact the intention to vaccinate, whether the predisposition is low, average, or high. In contrast, although the fear of the disease and the effects of the vaccine are also relevant, they are much less relevant than the perceived efficacy of the vaccines.
This study was conducted in Spain at a particular time (September 2020). Notably, pandemics and vaccine development have continuously evolved. For example, the “Oxford AstraZeneca” vaccine had already been administered, but trials were suspended at the time of the survey. Additionally, attitudes toward vaccination vary significantly across countries, even within the same geographic area [15,16,57,58]. For example, while nearly 100% of the population in Nepal expressed a willingness to receive a vaccine, in Russia, this proportion was approximately 30% [58]. This variation also occurs in homogeneous geographical areas with a common vaccination policy, such as the European Union, where four COVID-19 vaccines have been available since mid-2021. Paradoxically, the percentage of the European population fully vaccinated with what can be termed “first-generation” vaccines by the end of October 2021 ranged from 88% (Portugal) to 24% (Romania) [59]. Therefore, to gain a more comprehensive perspective, further research using samples from other countries and periods is needed.

Author Contributions

Conceptualization, J.d.A.-S., M.A.-O. and J.P.-B.; data curation, M.A.-O. and J.P.-B.; formal analysis, J.d.A.-S.; investigation, M.A.-O. and J.P.-B.; methodology, J.d.A.-S.; project administration, M.A.-O.; resources, J.d.A.-S., M.A.-O. and J.P.-B.; software, J.d.A.-S.; supervision, M.A.-O.; validation, J.P.-B.; visualization, J.d.A.-S.; writing—original draft, J.d.A.-S.; writing—review and editing, J.d.A.-S., M.A.-O. and J.P.-B. All authors have read and agreed to the published version of the manuscript.

Funding

This study received no external funding.

Institutional Review Board Statement

(1) All participants received detailed written information about the study and procedure; (2) no data directly or indirectly related to the health of the subjects were collected, and therefore, the Declaration of Helsinki was not mentioned when informing the participants; (3) anonymity of the collected data was ensured at all times; (4) this study was approved by the Ethical Committee of Rovira i Virgili University (CEIPSA-2021-PR-0042).

Informed Consent Statement

Informed consent was obtained from all subjects involved in this study.

Data Availability Statement

The raw data supporting the conclusions of this article will be made available by the authors upon request.

Conflicts of Interest

The authors declare no conflicts of interest.

References

  1. OMS. Coronavirus Disease COVID-19. 2021. Available online: https://www.who.int/emergencies/diseases/novel-coronavirus-2019 (accessed on 3 June 2024).
  2. World Bank Global Economic Prospects. January 2021. Available online: https://www.worldbank.org/en/publication/global-economic-prospects (accessed on 3 June 2024).
  3. Massó-Guijarro, E. Infancia y pandemia: Crónica de una ausencia anunciada. Salud Colect. 2021, 17, e3303. [Google Scholar] [CrossRef] [PubMed]
  4. Machingaidze, S.; Wiysonge, C.S. Understanding COVID-19 vaccine hesitancy. Nat. Med. 2021, 27, 1338–1339. [Google Scholar] [CrossRef]
  5. Nehal, K.R.; Steendam, L.M.; Campos Ponce, M.; van der Hoeven, M.; Smit, G.S.A. Worldwide Vaccination Willingness for COVID-19: A Systematic Review and Meta-Analysis. Vaccines 2021, 9, 1071. [Google Scholar] [CrossRef] [PubMed]
  6. Pelegrín-Borondo, J.; Reinares-Lara, E.; Olarte-Pascual, C.; Garcia-Sierra, M. Assessing the moderating effect of the end user in consumer behavior: The acceptance of technological implants to increase innate human capacities. Front. Psychol. 2016, 7, 132. [Google Scholar] [CrossRef]
  7. Pelegrín-Borondo, J.; Arias-Oliva, M.; Almahameed, A.A.; Román, M.P. Covid-19 Vaccines: A Model of Acceptance Behavior in the Healthcare Sector. Eur. Res. Manag. Bus. Econ. 2021, 27, 100171. [Google Scholar] [CrossRef]
  8. Koenker, R.; Bassett, G., Jr. Regression quantiles. Econometrica 1978, 46, 33–50. [Google Scholar] [CrossRef]
  9. Cade, B.S.; Noon, B.R. A gentle introduction to quantile regression for ecologists. Front. Ecol. Environ. 2003, 1, 412–420. [Google Scholar] [CrossRef]
  10. Venkatesh, V.; Morris, M.G.; Davis, G.B.; Davis, F.D. User Acceptance of Information Technology: Toward a Unified View. MIS Q. 2003, 27, 425–478. [Google Scholar] [CrossRef]
  11. Andrés Sánchez, J.; Arias-Oliva, M.A.; Pelegrín-Borondo, J.P.; Lima-Rúa, O. Factores explicativos de la aceptación de la vacuna para el SARS-CoV-2 desde la perspectiva del comportamiento del consumidor. Rev. Esp. Sal. Púb. 2021, 95, 103. Available online: https://www.sanidad.gob.es/biblioPublic/publicaciones/recursos_propios/resp/revista_cdrom/VOL95/ORIGINALES/RS95C_202107101.pdf (accessed on 3 June 2024).
  12. Nguyen, T.T.M.; Lafond, K.E.; Nguyen, T.X.; Tran, P.D.; Nguyen, H.M.; Ha, V.T.C.; Do, T.T.; Ha, N.T.; Seward, J.F.; McFarland, J.W. Acceptability of seasonal influenza vaccines among health care workers in Vietnam in 2017. Vaccine 2020, 38, 2045–2050. [Google Scholar] [CrossRef]
  13. Harapan, H.; Wagner, A.L.; Yufika, A.; Winardi, W.; Anwar, S.; Gan, A.K.; Setiawan, A.M.; Rajamoorthy, Y.; Sofyan, H.; Mudatsir, M. Acceptance of a COVID-19 vaccine in Southeast Asia: A cross-sectional study in Indonesia. Front. Public Health 2020, 8, 381. [Google Scholar] [CrossRef] [PubMed]
  14. Njororai, F.J.; Amulla, W.; Nyaranga, C.K.; Cholo, W.; Adekunle, T. A Qualitative Exploration of Factors Associated with COVID-19 Vaccine Uptake and Hesitancy in Selected Rural Communities in Kenya. COVID 2024, 4, 715–730. [Google Scholar] [CrossRef]
  15. Bono, S.A.; Faria de Moura Villela, E.; Siau, C.S.; Chen, W.S.; Pengpid, S.; Hasan, M.T.; Sessou, P.; Ditekemena, J.D.; Amodan, B.O.; Hosseinipour, M.C.; et al. Factors affecting COVID-19 vaccine acceptance: An international survey among Low-and Middle-Income Countries. Vaccines 2021, 9, 515. [Google Scholar] [CrossRef] [PubMed]
  16. Kerr, J.R.; Schneider, C.R.; Recchia, G.; Dryhurst, S.; Sahlin, U.; Dufouil, C.; Arwidson, P.; Freeman, A.L.; van der Linden, S. Correlates of intended COVID-19 vaccine acceptance across time and countries: Results from a series of cross-sectional surveys. BMJ Open 2021, 11, e048025. [Google Scholar] [CrossRef]
  17. Wong, M.C.S.; Wong, E.L.Y.; Huang, J.; Cheung, A.W.L.; Law, K.; Chong, M.K.C.; Ng, R.W.Y.; Lai, C.K.C.; Boon, S.S.; Lau, J.T.F.; et al. Acceptance of the COVID-19 vaccine based on the health belief model: A population-based survey in Hong Kong. Vaccine 2021, 39, 1148–1156. [Google Scholar] [CrossRef] [PubMed]
  18. Schwarzinger, M.; Watson, V.; Arwidson, P.; Alla, F.; Luchini, S. COVID-19 vaccine hesitancy in a representative working-age population in France: A survey experiment based on vaccine characteristics. Lancet Public Health 2021, 6, e210–e221. [Google Scholar] [CrossRef] [PubMed]
  19. Maltezou, H.C.; Koutroumanis, P.P.; Kritikopoulou, C.; Theodoridou, K.; Katerelos, P.; Tsiaousi, I.; Rodolakis, A.; Loutradis, D. Knowledge about influenza and adherence to the recommendations for influenza vaccination of pregnant women after an educational intervention in Greece. Hum. Vaccines Immunother. 2019, 15, 1070–1074. [Google Scholar] [CrossRef] [PubMed]
  20. Otieno, N.A.; Otiato, F.; Nyawanda, B.; Adero, M.; Wairimu, W.N.; Ouma, D.; Atito, R.; Wilson, A.; Gonzalez-Casanova, I.; Malik, F.A.; et al. Drivers and barriers of vaccine acceptance among pregnant women in Kenya. Hum. Vaccines Immunother. 2020, 16, 2429–2437. [Google Scholar] [CrossRef] [PubMed]
  21. Kose, S.; Mandiracioglu, A.; Sahin, S.; Kaynar, T.; Karbus, O.; Ozbel, Y. Vaccine hesitancy of the COVID-19 by health care personnel. Int. J. Clin. Pract. 2021, 75, e13917. [Google Scholar] [CrossRef]
  22. Reno, C.; Maietti, E.; Fantini, M.P.; Savoia, E.; Manzoli, L.; Montalti, M.; Gori, D. Enhancing COVID-19 Vaccines Acceptance: Results from a Survey on Vaccine Hesitancy in Northern Italy. Vaccines 2021, 9, 378. [Google Scholar] [CrossRef]
  23. Alqudeimat, Y.; Alenezi, D.; AlHajri, B.; Alfouzan, H.; Almokhaizeem, Z.; Altamimi, S.; Almansouri, W.; Alzalzalah, S.; Ziyab, A.H. Acceptance of a COVID-19 vaccine and its related determinants among the general adult population in Kuwait. Med. Princ. Pract. 2021, 30, 262–271. [Google Scholar] [CrossRef] [PubMed]
  24. Eguia, H.; Vinciarelli, F.; Bosque-Prous, M.; Kristensen, T.; Saigí-Rubió, F. Spain’s Hesitation at the Gates of a COVID-19 Vaccine. Vaccines 2021, 9, 170. [Google Scholar] [CrossRef] [PubMed]
  25. Sbocchia, V. “Si hay un riesgo, quiero poder elegir”: Gestión y percepción del riesgo en los movimientos de reticencia a la vacunación italianos. Salud Colect. 2021, 17, e3231. [Google Scholar] [CrossRef] [PubMed]
  26. Dubé, E.; Gagnon, D.; Ouakki, M.; Bettinger, J.A.; Witteman, H.O.; MacDonald, S.; Fisher, W.; Saini, V.; Greyson, D. Measuring vaccine acceptance among Canadian parents: A survey of the Canadian Immunisation Research Network. Vaccine 2018, 36, 545–552. [Google Scholar] [CrossRef] [PubMed]
  27. Sun, X.; Wagner, A.L.; Ji, J.; Huang, Z.; Zikmund-Fisher, B.J.; Boulton, M.L.; Ren, J.; Prosser, L.A. A conjoint analysis of stated vaccine preferences in Shanghai, China. Vaccine 2020, 38, 1520–1525. [Google Scholar] [CrossRef] [PubMed]
  28. Mir, H.H.; Parveen, S.; Mullick, N.H.; Nabi, S. Using Structural equation modeling to predict Indian people’s attitudes and intentions towards COVID-19 vaccination. Diabetes Metab. Syndr. Clin. Res. Rev. 2021, 15, 1017–1022. [Google Scholar] [CrossRef] [PubMed]
  29. Borriello, A.; Master, D.; Pellegrini, A.; Rose, J.M. Preferences for a COVID-19 vaccine in Australia. Vaccine 2021, 39, 473–479. [Google Scholar] [CrossRef] [PubMed]
  30. McPhedran, R.; Toombs, B. Efficacy or delivery? An online Discrete Choice Experiment to explore preferences for COVID-19 vaccines in the UK. Econ. Lett. 2021, 200, 109747. [Google Scholar] [CrossRef] [PubMed]
  31. Abbas, K.M.; Kang, G.J.; Chen, D.; Werre, S.R.; Marathe, A. Demographics, perceptions, and socioeconomic factors affecting influenza vaccination among adults in the United States. PeerJ 2018, 6, e5171. [Google Scholar] [CrossRef]
  32. Sarathchandra, D.; Navin, M.C.; Largent, M.A.; McCright, A.M. A Survey Instrument for Measuring Vaccine Acceptance. Prev. Med. 2018, 109, 1–7. [Google Scholar] [CrossRef]
  33. Almohaithef, M.A.; Padhi, B.K. Determinants of COVID-19 vaccine acceptance in Saudi Arabia: A web-based national survey. J. Multidiscip. Healthc. 2020, 13, 1657–1663. [Google Scholar] [CrossRef] [PubMed]
  34. Harrison, N.; Poeppl, W.; Miksch, M.; Machold, K.; Kiener, H.; Aletaha, D.; Smolen, J.S.; Forstner, C.; Burgmann, H.; Lagler, H. Predictors for Influenza Vaccine Acceptance among Patients with Inflammatory Rheumatic Diseases. Vaccine 2018, 36, 4875–4879. [Google Scholar] [CrossRef] [PubMed]
  35. Ayieko, S.; Markham, C.; Baker, K.; Messiah, S.E. Psychological Determinants of COVID-19 Vaccination Uptake among Pregnant Women in Kenya: A Comprehensive Model Integrating Health Belief Model Constructs, Anticipated Regret, and Trust in Health Authorities. COVID 2024, 4, 749–760. [Google Scholar] [CrossRef]
  36. Lazarus, J.V.; Ratzan, S.; Palayew, A.; Gostin, L.O.; Larson, H.J.; Rabin, K.; Kimball, S.; El-Mohandes, A. Hesitant or not? A global survey of potential acceptance of a COVID-19 vaccine. Nat. Med. 2021, 27, 225–228. [Google Scholar] [CrossRef] [PubMed]
  37. Sarathchandra, D.; Johnson-Leung, J. How Political Ideology and Media Shaped Vaccination Intention in the Early Stages of the COVID-19 Pandemic in the United States. COVID 2024, 4, 658–671. [Google Scholar] [CrossRef]
  38. Camargo, E.L.S.; Ribeiro, C.J.N.; Santos, G.R.d.S.; Almeida, V.S.; Carvalho, H.E.F.d.; Schneider, G.; Vieira, L.G.; Alvim, A.L.S.; Pimenta, F.G.; Carneiro, L.M.; et al. Belief in Conspiracy Theories about COVID-19 Vaccines among Brazilians: A National Cross-Sectional Study. COVID 2024, 4, 518–530. [Google Scholar] [CrossRef]
  39. Kuter, B.J.; Browne, S.; Momplaisir, F.M.; Feemster, K.A.; Shen, A.K.; Green-McKenzie, J.; Faig, W.; Offit, P.A. Perspectives on the receipt of a COVID-19 vaccine: A survey of employees in two large hospitals in Philadelphia. Vaccine 2021, 39, 1693–1700. [Google Scholar] [CrossRef] [PubMed]
  40. Daly, M.; Robinson, E. Willingness to vaccinate against COVID-19 in the US: Representative longitudinal evidence from April to October 2020. Am. J. Prev. Med. 2021, 60, 766–773. [Google Scholar] [CrossRef]
  41. Malik, A.A.; McFadden, S.M.; Elharake, J.; Omer, S.B. Determinants of COVID-19 Vaccine Acceptance in the US. EClinicalMedicine 2020, 26, 100495. [Google Scholar] [CrossRef]
  42. Faul, F.; Erdfelder, E.; Buchner, A.; Lang, A.-G. Statistical power analyses using G*Power 3.1: Tests for correlation and regression analyses. Behav. Res. Methods 2009, 41, 1149–1160. [Google Scholar] [CrossRef]
  43. Nguyen, N.T.; Chinn, J.; De Ferrante, M.; Kirby, K.A.; Hohmann, S.F.; Amin, A. Male gender is a predictor of higher mortality in hospitalized adults with COVID-19. PLoS ONE 2021, 16, e0254066. [Google Scholar] [CrossRef]
  44. Male, V. Menstrual changes after covid-19 vaccination. BMJ 2021, 374, n2211. [Google Scholar] [CrossRef] [PubMed]
  45. CDC. Risk for COVID-19 Infection, Hospitalisation, and Death by Age Group. 2021. Available online: https://archive.cdc.gov/www_cdc_gov/coronavirus/2019-ncov/covid-data/investigations-discovery/hospitalization-death-by-age.html (accessed on 4 June 2024).
  46. Latkin, C.A.; Dayton, L.; Yi, G.; Colon, B.; Kong, X. Mask usage, social distancing, racial, and gender correlates of COVID-19 vaccine intentions among adults in the US. PLoS ONE 2021, 16, e0246970. [Google Scholar] [CrossRef]
  47. Lakens, D. Sample size justification. Collabra Psychol. 2022, 8, 33267. [Google Scholar] [CrossRef]
  48. Venkatesh, V.; Thong, J.Y.L.; Xu, X. Consumer Acceptance and Use of Information Technology: Extending the Unified Theory of Acceptance and Use of Technology. MIS Q. 2012, 36, 157–178. [Google Scholar] [CrossRef]
  49. Remschmidt, C.; Walter, D.; Schmich, P.; Wetzstein, M.; Deleré, Y.; Wichmann, O. Knowledge, attitude, and uptake related to human papillomavirus vaccination among young women in Germany recruited via a social media site. Hum. Vaccines Immunother. 2014, 10, 2527–2535. [Google Scholar] [CrossRef] [PubMed]
  50. Nan, X.; Daily, K.; Richards, A.; Holt, C.; Wang, M.Q.; Tracy, K.; Qin, Y. The role of trust in health information from medical authorities in accepting the HPV vaccine among African American parents. Hum. Vaccines Immunother. 2019, 15, 1723–1731. [Google Scholar] [CrossRef] [PubMed]
  51. Borena, W.; Luckner-Hornischer, A.; Katzgraber, F.; Holm-Von Laer, D. Factors affecting HPV vaccine acceptance in west Austria: Do we need to revise the current immunisation scheme? Papillomavirus Res. 2016, 2, 173–177. [Google Scholar] [CrossRef] [PubMed]
  52. DiStefano, C.; Zhu, M.; Mîndrilã, D. Understanding and Using Factor Scores: Considerations for the Applied Researcher. Pract. Assess. Res. Eval. 2009, 14, 20. [Google Scholar] [CrossRef]
  53. Koenker, R.; Machado, J.A. Goodness of fit and related inference processes for quantile regression. J. Am. Stat. Assoc. 1999, 94, 1296–1310. [Google Scholar] [CrossRef]
  54. Recio-Vivas, A.M.; Font-Jiménez, I.; Mansilla-Domínguez, J.M.; Belzunegui-Eraso, A.; Díaz-Pérez, D.; Lorenzo-Allegue, L.; Peña-Otero, D. Fear and Attitude towards SARS-CoV-2 COVID-19 Infection in Spanish Population during the Period of Confinement. Int. J. Environ. Res. Public Health 2022, 19, 834. [Google Scholar] [CrossRef] [PubMed]
  55. Martín, I. Reacción Médica. El Pasaporte COVID, Poco “útil” en Países con Alta Cobertura de Vacunación. 2021. Available online: https://www.redaccionmedica.com/secciones/sanidad-hoy/el-pasaporte-covid-poco-util-en-paises-con-alta-cobertura-de-vacunacion-3326#:~:text=Pasaporte%20covid%2C%20%C3%BAtil%20en%20pa%C3%ADses,la%20introducci%C3%B3n%20del%20pasaporte%20covid (accessed on 3 June 2024).
  56. Collie, S.; Champion, J.; Moultrie, H.; Bekker, L.G.; Gray, G. Effectiveness of BNT162b2 vaccine against omicron variant in South Africa. N. Engl. J. Med. 2021, 386, 494–496. [Google Scholar] [CrossRef] [PubMed]
  57. Sallam, M. COVID-19 vaccine hesitancy worldwide: A concise systematic review of vaccine acceptance rates. Vaccines 2021, 9, 160. [Google Scholar] [CrossRef] [PubMed]
  58. Solís Arce, J.S.; Warren, S.S.; Meriggi, N.F.; Scacco, A.; McMurry, N.; Voors, M.; Syunyaev, G.; Malik, A.A.; Aboutajdine, S.; Adeojo, O.; et al. COVID-19 vaccine acceptance and hesitancy in low- and middle-income countries. Nat. Med. 2021, 27, 1385–1394. [Google Scholar] [CrossRef]
  59. Our World in Data 2021. Coronavirus COVID-19 Vaccinations. Available online: https://ourworldindata.org/covid-vaccinations (accessed on 3 June 2024).
Figure 1. Theoretical framework and expected signs of factors associated with the intention to use the COVID-19 vaccine.
Covid 04 00086 g001
Figure 2. Results of fitting the groundwork of Figure 1 with ordinary least squares and quantile regressions at τ = 0.2, 0.5, and 0.75. Note: *, **, and *** denote statistical significance at the 5%, 1%, and 0.01% levels, respectively.
Covid 04 00086 g002
Table 1. Survey profile.
CategoryNumber of ResponsesPercentage
Sex
Male26944.83%
Women33155.17%
Age
≤30 years20033.33%
>30 years and ≤50 years19732.83%
>50 years20333.83%
Mean = 41.97, SD = 15.52
Income
EUR > 300014924.83%
EUR ≥ 2500 and ≤30007813.00%
EUR ≥ 1750 and <249912020.00%
EUR ≥ 1000 and ≤174913422.33%
EUR < 1000386.33%
Unanswered8113.50%
Education
University graduate, PhD, or doctorate33956.59%
Secondary school or vocational training20634.39%
Primary school549.02%
Region
Centre of Spain (Castilla and León, Castilla-la Mancha, and La Rioja)11218.67%
Catalonia12821.33%
Madrid10617.67%
Northern Spain (Galicia, Asturias, and Cantabria)8814.67%
Basque Country and Navarra406.67%
Southern Spain (Extremadura and Andalusia)477.83%
Aragón and Levante (Valencia and Murcia)6110.17%
Balearic Islands and Canary Islands152.50%
Ceuta and Melilla30.50%
Table 4. Results of the ordinary least squares regression model fit.
Coefficientt Ratiop Value
Constant0.05691.2080.2275
FCOVID0.07363.0440.0024
FVAC−0.0984−4.304<0.0001
EFFIC0.522717.45<0.0001
SOCINF0.348412.01<0.0001
SEX0.00490.11280.9102
AGE0.02930.4630.6435
INCOME−0.1379−2.4590.0142
R2 = 0.7456
Global Significance of the Model: Snedecor’s F = 251.81 (p < 0.0001)
White Test: LM Statistic = 121.099 (p < 0.0001)
Normality Test: χ2 Statistic = 12.978 (p = 0.00152)
Table 5. Quantile regression results near the median (τ = 0.45, 0.5, 0.55).
Quantileτ = 0.45τ = 0.5τ = 0.55
VariableCoefficientp ValueCoefficientp ValueCoefficientp Value
Constant−0.02840.34750.02150.55790.07770.0568
FCOVID0.04240.00640.04280.02330.02830.1760
FVACC−0.0724<0.0001−0.06570.0002−0.05400.0065
EFFIC0.5147<0.00010.5377<0.00010.5803<0.0001
SOCINF0.3600<0.00010.3316<0.00010.3011<0.0001
SEX0.03010.28140.03540.29710.03180.3991
AGE0.03640.37110.05530.26320.04800.3819
INCOME−0.03230.3688−0.06900.1154−0.06570.1763
Pseudo-R20.5592 0.5616 0.5669
Table 6. Quantile regression results (τ = 0.2, 0.25, 0.3).
Quantileτ = 0.2τ = 0.25τ = 0.3
VariableCoefficientp ValueCoefficientp ValueCoefficientp Value
Constant−0.28180.0003−0.2719<0.0001−0.1923<0.0001
FCOVID0.07300.06580.08630.00230.04850.0402
FVACC−0.10650.0046−0.09750.0003−0.0923<0.0001
EFFIC0.4600<0.00010.4293<0.00010.4501<0.0001
SOCINF0.3972<0.00010.4315<0.00010.4018<0.0001
SEX0.01910.78870.06590.19470.07540.0768
AGE0.02470.81220.04610.53200.05850.3449
INCOME−0.22950.0128−0.12420.0577−0.10060.0667
Pseudo-R20.6023 0.5912 0.5818
Table 7. Quantile regression results (τ = 0.7, 0.75, 0.8).
Quantileτ = 0.7τ = 0.75τ = 0.8
VariableCoefficientp ValueCoefficientp ValueCoefficientp Value
Constant0.2770<0.00010.3501<0.00010.4434<0.0001
FCOVID0.00360.86830.00430.85150.00960.6838
FVAC−0.04630.0263−0.03060.1608−0.05470.0147
EFFIC0.6233<0.00010.6278<0.00010.6267<0.0001
SOCINF0.3140<0.00010.3238<0.00010.3334<0.0001
SEX0.04630.24290.01320.7516−0.01200.7790
AGE−0.01460.8003−0.04750.4320−0.06850.2694
INCOME−0.10220.0455−0.07980.1364−0.09180.0948
Pseudo-R20.5779 0.5811 0.5797
Disclaimer/Publisher’s Note: The statements, opinions and data contained in all publications are solely those of the individual author(s) and contributor(s) and not of MDPI and/or the editor(s). MDPI and/or the editor(s) disclaim responsibility for any injury to people or property resulting from any ideas, methods, instructions or products referred to in the content.

