
Characterization of Surface Topography Features for the Effect of Process Parameters and Their Correlation to Quality Monitoring in Metal Additive Manufacturing

 ,
, 
Abstract
:1. Introduction
2. Methodology
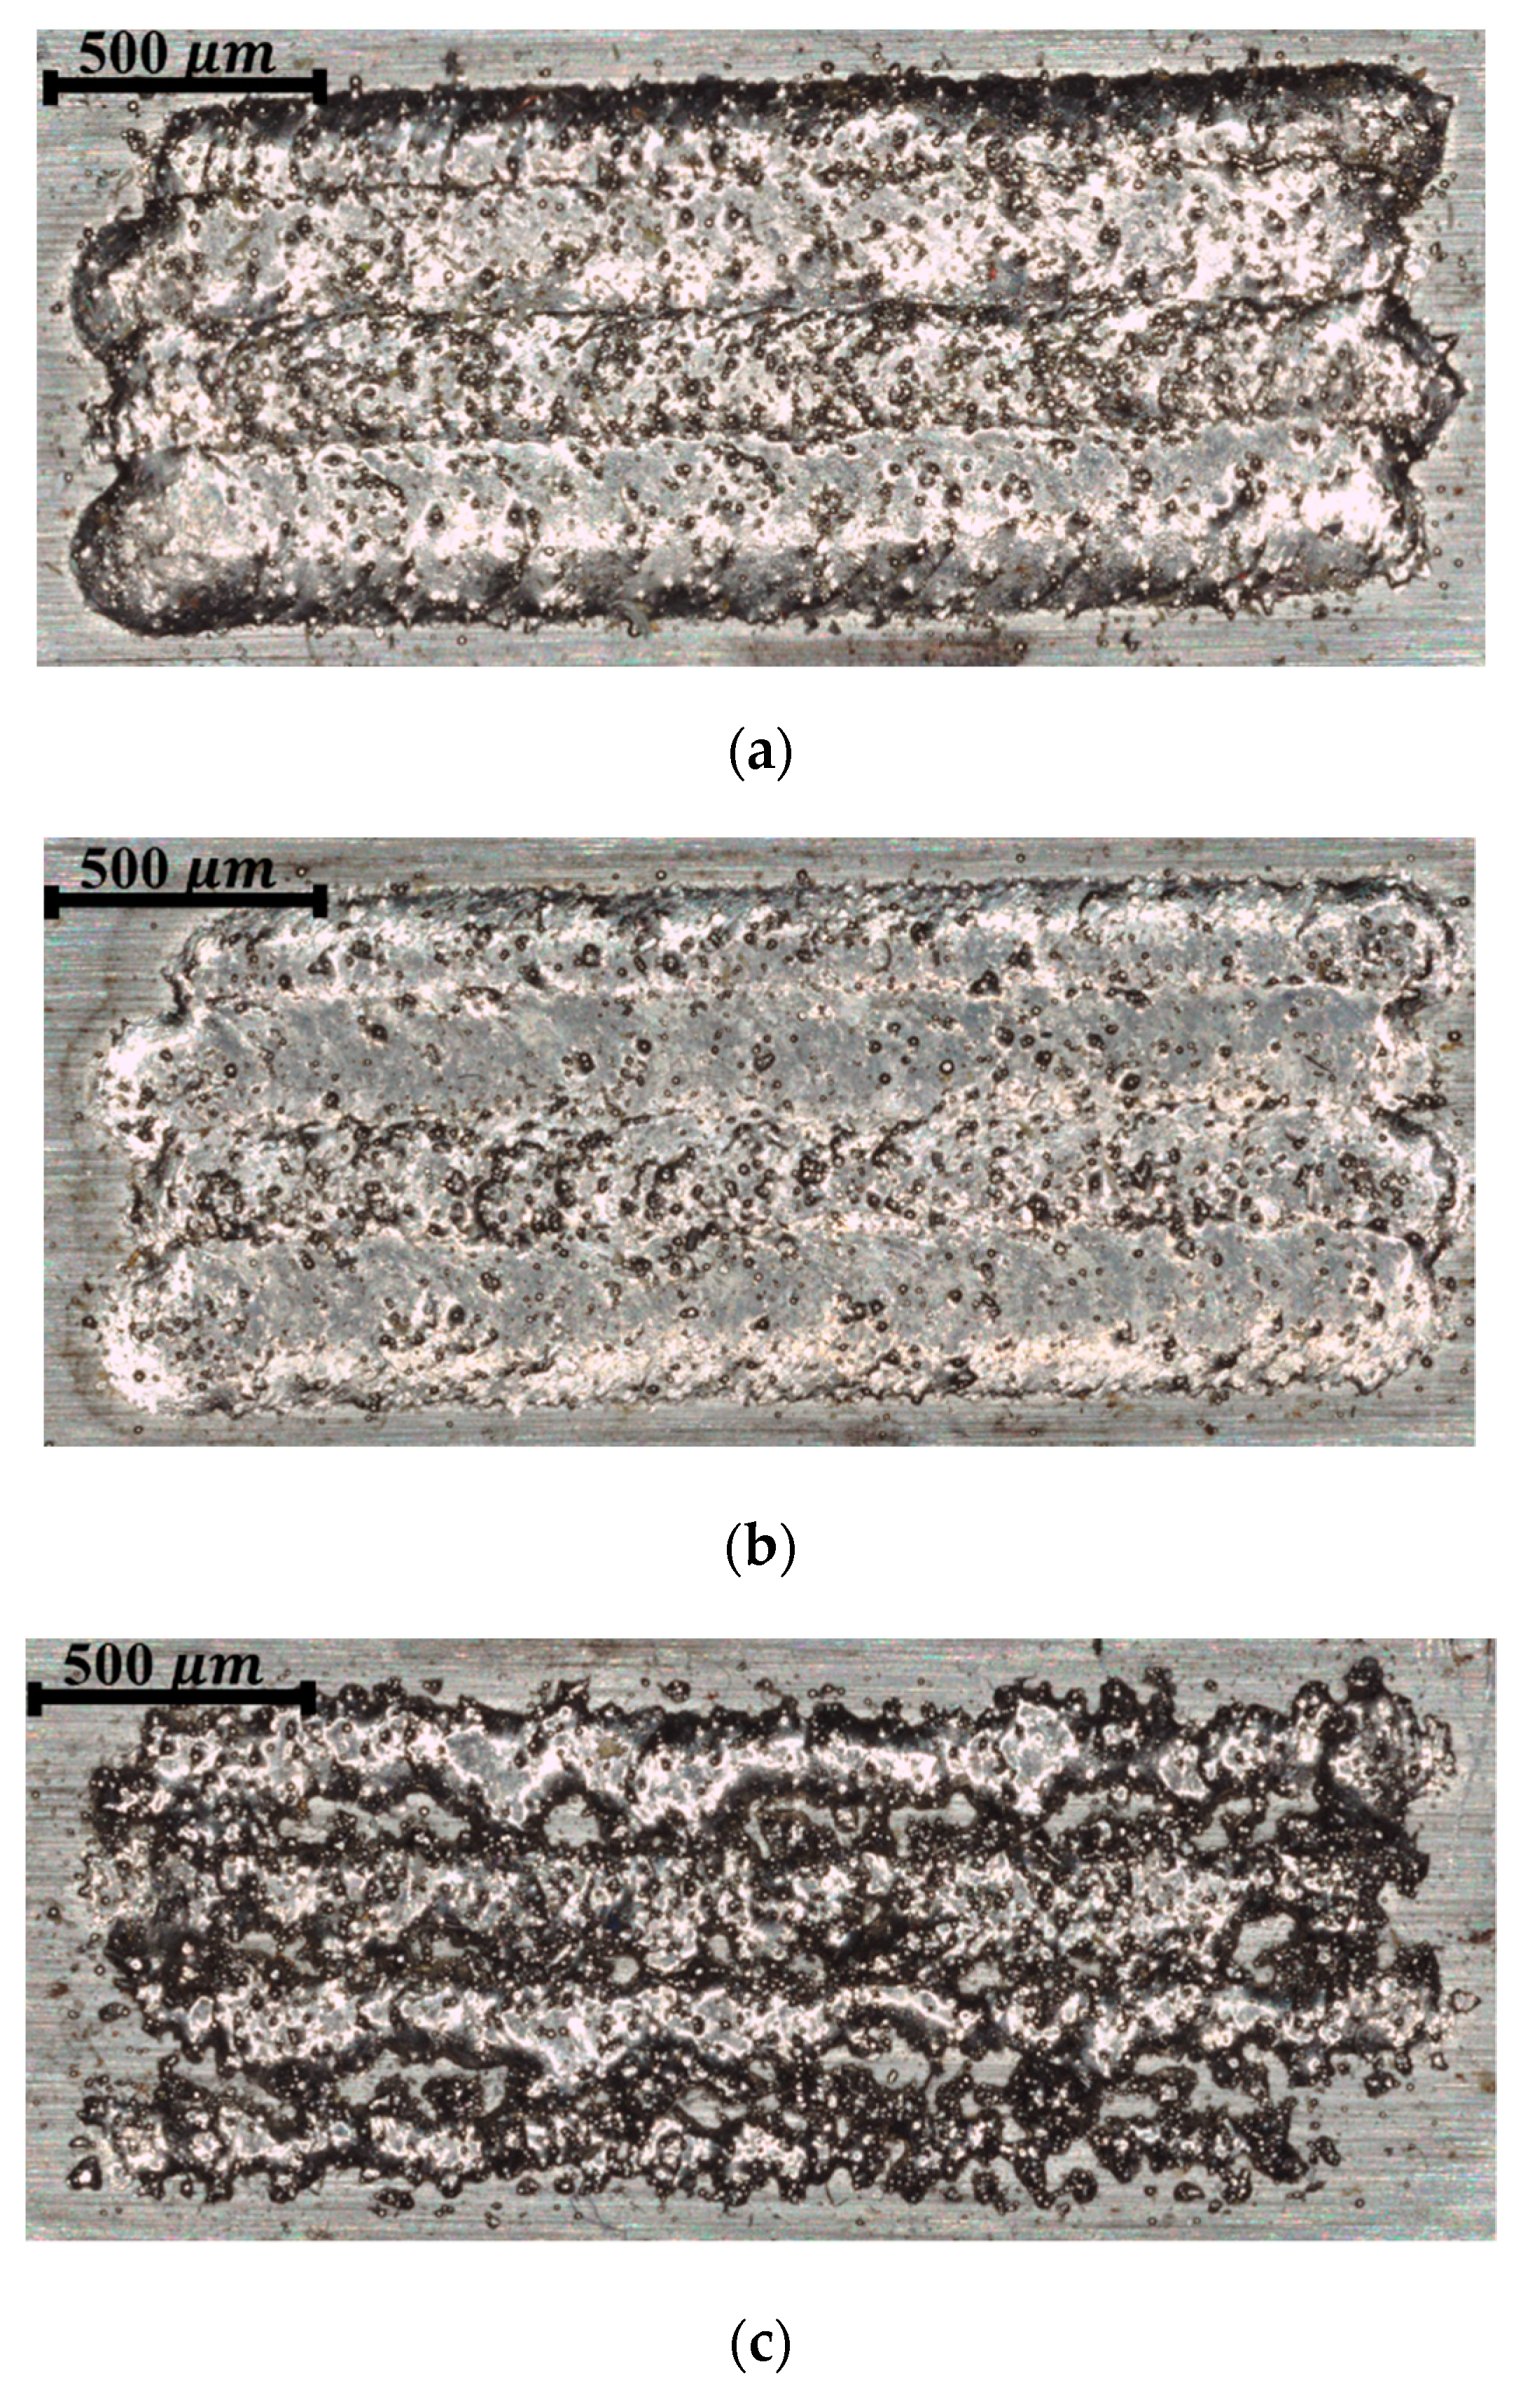
2.1. Samples
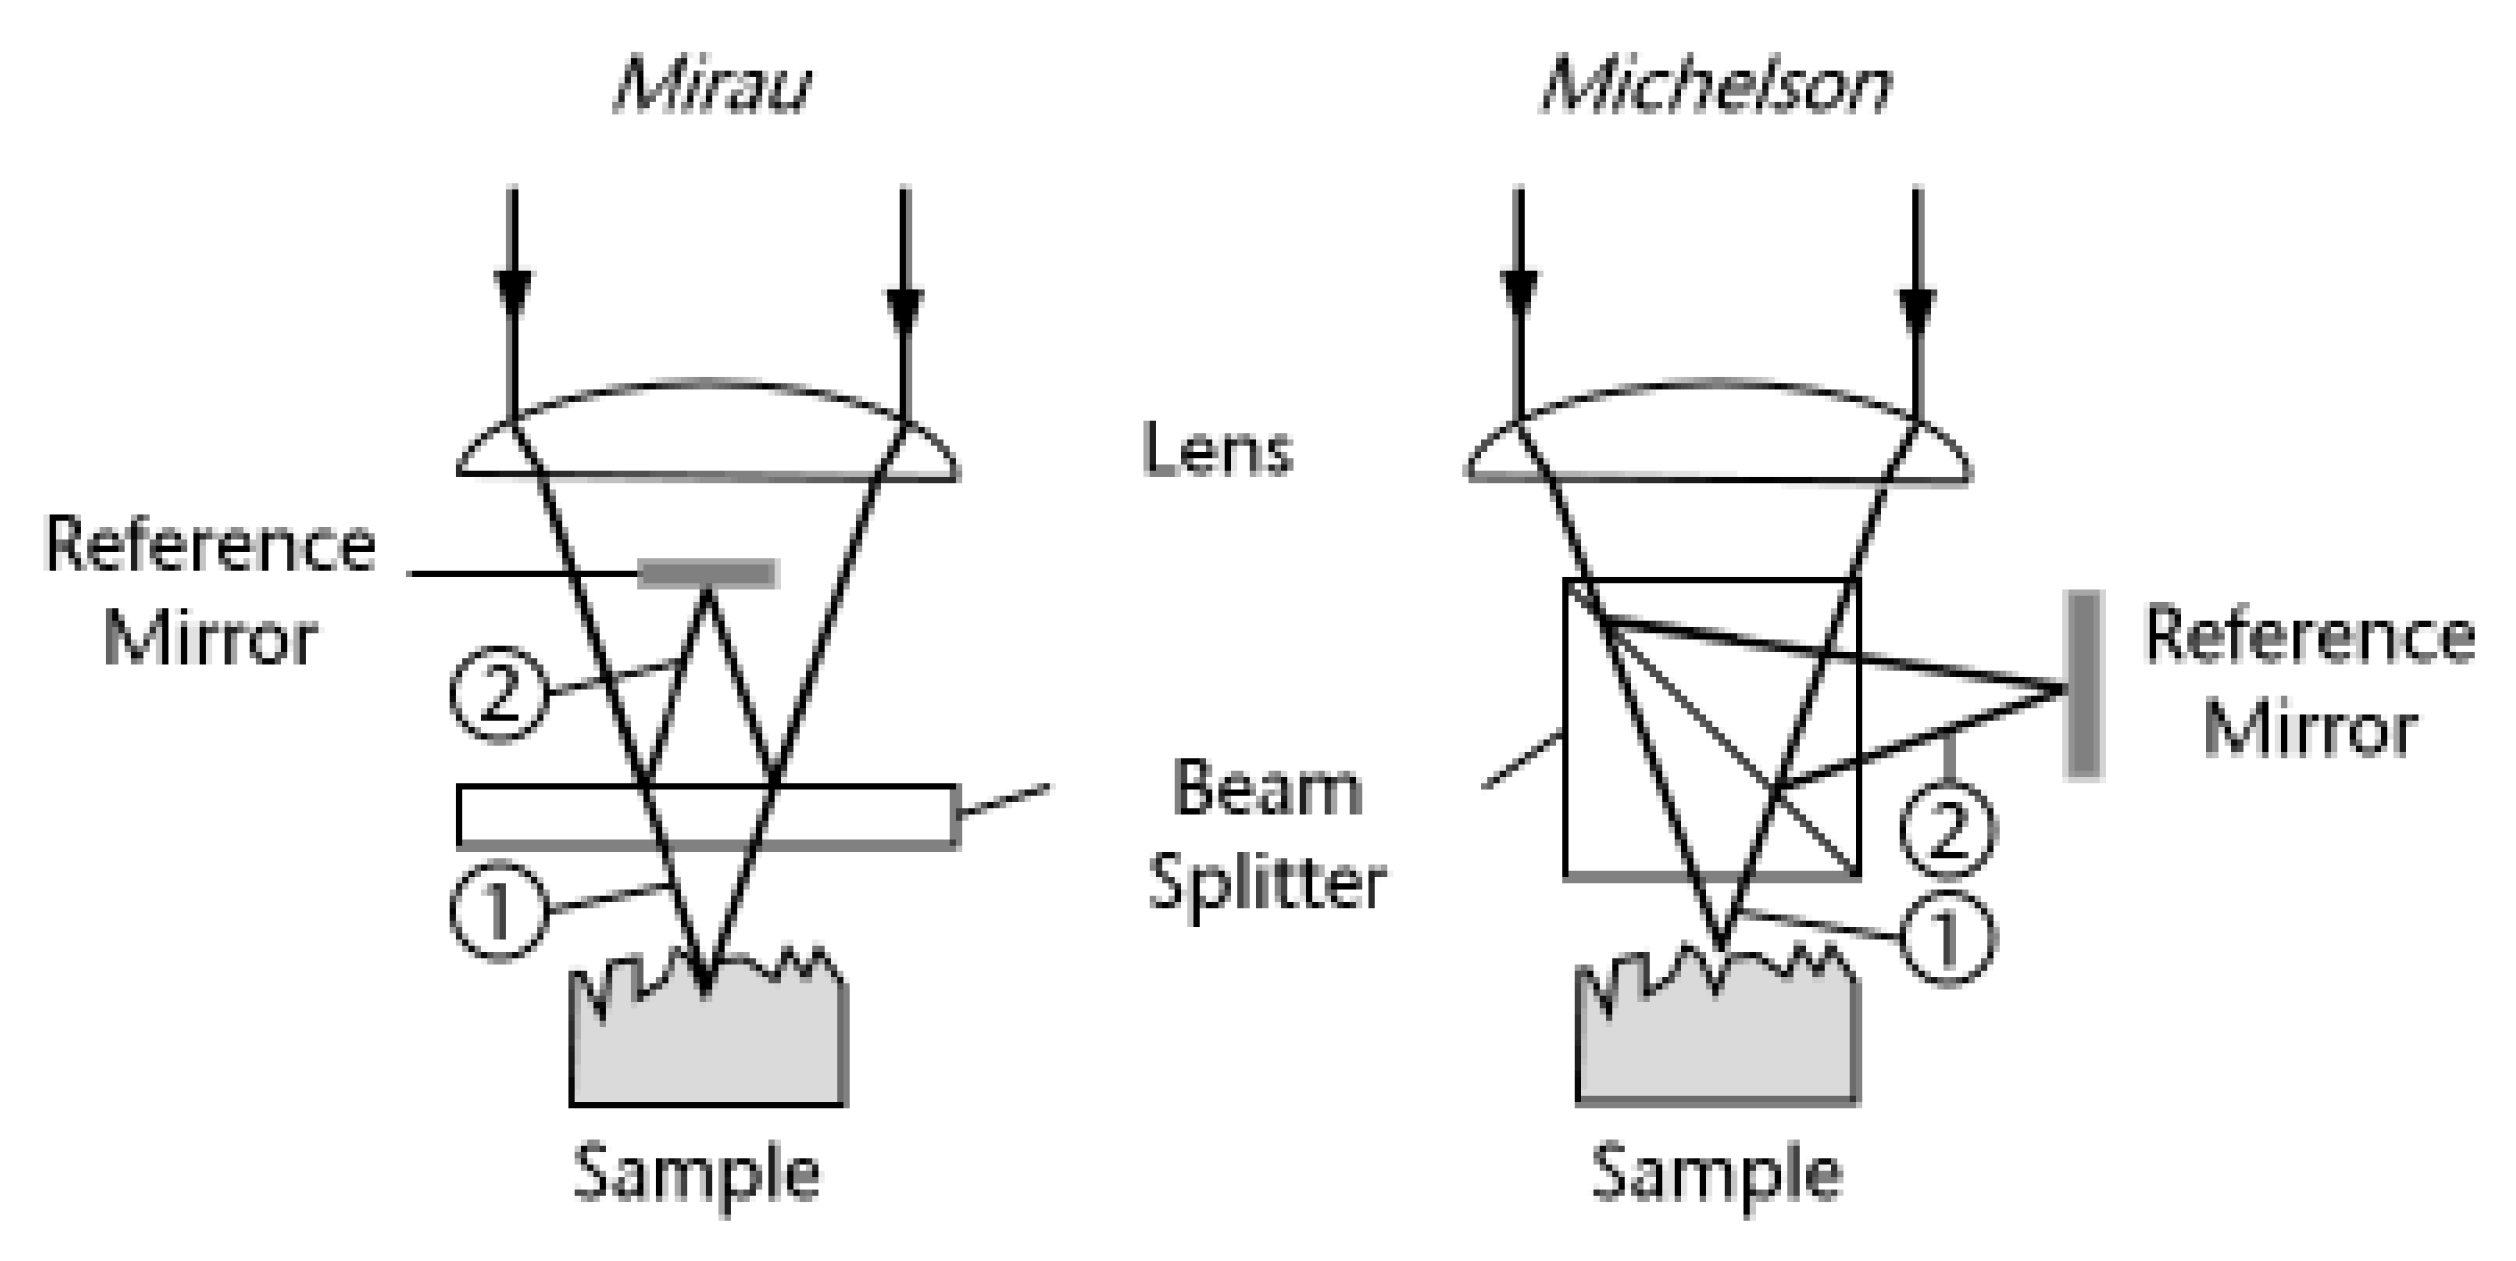
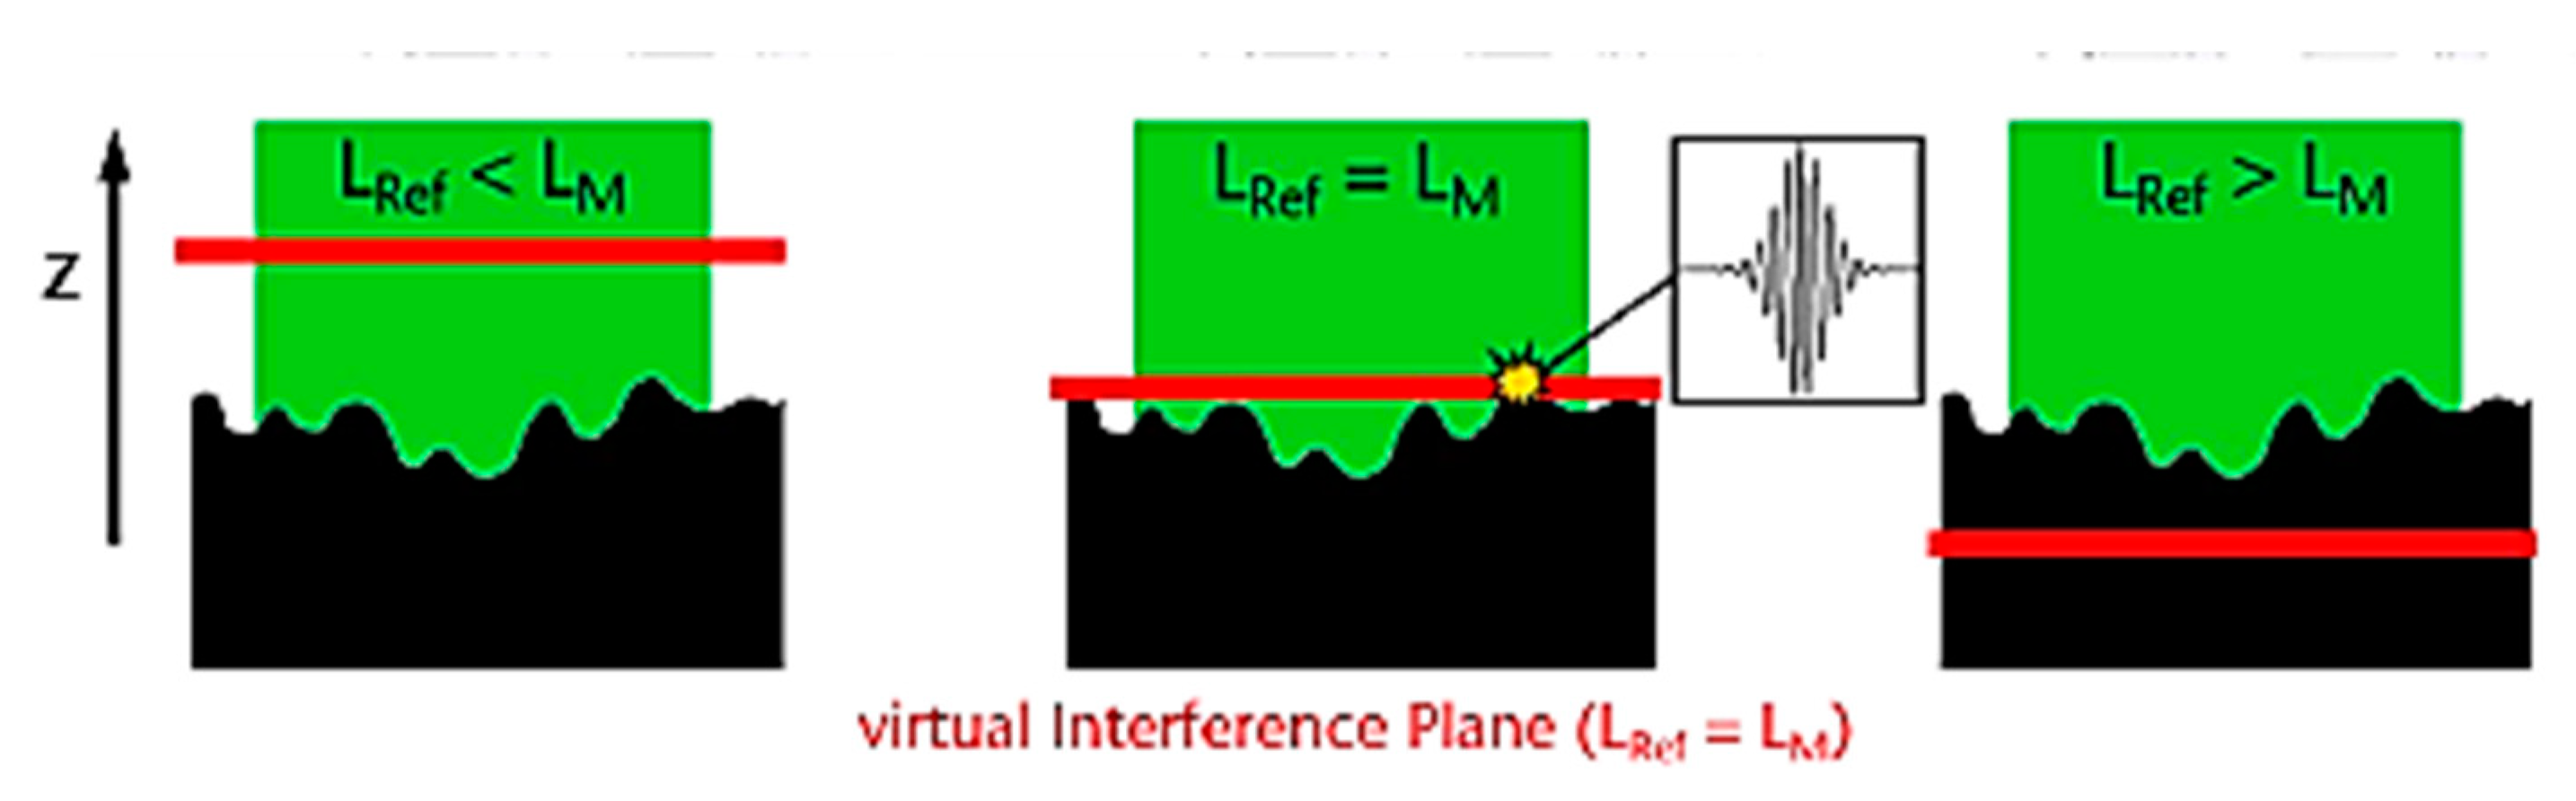
2.2. Measurement Setup
3. Surface Topography Feature Characterization
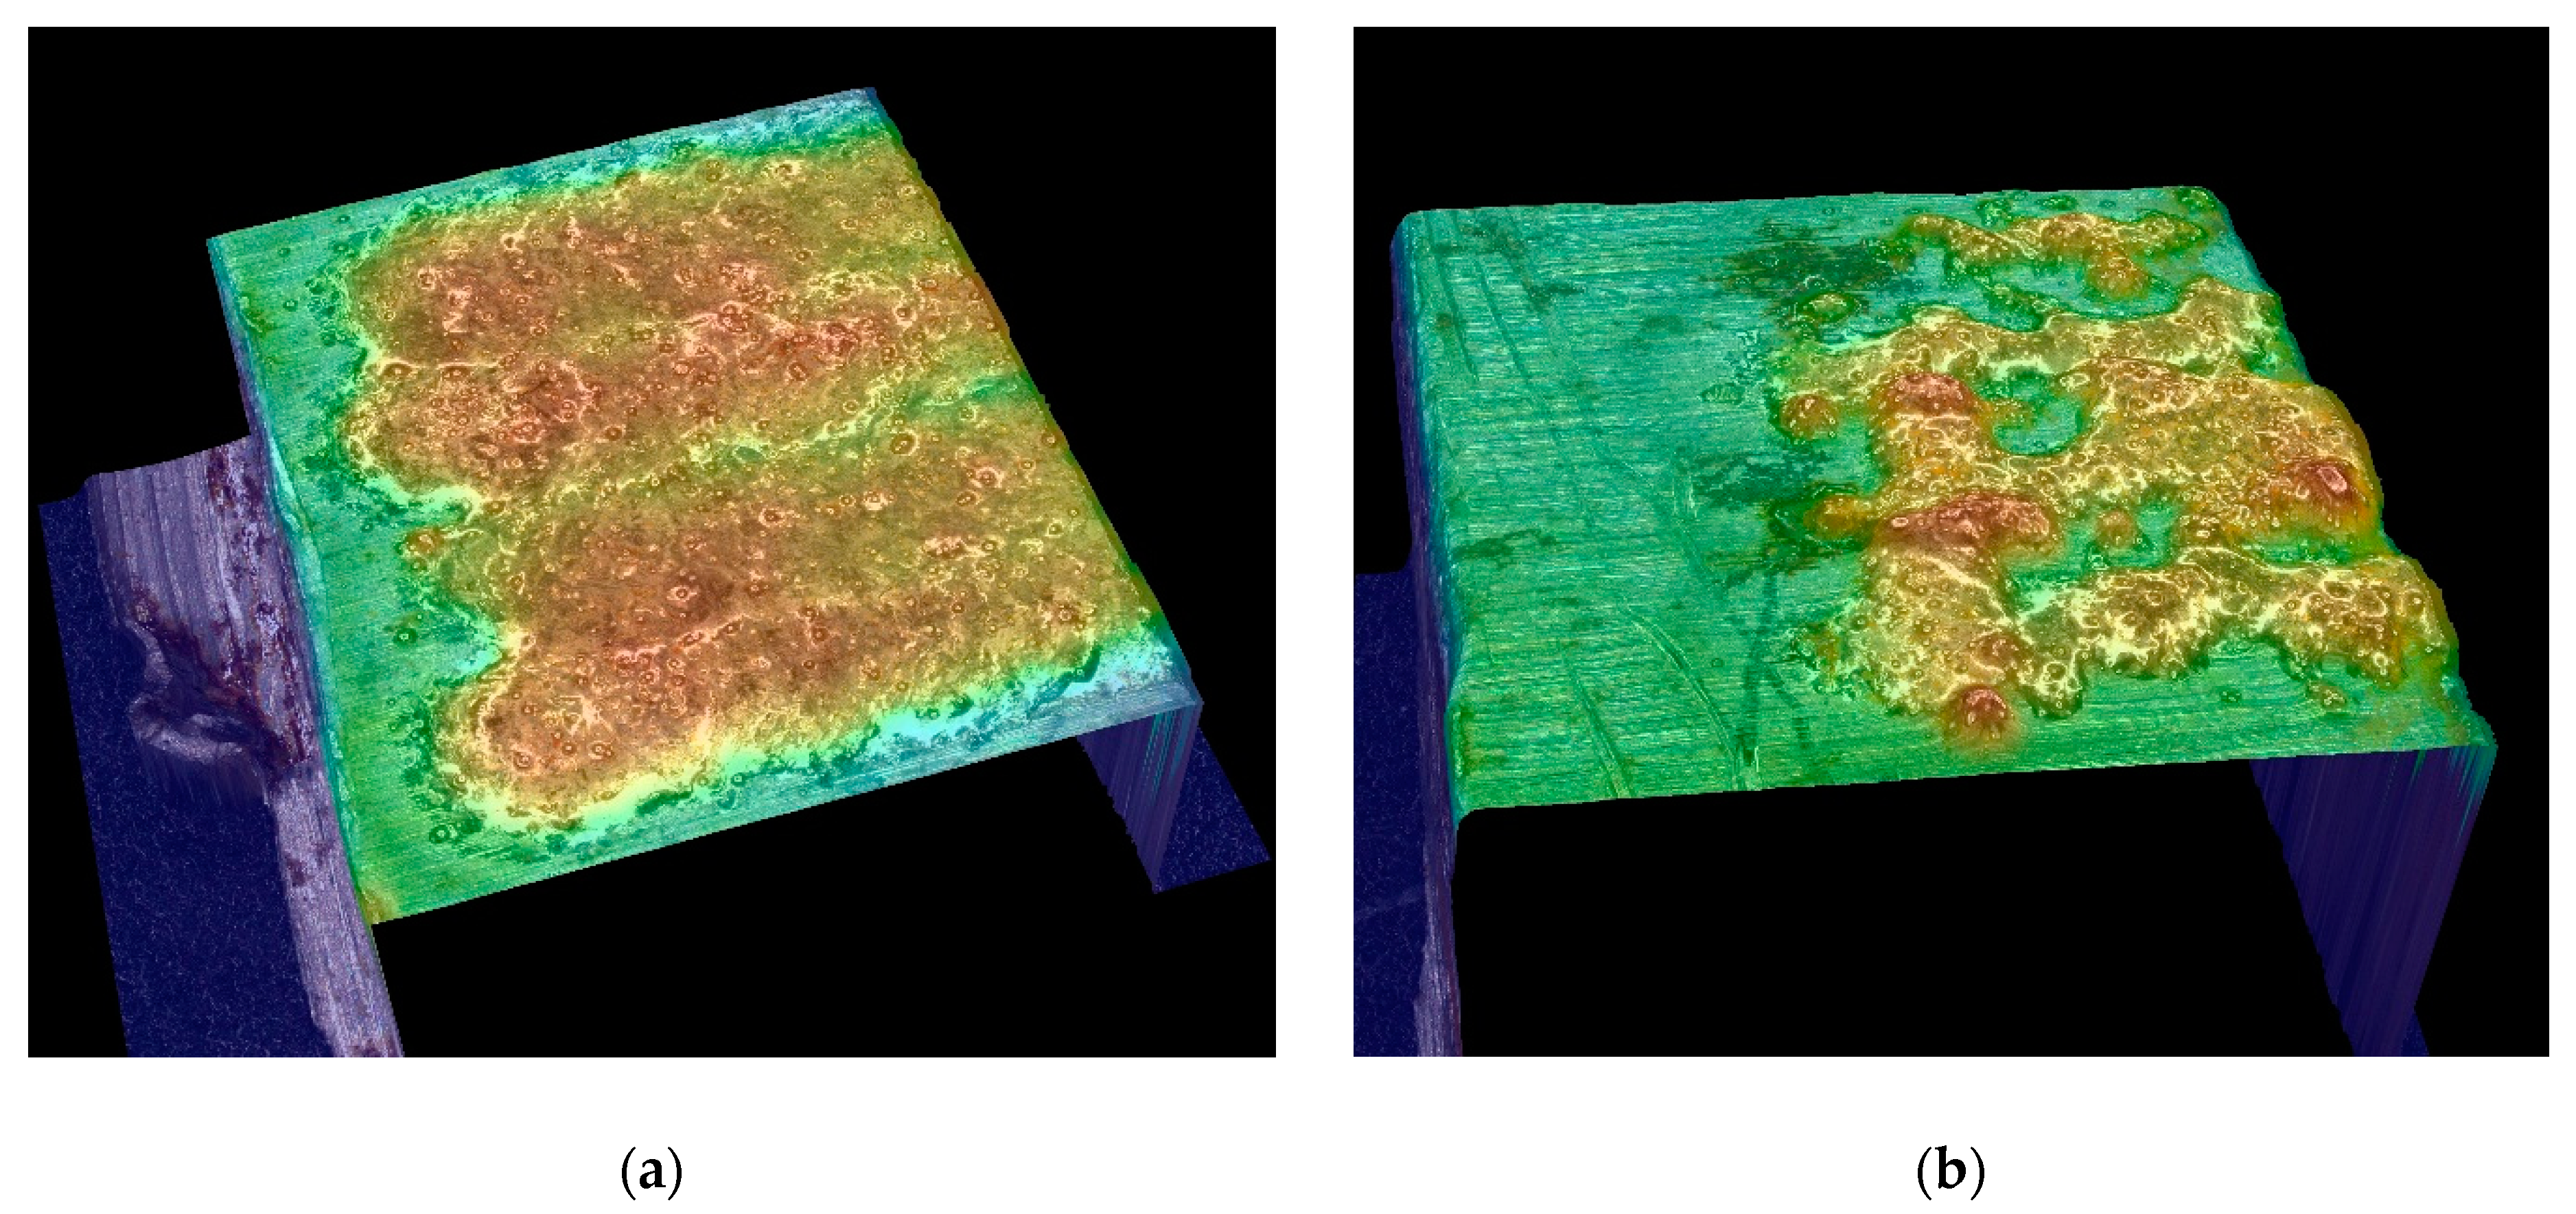
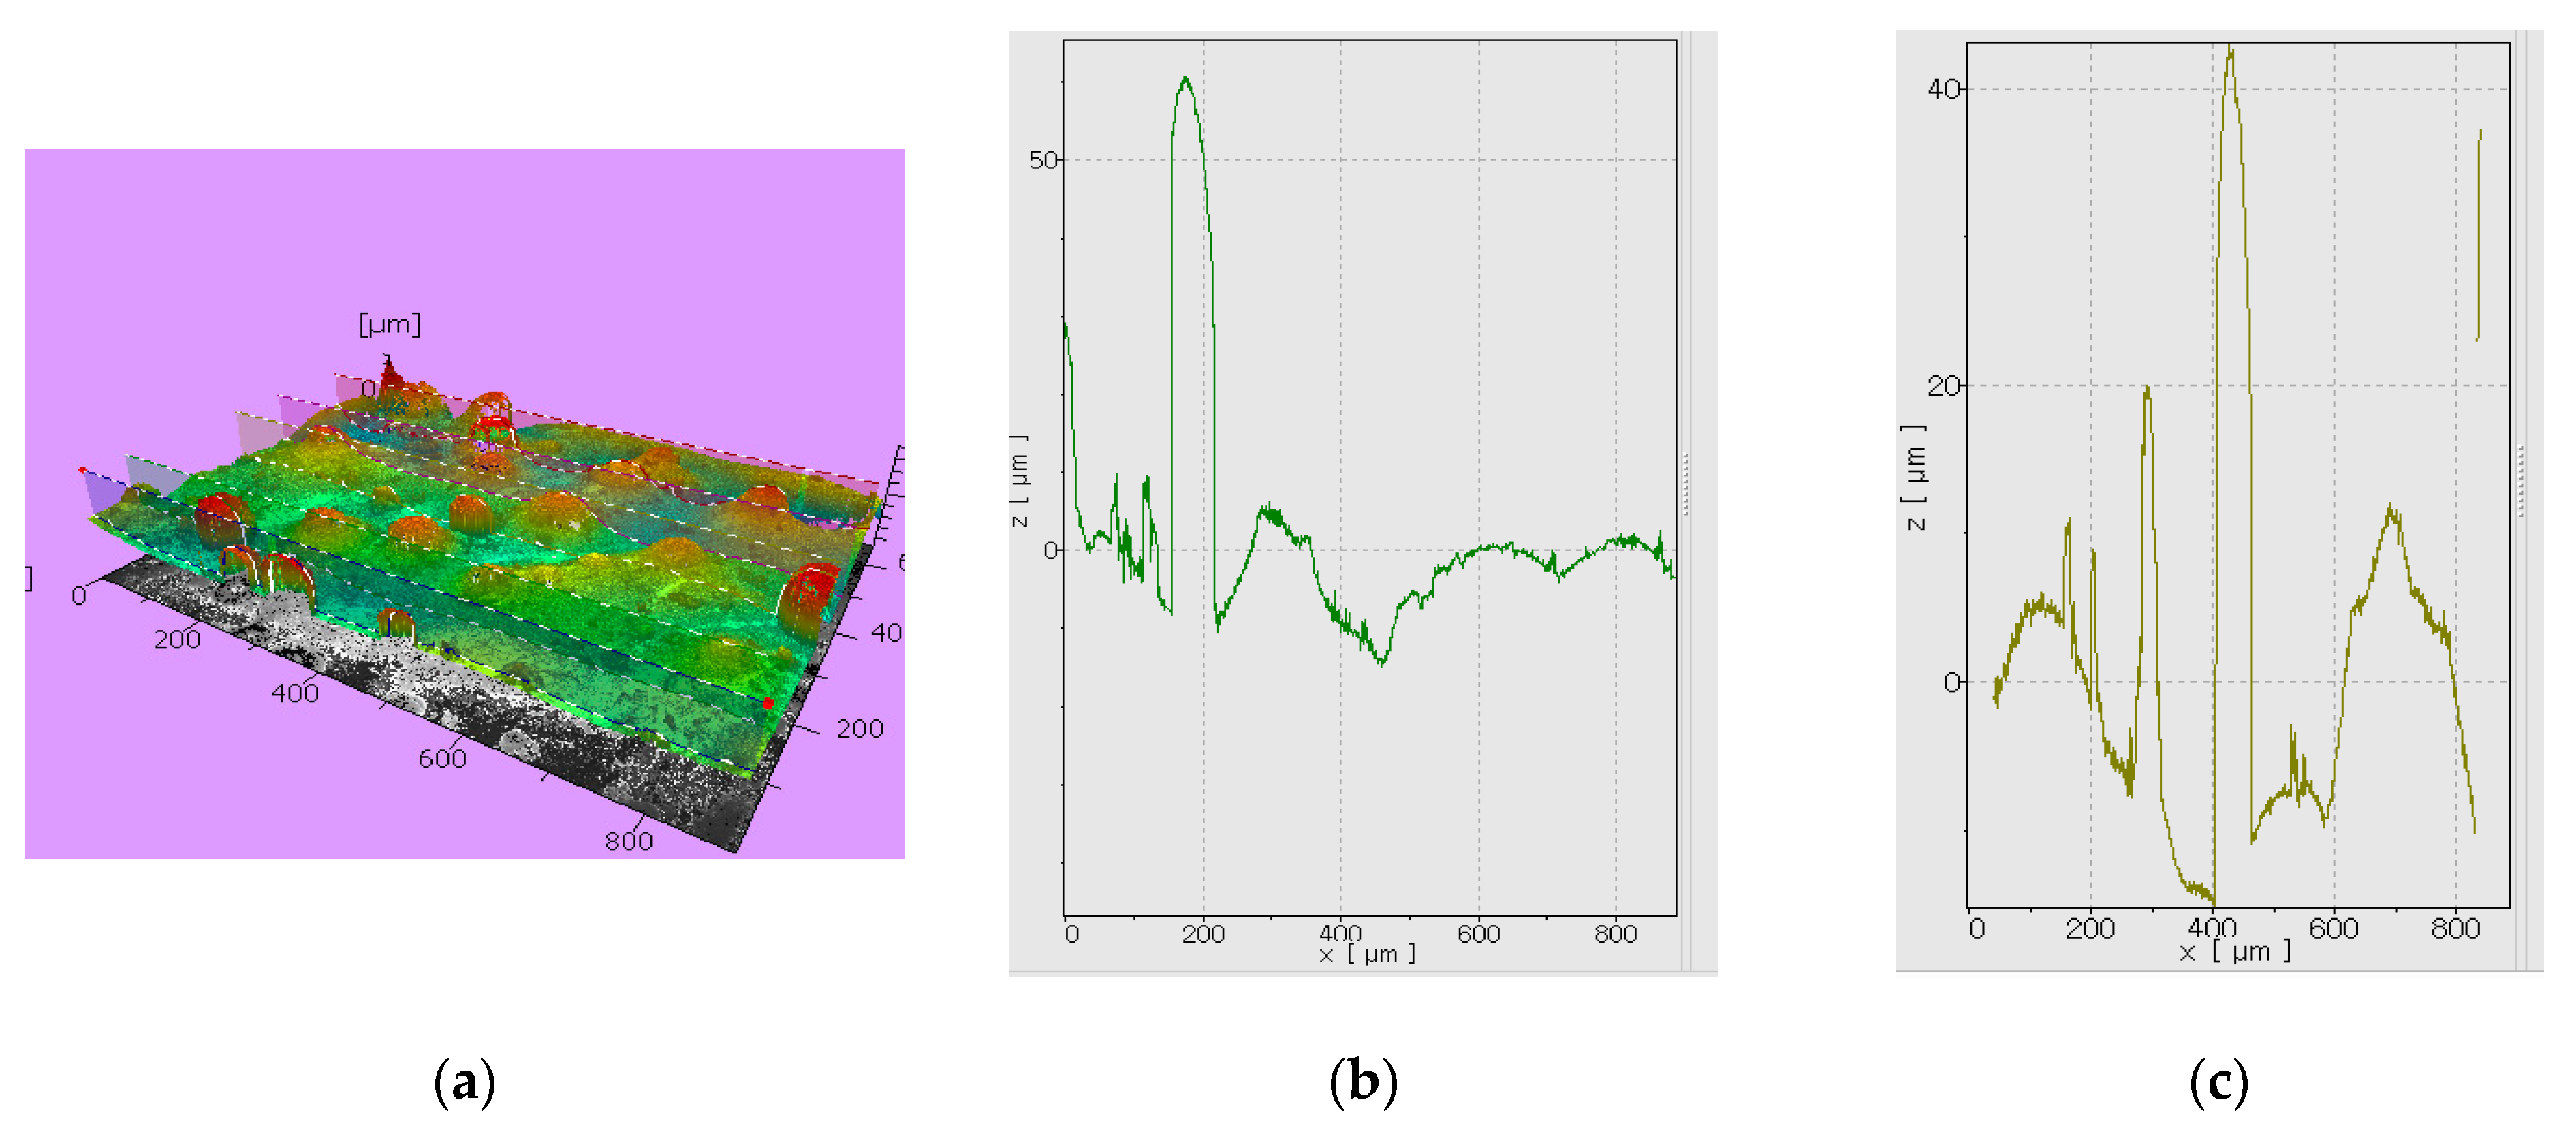
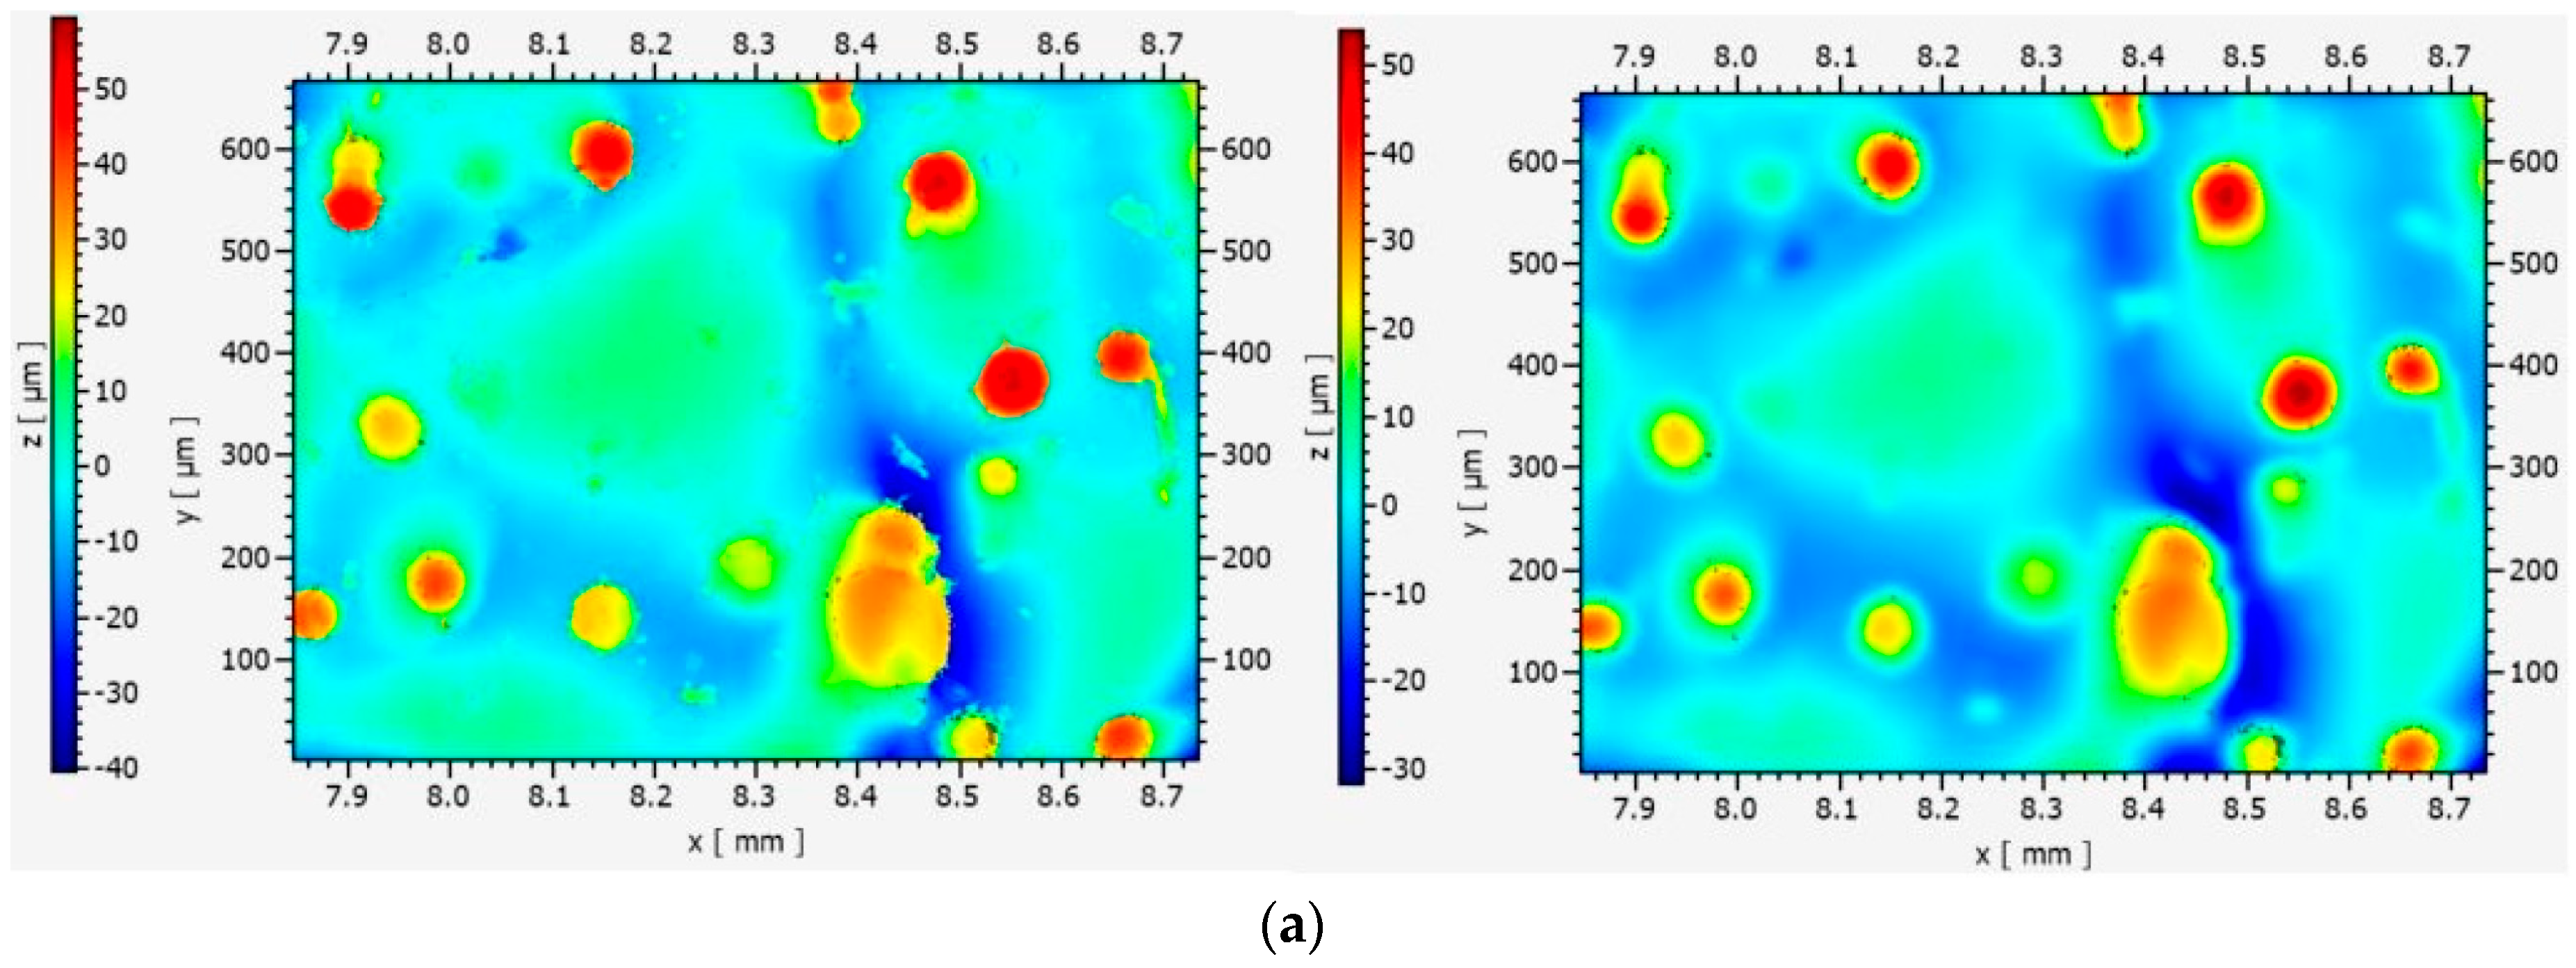
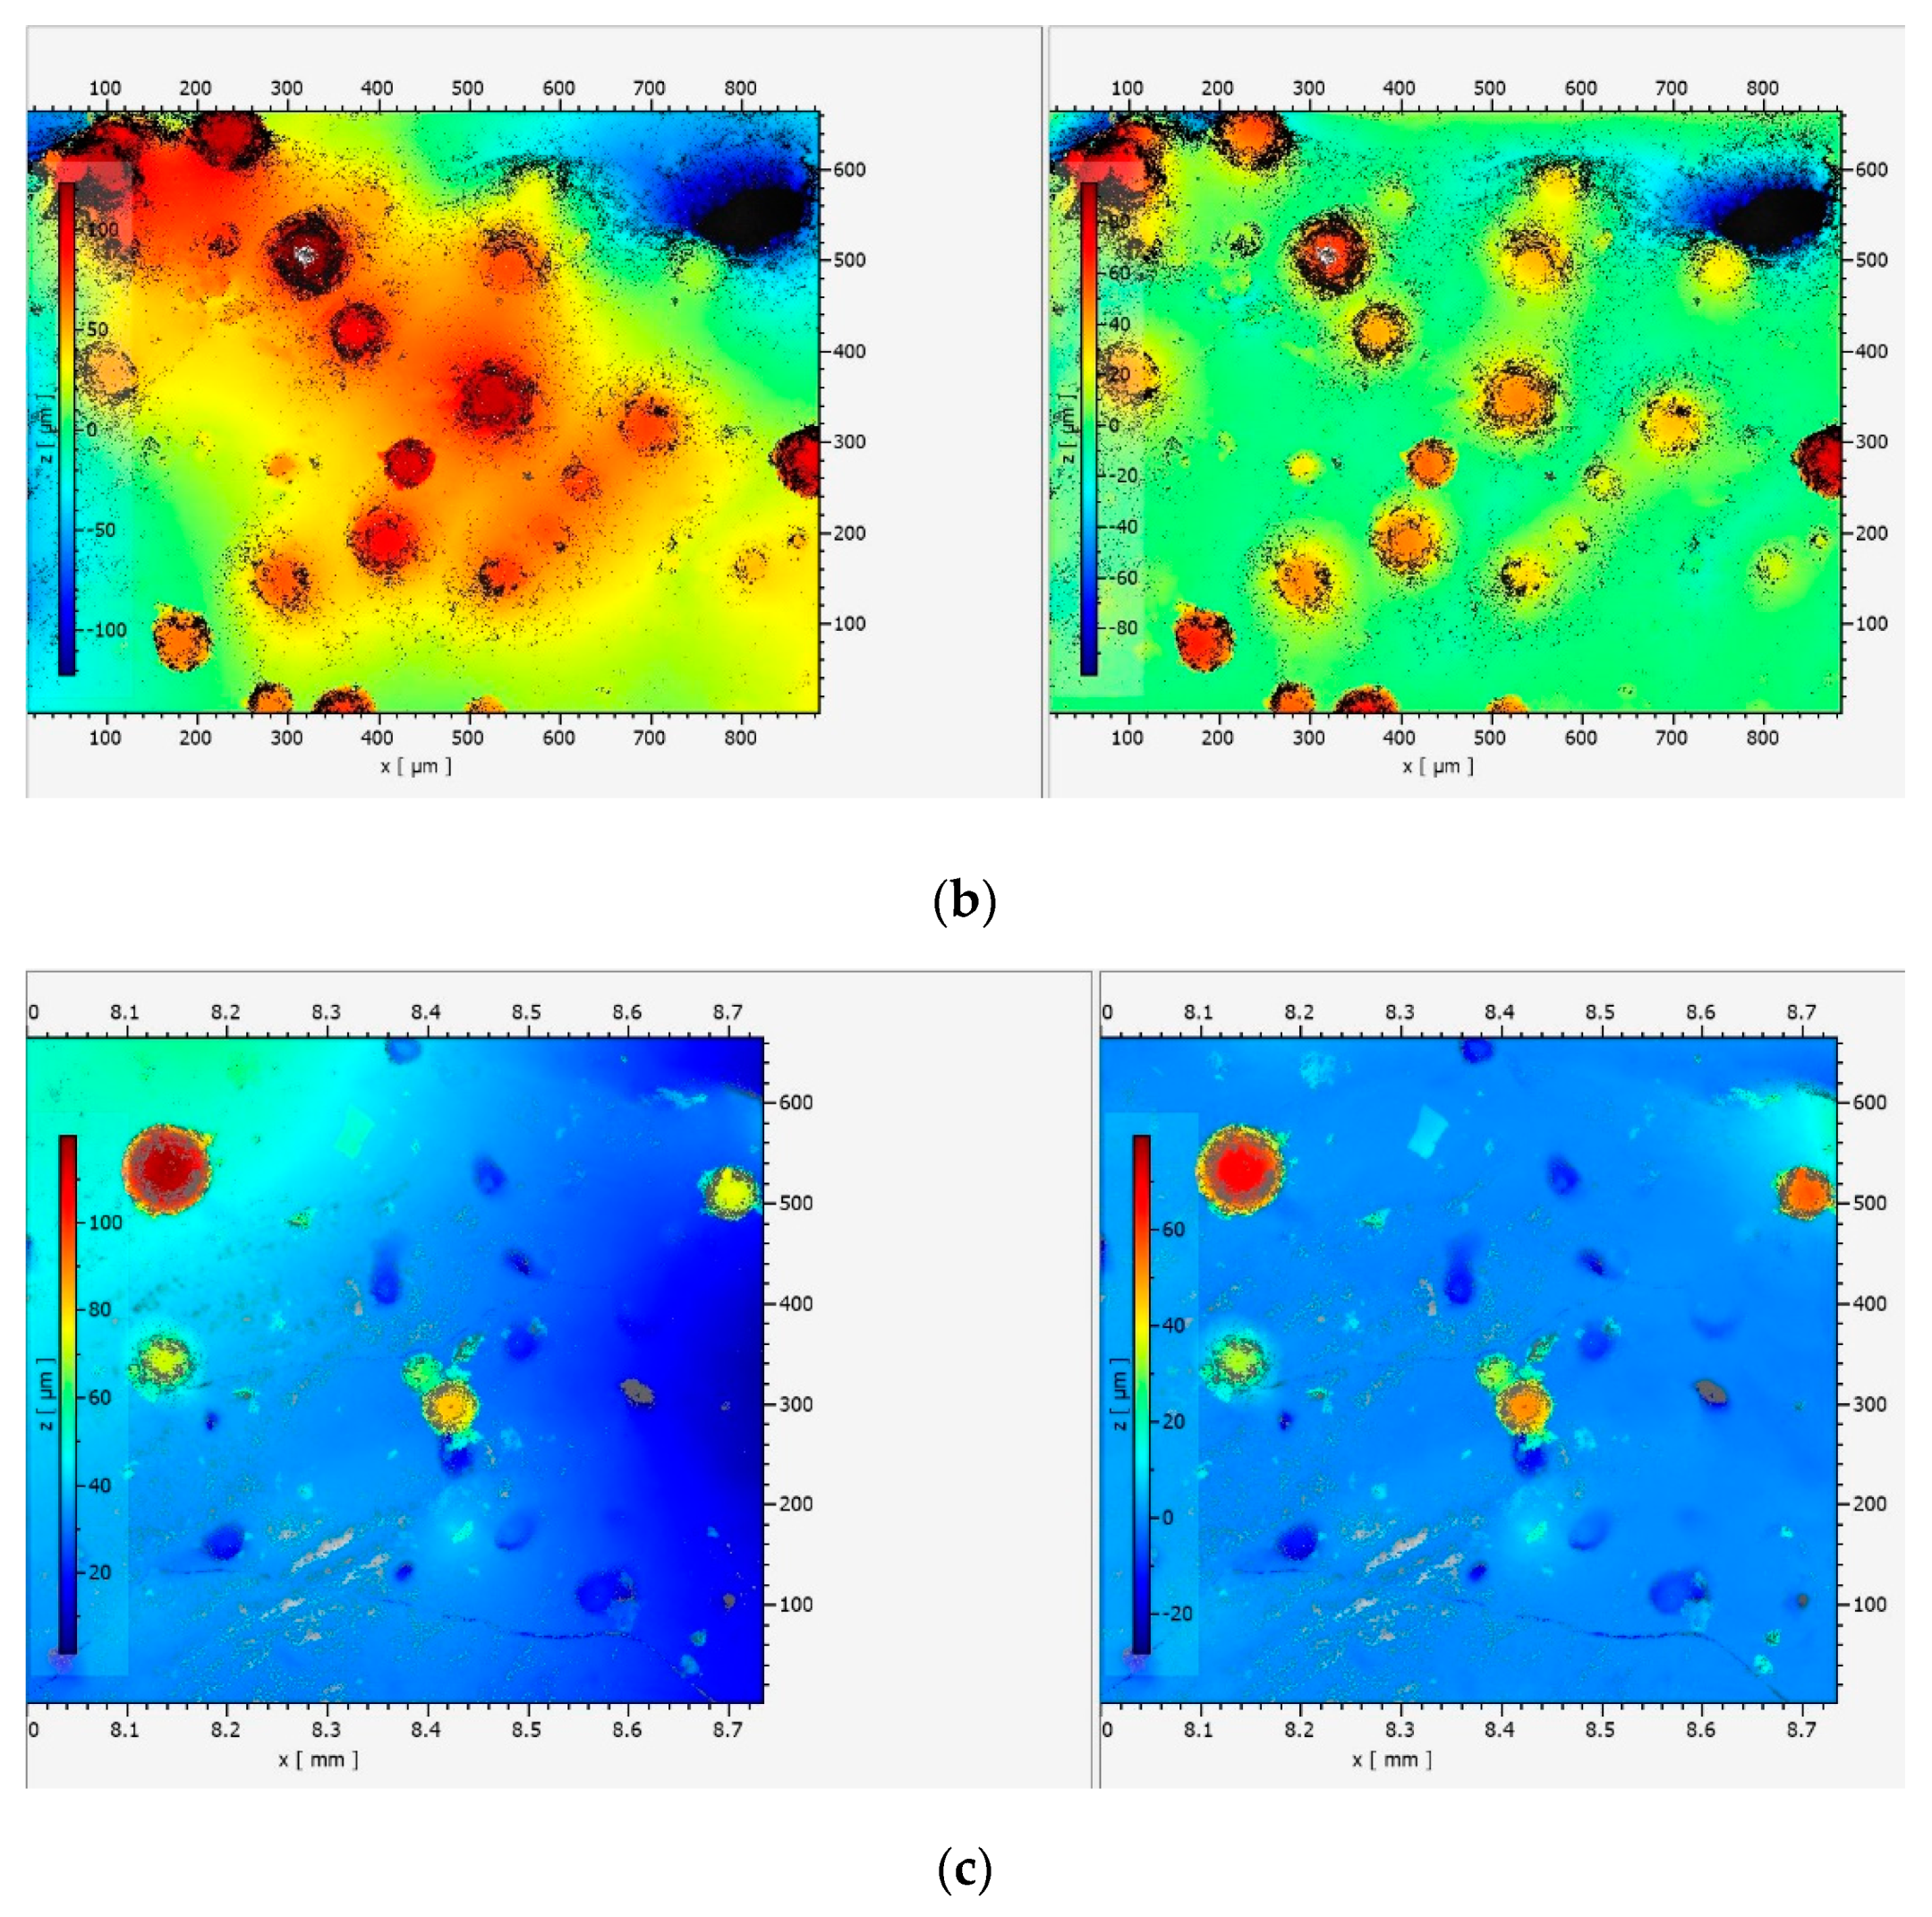
3.1. 3D Topography Features
3.2. Surface Area Features Measurement
4. Quality Assessment Based on Surface Features
5. Manufacturing Process Monitoring and Quality Control
6. Conclusions
Author Contributions
Funding
Institutional Review Board Statement
Informed Consent Statement
Data Availability Statement
Acknowledgments
Conflicts of Interest
References
- Thomas, T.R. Roughness and function. Surf. Topogr. Metrol. Prop. 2013, 2, 14001. [Google Scholar] [CrossRef]
- Benardos, P.G.; Vosniakos, G.-C. Predicting surface roughness in machining: A review. Int. J. Mach. Tools Manuf. 2003, 43, 833–844. [Google Scholar] [CrossRef]
- Senin, N.; Thompson, A.; Leach, R. Feature-based characterisation of signature topography in laser powder bed fusion of metals. Meas. Sci. Technol. 2018, 29, 045009. [Google Scholar] [CrossRef]
- Taheri, H.; Koester, L.W.; Bigelow, T.A.; Faierson, E.J.; Bond, L.J. In Situ Additive Manufacturing Process Monitoring with an Acoustic Technique: Clustering Performance Evaluation Using K-Means Algorithm. J. Manuf. Sci. Eng. 2019, 141, 41010–41011. [Google Scholar] [CrossRef]
- Hossain, M.S.; Taheri, H. In Situ Process Monitoring for Additive Manufacturing Through Acoustic Techniques. J. Mater. Eng. Perform. 2020, 29, 6249–6262. [Google Scholar] [CrossRef]
- Taheri, H.; Shoaib, M.R.B.M.; Koester, L.W.; Bigelow, T.A.; Collins, P.C.; Bond, L.J. Powder-based additive manufacturing—A review of types of defects, generation mechanisms, detection, property evaluation and metrology. Int. J. Addit. Subtract. Mater. Manuf. 2017, 1, 172. [Google Scholar] [CrossRef] [Green Version]
- Sames, W.J.; List, F.A.; Pannala, S.; Dehoff, R.R.; Babu, S.S. The metallurgy and processing science of metal additive manufacturing. Int. Mater. Rev. 2016, 6608, 1–46. [Google Scholar] [CrossRef]
- Leach, R. Metrology for Additive Manufacturing. Meas. Control 2016, 49, 132–135. [Google Scholar] [CrossRef] [Green Version]
- Townsend, A.; Senin, N.; Blunt, L.; Leach, R.K.; Taylor, J.S. Surface texture metrology for metal additive manufacturing: A review. Precis. Eng. 2016, 46, 34–47. [Google Scholar] [CrossRef] [Green Version]
- Chen, Z.; Wu, X.; Tomus, D.; Davies, C.H.J. Surface roughness of Selective Laser Melted Ti-6Al-4V alloy components. Addit. Manuf. 2018, 21, 91–103. [Google Scholar] [CrossRef]
- Sanaei, N.; Fatemi, A.; Phan, N. Defect characteristics and analysis of their variability in metal L-PBF additive manufacturing. Mater. Des. 2019, 182, 108091. [Google Scholar] [CrossRef]
- Yadroitsev, I.; Smurov, I. Surface morphology in selective laser melting of metal powders. Phys. Procedia 2011, 12 Pt 1, 264–270. [Google Scholar] [CrossRef] [Green Version]
- Khorasani, M.; Ghasemi, A.; Awan, U.S.; Hadavi, E.; Leary, M.; Brandt, M.; Littlefair, G.; O’Neil, W.; Gibson, I. A study on surface morphology and tension in laser powder bed fusion of Ti-6Al-4V. Int. J. Adv. Manuf. Technol. 2020, 111, 2891–2909. [Google Scholar] [CrossRef]
- Delfs, P.; Tows, M.; Schmid, H.J. Optimized build orientation of additive manufactured parts for improved surface quality and build time. Addit. Manuf. 2016, 12, 314–320. [Google Scholar] [CrossRef]
- Newton, L.; Senin, N.; Smith, B.; Leach, R. Feature-based characterisation of evolving surface topographies in finishing operations for additive manufacturing. In Proceedings of the 18th International Conference and Exhibition (euspan), Venice, Italy, 4–8 June 2018; pp. 489–490. [Google Scholar]
- Thanki, A.; Witvrouw, A.; Haitjema, H. Effect of process parameters on the surface topography formation in precision additive metal manufacturing. In Proceedings of the Euspen 20th Interfantional Conference & Exhibition, Northampton, UK, 8–12 June 2020. [Google Scholar] [CrossRef]
- Nagalingam, A.P.; Vohra, M.S.; Kapur, P.; Yeo, S.H. Effect of cut-off, evaluation length, and measurement area in profile and areal surface texture characterization of as-built metal additive manufactured components. Appl. Sci. 2021, 11, 5089. [Google Scholar] [CrossRef]
- Saboori, A.; Gallo, D.; Biamino, S.; Fino, P.; Lombardi, M. An overview of additive manufacturing of titanium components by directed energy deposition: Microstructure and mechanical properties. Appl. Sci. 2017, 7, 883. [Google Scholar] [CrossRef] [Green Version]
- Gibson, I.; Rosen, D.; Stucker, B. Additive Manufacturing Technologies, 3rd ed.; Springer: New York, NY, USA; Heidelberg, Germany; Dordrecht, The Netherlands; London, UK, 2020. [Google Scholar]
- Holman, J.P. Heat Transfer; McGraw-Hill: New York, NY, USA, 1986. [Google Scholar]
- Li, R.; Liu, J.; Shi, Y.; Wang, L.; Jiang, W. Balling behavior of stainless steel and nickel powder during selective laser melting process. Int. J. Adv. Manuf. Technol. 2012, 59, 1025–1035. [Google Scholar] [CrossRef]
- Mahamood, R.M.; Akinlabi, E.T. Scanning speed and powder flow rate influence on the properties of laser metal deposition of titanium alloy. Int. J. Adv. Manuf. Technol. 2017, 91, 2419–2426. [Google Scholar] [CrossRef]
- Kumar, P.; Farah, J.; Akram, J.; Teng, C.; Ginn, J.; Misra, M. Influence of laser processing parameters on porosity in Inconel 718 during additive manufacturing. Int. J. Adv. Manuf. Technol. 2019, 103, 1497–1507. [Google Scholar] [CrossRef]
- Everton, S.K.; Hirsch, M.; Stravroulakis, P.; Leach, R.K.; Clare, A.T. Review of in-situ process monitoring and in-situ metrology for metal additive manufacturing. Mater. Des. 2016, 95, 431–445. [Google Scholar] [CrossRef]


| Process Condition Number | Description | Abbreviation |
|---|---|---|
| Condition 1 | Optimum (Normal) | C1 |
| Condition 2 | Low Laser Power | C2 |
| Condition 3 | Low Powder Feed | C3 |
| Sample Number | C11, C12 | C21, C22 | C31, C32 |
|---|---|---|---|
| Manufacturing Processing Condition | Normal | Low Power | Low Powder |
| Sa [μm] (average value over the area) | 5.1 | 10.3 | 2.3 |
| Standard deviation [μm] | 2 | 2.9 | 0.7 |
Publisher’s Note: MDPI stays neutral with regard to jurisdictional claims in published maps and institutional affiliations. |
© 2022 by the authors. Licensee MDPI, Basel, Switzerland. This article is an open access article distributed under the terms and conditions of the Creative Commons Attribution (CC BY) license (https://creativecommons.org/licenses/by/4.0/).
Share and Cite
Lee, J.; Hossain, M.S.; Taheri, M.; Jameel, A.; Lakshmipathy, M.; Taheri, H. Characterization of Surface Topography Features for the Effect of Process Parameters and Their Correlation to Quality Monitoring in Metal Additive Manufacturing. Metrology 2022, 2, 73-83. https://doi.org/10.3390/metrology2010005
Lee J, Hossain MS, Taheri M, Jameel A, Lakshmipathy M, Taheri H. Characterization of Surface Topography Features for the Effect of Process Parameters and Their Correlation to Quality Monitoring in Metal Additive Manufacturing. Metrology. 2022; 2(1):73-83. https://doi.org/10.3390/metrology2010005
Chicago/Turabian StyleLee, Jinsun, Md Shahjahan Hossain, Mohammad Taheri, Awse Jameel, Manas Lakshmipathy, and Hossein Taheri. 2022. "Characterization of Surface Topography Features for the Effect of Process Parameters and Their Correlation to Quality Monitoring in Metal Additive Manufacturing" Metrology 2, no. 1: 73-83. https://doi.org/10.3390/metrology2010005
APA StyleLee, J., Hossain, M. S., Taheri, M., Jameel, A., Lakshmipathy, M., & Taheri, H. (2022). Characterization of Surface Topography Features for the Effect of Process Parameters and Their Correlation to Quality Monitoring in Metal Additive Manufacturing. Metrology, 2(1), 73-83. https://doi.org/10.3390/metrology2010005