1. Introduction
Behavior mapping is the systematic observation of people using their environments. Behavior mapping enables the real-time recording of patterns of people’s use of public space and its infrastructure. The technique can reveal what people do in these spaces, how users’ activities relate to each other spatially, and how the space supports or hinders people’s activities. Data from this method enable: (1) efficient and informed design and management of public space and its infrastructure; and (2) a greater understanding of the engagement by the community with regularly frequented places. This information provides an evidence base for community development authorities and is invaluable to city planners and other built environment professionals (e.g., urban designers, landscape architects) in understanding how space is used and how to meet the needs of users.
Behavior mapping has been used intermittently since the 1960s and remains a relevant method for evaluating people/place relationships in both private and public contexts. Digital versions of the method are now in use [
1,
2,
3], but the traditional deployment of research or practitioner teams, with maps and log-sheets, also remains relevant. Behavior mapping provides city planners and designers with a rich set of findings that can assist them to articulate both the social and physical dimensions of any place, pre-and post-intervention, in the built environment.
In many cities there can be tension between community members and the use of public spaces. A typical problem is insufficient public open space or infrastructure to support social use. Where there are spaces, some have no obvious function nor public affordance. The landscaping and urban small-scale infrastructure can be absent, out-of-date, inferior quality or poorly maintained. In many locations, the infrastructure is in the wrong location or hard to access via public transport and accordingly is not well used. Some spaces are simply not accessible for people with all abilities. At times, urban infrastructure is unsafe—this may result from poor maintenance or private/public partners failing to make consistent investment in the space. Together, these considerations represent the many reasons why public spaces can fail in their usability and why people are not present in them.
In this entry, recently completed research referred to as the Smart Social Spaces project is used as a vehicle to illustrate the usefulness of behavior mapping as a method for understanding the relationships between people and public space in cities. The Smart Social Spaces project was designed to improve amenity in two public spaces: a park (Olds Park, Penshurst) and a square (Memorial Square, Hurstville) in the Georges River Council local government area (LGA) in Sydney, Australia. The two sites selected represented different forms of public space: a green open space and a constructed urban square. Also, both sites represented active, socially successful public spaces which were well utilized by their surrounding communities. One of the aims of the project was to understand the patterns of community use of both spaces before and after adding a new technological overlay of amenity to the public infrastructure available. Behavior mapping was used as the central method to assess these interventions and their impact on people’s use of these spaces. For the purpose of this discussion, the process of behavior mapping and its analysis will be discussed in relation to Olds Park as only one site is needed to demonstrate the value of the method for city planners and designers.
The journey of this discussion includes an outline of behavior mapping as a method, its theoretical origins and its strengths and limitations. It describes its use in the Smart Social Spaces project and demonstrates the data and findings that can be produced using this method which supports built environment professionals’ understanding of people’s use of place.
2. Theoretical Foundations
The Tradition of People and Place Studies in Cities
The public domain—parks, plazas and streetscapes—are key components of a city’s public realm and collectively, make cities and their suburbs more livable, productive and socially sustainable. These spaces are a part of a city’s system of functions and flow of pedestrian and vehicle traffic. They also afford a social place for public life, where people meet, play, and work together. They represent both public and private interests and contribute to a city’s character, amenities, image, sense of a place, identity and aesthetics. Scholars from different disciplines, e.g., [
4,
5,
6,
7], have variations in their definitions of ‘public space’, ‘public realm’, ‘open space’ and ‘public domain’. For the purposes of this discussion, the public domain is simply defined as green and/or grey open spaces within cities. This includes parklands, playgrounds, foreshores, laneways, streetscapes, plazas and more temporary installations like parklets in an urban environment [
8,
9].
The study of people’s use of urban public space is an interdisciplinary tradition that has continued since the 1970s through researchers and urbanists such as: Cooper Marcus and Francis [
10], Gehl [
6], Jacobs [
11], Lynch [
12], Putnam [
13], Sandercock [
14] and Whyte [
15]. Key writers of cultural and human geography who are interested in population patterns and changes in cultural diversity, gender, and demography include: Amin and Thrift [
16], Donald [
17], Fincher and Iveson [
18], Massey [
19], and Tuan [
20]. Key anthropologists and sociologists who explore the cultural and social practices of populations, patterns of cultural traditions, and the norms and values of societies include: Giddens [
21], Harvey [
22], Low [
23] and Sennett [
24], to name a few. Some key environment–behavior researchers interested in the behavior, motivations, perceptions and cognitive processes of people and their influence on environment–behavior interactions include: Altman [
25], Barker [
26], Gifford [
27], Proshansky [
28], Rapoport [
29] and Sommer [
30]. These key thinkers, and others, have built a body of relevant literature to help us understand the social and human characteristics of people and the dynamics of their societies which is essential for understanding the more complex and intimately entwined relationship of people and place.
As Sanoff [
31] argued, we must understand the built environment as a social expression. Physical environments are a reflection of the values, beliefs, and cultural practices of a society and the study of our environments can never be simply about the physical characteristics of a place. The environments we build are an expression of the society that builds them. Therefore, the physical environments that we construct are as much a social phenomenon as they are a physical one. It is not possible to understand the physical settings in which we live without understanding the lives of the human populations in them and their cultural and social patterns, values, and beliefs [
32].
In the tradition of people–place studies, people are viewed as having a series of competencies (e.g., intelligence, skills and abilities) and describable characteristics (e.g., cultural background, age, gender, sexuality, beliefs and values) which they bring to all environments. Likewise, any environment has a series of describable characteristics (e.g., microclimate, form, function, aesthetics, light, smell and sound) which can be understood as a series of demands or supports for the people using it [
11,
33]. People’s behavior can be understood as an expression of both these sets of characteristics working together–or not [
29,
33]. In his work with the elderly and their environments, Lawton [
33] calls this the ‘environmental press’. In his model, the nature of the environment is in direct relationship to the individual’s comfort and performance, resulting in zones of maximal comfort and performance, outside of which the relationship between the individual and their environment becomes progressively problematic for one or the other. Although this model is population specific, it is useful for indicating the intimacy of the relationship between people and place (literal, psychological, and emotional) which city-makers are manipulating each time they design and build an environment of any scale. As has long been argued in the design professions, design is a social act. Creating a built environment must be understood as a social act with social consequences [
31]. It also must be understood as a social process which should have social involvement [
30].
3. Introduction to Behavior Mapping as a Method for Analysing People’s Use of Public Spaces
Behavior mapping is the systematic observation of people using their environments [
34]. It can be used to ascertain what people do, how their activities relate to each other spatially, and how the space under investigation supports people’s activities. Behavior mapping can identify where attributes of environments fail to support people’s use, as well as indicate how popular areas are within an environment. The method enables the identification of the overall use, and its variation, within an environment such as a park. Furthermore, it can indicate how the design of an environment inadvertently creates areas of no use or areas that become the subject of misuse. It can also record movement patterns and path preferences through a site. Information about site usage is important to understanding the social dynamics of a place and the role of the place within those social dynamics. This technique is best used in partnership with other techniques such as new techniques for understanding place including geosocial media data such as Google Map reviews and geotagged photos on Instagram, and people-centred research techniques, such as interviews or focus groups, as it can supplement what people say with an observation of what they actually do. It certainly has limitations as a technique in that it cannot ascertain people’s motivations for what they are doing and why they are doing it, nor can it reveal anything about people’s subjective experience of place. Using supplementary techniques such as interviews can greatly enhance the value of behavior mapping as they can support the observations with an understanding of people’s motivations for what was observed.
As Zeisel [
35] (p. 112) states, ‘observing behavior is empathetic and direct, deals with dynamic phenomena and allows researchers to vary their intrusiveness in a research setting’. The advantages of this method are that people’s behavior in place can be viewed and recorded ‘uncensored’ by the people themselves. For example, people in an interview may be hesitant to state that they regularly flout formal rules, but observing them unobtrusively doing so as part of a larger social group who socially sanctions such behavior does not worry them. Likewise, the behavior of people is not static, and behavior mapping has the capacity to record and respond to the change in activities that occur on site. A site may be large and require observation from multiple vantage points which this technique can also accommodate.
The technique itself is not new. It has been used since the 1960s by environment–behavior researchers, in particular, for understanding the relationship between people and place [
36]. Many early researchers from varying disciplines, who focused on the public life of cities, establishing the underlying principles of the relationships between people and their cities, used observation. These researchers who are well recognized in planning and design include Whyte [
15], Cooper Marcus and Francis [
10], Gehl [
6], and Gehl and Svarre [
37]. As Project for Public Spaces advises [
38] (p. 51), “when you observe a space you learn about how it is actually used rather than how you think it is used”.
The difference between simple observation and behavior mapping is the level of rigor and systematization involved in the latter which is needed to build up a trustworthy dataset. Researchers have used behavior mapping to study people’s activities in a range of contexts: schools [
39,
40], neighborhood open space, [
41], aged person’s housing [
42], hospitals [
43], grocery stores [
44] and urban squares [
45].
Theoretically, behavior mapping is grounded in two key concepts developed by some of the early ecological psychologists: Gibson’s Theory of Affordances [
46] and Barker’s Theory of Behavior Settings [
26]. Environmental affordances are recognizable features of the environment that indicate to people how to act [
46]. Recognizing affordances means identifying how the physical environment could influence individuals’ activities or behavior. Behavior settings consist of both physical locations and contexts and the social worlds within them. It is the precise combination of both that Barker [
26] argues shapes, but does not determine, behavior because these complete worlds indicate the expected behavior (e.g., a restaurant, a library, a sports field). These two early theories underpin behavior mapping and its motivation. Behavior is an expression of both the physical opportunities to act, and a supportive social context which facilitates it, in combination. Mapping behavior enables the relationships between these two driving environments to be identified. Environment–behavior researchers would argue that it is not possible to understand either the nature of the physical context or the behavior of people on their own. They must be understood in relationships [
26,
29,
34]. This technique enables this relationship to be revealed.
The Limitations of Behavior Mapping
It is not possible to understand the role of individual perception, judgement or motivation through using this technique. Accordingly, the observation made cannot include inference or assumption and is only a literal record of what was observed. There are other limitations including:
To ensure consistent and quality data collection, it is critical that observers are rigorously trained. The required training encompasses the coding strategy for behavior, how to notate movement, how to record demographic data, how to fill in both the map and the log-sheet so that descriptors and map keys are systematized and shared by the whole team. Training must include practice runs which are then discussed to ‘iron out’ idiosyncrasies and to agree on standard notation. It is also essential that the coding framework developed for the observations is well understood and applied consistently. This ensures that the same types of behavior and activity are always coded consistently across the research team [
48]. A fieldwork protocol, which anticipates data collection challenges and outlines the sequence of expectations for reporting-in during field work, is also essential.
We now proceed to demonstrating the use of behavior mapping in the Smart Social Spaces Project.
4. Illustrating the Use of Behavior Mapping: The Smart Social Spaces Project
Local councils need effective, affordable, and relevant smart systems (such as asset management systems) to provide reliable evidence to inform open space planning, urban design and public infrastructure decisions. Smaller LGAs are typically “lower-tech” and cannot afford complicated, outsourced, technical infrastructure needed to run a ‘smart city management system’. Nevertheless, most would like to participate in the new ‘smart cities’ movement. Addressing these issues for smaller local governments was part of the aim of the Smart Social Spaces project. We were also focusing on social issues such as isolation and loneliness, the need for social connection, and the need to find ways to provide equitable access to the global technological conversation for all community members.
The project was designed to advance our understanding on all of these matters, as well as testing new smart street furniture. The overarching aims were to establish how technology can:
Enable efficient and informed management of public space and its infrastructure in a local government precinct. Sensors on street furniture have the capacity to provide information to LGAs that is useful in the management of that infrastructure.
Enable greater engagement by the community with everyday places and with each other.
Citizen involvement in the systems of local governance empowers residents to be active members of the community and to feel a sense of belonging to the local area. Technology provides people with unprecedented access to social processes and to have their say in them. It also provides unprecedented access to each other as members of the same community.
In this project, we used smaller-scaled initiatives and off-the-shelf products to demonstrate how smaller LGAs can benefit and afford to participate. We used social media mapping, behavior mapping and digital IoT (Internet of Things) sensors installed on street furniture to record real-time use of urban furnishings in two public spaces.
The project was the result of a collaboration between the University of NSW, Sydney, Australia, the Georges River Council (LGA) Sydney, Australia, and a street furniture company, Street Furniture Australia.
4.1. Olds Park: Forrest Road, Penshurst, Sydney, Australia
Olds Park, Penshurst was selected as the urban park for this research project because it is one of the most well-used urban parks in the district, offering a set of active formal and informal recreational zones to observe throughout the week and weekend. It is 123,100 m2 in area. It is a heavily used park for formal sports and also offers opportunities for informal recreation and play. Furthermore, it is adjacent to the community library. Its active zones include sports grounds and facilities such as basketball courts, barbeque areas, two playgrounds and a walking track around the park’s perimeter. The park is well used daily by the local community for essential activities such as walking the dog and other exercise. The broader community uses the park on weekends for informal recreation and organized sports.
Sub-Sites Selected for Observation
Several dominant activity zones were identified as sites for the behavior mapping exercise because they represented the most active areas in the park. These included: the library area; the main barbeque area; the main sports grounds.
Figure 1 provides a plan of the park and its features and identifies the three key areas observed.
5. The Role of Behavior Mapping in this Project
In the Smart Social Spaces Project, behavior mapping was used to establish a before and after picture of the two public spaces selected for the study (Olds Park and Memorial Square Plaza). The Project added smart technology to these spaces, placing sensors on amenities in the space such as barbeques, seats and rubbish bins. Wi-Fi provision, USB chargers, power points and water were also added through a new piece of street furniture called the Healthy Living Hardware (HLH). The sensor technology and the HLH provided real-time data on the use of all these amenities. Ultimately, this was contrasted with the data collected through the behavior mapping exercises to see if together they provided a fuller picture of the equipment’s use.
A combination of older (behavior mapping) and newer (sensor data collection) research methodologies potentially helps to strengthen the contribution of both, with a comprehensive understanding of people’s use of public space. Behavior mapping established who was using the sites, at what times and for what purposes. The mapping was used prior to the installation of the sensor technology and the HLH, and afterwards when it had been in place for several months. Data collected from before and after installation, together with the sensor data, were used to establish whether the introduction of new technology facilitated additional use. The collected data were also used to understand how such technology can assist in the management of amenities in public spaces for both community and council benefit.
5.1. Fieldwork and Data Analysis for the Behavior Mapping
Behavior mapping was conducted over two weeks in March 2018 and again in March 2019. The behavior mapping was completed by a team of eight researchers. They worked in pairs, rotating around the three Olds Park observation points for a total of 1.5 h per session. The researchers spent 30 min in each of the three observation areas for a total of 1.5 h in each session. The sites were observed for the same selected time periods at set times of day in the morning, afternoon and evenings on weekdays and weekends.
Table 1 shows the schedule and session times for the behavior mapping sessions in both field work periods in 2018 and 2019. Both patterns ran for two weeks. One weekday morning session in Round 1 and one weekend afternoon session in Round 2 were cancelled due to rain.
Observations were undertaken by researchers working in pairs using a map and coded log-sheet. The map revealed the density of use by area and the movement paths through the site. The log sheet revealed who was visiting the site, what they were doing and the duration. Although behavior mapping is a quantitative technique, supplementary qualitative notes are often created in each observation session, establishing the weather conditions, the site conditions and anything notable or unusual that materializes on site during the recording session. This was also carried out.
The data were analysed using SPSS software. A simple coding system for behavior and related activities was created to inform both data collection and analysis. The types of behavior were derived from existing classifications in the literature [
10,
26,
37] and added to as the fieldwork progressed. Below is the final list of behavior types:
Functional—walking, shopping, cleaning or clearing up, maintenance work, setting up events.
Social—hanging out with friends, playing games, playing with family, stopping to talk, picnicking.
Physical—deliberately using on-site features or manipulating/altering site features (listed at the time), e.g., the playground, the exercise equipment,
Other—antisocial (list at time), e.g., urinating, throwing up, spitting, loud and threatening behavior; vandalism, violence.
The team of observers were trained to notate their maps and log-sheets consistently and to use the coding system created for the project to help standardize their records. As they accumulated across the two-week collection periods, each team submitted their records to the fieldwork coordinator periodically to ensure quality and consistency.
5.2. Findings from the Behavior Mapping Processes in the Smart Social Spaces Project
The data from this method were used to create a picture of people’s use of the site before new technological interventions took place in it and after these interventions had been in place for several months. The data from the first round of observations revealed the basic patterns of use and the data from the second round of observations confirmed these patterns of use and looked for any new patterns associated with the new amenities and services that had been added to each site. New inclusions of street furniture on each site encompassed new seating arrangements, new BBQs, an HLH pole at each site and smart bins.
5.2.1. Examples of the Data That Emerged from the Process of Behavior Mapping for Olds Park
Following the collection period, schematic maps representing the accumulated data for each session in every place were created.
Figure 2 depicts the schematic diagram for all the maps from all weekday afternoon sessions at one of three observation points–the Library Area–within Olds Park. These schematic diagrams attempt to account for all individual observations made in this area, during this session time, across the two-week period. However, more importantly, the diagram illustrates patterns of use and the representation of population density on the site. These diagrams are most useful in indicating the popular, busy areas with the more isolated and seemingly unpopular areas within a site and the type of user: individuals (male or female) versus groups. In Olds Park, the busiest areas are the perimeter walking track, the playground and the picnic tables. The map depicts men (purple dots), women (pink dots) and mixed-gender groups (green dots). The placement of the dots indicates where the people were first observed on the site. The colored lines reflect the same gender differences and group versus individual indications as the dot colours, but they indicate paths of travel through the site during the observation sessions.
The data from the corresponding log-sheets is entered into SPSS, which supports the development of charts and diagrams summarizing and assisting the analysis of the data collected.
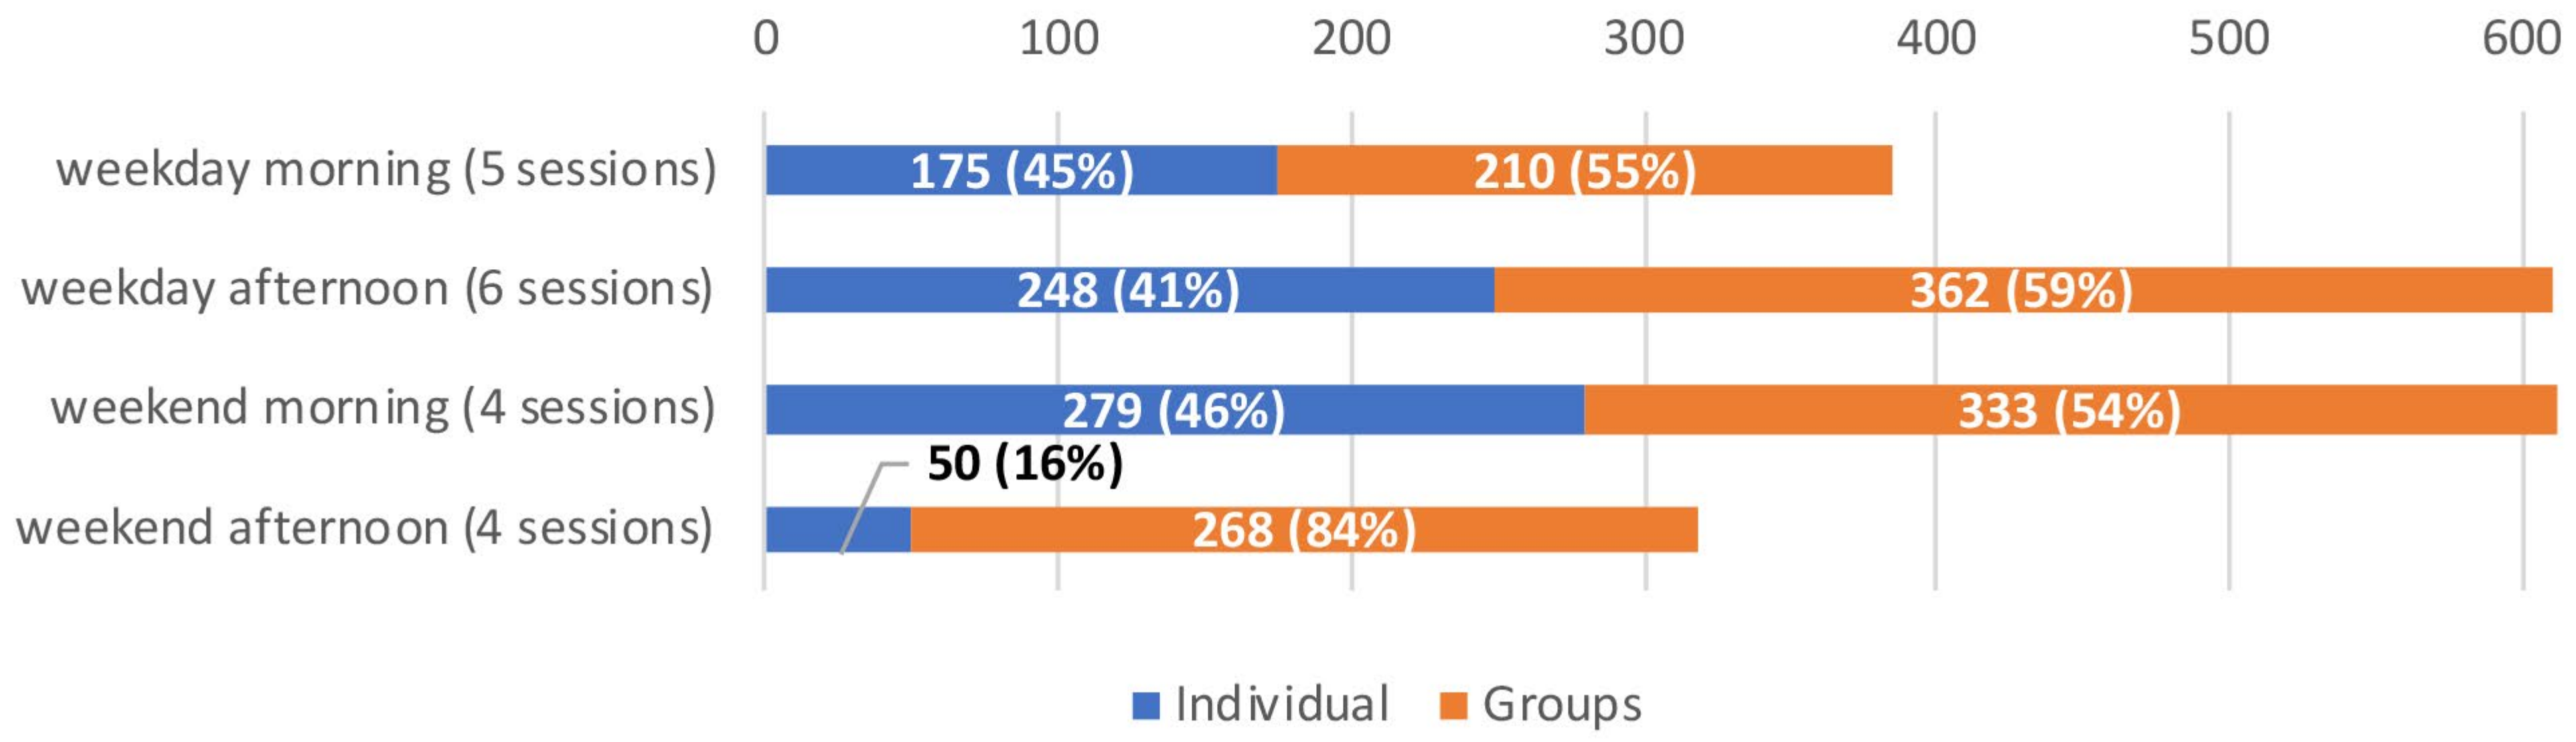
Figure 3 shows the distribution of people visiting Olds Park as individuals versus groups across weekend and weekday morning and afternoon sessions during the first data collection period. Weekday afternoons and weekend mornings were the heaviest use times. Weekend afternoons were the lowest use-period. This might be related to this time period corresponding to the hottest temperatures recorded during the observation sessions.
Ultimately, the processing and analysis of the data enables more complex depictions of the people/place relationships on a site.
Figure 4 illustrates the overall breakdown of activity types and specific activities within those types, in Olds Park for the 2018 two-week period. Detailed breakdowns such as this one offer city planners and designers important insights into how a site is valued by its community, for what functions and for what periods of time. This provides substantial background information on any site and enables professionals to make decisions about changes to a site in the full knowledge of what is potentially at stake.
In
Figure 5 it is possible to see both the overall picture of activities in the park and the percentage of new activity associated with each of the new pieces of furniture. Through the behavior mapping exercise, we were able to ascertain how much these facilities were being used and by whom. In the second round we trained the mapping team to focus on the areas where new equipment was installed, so as to capture a more detailed picture of its use. While our interventions were relatively small and unlikely to result in radical shifts in use of, or behavior within the entire park, this graph demonstrates that it is possible to use behavior mapping to create a broad, and at the same time, a focused picture of use of the built environment.
5.2.2. Developing a Detailed Picture of the Use of the New Smart Furniture
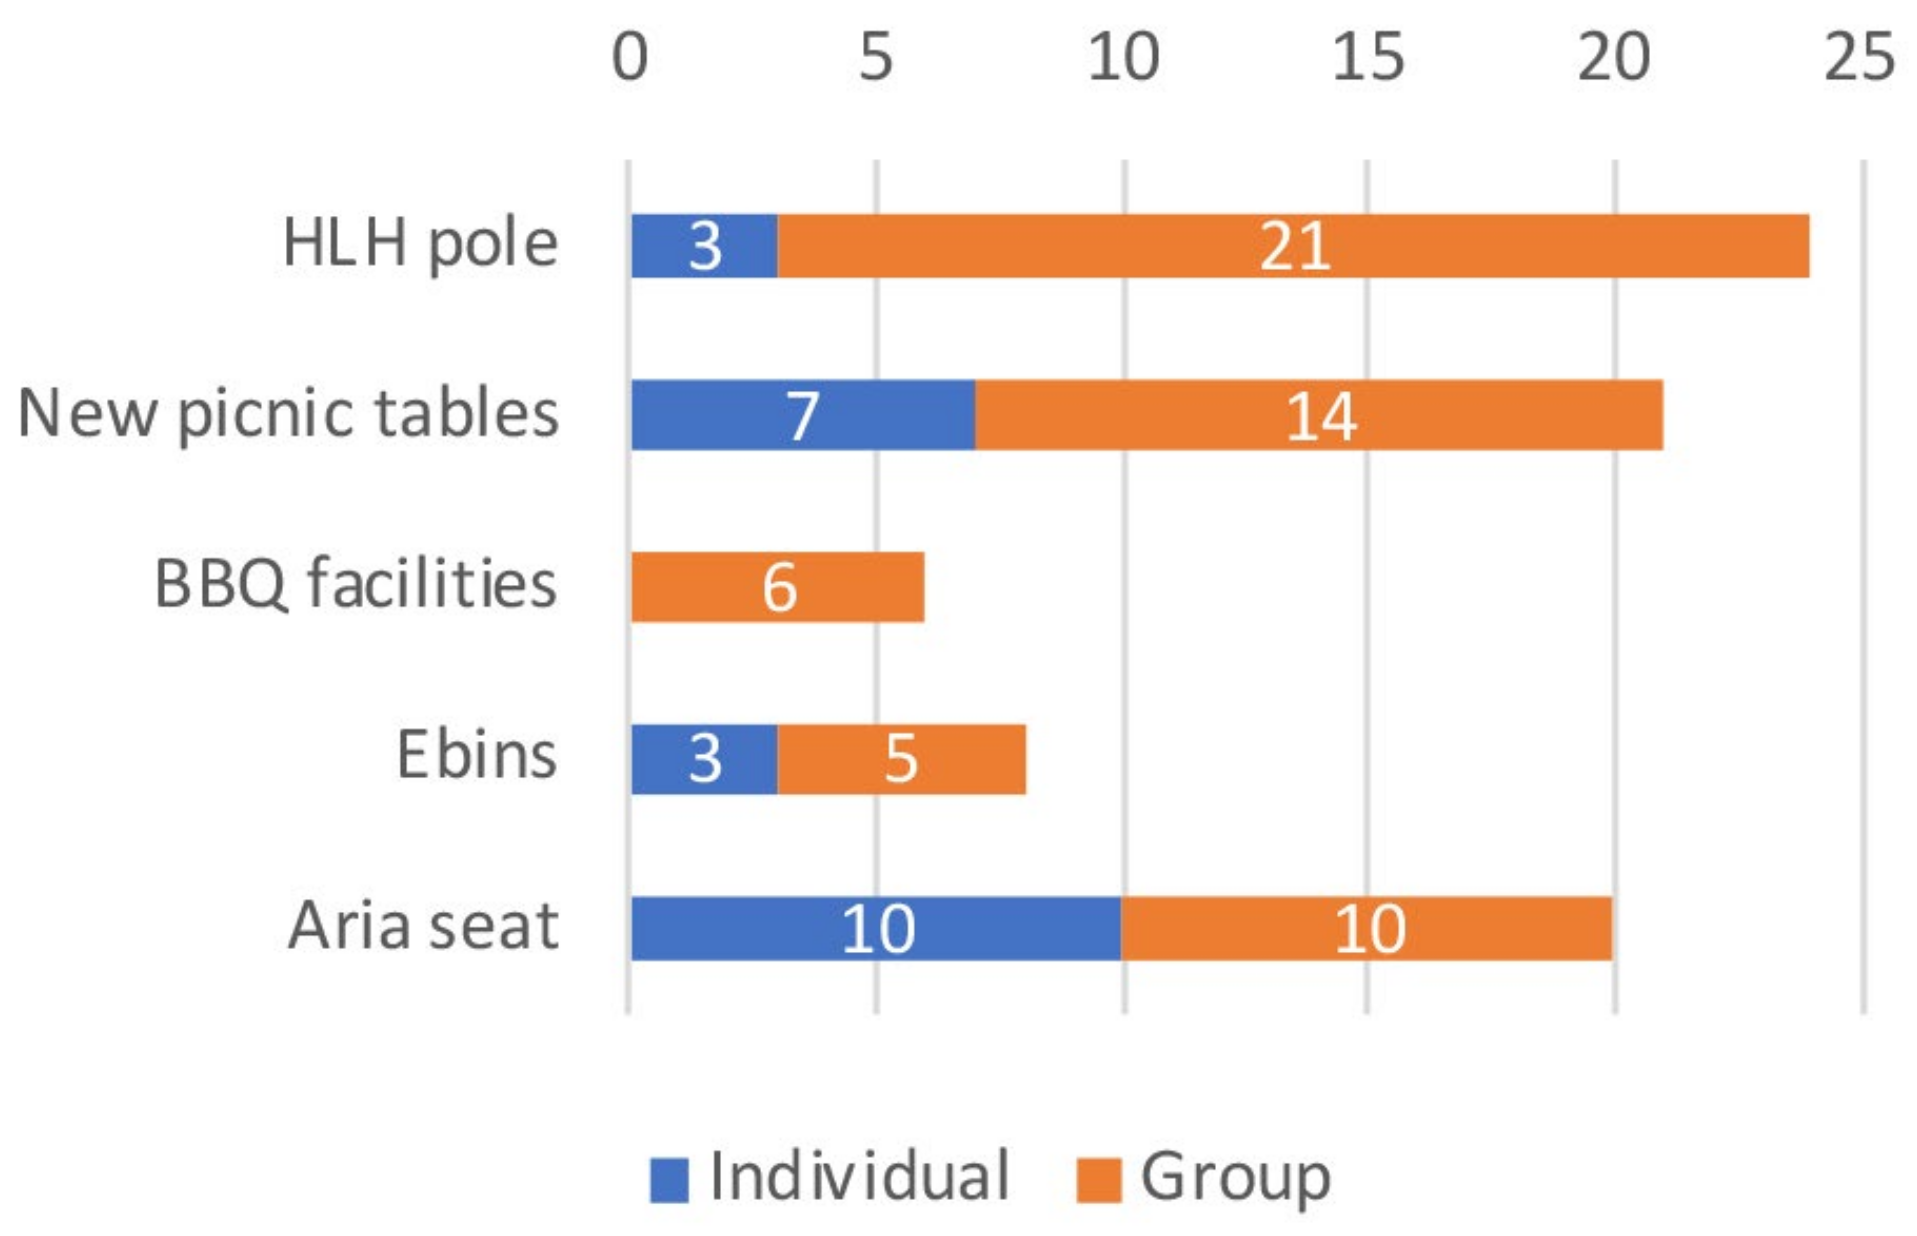
As stated earlier, the new facilities included smart street furniture such as the HLH pole, picnic tables, BBQ facilities (retrofitted with a power draw meter), smart rubbish bins (ebins), and the PowerMe table (a small table that offers wireless phone charging) embedded in an Aria seating system (a product from Street Furniture Australia). Cafe tables and stools without smart features were installed but not counted in the results below. Activities associated with new smart furniture include sitting, chatting, watching sports, eating/drinking, using a phone, obtaining water (from the HLH), looking around, and using the ebin. Through the behavior mapping data, it is also possible to identify multiple types of variation in the end users.
Figure 6,
Figure 7,
Figure 8 and
Figure 9 offer different breakdowns of who was using each facility by type, time of day and demographics.
From this group of figures, it can be seen that the HLH pole was used only on the weekdays and primarily by children. The new picnic tables and the Aria seat were used mostly by adults, while the HLH pole and BBQ facilities were used mostly by groups. This level of information supports local authorities needing detailed information about usage of space. This cluster of figures demonstrates that behavior mapping makes it possible to drill down significantly into the relationship between built environment attributes and end users.
5.2.3. Overall Summary of Findings from the Second Round of Behavior Mapping for Olds Park
Although no attempt has been made in this discussion to present all the data that emerged from each of the two collection periods, the final summary of findings from collection period two is offered to demonstrate the fine grain nature of reporting that is possible using behavior mapping. Below is an excerpt from the final report [
49] (p. 34):
People and activities
Olds Park is utilized consistently across the week (average 61 people/session) with a greater use on the weekends (average 105 people/session). Adults made up the majority of users (74%) and men use it more than women (57% vs. 41%). The majority of visitors come in groups (63%) rather than on their own (37%). Functional activities (45%) represented the most common activity observed on site and this was predominantly associated with walking both on and off the path (29%). Physical/place-based (26%) activities and social/recreational (19%) were the next highest type of activities recorded. The most used area of the park was the circuit path (37.9%), followed by the oval (8.8%), stand (8.4%), and the cricket pitch area (8.0%).
Smart furniture and place activation
The new facilities such as the BBQ and the HLH pole increased the range of recreational opportunities and amenities for visitors. The seating facilities, including shaded picnic tables (old facilities) as well as the Aria seat and park setting (new facilities), were highly used during the afternoon sessions (27 times in the afternoon sessions as compared to 14 times in the morning sessions). The HLH pole received its highest use on a sports day. It proved to function as a health-supportive facility as it was used on a Friday morning by multiple groups and individuals who were involved in a children’s sport activity in the cricket pitch area. Children were observed to be using the HLH to drink water.
Both sites selected for this study (Olds Park and Memorial Square) were chosen because they were well-used and well-liked by their local communities. Adding amenity to already well-functioning spaces is not likely to lead to a radical change in behavior or in use of a place. However, everything that was added and changed in both of the sites was well-used, including those additions such as the HLH pole, which offered new types of amenities in public spaces.
The excerpt from the final report above illustrates the breadth and depth of information that can be gained through behavior mapping about how a place functions taking into account spatial, temporal and demographic factors. For city planners and urban designers, this kind of information removes the need to estimate the impact of change or to estimate the need for change. It enables decision making to be based on evidence in real sites and real time, using population-specific information, thereby removing the need for assumption.
6. Positioning the Usefulness of the Method in City Planning and Design Practice
“Environment-behavior studies take as their basis the inseparable duality of the behavioral phenomenon and its environmental context” [
3] (p. 115). Techniques like behavior mapping offer a bridge between these two dimensions which not only provides insight into the nature of both, but the relationships happening between them on a given site. Goličnik Marušić and Marušić [
3] (p. 114) see behavior maps, “as direct links between users in places and [the] physicality and functionality of places themselves”. They argue that “addressing places via behavioral maps is an optimal scanning process which can lead towards successful decision-making and design” [
3] (p. 114).
Commenting on the purpose of behavior mapping, Bechtel, Marans and Michelson [
50] (p. 23) summarize that ‘it is to locate behavior on the map itself, to identify kinds and frequencies of behavior, and to demonstrate their association with a particular site. By associating a behavior with a certain environment, it is then possible to both ask questions and draw conclusions about the behavior and its relationship to a place’. Locating behavior on the map itself is significant in assisting designers and planners to understand the dynamics of a site in specific relation to its features. A map or plan is a universally recognized spatial tool in design and planning. Using it as a basis for this method makes the data that is produced more accessible to these professions.
The aim for contemporary urban planners and designers is to design better and more effective public spaces. The detailed observation associated with behavior mapping has the capacity to provide information on the intricate and intimate relationships between people and their environments. This will assist with every aspect of the detailed design of public space. There is no reason why the connection between design and people should be vague. As demonstrated, it is possible to understand people’s behavior in place and to ascertain their preferences for activities through an observation technique like behavior mapping. Because this technique does that in specific spatial relationship to any site, it offers a wealth of explicit knowledge on the functionality of any site which can be directly used to improve, modify or inform the redesign of a public space.
Ultimately, the aim of urban design and planning is to ensure an appropriate environment for a city’s population. Any definition of effective and successful urban design or planning has to include social dimensions regardless of whether the design brief is for a transport system or a footpath. What often undermines success is that care has been taken to understand the characteristics of the physical environment and the characteristics of the social environment, but no care has been taken to understand how the relationship plays out between them. A technique such as behavior mapping assumes this relationship and presents designers and planners with this crucial data. This enables key patterns to emerge which can reliably inform design and planning decisions.
The Manager of Strategic Placemaking, Georges River Council commented that “one of the most tangible outcomes of the behavior mapping was using this information to inform significant street scape upgrades within the Hurstville CBD” [
51] (Personal correspondence, 2022). She also commented more recently that:
Because we did so much of the consultation and like–an almost–emersion in the space, we were able to build something that was actually fit for purpose and created those great public spaces… when we got to the end of it [the Project] we were able to actually show the benefit with some data, that quantitative and qualitative data, to actually explain why engaging in this process, although quite an extensive project, was really important to creating a better space in the end [
52] (Barnes, 2023).
As Gifford [
26] (p. 543) states:
We are always embedded in a place. In fact, we are always nested within layers of place, from a room, to a building, to a street, to a community, to a region, to a nation, and to the world… Person-place influences are both mutual and crucial. We shape not only buildings but also the land, the waters, the air, and other life forms–and they shape us.
Environment–behavior researchers assume that the fundamental relationship that needs to be understood is that of person and place. They believe it is not possible to fully understand the nature and influence of one (the physical environment) without understanding the nature and influence of the other (the social environment). It is the relationships that exist between them and the dynamics within those relationships that ultimately create the people–place experience in any setting. This is the fundamental premise of theories such as Behavior Setting Theory [
26] and Affordance Theory [
46]. As a result, many of the research methods developed by this discipline begin with the assumption that this is what is worth trying to measure or at least understand. A number of these methods are useful to built environment disciplines and their practice–behavior mapping is definitely one of them. Behavior mapping as a technique is versatile, flexible, and adaptable. It can be executed simply, or it can be used to create a very complex record. It has stood the test of time and has been deployed as part of people–place research for the last six decades. It continues to offer useful insight into the relationships between people and their places which is fundamental for effective contemporary city planning and urban design practice.
Author Contributions
Conceptualization, K.B.; methodology, K.B., N.M., H.R., S.T., C.S.-W., L.C., M.P. and C.T.; analysis, K.B., H.R. and N.M.; writing—original draft preparation, K.B., N.M. and H.R.; writing—review and editing, K.B., N.M., H.R., S.T. and C.S.-W. All Figures, H.R. All authors have read and agreed to the published version of the manuscript.
Funding
This work was funded by the Australian Government, Department of Industry, Innovation and Science, and Department of the Prime Minister & Cabinet in the Smart Cities and Suburbs Program under grant number SCS59323 (2017 and 2018).
Institutional Review Board Statement
Research presented here was granted ethics approval by the UNSW Sydney Human Research Ethics Committee: approval number HC180117 on 27 March 2018; approval number HC190027 on 29 October 2019.
Data Availability Statement
Due to professional in-confidence, the data for this project are not publicly available.
Acknowledgments
The authors acknowledge industry partner Street Furniture Australia and local government partner Georges River Council.
Conflicts of Interest
The authors declare no conflicts of interest.
References
- Bahillo, A.; Goličnik Marušić, B.; Perallos, A. A mobile application as an unobtrusive tool for behavioural mapping in public spaces. In Ubiquitous Computing and Ambient Intelligence. Sensing, Processing, and Using Environmental Information; Lecture Notes in Computer Science; García-Chamizo, J., Fortino, G., Ochoa, S., Eds.; UCAmI: Misiones, Argentina, 2015; Volume 9454, pp. 13–25. [Google Scholar]
- Goličnik Marušić, B. Analysis of patterns of spatial occupancy in urban open space using behaviour maps and GIS. Urban Des. Int. 2011, 16, 36–50. [Google Scholar] [CrossRef]
- Goličnik Marušic, B.; Marušic, D. Behavioural maps and GIS in place evaluation and design. In Application of Geographic Information Systems; Alam, B.M., Ed.; IntechOpen: Rijeka, Croatia, 2012; pp. 113–138. [Google Scholar] [CrossRef]
- Corkery, L. Reclaiming and making places of distinction through landscape architecture. In Place and Placelessness Revisited; Freestone, R., Liu, E., Eds.; Routledge: New York, NY, USA, 2016; pp. 61–75. [Google Scholar]
- Carmona, M.; Tiesdell, S.; Heath, T.; Oc, T. Public Places, Urban Spaces: The Dimensions of Urban Design; Routledge: New York, NY, USA, 2010. [Google Scholar]
- Gehl, J. Cities for People; Island Press: Washington, DC, USA, 2010. [Google Scholar]
- Lofland, L.H. The Public Realm: Exploring the City’s Quintessential Social Territory; Transaction Publishers: Piscataway, NJ, USA, 1998. [Google Scholar]
- Marshall, N. Urban squares: A place for social life. In Place and Placelessness Revisited; Freestone., R., Liu, E., Eds.; Routledge: New York, NY, USA, 2016; pp. 186–203. [Google Scholar]
- Marshall, N. Technology and its Role in the Public Realm. In Routledge Handbook of Urban Landscape Research; Bishop, K., Corkery, L., Eds.; Routledge: New York, NY, USA, 2023; pp. 115–130. [Google Scholar]
- Cooper Marcus, C.; Francis, C. People Places: Design Guidelines for Urban Open Space; Wiley and Sons: New York, NY, USA, 1997. [Google Scholar]
- Jacobs, J. The Death and Life of Great American Cities; Vintage Books: New York, NY, USA, 1961. [Google Scholar]
- Lynch, K. The Image of the City; MIT Press: Cambridge, MA, USA, 1960. [Google Scholar]
- Putnam, R.D. Bowling Alone: The Collapse and Revival of American Community; Simon and Schuster: New York, NY, USA, 2001. [Google Scholar]
- Sandercock, L. Cosmopolis II: Mongrel Cities of the 21st Century; Continuum: New York, NY, USA, 2003. [Google Scholar]
- Whyte, W.H. The Social Life of Small Urban Spaces; Ingram: New York, NY, USA, 1980. [Google Scholar]
- Amin, A.; Thrift, N. Cities: Reimagining the Urban; Polity Press: Cambridge, UK, 2002. [Google Scholar]
- Donald, J. Imagining the Modern City; The Athlone Press: London, UK, 1999. [Google Scholar]
- Fincher, R.; Iveson, K. Planning and Diversity in the City: Redistribution, Recognition and Encounter; Macmillan International Higher Education: Melbourne, Australia, 2008. [Google Scholar]
- Massey, D. Space, Place and Gender; John Wiley & Sons: Hoboken, NJ, USA, 2013. [Google Scholar]
- Tuan, Y.-F. Space and Place; University of Minnesota Press: Minneapolis, MN, USA, 1977. [Google Scholar]
- Giddens, A. Social Theory and Modern Sociology; Stanford University Press: Stanford, CA, USA, 1987. [Google Scholar]
- Harvey, D. The Condition of Postmodernity; Blackwell: Oxford, UK, 1989. [Google Scholar]
- Low, S.M. The Anthropology of Space and Place; Blackwell Publishing: Boston, MA, USA, 2003. [Google Scholar]
- Sennett, R. The Fall of Public Man; Norton & Company: New York, NY, USA, 2017. [Google Scholar]
- Altman, I. The Environment and Social Behavior: Privacy, Personal Space, Territory, Crowding; Brooks/Cole: Monterey, CA, USA, 1975. [Google Scholar]
- Barker, R.G. Ecological Psychology: Concepts and Methods for Studying the Environment of Human Behavior; Stanford University Press: Palo Alto, CA, USA, 1968. [Google Scholar]
- Gifford, R. Environmental psychology matters. Annu. Rev. Psychol. 2014, 65, 541–579. [Google Scholar] [CrossRef] [PubMed]
- Proshansky, H.M.; Fabian, A.K.; Kaminoff, R. Place-identity: Physical world socialization of the self. J. Environ. Psychol. 1983, 3, 57–83. [Google Scholar] [CrossRef]
- Rapoport, A. (Ed.) The Mutual Interaction of People and Their Built Environment; Mouton: Paris, France, 1976. [Google Scholar]
- Sommer, R. Social Design: Creating Building with People in Mind; Prentice Hall: Englewood Cliffs, NJ, USA, 1973. [Google Scholar]
- Sanoff, H. Community Participation Methods in Design and Planning; Wiley: New York, NY, USA, 2000. [Google Scholar]
- Bishop, K.; Marshall, N. The Routledge Handbook of People and Place in the 21st Century City; Routledge: New York, NY, USA, 2020. [Google Scholar]
- Lawton, M.P. Competence, environmental press, and the adaptation of older people. In Aging and the Environment: Theoretical Approaches; Lawton, M.P., Windley, P.C., Byerts, T.O., Eds.; Springer: New York, NY, USA, 1982; pp. 33–59. [Google Scholar]
- Cosco, N.G.; Moore, R.C.; Islam, M.Z. Behavior mapping: A method for linking preschool physical activity and outdoor design. Med. Sci. Sports Exerc. 2010, 42, 513–519. [Google Scholar] [CrossRef] [PubMed]
- Zeisel, J. Inquiry by Design; Norton: New York, NY, USA, 2006. [Google Scholar]
- Ittelson, W.H.; Rivlin, L.G.; Proshansky, H.M. The use of behavioral maps in environmental psychology. In Environmental Psychology: Man and His Physical Setting; Proshansky, H.M., Ittelson, W.H., Rivlin, L.G., Eds.; Holt, Rinehart and Winston: New York, NY, USA, 1976; pp. 340–351. [Google Scholar]
- Gehl, J.; Svarre, B. How to Study Public Life; Island Press: Washington, DC, USA, 2013. [Google Scholar]
- Project for Public Space. How to Turn a Place Around: A Handbook for Creating Successful Spaces; Project for Public Spaces, Inc.: New York, NY, USA, 2001. [Google Scholar]
- Aminpour, F. The Role of In-Between Spaces within Outdoor School Environments in Children’s Expression of Agency. Ph.D. Thesis, University of NSW, Sydney, Australia, 2018. [Google Scholar]
- Malone, K.; Tranter, P.J. Children’s environmental learning and the use, design and management of schoolgrounds. CYE Online 2003, 13, 87–137. [Google Scholar] [CrossRef]
- Moore, R.C.; Cosco, N.G. Using behavior mapping to investigate healthy outdoor environments for children and families: Conceptual framework, procedures and applications. In Innovative Approaches to Researching Landscape and Health; Thompson, C.W., Aspinall, P., Bell, S., Eds.; Routledge: London, UK, 2010; pp. 33–74. [Google Scholar]
- Milke, D.; Beck, C.; Danes, S.; Leask, J. Behavioral mapping of residents’ activity in five residential style care centers for elderly persons diagnosed with dementia: Small differences in sites can affect behaviors. J. Hous. Elder. 2009, 23, 335–367. [Google Scholar] [CrossRef]
- Lincoln, N.B.; Willis, D.; Philips, S.A.; Juby, L.C.; Berman, P. Comparison of rehabilitation practice on hospital wards for stroke patients. Stroke 1996, 27, 18–23. [Google Scholar] [CrossRef] [PubMed]
- Larson, J.S.; Bradlow, E.T.; Fader, P.S. An exploratory look at supermarket shopping paths. Int. J. Res. Mark. 2005, 22, 395–414. [Google Scholar] [CrossRef]
- Bishop, K.; Marshall, N. BE Place-Centred: Towards an Evidence-Based Model for Place-Making in Urban Centres; Unpublished Report; UNSW and City of Sydney: Sydney, Australia, 2013; pp. 1–35. [Google Scholar]
- Gibson, J.J. The theory of affordances. In Perceiving, Acting, and Knowing: Toward an Ecological Psychology; Shaw, R., Bransford, J., Eds.; Lawrence Erlbaum Associates: Hillsdale, NJ, USA, 1977. [Google Scholar]
- Sommer, R.; Sommer, B.B. A Practical Guide to Behavioral Research; Oxford University Press: Oxford, UK, 2001. [Google Scholar]
- McKenzie, T.L.; Cohen, D.A.; Sehgal, A.; Williamson, S.; Golinelli, D. System for Observing Play and Leisure Activity in Communities (SOPARC): Reliability and feasibility measures. J. Phys. Act. Health 2006, 3 (Suppl. S1), S208–S222. [Google Scholar] [CrossRef]
- Bishop, K.; Rahmat, H.; Marshall, N.; Corkery, L.; Park, M.; Steinmetz, C.; Tietz, C.; Thompson, S. Behavior Mapping Report 2: Smart Social Spaces, Smart Street Furniture Supporting Social Health; Published Report for the Australian Department of Industry, Innovation and Science, Smart Cities and Suburbs Grant; UNSW: Sydney, Australia, 2019. [Google Scholar]
- Bechtel, R.B.; Marans, R.; Michelson, W. Methods in Environmental and Behavioural Research; Van Nostrand Reinhold: New York, NY, USA, 1987. [Google Scholar]
- Barnes, H.; Georges River Council, Sydney, NSW, Australia; Bishop, K.; UNSW Sydney, Sydney, NSW, Australia. Personal communication, 2022.
- Barnes, H. Extraction from a Vox Pop, Urban Expedition, Smart Regional Spaces Project. 2023. Available online: https://www.smartregionalspaces.net.au/urban-expedition-summary (accessed on 8 January 2024).
| Disclaimer/Publisher’s Note: The statements, opinions and data contained in all publications are solely those of the individual author(s) and contributor(s) and not of MDPI and/or the editor(s). MDPI and/or the editor(s) disclaim responsibility for any injury to people or property resulting from any ideas, methods, instructions or products referred to in the content. |
© 2024 by the authors. Licensee MDPI, Basel, Switzerland. This article is an open access article distributed under the terms and conditions of the Creative Commons Attribution (CC BY) license (https://creativecommons.org/licenses/by/4.0/).


 and
and 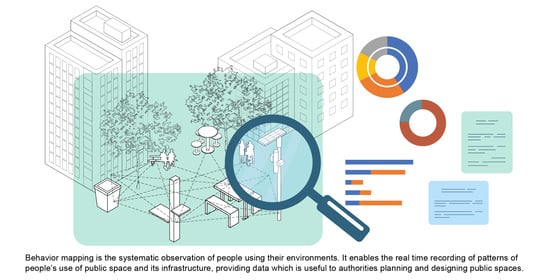


