Entry

History and Trends in U.S. High School Science Course Taking

by
Vandeen A. Campbell
The Joseph C. Cornwall Center for Metropolitan Studies, Rutgers, The State University of New Jersey, Newark Campus, Newark, NJ 07102, USA
Encyclopedia 2025, 5(1), 34; https://doi.org/10.3390/encyclopedia5010034
Submission received: 2 January 2025 / Revised: 7 February 2025 / Accepted: 25 February 2025 / Published: 4 March 2025
(This article belongs to the Collection Encyclopedia of Social Sciences)

Definition

:
This entry describes high school science course taking in the United States (U.S.). High school science course taking refers to the selection, enrollment, and completion of science-related coursework during grades nine through twelve. It encompasses both the timing, quantity, and the rigor (or level of challenge) of science courses. Science course taking in high school includes both foundational or core courses like biology, chemistry, physics, and environmental science. Students may also take advanced science courses such as Advanced Placement (AP), (International Baccalaureate (IB), career and technical education (CTE) or applied, and dual credit or dual enrollment science courses. Some advanced courses meet core course requirements (e.g., AP Physics). This entry focuses on core science course taking, and the distinction between core or advanced core is beyond its scope. A discussion of CTE and dual credit or dual enrollment science course taking is also beyond the entry’s scope. The significant variability in core high school science course taking and historic unequal distribution of opportunities highlights the need for ongoing monitoring of factors influencing course taking to promote equity in access and outcomes. This entry presents a brief history of standards and graduation requirements surrounding high school science course taking, then briefly reviews science course pathways classifications and current trends in course enrollment and completion. A review of current trends in the context of historical developments can help the high school science education policy and practice field take stock of some of the factors that influence current patterns. The entry is written with a lens towards broadening participation in science, technology, engineering, and mathematics (STEM) fields and equity.

1. History of Science Course-Taking Guidelines and Standards in the U.S.

Monitoring trends and inequities in high school science course-taking has been a critical task for many decades as a national priority has been to strengthen pathways to STEM fields [1,2,3,4]. Although high schools in the U.S. tend to follow a biology–chemistry–physics core science course sequence, scientists, science educators, and researchers do not have consensus on science course sequences [5]. Up until the early 1900s, physics typically preceded chemistry in schools that offered both subjects, and this was the recommendation of national curriculum review committees convened between 1893 and 1899. By the early 1900s, with biology formally becoming a single course, committee recommendation had biology first in the sequence and chemistry and physics following in no specified order. Between 1924 and 1932, committees recommended that chemistry, as a more abstract science, be taught during the final year of high school with biology or physics preceding in any order. By 1959, following the predominant practice, biology first became the recommendation followed by chemistry and then physics [5].
The current course sequence among the core sciences in the U.S. has been shaped by customary practice in schools. However, a small, emerging body of research has found that having students take physics in the ninth grade promotes a stronger science course taking trajectory and can be beneficial for success in mathematics [6]. Physics educators argue that the subject’s content is the foundation for biology and chemistry. Physics, they posit, is an intuitive subject connecting students’ lived experience with everyday phenomena, which can enhance the learning of physics content. Opponents to physics first cite the prerequisite experience in algebra I to sufficiently master physics in ninth grade. For proponents, the movement of algebra I or integrated mathematics course taking in eighth grade and the option to have tiers of ninth-grade physics aligned with students’ prior mathematics preparation make physics first an achievable goal. Implementation of an alignment between algebra I course taking and ninth-grade physics has proven a challenging undertaking [7]. Notwithstanding, research finds that students who take physics in ninth grade later take more challenging science courses in high school [8], score higher on AP and standardized tests, and have increased interest in STEM careers [6]. Schools adopting a physics first policy have achieved greater gender and racial balance in science course taking [6].
The history of science education in the United States reflects broader trends in education reform and economic shifts. In the 1980s, the release of the A Nation at Risk report highlighted the need for rigorous science education to prepare students for global competitiveness [9,10]. Since then, science course taking has increasingly been a focal point of education policy and standards movements, with calls for more students to engage in higher levels of science.

1.1. National Science Standards

Over the past three decades, a number of standards-setting efforts have influenced the state of high school science education in the U.S. [11]. Aspects of the content standards are highlighted here to indicate any shifts in science content emphasis that might influence science course taking. The American Association for the Advancement of Science (AAAS) published Project 2061: Science for All Americans (SFAA) in 1989 [12] and Benchmarks for Science Literacy in 1993 [13]. Combined, the two documents aimed “to set out the vision for what all Americans should know in science” and map learning outcomes across the grade span ([11], p. 77). The National Science Teachers Association (NSTA) published Scope, Sequence, and Coordination (SS & C) in 1989 and later Content Core in 1992 [14]. The documents were focused on science education for grades six through twelve, recommended content to be taught each grade, and introduced the idea of coordination of content across biology, chemistry, Earth and space science, and physics, as well as the need to revisit concepts periodically and in increasing depth (i.e., spaced learning) [11,14]. Although the AAAS and NSTA standards documents were widely circulated and frequently used to guide state standards, the two later science standards efforts—the National Research Council’s (NRC) National Science Education Standards in 1996 and the Next Generation Science Standards (NGSS) in 2013—became most influential.
The National Science Education Standards offered a comprehensive framework that outlined clear goals for K–12 science education [11,15,16]. It emphasized a shift from rote memorization toward deep understanding of scientific concepts, the importance of inquiry and hands-on learning, and the need for students to develop both content knowledge and the practices of scientific thinking [15]. The National Science Education Standards also integrated standards for content, teaching, assessment, professional development, and were intended to be mutually reinforcing [15]. Although these standards were not federally mandated, they provided a research-based framework that many states and school districts looked to when revising their own science standards and curricula.
With respect to high school science course taking, the National Science Education Standards do not prescribe a fixed sequence or a rigid set of courses for high school science. Instead, they provide a broad framework. The content standards for grades 9–12 followed the same content domains as for the earlier grades—science as inquiry, physical science, life science, Earth and space science, science and technology (including technological design), science in personal and social perspectives (including environmental science), and history and nature of science [16]. In contrast to the standards for the earlier grades, integration between the science disciplines was not emphasized (though not discouraged either). The standards also emphasized equitable access to science education and equity in science education policies [16].
The Next Generation Science Standards (NGSS) are currently the most widely adopted national science standards—thirty-nine states and the District of Columbia adopted or used NGSS to inform their standards by 2018 [17]. NGSS were developed by a coalition of 26 states and the NSTA, NRC, AAAS, and the Achieve non-profit organization. The NGSS detail model course maps for middle and high school [18]. The high school course models are the focus of this section. NGSS provide for both standard and accelerated science course pathways in high school, regardless of whether there are coordinated sequences with feeder middle schools. NGSS are organized around performance expectations consisting of content (i.e., disciplinary core ideas), practices (i.e., science and engineering practices), and cross-cutting concepts as the priority and not course sequencing. The performance expectations are organized within four domains—physical science, life science, Earth and space science, and engineering, technology, and applications of science. However, NGSS organize course mapping around year-long biology, chemistry, physics, and Earth and space science as the most common science subjects in high schools across the country [19]. NGSS also consider these four courses as foundational to high school science course-taking [18]. The courses map to the domains model consisting of physical sciences and life science, which organize the disciplinary core ideas, a key focus of NGSS [19]. The NGSS emphasize scientific inquiry and cross-cutting concepts, encourage a more integrated approach to science education, and weave in engineering performance expectations in all core courses [19]. NGSS also map options for accelerating science course taking to AP science courses through concurrent or rapid sequential scheduling, but in all models the three or four foundational courses are included [18]. For example, a student may take two core courses in ninth grade as semester-long instead of year-long courses and complete a third course in the first half of their tenth-grade year. Concurrent scheduling requires careful alignment of performance expectations and disciplinary core ideas throughout the progression of courses [18].
As apparent in the various science standards influencing science education in the U.S., biology or life sciences, chemistry, physics, and Earth and space have been consistent core science content. Environmental science was less prominent as a distinct core content area in earlier standards efforts, but was reflected in science in personal and social perspectives in the NRC standards. In NGSS, environmental science is reflected in “Earth Systems”, “Weather and Climate”, and “Human Sustainability” within the Earth and space science domain [20,21] and often in cross-cutting concepts.

1.2. Science Graduation Requirements

States’ science graduation requirements further shape science course taking in ways that do not necessarily reflect expectations apparent in the standards. Leading up to A Nation at Risk in 1983, educators viewed insufficient and non-academic course-taking patterns as a large part of the problem of underachievement nationally [22]. Following A Nation at Risk, the National Commission on Excellence in Education recommended increased graduation requirements in English, math, science, social studies, and computer science. For science, the commission recommended that secondary students be required to take three years of science for high school graduation. The commission did not specify the science courses to be taken as part of the recommendation. Although the goal of the committee was to increase achievement in science and other subject areas, the recommendation only targeted increased course taking under the hypothesis that increased science course taking should lead to increased credit attainment, which they hoped would have generated gains in science achievement.
In Teitlebaum’s [22] analysis of the influence of the initiative to increase graduation requirements using National Educational Longitudinal Study of 1988 (NELS:88) data, he found that twenty-six percent of students were in schools requiring three years of science course taking for graduation. Greater proportions of Black (26.8%) and Latinx (25.3%) were in such schools compared to the proportions of White students (24.5%), Asian (22.4%), and Native American (14.8%) students. The percentage of students in schools requiring at least three courses in science was greater for the lowest quartile of schools’ average socioeconomic status (26.0%), urban areas (27.1%), and the northeast (47.6%). Among students in schools requiring three or more years of science, Black students were about 0.6 times more likely to have satisfied the science requirement than White students. No other racial/ethnic comparisons were statistically significant. Teitlebaum’s [22] results showed that schools across the nation did not necessarily adopt a minimum graduation requirement of three years of science. However, students in schools that adopted the science requirement earned 0.38 more science credits on average, compared to students in schools who did not adopt the minimum requirement. Teitlebaum [22] found a nine-percentage-point difference in the percentage of students completing a mid-level or advanced science course in schools requiring three or more years of science compared to students in schools not having the requirement.
States have increasingly moved towards requiring at least three years of course taking in science. Based on a report from the Institute of Education Sciences (IES), as of 2005, 23 states required students to complete three or more years of science to graduate [23]. Twenty states required 1–2 years of science for graduation. The remainder of the states did not have data in the referenced report [23]. According to the Education Commission of the States 2023 compilation of states’ high school graduation requirements, 39 out of 50 states and the District of Columbia (76%) require students to complete at least three years in science, while the 8 states require fewer than three years of science. The remaining states do not have statewide graduation requirements, or the science requirement falls within a single STEM requirement [24]. In taking fewer than three years of science, it is unlikely that those students would encounter the full disciplinary science core during their high school tenure. Reports coming out of various initiatives across the country (discussed later in the entry) provide insights into the results of science course-taking patterns and changing graduation requirements.

2. Levels of High School Science Course Taking Across the U.S. and in Select State and City Studies

Understanding the leveling or classification of science courses adds context to science course-taking trends and offers a tool for assessing the quality of science learning experiences and monitoring inequities in science course taking. A body of research from the 1990s to early 2000s capitalized on the new transcript data available in NELS:88 to study the distribution of science course taking across the nation, classify science course-taking pipelines (recent scholarship recommends the use of the term science pathways instead of pipelines, given the multiplicity of routes students can take to STEM participation [25]. However, the term “pipelines” is utilized in this section to maintain consistency with the terminology of the research papers being described), and study the impacts of science course taking on science achievement and other outcomes [1,24,25,26,27]. Both the NELS:88 contribution and the research following are intent on understanding the results of national committees in the 1980s, which pushed for higher, more academic graduation standards related to English, mathematics, and science.
Burkham and Lee [1] released a foundational National Center for Education Statistics (NCES) report that built on earlier research in mathematics course classification and generated a suite of science course-taking pipeline measures for use in future research. The pipeline measures were developed to account for subject matter, timing of when the course is typically completed, typical co-requisite science courses, and academic rigor of the courses. The pipeline measures can be used to assess how deeply students are engaging in science course taking and can be predictive of future academic achievement outcomes and likelihood to pursue science pathways.
Burkham and Lee [1] divided the universe of NELS science courses into four categories—life science (biology), chemistry, physics, and other physical sciences courses (e.g., Earth science, geology, and physical science). They constructed pipeline measures to account for all the courses. Then, they consolidated the four categories of courses into two—a life sciences category consisting of biology courses and a physical sciences category consisting of the chemistry, physics, and physical sciences pipeline measures.
Nine biology courses were present in the NELS data—honors biology, general biology I, basic biology I, zoology, general biology II, marine biology, ecology, human physiology, and advanced biology. Basic, general I, and honors biology were primarily taken in the tenth grade while zoology, general II, and marine biology and ecology were primarily taken in the eleventh grade. Human physiology and advanced biology were taken in both eleventh and twelfth grades. Burkham and Lee [1] developed the six-level life science/biology pipeline measure shown in Table 1. Even though the biology courses tend to concentrate at specific grade levels, they were not always similarly classified. For example, both basic biology and honors biology are typically taken in the tenth grade, but basic biology was not considered a secondary-level course while honors biology was closer to being an advanced course and was classified at a level higher than the secondary-level specialized courses. In the NELS data, about half of the students took only general biology I, eight percent took basic biology only, and about fourteen percent took no biology courses. The small portion of students remaining took courses across various levels. This suggests low uptake of biology at higher academic levels.
In the NELS data, sixteen physical sciences courses were identified. There were three physics courses (general physics, physics I, physics II); four chemistry courses (introductory chemistry, consumer chemistry, chemistry I, and chemistry II); and nine other physical science courses (physical science, applied physical science, astronomy, unified science (integrates the core science disciplines in a single course), environmental science, Earth science, college-bound Earth science, geology, and oceanography). Burkham and Lee [1] classified pipeline measures for each physical science category, then merged the measures into a single six-level pipeline (Table 2). Students tended to take primary physical science courses in the ninth grade, prior to taking any life sciences courses in the tenth grade. More than half of students only took science courses up to the secondary physical sciences, which is still considered lower level or introductory.
The life and physical science pipeline measures have different predictive values for NELS science exams in these subject areas, where the physical science pipeline measure is more strongly correlated to exam scores (between 0.4578 and 0.5164 across two tenth-grade and two twelfth-grade exams) than life science pipeline measures (between 0.3304 and 0.3323 across the same exams). A combined science pipeline measure did not improve the strength of the correlation between pipeline measures and science exam scores. Burkham and Lee [1] argued that the life and physical science pipeline measures remain separate because of differences in content and the lack of additional predictive value.
With science standards shifting from a rigid, prescriptive approach to instruction over time to those that intertwine concepts from a variety of subject areas—global climate, technology, and engineering principles—into the core science standards, updated classifications of science course taking may be needed as well as a review of the social value and reward system around the sciences. The NGSS standards, for example, recommend prioritization of engineering practices and include asking questions and defining problems; analyzing and interpreting data; developing and using models; and engaging in argument from evidence. The cross-content integration requires drawing on knowledge in all other science areas to solve problems. Arguably, one might expect the academic intensity in a broader set of science courses to have increased. Studies are needed to clarify knowledge of whether a broader range of course pathways have any positive impact on student outcomes, regardless of previous classification.

State and Large City Studies of Science Course Pathways

Recent studies examining science course-taking patterns in states and cities have identified emerging trends shaped by evolving graduation requirements and science course-taking policies. Most states do not have published studies, thus only a few are presented here.
Texas. The Texas study by Yoon and Strobel, “The Trends in Texas High School Enrollment in Mathematics, Science, and CTE-STEM Courses”, examines the implementation of new career training courses prompted by Texas legislation [28]. Texas uses a unique course classification system, dividing programs into the “minimum” track and the “recommended and distinguished advancement” track. Courses are further categorized as required, selective, or substitute. The “minimum” track mandates the completion of biology and integrated physics and chemistry (IPC), with the option to substitute IPC with either chemistry or physics. The “recommended and distinguished advancement” track requires students to take biology (or its AP/IB equivalents), chemistry (or its AP/IB equivalents), and physics (or its AP/IB equivalents), with IPC allowed as a substitute. Students in this track can also choose from twenty-five selective courses. The CTE-STEM courses, which primarily focus on engineering fields such as biotechnology, digital electronics, and robotics and automation, provide students with an additional endorsement that is ranked above the minimum track. While enrollment in these courses increased overall, boosting STEM participation, the growth was less pronounced among female and minoritized students, reflecting persistent disparities [28].
Florida. Long and colleagues [29], in their study, “Effects of High School Course-Taking on Secondary and Postsecondary Success”, analyzed data from public school students in Florida. The Florida Department of Education employed a standardized course code system with detailed descriptions, enabling researchers to identify the subject and rigor of each course. Courses were categorized into three levels based on difficulty, with Level 3 representing the most advanced and rigorous offerings. Within Level 3, courses were further divided into four subcategories: honors, upper-level, AP, and IB courses.
Level 3 honors courses included biology I, anatomy and physiology, Earth and space science, integrated science (I–III), marine science (I–II), chemistry I, physics I, and astronomy (solar/galactic). Upper-level courses consisted of biology II, genetics, integrated science (IV–V), solar energy (I–II), chemistry II, and physics II. AP courses included biology, environmental science, chemistry, and physics (b, c), while IB courses cover biology (I–III), environmental systems, chemistry (I–III), and design technology. In contrast, basic and remedial courses were classified as Level 1. These classifications were broader and more detailed than those used by Burkham and Lee, providing a nuanced framework for analyzing course-taking patterns and their impact on academic outcomes. Students were 5–6 percent more likely to enroll in college, and primarily 4-year colleges, if they take a rigorous science course compared to those who do not [29].
Chicago. A 2010 report by the Chicago Consortium for School Research (CCSR) analyzed trends before and after the implementation of new graduation requirements for science in Chicago Public Schools (CPS) in 1997 [30]. The policy mandated that all CPS high school students complete a college preparatory curriculum, including three years of science coursework: Earth science or environmental science, biology or life science, and chemistry or physics. The report found that science course enrollment increased immediately after the policy change, with most students completing and passing the required courses. However, while the percentage of students earning a grade of B or better in science increased by 4 percentage points, most students passed with grades of C or lower. Science achievement gains were minimal and primarily observed among students who earned a B average or higher in science. Researchers concluded that the policy was not associated with a significant improvement in overall science learning. Furthermore, the requirement to take Earth science or environmental science limited opportunities for some students to enroll in advanced courses like chemistry and physics or to take multiple years of these subjects. The policy did not result in higher graduation rates, highlighting its limited effectiveness in driving substantial academic or systemic improvements [30].
California. A California report highlights mixed outcomes related to raising graduation requirements in science [31]. The state mandates a minimum of two years of science for graduation, but 59% of districts, exercising local autonomy, require three to four years of science credits. The study found that increasing science graduation requirements was associated with a substantial 18 percent reduction in dropout rates. However, it also led to an 11 percent decrease in SAT participation rates. The change did not significantly impact enrollment in advanced science courses or proficiency rates on the California Science Tests (CAST). Despite these trends, high-poverty schools saw notable benefits: a 2 percent increase in graduation rates and a 31 percent rise in advanced science course enrollment following the implementation of higher science graduation requirements.

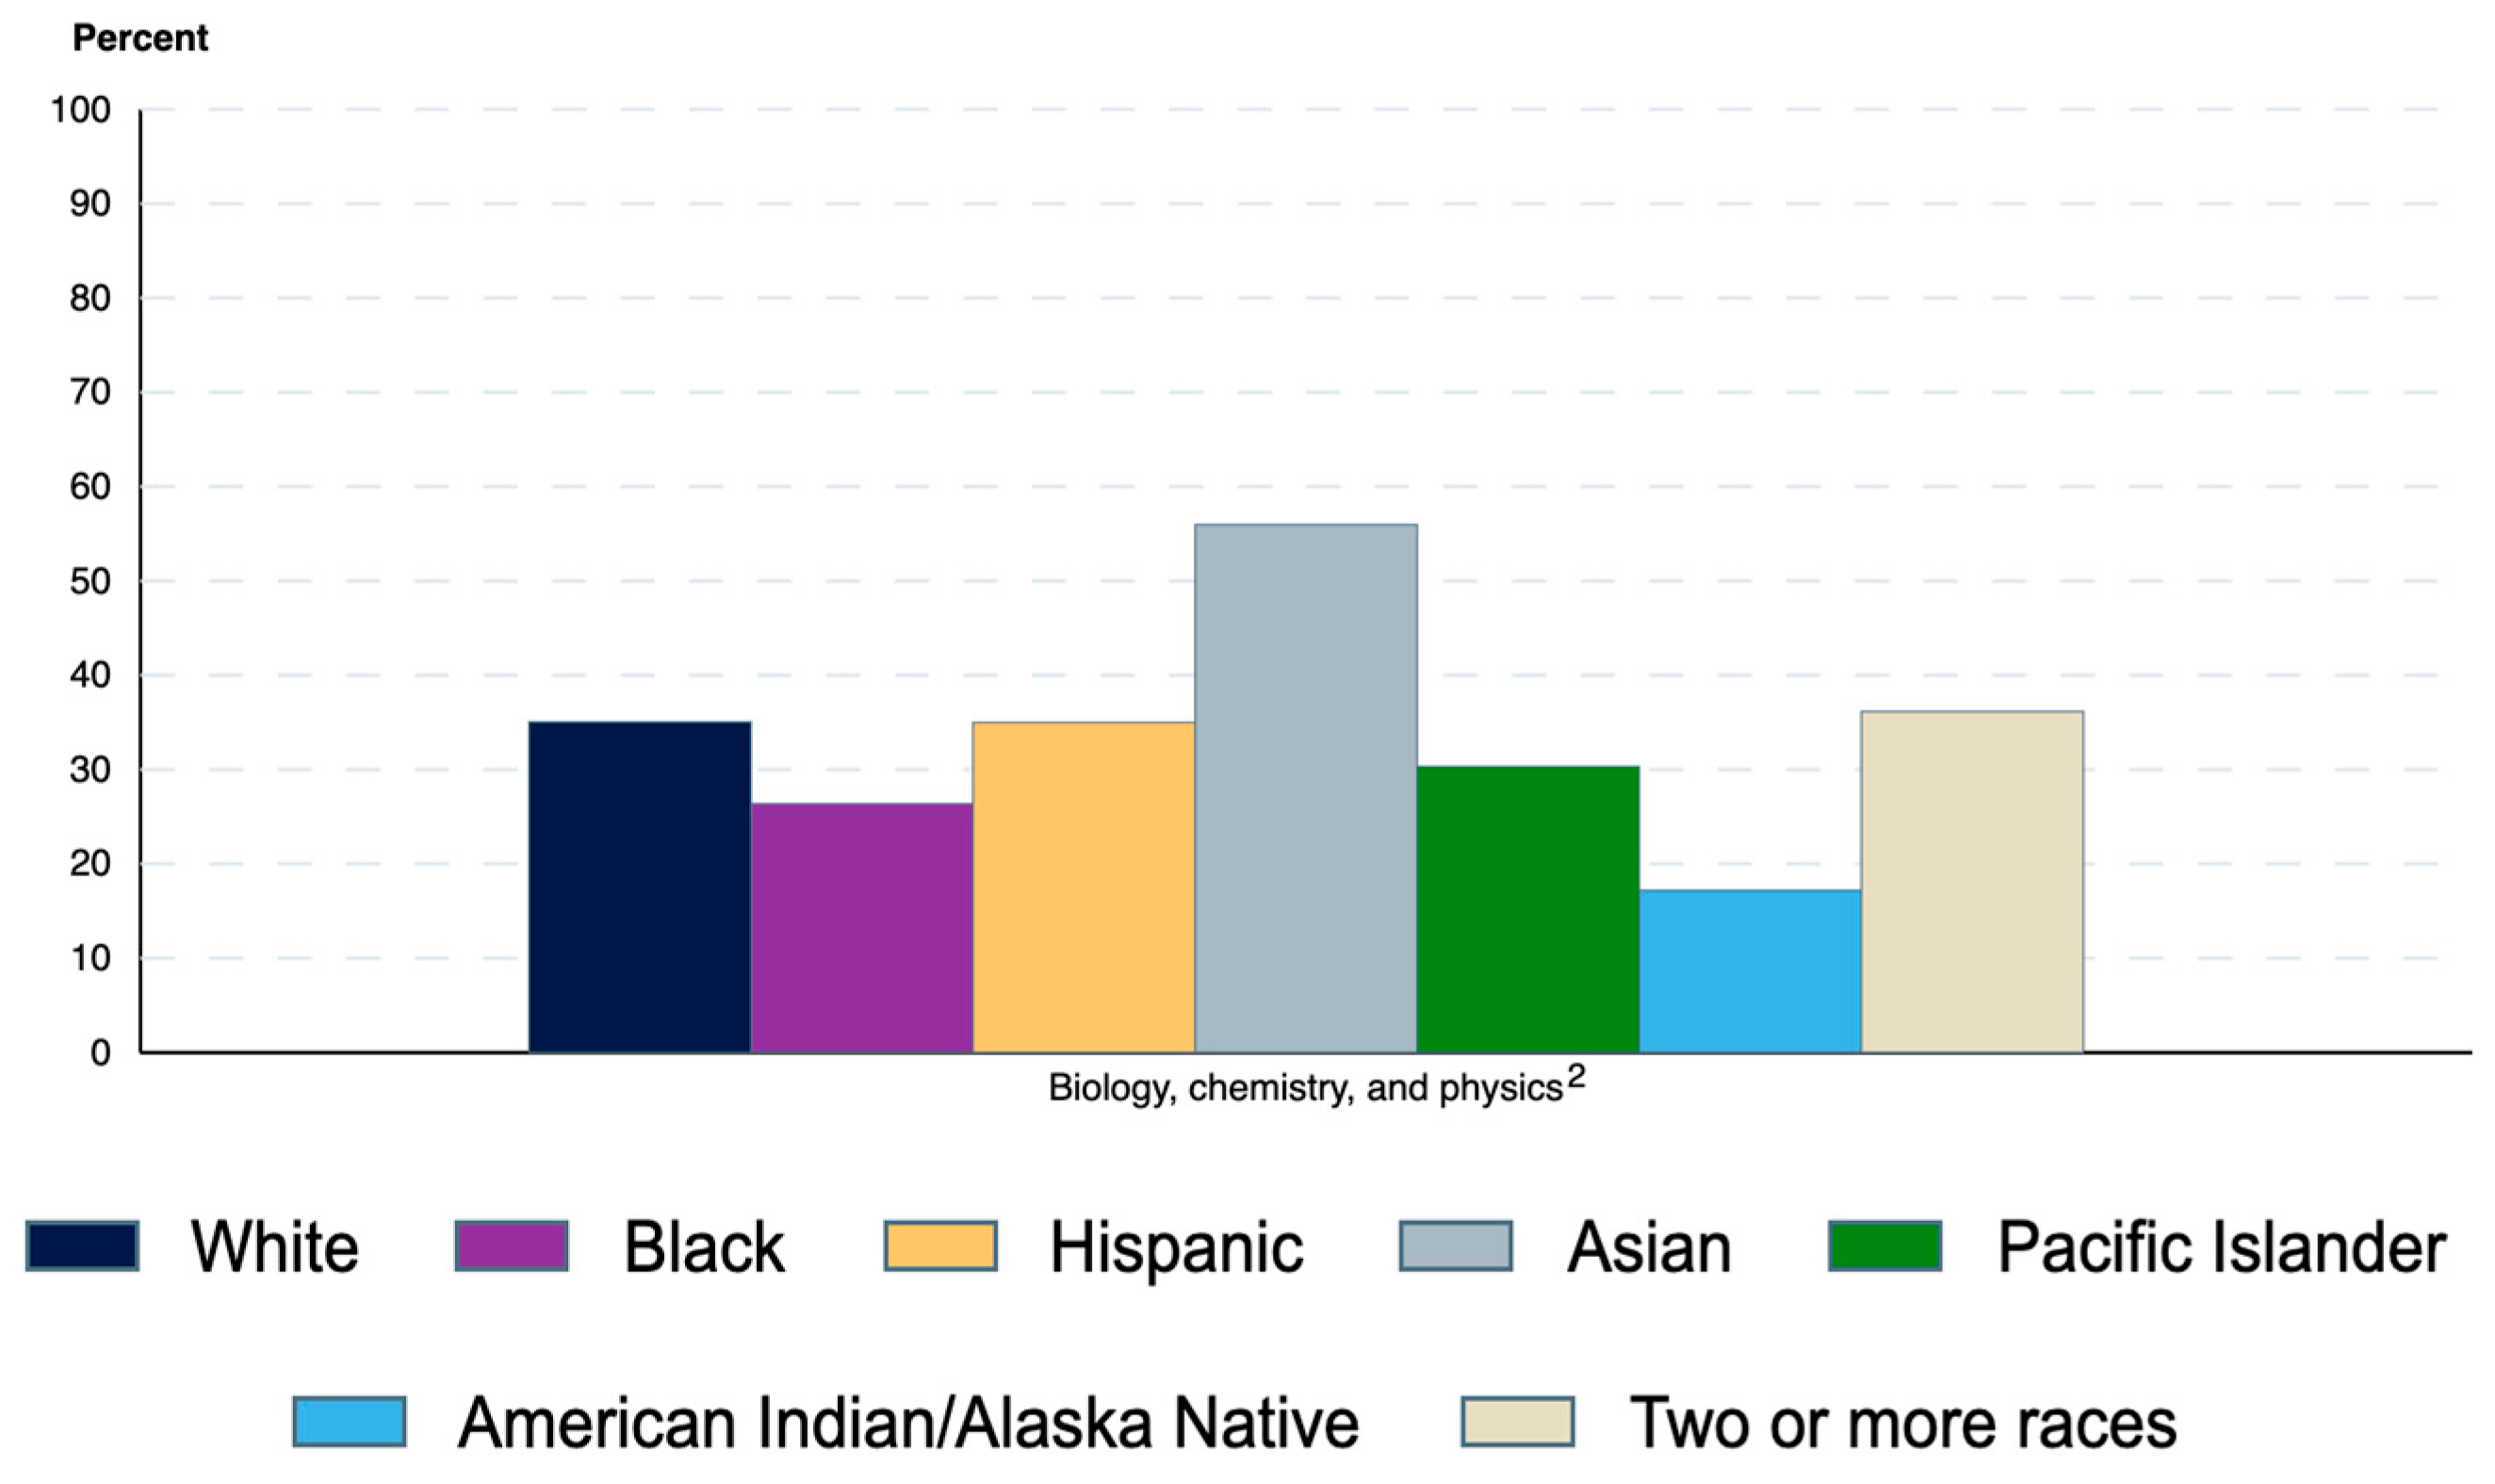
3. Current Trends in High School Science Course-Taking Pathways

The last three decades have seen major improvements in high school science course taking, but disparities remain [25]. In the early 2000s, the percentage of high school graduates completing at least one course classified as more challenging than general biology (i.e., chemistry I or II, physics I or II, and advanced biology) increased from 35 percent in 1982 to 68 percent in 2004 [23]. More recently, according to The Nations’ Report Card’s “2019 National Assessment of Educational Progress (NAEP) High School Transcript Study (HSTS)”, the percentage of students in the United States taking chemistry has increased from 51 percent in 1990 to 75 percent in 2019. During the same period, the percentage of students taking physics has increased from 23 percent to 38 percent [32]. Figure 1, taken from U.S. Department of Education [33], shows 2019 trends in comparison to 2009. One notable difference is the recent increase in the percentage of high school graduates who completed biology, chemistry, and physics from about 30 percent in 2009 to 35 percent in 2019. The percentage of high school graduates taking a survey science course—typically a lower-level science course—dropped from about 55 percent in 2009 to 45 percent in 2019. With respect to science course sequences, a recent study based on NCES transcript data nationwide revealed that the most common sequence is general biology, general chemistry, and general physics, followed closely by the sequence physical science, general biology, and general chemistry [34,35].
However, these numbers do not tell the full story. There is significant variation in science course taking, depending on student demographics. According to a recent National Center for Education Statistics report [36], the percentage of high school graduates who completed a combination of biology, chemistry, and physics varied widely (Figure 2). Proportionally, far more Asian students completed the three subjects (56%) than any other racial/ethnic group. For other racial/ethnic groups, the percentages completing a combination of biology, chemistry, and physics were as follows: two or more races, 36 percent; White and Hispanic, 35 percent; Black, 26 percent; and American Indian/Alaska Native, 17 percent [36].

4. Discussion, Implications, and Conclusions

Considering the history surrounding high school science course taking helps to clarify and assess current science course-taking patterns. The review of the standards reveals that while life, physical, and Earth and space sciences are disciplinary core, recent standards have emphasized and integrated concepts such as human sustainability and practices such as technologically-based scientific problem solving and engineering within the science core. Current science course pathways research and classifications have not widely expanded to match the possibilities in science learning experiences. Studies will be needed to reexamine courses previously classified as lower-level sciences through the lens of the most recent standards and how students fare in pathways that include them. Although beyond the scope of this entry, including applied sciences in course pathways studies could help to broaden the view of viable science course pathways [29,37]. Ultimately, though, “rigor” or course levels will need to be reexamined and, depending on findings, the system of valuation of high school science course taking, for example, for college admission, would need to align.
Under current norms of science course taking and valuation, relative to science disciplinary core standards recommendations and course pathways research, the state of science course-taking pathways in the U.S. reveals both significant progress and persistent challenges. Participation in science course pathways containing biology, chemistry, and physics still lags, and less advanced pathways remain popular options. While overall enrollment in science course pathways that would be classified as core to advanced has increased, significant racial/ethnic disparities remain. Addressing these issues is essential to ensuring that all students can access and succeed in STEM fields, both in higher education and in the workforce. There remains a need to accelerate science course taking.

Funding

This research received no external funding. The APC was funded by the Joseph C. Cornwall Center for Metropolitan Studies at Rutgers University, Newark.

Conflicts of Interest

The author declares no conflicts of interest.

References

  1. Burkam, D.T.; Lee, V.E. Mathematics, Foreign Language, and Science Course-Taking and the NELS:88 Transcript Data (NCES 200301); U.S. Department of Education, National Center for Education Statistics: Washington, DC, USA, 2003. Available online: https://nces.ed.gov/pubsearch/pubsinfo.asp?pubid=200301 (accessed on 25 October 2021).
  2. Leung, M.; Cardichon, J.; Scott, C.; Darling-Hammond, L. Inequitable Opportunity to Learn: Access to Advanced Mathematics and Science Courses; Learning Policy Institute: Palo Alto, CA, USA, 2020; Available online: https://learningpolicyinstitute.org/sites/default/files/product-files/CRDC_Course_Access_REPORT.pdf (accessed on 25 October 2021).
  3. National Academies of Sciences, Engineering, and Medicine. Monitoring Educational Equity; The National Academies Press: Cambridge, MA, USA, 2019. [Google Scholar] [CrossRef]
  4. National Academies of Sciences, Engineering, and Medicine. Science and Engineering for Grades 6–12: Investigation and Design at the Center; The National Academies Press: Washington, DC, USA, 2019. [Google Scholar] [CrossRef]
  5. Sheppard, K.; Robbins, D.M. Physics last: A historical study of the development of the US high school science sequence. In Proceedings of the Annual Meeting of the National Association for Research in Science Teaching; Philadelphia, PA, USA, 23–26 March 2003. Available online: https://eric.ed.gov/?id=ED474718 (accessed on 25 October 2021).
  6. Ewald, G.; Hickman, J.B.; Hickman, P.; Myers, F. Physics first: The right-side-up science sequence. Phys. Teach. 2005, 43, 319–320. [Google Scholar] [CrossRef]
  7. Larkin, D.B. Putting physics first: Three case studies of high school science department and course sequence reorganization. Sch. Sci. Math. 2016, 116, 225–235. [Google Scholar] [CrossRef]
  8. Gaubatz, J. Evaluation of a Secondary School Science Program Inversion: Moving from a Traditional to a Modified-PCB Sequence. Sci. Educ. 2013, 22, 19–25. [Google Scholar]
  9. DeBoer, G.E. The use of content standards for curriculum reform in the United States: A historical analysis. In Handbook of Research on Science Education; Routledge: London, UK, 2023; pp. 817–849. [Google Scholar] [CrossRef]
  10. National Commission on Excellence in Education. A nation at risk: The imperative for educational reform. Elem. Sch. J. 1983, 84, 113–130. [Google Scholar] [CrossRef]
  11. Raizen, S.A. Standards for science education. Teach. Coll. Rec. 1998, 100, 66–121. [Google Scholar] [CrossRef]
  12. American Association for the Advancement of Science (AAAS). Project 2061: Science for all Americans (SFAA); American Association for the Advancement of Science: Washington, DC, USA, 1989; Available online: https://www.aaas.org/programs/project-2061 (accessed on 7 February 2025).
  13. American Association for the Advancement of Science (AAAS). Benchmarks for science literacy; American Association for the Advancement of Science: Washington, DC, USA, 1993; Available online: https://www.aaas.org/resources/benchmarks-science-literacy (accessed on 7 February 2025).
  14. Aldridge, B.G. Project on scope, sequence, and coordination: A new synthesis for improving science education. J. Sci. Educ. Technol. 1992, 1, 13–21. [Google Scholar] [CrossRef]
  15. Collins, A. National Science Education Standards: Looking backward and forward. Elem. Sch. J. 1997, 97, 299–313. [Google Scholar] [CrossRef]
  16. National Research Council. National Science Education Standards; The National Academies Press: Washington, DC, USA, 1996. [CrossRef]
  17. Smith, P.S. What does a national survey tell us about progress toward the vision of the NGSS? J. Sci. Teach. Educ. 2020, 31, 601–609. [Google Scholar] [CrossRef]
  18. Next Generation Science Standards. Accelerated Model Course Pathways. 2015. Available online: https://www.nextgenscience.org/sites/default/files/resource/files/NGSS%20Accelerated%20Model%20Course%20Pathways.pdf (accessed on 1 January 2025).
  19. Next Generation Science Standards. Model Course Mapping in Middle and High School for the Next Generation Science Standards. 2013. Available online: https://www.nextgenscience.org/sites/default/files/Appendix%20K_Revised%208.30.13.pdf (accessed on 1 January 2025).
  20. Feinstein, N.W.; Kirchgasler, K.L. Sustainability in science education? How the Next Generation Science Standards approach sustainability, and why it matters. Sci. Educ. 2015, 99, 121–144. [Google Scholar] [CrossRef]
  21. Hufnagel, E.; Kelly, G.J.; Henderson, J.A. How the environment is positioned in the Next Generation Science Standards: A critical discourse analysis. Environ. Educ. Res. 2018, 24, 731–753. [Google Scholar] [CrossRef]
  22. Teitlebaum, P. The influence of high school graduation requirement policies in mathematics and science on student course-taking patterns and achievement. Educ. Eval. Policy Anal. 2003, 25, 31–57. [Google Scholar] [CrossRef]
  23. Planty, M.; Provasnik, S.; Daniel, B. High School Coursetaking: Findings from the Condition of Education 2007 (NCES 2007-065); U.S. Department of Education; National Center for Education Statistics: Washington, DC, USA, 2007. Available online: https://files.eric.ed.gov/fulltext/ED497123.pdf (accessed on 6 February 2025).
  24. Education Commission of the States. High School Graduation Requirements. April 2023. Available online: https://reports.ecs.org/comparisons/high-school-graduation-requirements-2023-04 (accessed on 1 January 2025).
  25. National Academies of Sciences, Engineering, and Medicine. Equity in K-12 STEM Education: Framing Decisions for the Future; The National Academies Press: Cambridge, MA, USA, 2024. [Google Scholar] [CrossRef]
  26. Madigan, T. Science Proficiency and Course Taking in High School; National Center for Education Statistics: Washington, DC, USA, 1997. Available online: https://nces.ed.gov/pubsearch/pubsinfo.asp?pubid=97838 (accessed on 25 October 2021).
  27. Trusty, J. Effects of high school course-taking and other variables on choice of science and mathematics college majors. J. Couns. Dev. 2002, 80, 464–474. [Google Scholar] [CrossRef]
  28. Yoon, S.Y.; Strobel, J. Trends in Texas high school student enrollment in mathematics, science, and CTE-STEM courses. Int. J. STEM Educ. 2017, 4, 9. [Google Scholar] [CrossRef] [PubMed]
  29. Long, M.C.; Conger, D.; Iatarola, P. Effects of high school course-taking on secondary and postsecondary success. Am. Educ. Res. J. 2012, 49, 285–322. [Google Scholar] [CrossRef]
  30. Montgomery, N.; Allensworth, E.M.; Correa, M. Passing Through Science: The Effects of Raising Graduation Requirements in Science on Course-Taking and Academic Achievement in Chicago; Consortium on Chicago School Research at the University of Chicago Urban Education Institute: Chicago, IL, USA, 2010; Available online: https://consortium.uchicago.edu/publications/passing-through-science-effects-raising-graduation-requirements-science-course-taking (accessed on 25 October 2021).
  31. Gao, N. Does Raising High School Graduation Requirements Improve Student Outcomes? Public Policy Institute of California: San Francisco, CA, USA, 2021; Available online: https://www.ppic.org/wp-content/uploads/does-raising-high-school-graduation-requirements-improve-student-outcomes-february-2021.pdf (accessed on 25 October 2021).
  32. US Department of Education, Institute of Education Sciences. 2019 NAEP High School Transcript Study (HSTS) Results. Nation’s Report Card. 2019. Available online: https://www.nationsreportcard.gov/hstsreport/#home_highlights (accessed on 6 February 2025).
  33. U.S. Department of Education. National Center for Education Statistics, National Assessment of Educational Progress (NAEP), 2009 and 2019 High School Transcript Study (HSTS). 2021. Available online: https://nces.ed.gov/programs/coe/indicator/sod/high-school-courses?tid=4 (accessed on 6 February 2025).
  34. Ogut, B.; Circi, R. Diving into students’ transcripts: High school course-taking sequences and postsecondary enrollment. Educ. Meas. Issues Pract. 2023, 42, 21–31. [Google Scholar] [CrossRef]
  35. Ogut, B.; Yee, D.; Circi, R.; Dizdari, N. Does it matter how the rigor of high school coursework is measured? Gaps in coursework among students and across grades. Educ. Meas. Issues Pract. 2023, 42, 42–52. [Google Scholar] [CrossRef]
  36. National Center for Education Statistics. Access to and Enrollment in Rigorous Coursework. Equity in Education Dashboard. U.S. Department of Education, Institute of Education Sciences. 2024. Available online: https://nces.ed.gov/programs/equity/indicator_f11.asp (accessed on 6 February 2025).
  37. Gottfried, M.A. The influence of applied STEM coursetaking on advanced mathematics and science coursetaking. J. Educ. Res. 2015, 108, 382–399. [Google Scholar] [CrossRef]
Figure 1. Percentages of public and private high school graduates who completed selected science courses in high school: 2009 and 2019. 5 Includes general life science and physical science courses. 6 Includes astronomy, geology, and marine science courses. 7 Indicates graduate completed both biology and chemistry courses. 8 Indicates graduate completed all three subjects of biology, chemistry, and physics. Note: Completion of a mathematics or science course means that the graduate earned credits in a course within the category. It differs from graduates who took a course but did not pass or complete the course. For a high school graduate to be included in the analyses, their transcript had to meet five requirements: (1) the graduate received either a standard or honors diploma; (2) the transcript had three or more years of delineated courses; (3) at least one course on the transcript was taken during the NAEP and HSTS assessment year; (4) the graduate’s transcript contained 16 or more Carnegie credits; and (5) the graduate’s transcript contained at least 1 Carnegie credit in English courses. Although rounded numbers are displayed, the figures are based on unrounded data. Source: U.S. Department of Education (2021). National Center for Education Statistics, National Assessment of Educational Progress (NAEP), 2009 and 2019 High School Transcript Study (HSTS) [33].
Encyclopedia 05 00034 g001
Figure 2. Percentages of public and private high school graduates who completed selected science courses in high school, by race/ethnicity: 2019. 2 Indicates graduate completed all three subjects of biology, chemistry, and physics. Note: Completion of a science course means that the graduate earned credits in a course within the category. It differs from graduates who took a course but did not pass or complete the course. For a high school graduate to be included in the analyses, their transcript had to meet five requirements: (1) the graduate received either a standard or honors diploma; (2) the transcript had three or more years of delineated courses; (3) at least one course on the transcript was taken during the NAEP and HSTS assessment year; (4) the graduate’s transcript contained 16 or more Carnegie credits; and (5) the graduate’s transcript contained at least 1 Carnegie credit in English courses. Race categories exclude persons of Hispanic ethnicity. Although rounded numbers are displayed, the figures are based on unrounded data. Source: U.S. Department of Education. (2021). National Center for Education Statistics, National Assessment of Educational Progress (NAEP), 2019 High School Transcript Study (HSTS) [36].
Encyclopedia 05 00034 g002
Table 1. Burkham and Lee [1] life science/biology pipeline measure.
LevelCourses IncludedClassification Label
0None--
1Basic BiologyLower level/remedial level
2General Biology IStandard/average
3Ecology, Marine Biology, Zoology, Human PhysiologySpecialized, secondary level
4Honors Biology, General Biology IIFurther exposure, secondary level
5Advanced BiologyAdvanced, rigorous
Table 2. Burkham and Lee [1] physical science pipeline measure.
LevelCourses IncludedClassification
0None--
1Physical Science, Applied Physical Science, Earth and Space Science, College-Bound Earth Science, Unified SciencePrimary physical sciences; lower level/introductory
2Astronomy, Environmental Science, Geology, Oceanography, General Physics, Consumer Chemistry, Introductory ChemistrySecondary physical sciences; lower level/introductory
3Chemistry 1 OR Physics 1Standard/average
4Chemistry 1 AND Physics 1Further exposure
5Chemistry 2 OR Physics 2Advanced
Disclaimer/Publisher’s Note: The statements, opinions and data contained in all publications are solely those of the individual author(s) and contributor(s) and not of MDPI and/or the editor(s). MDPI and/or the editor(s) disclaim responsibility for any injury to people or property resulting from any ideas, methods, instructions or products referred to in the content.

