Article

High Glucose Concentration on the Metabolic Activity of C6 Glia Cells: Implication in Alzheimer’s Disease

by
Karla Aketzalli Hernández-Contreras
1,
Fausto Rojas-Durán
2,
María Elena Hernández-Aguilar
2,
Deissy Herrera-Covarrubias
2,
Marycarmen Godinez-Victoria
3,
Jorge Manzo-Denes
2,
César Antonio Pérez-Estudillo
2,
Fernando Rafael Ramos-Morales
4,
Rebeca Toledo-Cárdenas
2 and
Gonzalo Emiliano Aranda-Abreu
2,*
1
Doctorado en Investigaciones Cerebrales, Xalapa-Veracruz 91190, Mexico
2
Instituto de Investigaciones Cerebrales, Universidad Veracruzana, Xalapa-Veracruz 91190, Mexico
3
Instituto Politécnico Nacional, Escuela Superior de Medicina, Ciudad de México 07320, Mexico
4
Instituto de Química Aplicada, Universidad Veracruzana, Xalapa-Veracruz 91190, Mexico
*
Author to whom correspondence should be addressed.
Submission received: 14 November 2024 / Revised: 5 January 2025 / Accepted: 6 January 2025 / Published: 9 January 2025

Abstract

:
Background: Alzheimer’s disease (AD), the leading cause of dementia worldwide, poses an increasing global health burden, yet its pathogenesis remains poorly understood. Diabetes mellitus (DM), characterized by chronic hyperglycemia, has been identified as a significant risk factor for AD development, suggesting a potential metabolic and molecular link between these diseases. Methods: This study examines the impact of sustained high glucose levels on astrocyte-like C6 glial cells, focusing on key cellular processes associated with AD. We evaluated mitochondrial function, oxidative stress, glucose uptake, and the expression of hallmark AD proteins, including β-amyloid and hyperphosphorylated tau. Results: Our findings demonstrate that high glucose exposure triggers mitochondrial hyperactivity, oxidative stress, and increased Tau phosphorylation, though β-amyloid levels were unaffected within the experimental timeframe. Conclusions: These results shed light on the early cellular dysfunctions contributing to the DM-AD connection, providing valuable insights into the metabolic pathways involved and identifying potential therapeutic targets to mitigate AD progression in individuals with DM.

1. Introduction

Alzheimer’s disease accounts for the largest cases of dementia in the world, posing a significant public health challenge due to its increasing prevalence and the absence of a definitive cure [1]. The disease is characterized by neuroinflammation, the accumulation of β-amyloid (Aβ) plaques, and the hyperphosphorylation of Tau protein (pTau), which collectively contribute to neuronal dysfunction and cognitive decline [2,3].
Diabetes mellitus (DM), a chronic metabolic disorder marked by persistent hyperglycemia, has been identified as a major risk factor for AD [4,5]. Epidemiological studies reveal that individuals with DM are at a significantly higher risk of developing AD-related dementia, with disruptions in glucose metabolism emerging as a central link between these diseases [6,7]. High glucose concentrations (HGC) exacerbate oxidative stress, mitochondrial dysfunction, and neuroinflammatory responses, which are implicated in the progression of both DM and AD [8,9].
Astrocytes, the vital regulators of brain metabolism and homeostasis, are increasingly recognized as key players in the DM-AD connection. These glial cells maintain interstitial glucose levels, provide metabolic support to neurons, and mediate the clearance of pathological proteins such as Aβ [10,11]. However, under HGC conditions, astrocytes undergo reactive astrogliosis, characterized by morphological and functional alterations that may exacerbate AD pathology [12,13]. The precise molecular mechanisms linking HGC exposure to the expression of AD-related proteins, including Aβ, Tau, and pTau, remain poorly understood [14,15].
This study explores the molecular effects of chronic HGC exposure on astrocyte-like cells, focusing on mitochondrial activity, oxidative stress, and the expression of hallmark AD proteins. Using rat-derived C6 glial cells as a model for astrocytes, we aim to elucidate how HGC influences key cellular processes and to identify mechanisms connecting DM to AD [16,17,18]. By shedding light on these interactions, this study seeks to provide insights that can inform the development of targeted therapeutic strategies to mitigate AD progression in individuals with DM.

2. Materials and Methods

C6 cells are histopathologically classified as a glial tumor-derived cell line, specifically an astrocytoma [19]. Among the most important characteristics of C6 cells for which they have been considered a cell model in several studies are the stability of their mutations compared to other cell models [20], and the similarity they have with astrocytes with respect to the expression of proteins such as GFAP, S100b, indicators of glial activation [21], and agents such as ROS [22]. Other proteins and factors that both astrocytes and C6 cells express include the β-type BACE1 secretase [23], gamma secretase elements such as PEN-2 and Nicastrin [18], GSK-3β kinase [24], Aβ peptide [25], Tau protein and pTau [18], as well as ROS [26,27].

2.1. C6 Cell Culture

C6 cells (rat glia cell line, glioma) (ATCC, CCL-107, Manassas, VA, USA) were kindly donated by Dr. Carolina Barrientos, Universidad Veracruzana, and were seeded in 55 cm2 Petri dishes in 10 mL of DMEM culture medium without phenol red and glucose, supplemented with 10% Fetal Bovine Serum (FBS) and 1% penicillin, under standard conditions. Cell transfer was carried out when approximately 70% to 80% cell confluence was reached, the culture medium was removed, the culture dish was rinsed with sterile PBS, and 1 mL of trypsin was added: incubating at 37 °C for 3 min, monitoring the loss of cell adhesion. The cell suspension was then collected and centrifuged at 2500 rpm for 5 min. The supernatant liquid was then decanted, and the cell button was resuspended in culture medium, then the cell density was determined in order to estimate the amount of μL of sample that should be reseeded to maintain 40% confluence in the dish. Cell density and viability is denoted by trypan blue exclusion staining.

2.2. Culture of C6 Cells Under High Glucose Conditions

In total, 40,000 cells/cm2 were seeded in 55 cm2 Petri dishes and maintained in 10 mL of DMEM culture medium without phenol red and glucose with 10% Fetal Bovine Serum (FBS), 4 mM glutamine and 1% penicillin, under standard conditions of 5% CO2 and a temperature of 37 °C for 24 h to achieve cell fixation; each dish was considered an experimental unit (EU). Subsequently, two experimental groups were established and exposed to 35 mM HGC and a control group of 6 mM glucose in DMEM medium without phenol red and without glucose, 10% FBS and 1% penicillin and incubated under standard conditions for 72 h, changing the medium at 24 and 48 h to maintain a constant glucose concentration. All experiments were performed by triplicate.

2.3. Cell Viability Assay

C6 cells were seeded at a density of 40,000 cells/cm2 per well in a 6-well plate. After 72 h of exposure, the trypan blue exclusion assay was performed by counting in a Neubahuer chamber, and the number of birefringent cells (viable) and the number of total cells (sum of blue-stained and birefringent cells) were counted. A viability value higher than 90% was considered acceptable. The formula for estimating the percentage of viability from the counts was as follows:
% viable cells = [number of birefringent cells ÷ total number of cells] × 100.
Viability assessment by flow cytometry was complemented by fluorolabeling the cells with propidium iodide and the annexin detection technique. For this assay, cells were incubated in a 6-well plate at a density of 40,000 cells per cm2. They were incubated for 24 h to achieve adhesion, and at 72 h of incubation under experimental conditions at 6 and 35 mM glucose concentration, the cells were washed with 3 mL PBS and detached with 1 mL trypsin. The cell suspension obtained was incubated with binding buffer (10 mM Hepes/NaOH (pH 7.4) 140 mM NaCl, 2.5 mM CaCl2) for 30 min, followed by incubation with FITC-conjugated Annexin V antibody for 30 min, after which 1 μL of IP was immediately added for analysis. This technique is able to differentiate between necrosis and apoptosis due to the impermeable nature of PI (Sigma-Aldrich, Saint Louis, MO, USA). Samples were analyzed on a BD FACSAria TM Cell Sorter flow cytometer and analyzed in Flowing Software 2.5 USA. In total, 10,000 events from the R1 region were acquired and analyzed. Data were reported as the percentage of cells located in each quadrant on the IP/Anexin V dot plot.
Excitation light emission was performed at 488 nm with an argon laser. The FITC signal (green fluorescence) was detected at 518 nm and the log of this fluorescence was plotted on the X-axis. The PI signal (red fluorescence) was detected at 620 nm and the log of this was plotted on the Y-axis.

2.4. Indirect Evaluation of Cellular Glucose Uptake

C6 cells were seeded at a density of 40,000 cells/cm2 in 6-well plates; after 72 h of exposure to HGC and control glucose conditions a change in culture medium supplemented with 6 mM glucose was performed, incubating under standard conditions for 24 h for reversibility assay A, after which a 10 μL sample of culture medium was taken from each well and processed according to the specifications of the Glucose-LQ GOD-POD kit, SpinReact, México; the absorbance (A) of the standard and sample was read against the Reagent Blank in the microplate reader at a wavelength of 505 nm (490–550). Calculations for the conversion of the absorbance obtained were as follows:
[(A)Sample − (A)blank/(A)standard − (A)blank] × 100 = mg/dL glucose.
A complementary HGC adaptability assay B was performed, in which cells exposed for 72 h to control and HGC conditions were incubated for 24 h at a 35 mM concentration of glucose, after which the glucose measurement assay was performed by the glucose peroxidase method as described in the Glucose-LQ GOD-POD kit.

2.5. Evaluation of Mitochondrial Activity

In total, 40,000 cells/cm2 were seeded in a 96-well plate; after 72 h of exposure to HGC conditions the MTT assay was performed by measuring the absorbance of the microplate at a wavelength of 595 nm.

2.6. Analysis of Mitochondrial Membrane Potential (ΔΨm)

To measure the ΔΨm, the fluorescent probe, rodamine 123 (ATT Bioquest, Sunnyvale, CA, USA) was used following the manufacturer’s instructions. In total, 20,000 C6 cells/cm2 were seeded in 6-well plates, cultured in DMEM medium without phenol red and low 5.5 Mm glucose; after seeding, they were kept at rest for 24 h to promote cell adhesion and exposed to control (5 mM glucose) and experimental (35 mM glucose) conditions for 72 h with a change in culture medium at 48 h. The medium was then removed, preserving it to recover unattached cells; the wells were washed with 1 mL of PBS, which was likewise recovered, and 500 μL of trypsin was added per well acting for 1.5 min to achieve the suspension of the cells that were also recovered in the same container where the culture medium and PBS were preserved, and 2 washes were performed with PBS solution at the end of which 500 μL of working reagent (1 mg mL−1) of rhodamine 123 reagent in 1% PBS-BSA solution was added and incubated for 10 min at 37 °C in the dark. At the end, the reaction was stabilized by exposure to cold (4 °C), and the excess reagent was removed by centrifuging each tube at 1500 rpm (252 RCF) × 5 min, followed by 1 wash with PBS-BSA, and finally the cell button was resuspended in 500 μL of PBS-BSA, and the fluorescence intensity was measured in cytometer with the excitation filter at 508 nm, the emission at 528 nm, and the extinction coefficient at 85,200 cm−1M−1.

2.7. Determination of Intracellular Reactive Oxygen Species

In total, 40,000 C6 cells per cm2 were incubated in 96-well plates, and after 72 h of exposure to the conditions, the DCFH-DA assay (Sigma, Saint Louis, MO, USA) was performed. The 3-well suspension was pooled to form an experimental unit of which fluorescence microscopy photomicrographs were obtained at an excitation wavelength of 485 nm and an emission wavelength of 520 nm. Fluorescence photomicrographs were analyzed with imageJ software (v1.54). To decrease the autotuning bias of the microscopy equipment, the corrected total cell fluorescence (CTCF) was calculated with the following formula:
CTCF = Integrated density − (Area of the selected cell × Mean fluorescence of background readings).

2.8. Western Blot

Proteins were assayed by Western blot analysis using specific antibodies (Santa Cruz Biotechnology, Inc., Dallas, TX, USA/Sigma Aldrich) Nicastrin (SC25648) at a 1:1000 dilution, GFAP (SAB5700611) at a 1:1000 dilution, and GAPDH (SC25778) at a 1:1000 dilution was used as a control. For protein extraction, 1000 μL of cold PBS was added to each 55 cm2 Petri dish to wash the cells from the culture medium and then 600 μL of cell lysis buffer (stock: 1% NP-40, 10% Glycerol, 137 mM NaCl, 20 mM Tris-HCl, pH = 8, H2O, protease inhibitor) was added, incubated for 10 min at 25 °C with gentle agitation, and the monolayer was detached by scraping. Protein quantification (Pierce™ BCA Protein Assay Kits # 23225) was performed by the Pierce BCA method. Finally, band density was quantified using the Gel-Doc + gel documentation system and Image Lab software v3.0.1 (Biorad, Hercules, CA, USA).

2.9. Enzyme-Linked Immunosorbent Assay (ELISA)

Semiquantitative sandwich ELISA was performed, which is why measurements are expressed as absorbance. In total, 100 μL of plugging buffer was incubated with Ac 1° (pTau 1:1000 (sc-101813), Tau 1:1000 (sc-1995) and β amyloid (sc-28365)), in a 96-well plate, for 18 h at 4 °C; excess capping buffer was removed and washed 1x with 200 μL of TBS-Tween, the plate was blocked by adding 200 μL of 1% milk per well, for 1 h at 37 °C, followed by 3 washes with TBS-Tween, after which 100 μL of sample was added for Tau and pTau 0. 8 μg of protein per well and for β amyloid 8 μg of protein. They were incubated for 2 h at 37 °C followed by 1 wash with TBS-Tween, and 100 μL of secondary antibody diluted in 1% milk was added for 2 h at 37 °C (pTau antirabbit (1:1000, Tau anti-mouse (ab-97020) 1:500, GFAP antirabbit (sc2012) 1:1000, and β amyloid anti-mouse (ab-97020) 1:500; the secondary antibody was removed, after which 1 wash was performed with TBS Tween. Subsequently, 50 μL of substrate p-nitrophenyl phosphate, disodium salt (PNPP # 37621) was added for 2 min at room temperature (25–30 °C). Absorbance was determined with the microplate reader at an absorbance of 415 nm.

2.10. Statistical Analysis

The JASP program (https://jasp-stats.org/) was used for statistical analysis and graphic expression of the results. The Shapiro–Wilk test was used for normality assessment, the Levene test was used for homoscedasticity, and Student’s t-test was performed for continuous quantitative data. In the case of results that did not pass the homoscedasticity test, Student’s t test with Welch’s correction was performed. Additionally, a Spearman correlation test was performed to evaluate the bidirectional influence between Tau expression and pTau generation.

3. Results

3.1. Cell Viability and Proliferation

No statistically significant differences were observed between the viability percentages of control cells (average viability 77.2%) and those exposed to HCG (average viability 81.7) with a value of p = 0.195, neither in terms of percentage of early apoptosis (average 0.82 for control and average 2.3 for HGC; p = 0.375), nor necrosis (average 3.5 for control and 4.8 for HGC; p = 0.825). However, a statistically significant higher tendency to late apoptosis was appreciated in the cells of the control group (average 18.3 for control and average 11.04 for HGC; p = 0.028) (Figure 1).

3.2. Measurement of Residual Glucose in the Culture Medium

The data of the reversibility test by exposure to 6 mM glucose for 24 h showed a value of p = 0.1391 in Student’s t-test and the data of the adaptability test by exposure to 35 mM glucose for 24 h showed a value of p = 0.0240 by Student’s t-test with Welch’s correction, reflecting a statistically significant difference between the control group and HGC (Figure 2).

3.3. Assessment of Mitochondrial Activity

The absorbance measurement values of the control and HGC groups presented a p value < 0.001 by Student’s t-test, with the absorbance value being significantly higher in the HGC group (Figure 3).

3.4. Measurement of Mitochondrial Membrane Potential (ΔΨm)

In the analysis of the ΔΨm of viable cells by flow cytometry rhodamine assay, a p value of 0.05 is observed with a trend toward a higher ΔΨm in cells belonging to the HGC group, indicated by a higher concentration of rhodamine in each cell (Figure 4).

3.5. Intracellular ROS Estimation

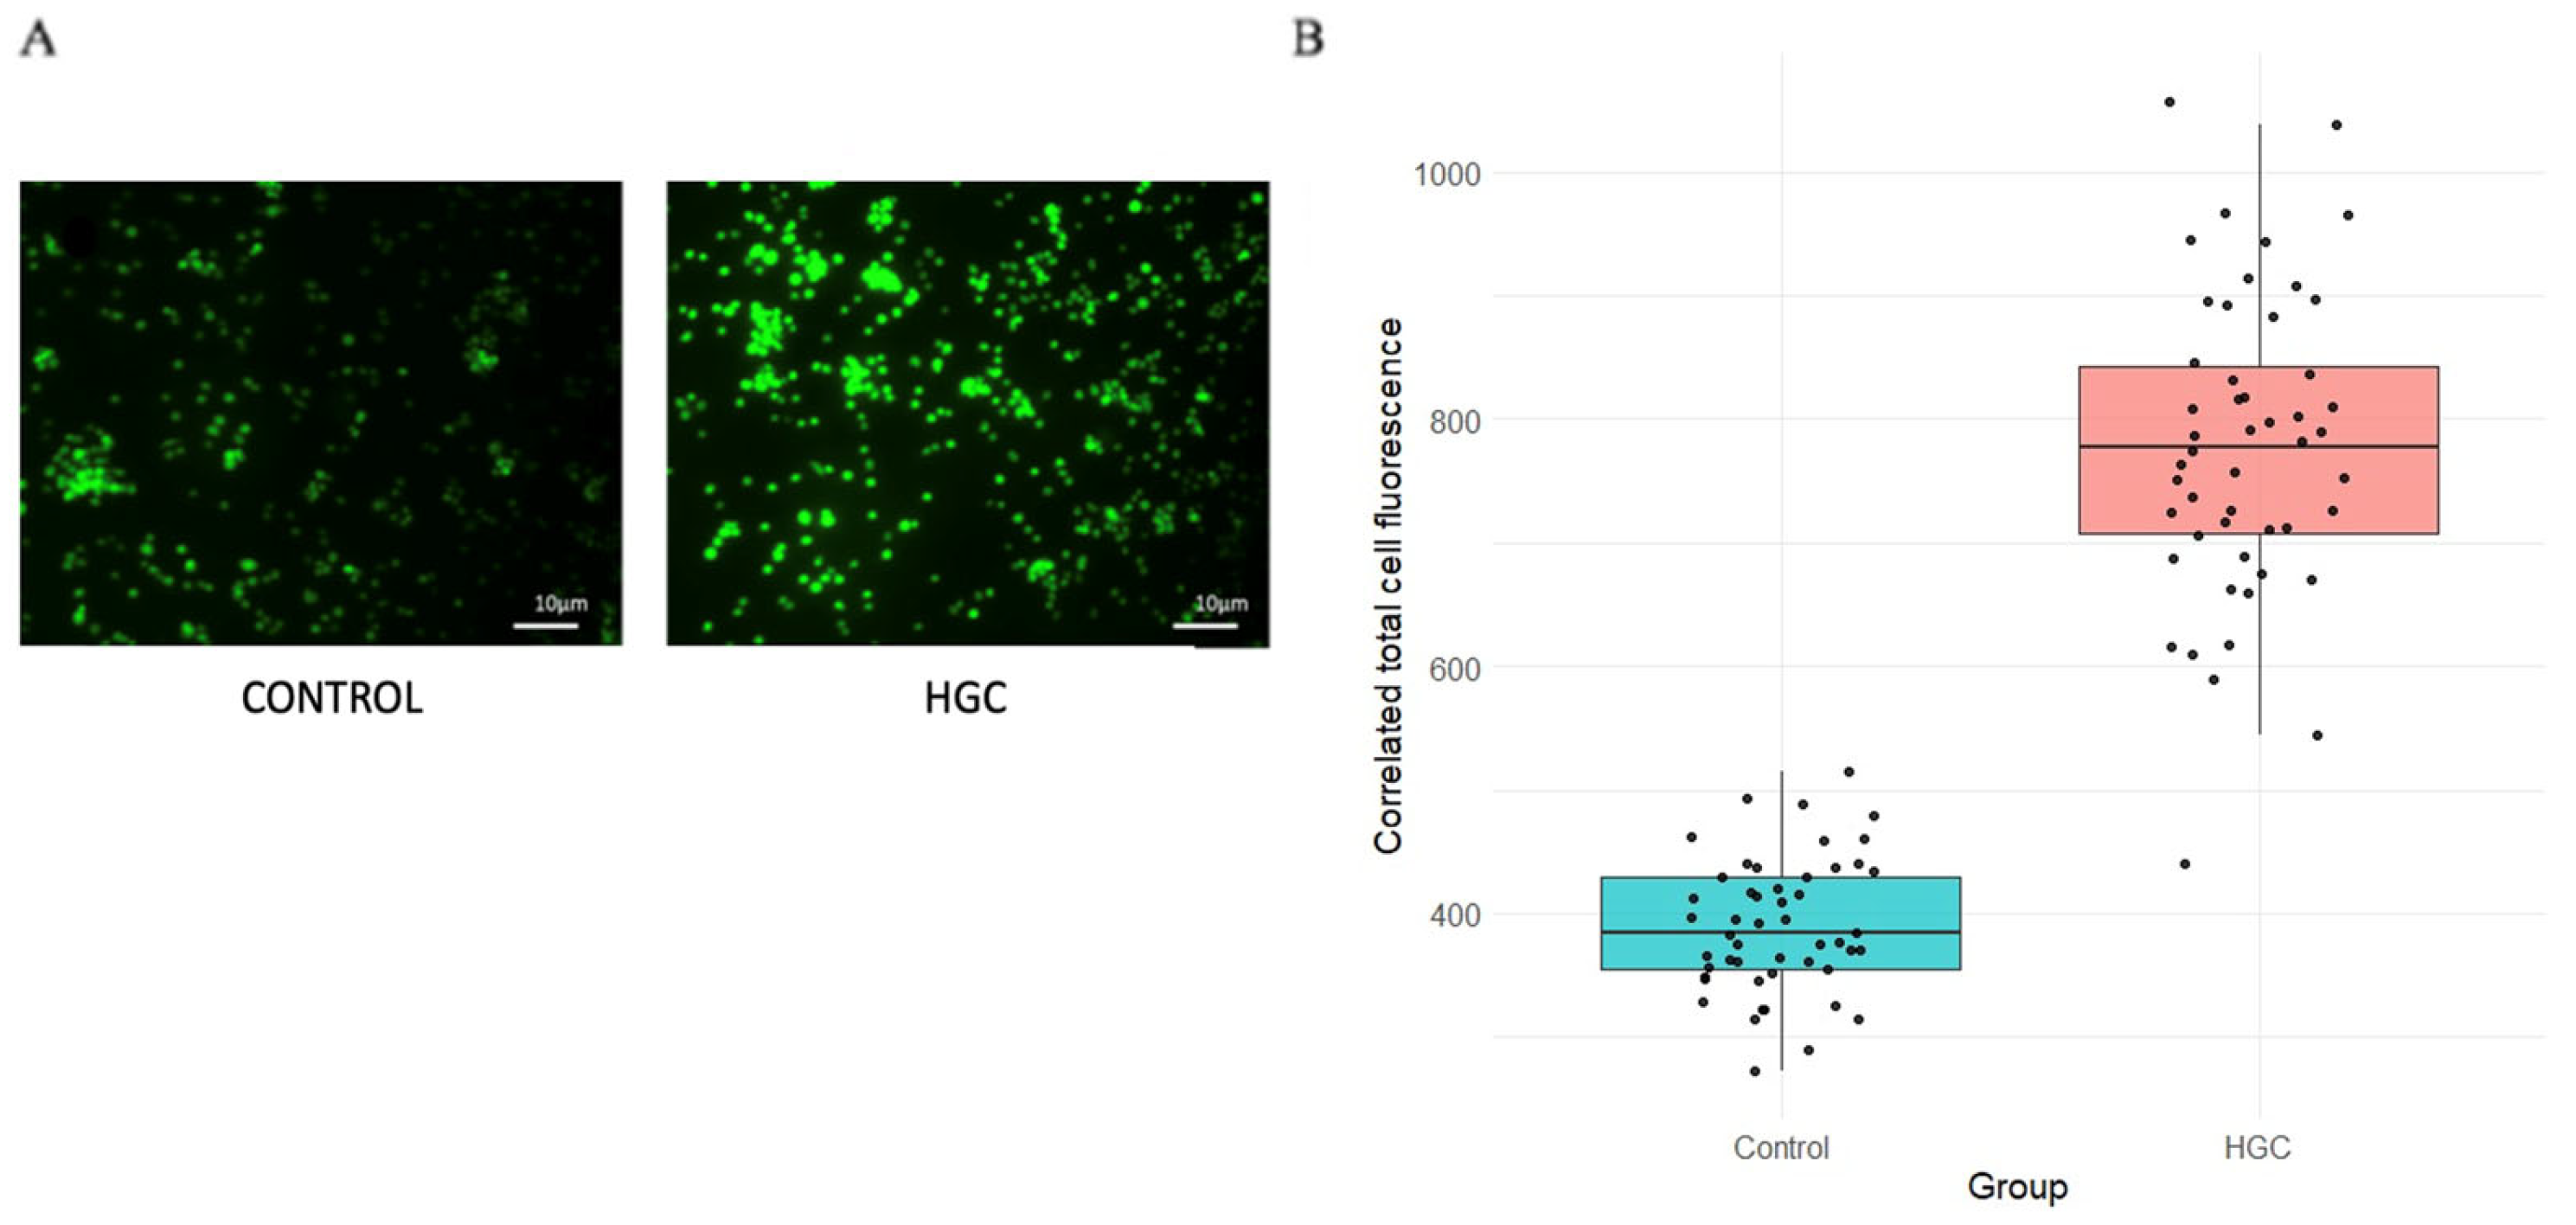
The estimated CTCF values of the control and HGC groups passed the normality test, but not the homoscedasticity test, so they were analyzed by Student’s t-test with Welch’s correction, obtaining a value of p = 0.0289, with a significantly higher fluorescence indicative of intracellular ROS in the HGC group (Figure 5A,B).

3.6. Immunodetection of GFAP and Nicastrin by Western Blot Method

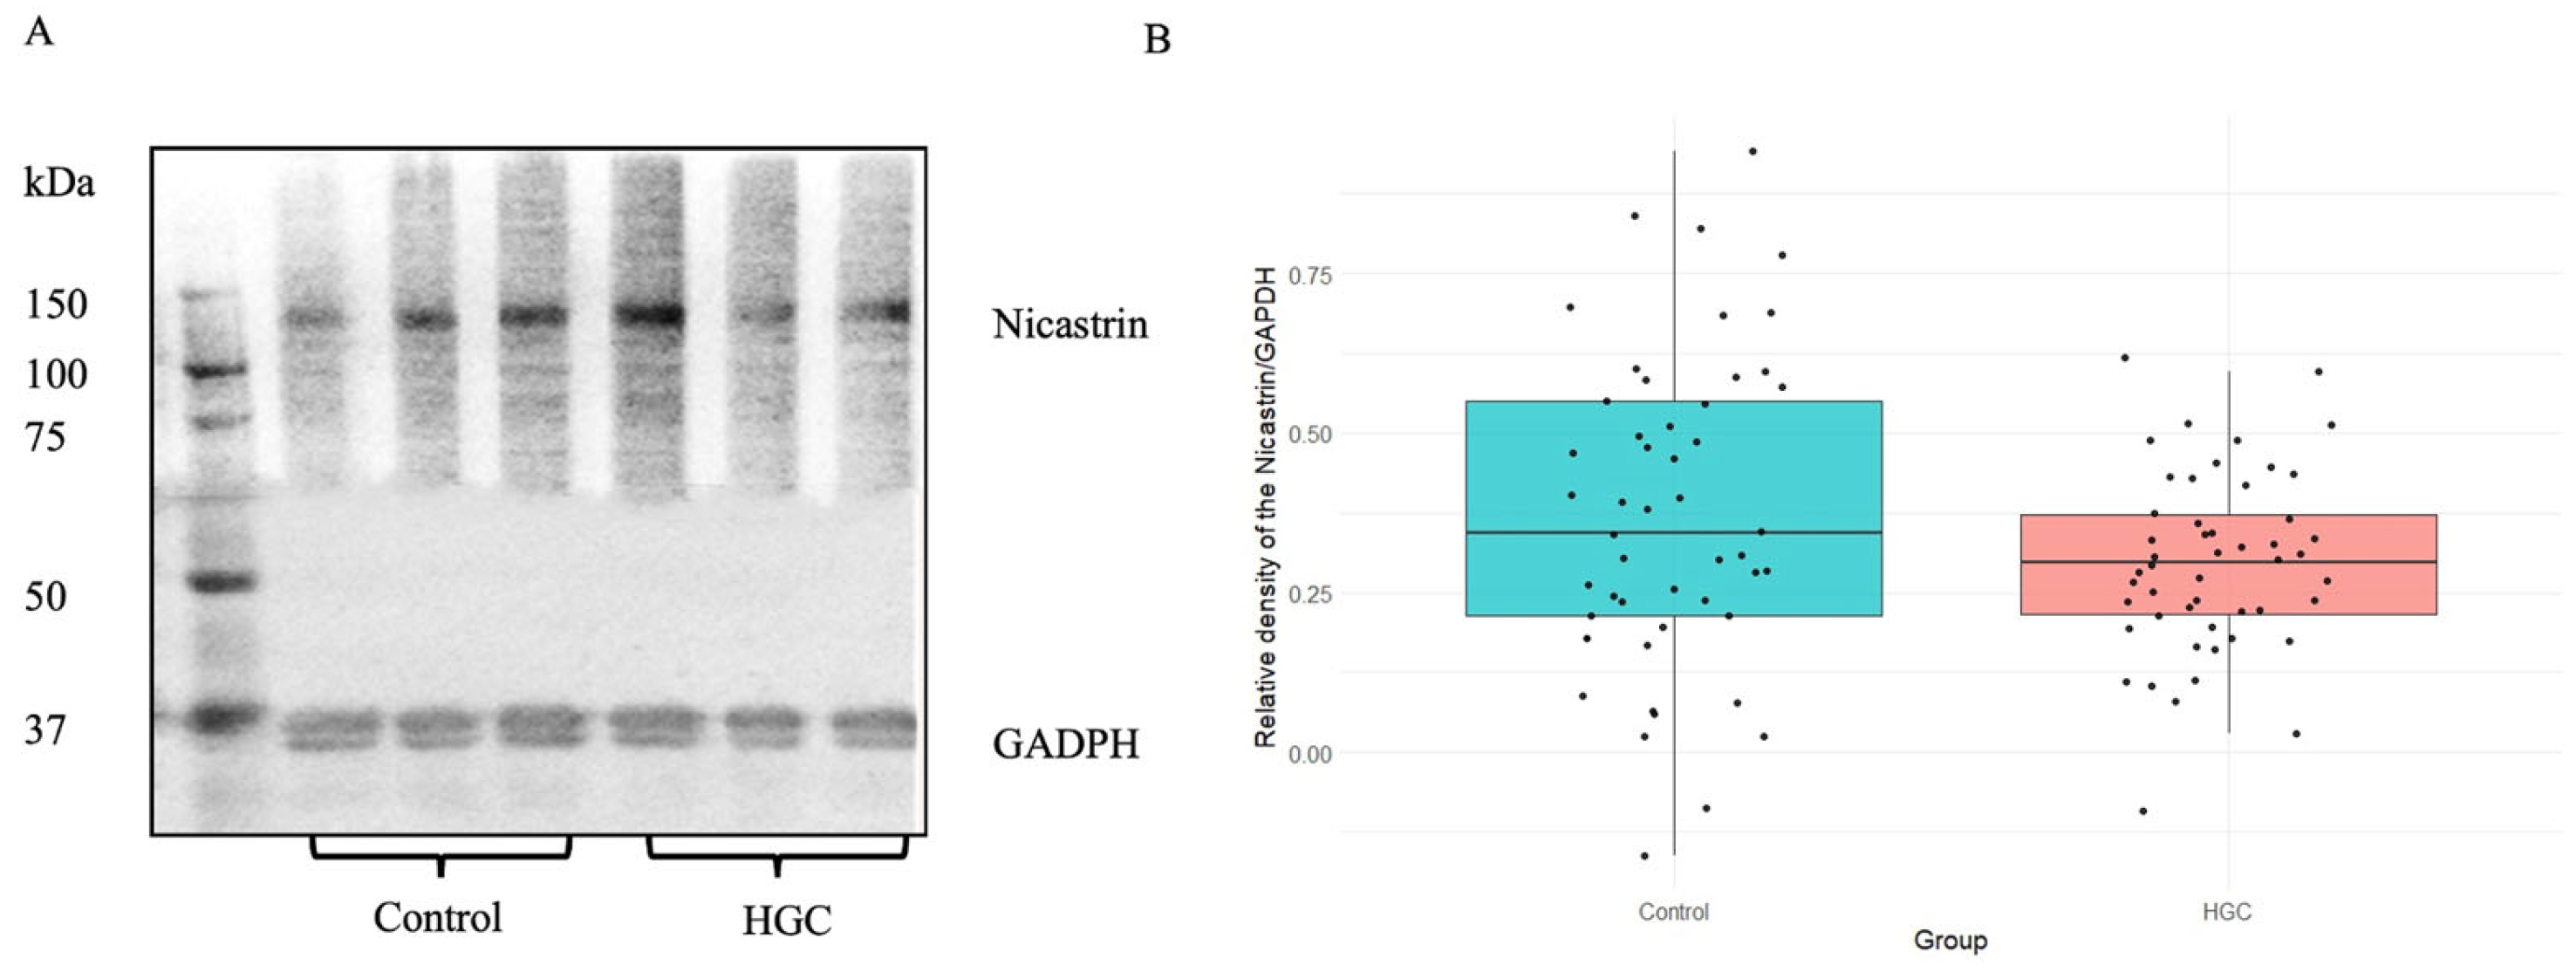
The values of the relative density of the GFAP/GAPDH bands obtained through the Western blot method passed the homoscedasticity test, but not the normality test, so a Student’s t-test with Welch’s correction was performed, obtaining a value of p = 0.287 when comparing the GFAP concentration between the control group and HGC (Figure 6A,B). The values of the relative density of the Nicastrin/GAPDH bands obtained through the Western blot method passed the normality and homoscedasticity tests and were analyzed by means of Student’s t-test, obtaining a value of p = 0.322 (Figure 7A,B).

3.7. Estimation of Tau and pTau by the Sandwich ELISA Method

The estimated values of Tau and pTau of the control group and HGC passed the normality and homoscedasticity test, so they were analyzed by 2-way ANOVA considering the experimental or control group as one factor and the type of Tau or hyperphosphorylated Tau (pTau) as another factor, and the Tukey test as a post hoc test, obtaining a value of p = <0.001 with no interaction between both factors (Figure 8A,B).

3.8. Estimation β Amyloid by Sandwich ELISA Method

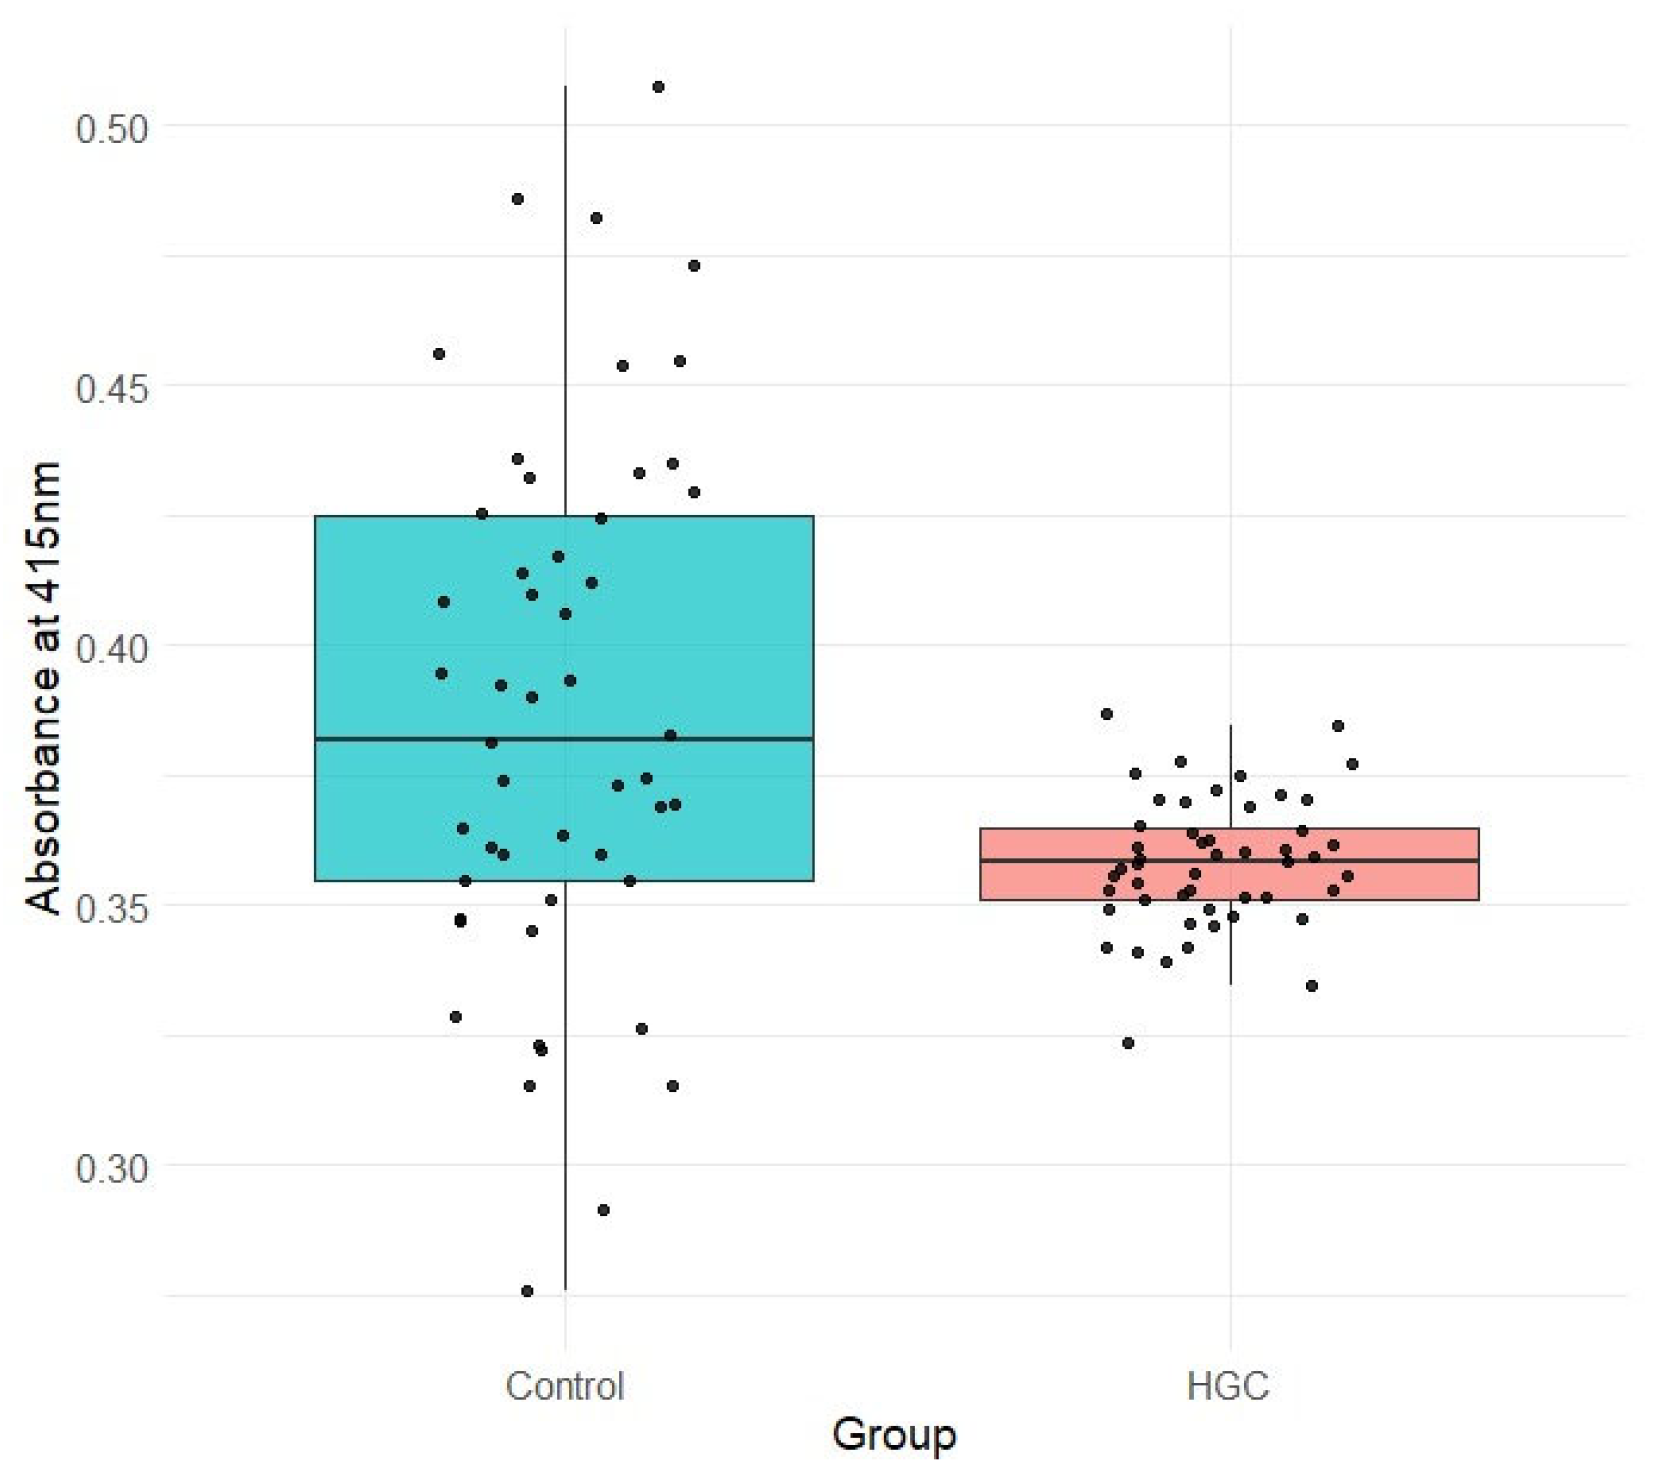
The estimated β-amyloid values of the control group and HGC passed the normality test but not the homoscedasticity test, so they were analyzed by Student’s t test with Welch’s correction obtaining a p value = 0.088 considering (Figure 9).

4. Discussion

The study of the relationship between Alzheimer’s disease (AD) and Diabetes Mellitus (DM) is highly relevant from a preventive perspective. DM is widely recognized as a significant risk factor for the development and progression of AD, with individuals with DM exhibiting an average relative risk of 1.9 for progressing to AD-type dementia and a pooled adjusted risk ratio of 1.57 [4,28]. Despite this strong association, clinical practice guidelines for managing DM often prioritize detecting peripheral nervous system complications, such as diabetic neuropathy and retinopathy, which have been studied for a longer time, while cognitive impairment and dementia detection strategies remain limited [29]. This highlights the pressing need for improved diagnostic approaches and preventive measures targeting cognitive decline in DM patients.
The exploration of the DM–dementia relationship, and particularly the DM-AD connection, is relatively recent. A landmark study by Steen et al. in 2005 identified alterations in glucose metabolism in the brain tissue of AD patients, which marked a significant step in understanding the molecular links between these conditions [9]. Subsequent research has consistently underscored the significance of glucose metabolism dysregulation in this relationship, with high glucose concentrations (HGC) emerging as a critical factor in the DM-AD connection [9,30,31,32].
Astrocyte-like cells play a crucial role in maintaining interstitial glucose availability in brain tissue, positioning them as central players in the molecular mechanisms linking DM and AD. These cells regulate glucose metabolism and neuronal support, making them key targets for understanding how HGC impacts brain function. Investigating the molecular alterations in astrocytic functions under hyperglycemic conditions can provide critical insights into how these changes contribute to hallmark AD pathologies, including β-amyloid plaque formation and Tau hyperphosphorylation [13,33,34].
It has been observed that the molecular and cellular alterations leading to AD begin 10 to 20 years before clinical manifestations [35]. During this preclinical period, as observed in animal models, the initial phase is marked by astrocytic atrophy, which is followed by a phase of predominantly heterogeneous morphology coinciding with the onset of Aβ production. This phase subsequently progresses to hypertrophy in the later stages of the disease, as evidenced by the analyses of postmortem human brain tissue and animal models of late-stage AD [36]. The morphological analysis of our model aligns with these observations, associating it with the intermediate and late phases of AD astrocytic alterations [37].
While increased GFAP expression is often regarded as an indicator of astrocyte activity, it demonstrates variability in AD. GFAP expression tends to decrease during the early stages of AD, corresponding to astrocytic atrophy, and then increases significantly in the later stages, coinciding with astrocytic hypertrophy and morphological changes [36,38].
In astrocyte-like cell models such as primary astrocytes and C6 cells, exposure to high glucose concentrations (HGC) for up to five days has been shown to significantly reduce GFAP expression, likely due to delayed cell maturation. HGC-induced reductions in cell proliferation are linked to alterations in specific genes governing cell cycle progression [13,39]. However, in our study, no statistically significant differences in cell proliferation were observed between groups when measured via the trypan blue exclusion assay (p = 0.063). This discrepancy may stem from differences in exposure duration, as our model used a 72 h exposure period compared to the 96 h to five-day periods reported in other studies. This shorter exposure time may have been insufficient for GFAP expression in the HGC group to reach statistically significant levels compared to the control group [12,39].
Although a statistically significant increase in GFAP expression has been reported in the C6 cell model exposed to elevated glucose concentrations over a 48 h period [24], recent evidence suggests a positive association between astrocytic reactivity, characterized by GFAP expression, and glucose consumption at the brain level. However, this association appears to be uncoupled from the expression of the abnormal forms of Tau. This phenomenon may result from the inability to meet high energy demands under conditions of tauopathy, leading to the phenotypic differentiation of astrocytes. Under such pathological conditions, astrocytes may not express GFAP regularly, as an adaptive mechanism involving the ERK1/2 pathway in response to the increased expression of the hyperphosphorylated form of Tau (pTau) [40]. These observations are consistent with our findings, as GFAP concentration in our HGC model did not differ from that of the control group, suggesting a non-monotonic (uncoupled) astrocytic activation response associated with metabolic variations and the presence of pTau [40,41,42].
The results of the residual glucose evaluation in the culture medium, used as an inverse and indirect indicator of cellular glucose uptake, suggest that exposure to HGC for 72 h increases the metabolite internalization capacity. This finding aligns with previous reports indicating the maintenance of GLUT1 levels in the membrane of astrocyte-like cells exposed to HGC conditions. GLUT1 is the primary glycotransporter in astrocyte-like and C6 cells. The increased glucose uptake under HGC conditions appears primarily driven by the higher extracellular glucose concentration gradient, as GLUT1 facilitates diffusion-based glycotransport [13].
The reversibility assay further demonstrated no statistically significant differences in glucose uptake between the HGC and control groups, reinforcing the concept that glucose uptake through GLUT1 is governed by the concentration gradient during HGC exposure. Notably, prolonged HGC exposure (3 to 4 weeks) has been shown to sustain the cells’ ability to regulate interstitial and culture medium glucose availability, primarily through glycogen degradation under low-glucose conditions [13].
The increased ability to internalize glucose under HGC conditions not only represents a counter-regulatory mechanism aimed at reducing interstitial glucose concentration but is also associated with increased glycogenesis and glycolysis. This process originates from fructose-6-phosphate, which is derived from glucose phosphorylation by hexokinase I, an enzyme that is 70% bound to mitochondria and 30% suspended in the cytosol [13]. According to the results of our MTT assay, HGC conditions caused an increase in mitochondrial activity. Specifically, this assay reflects the activity of cellular nicotinamide adenine dinucleotide phosphate (NADPH)-dependent oxidoreductase enzymes at the mitochondrial level [43]. Increased NADPH generation is linked to conditions such as the activation of the sorbitol pathway and oxidative stress [44]. Furthermore, some studies suggest that mitochondrial complex II participates in the production of formazan crystals in the MTT assay [45,46], and it has been proposed that this complex may contribute to ROS production through reverse transport in cooperation with complex I [47].
Additionally, the ΔΨm measurement aligns with the MTT results, suggesting an increase in mitochondrial activity in the HGC group. In contrast to what was reported in neuronal-type cells by Ciccarelli et al. in 1997, our study indicates that oxidative stress is associated with increased mitochondrial activity in glial-type cells, as evidenced by the concentration of rhodamine 123. This finding suggests that mitochondrial glucose metabolism is a significant source of the ROS measured in the HGC group [48].
For the evaluation of apoptosis and overall cell viability, an annexin and propidium iodide assay was performed. Consistent with the viability assay using trypan blue, no statistically significant differences in viability percentages were observed between groups. However, a statistically significant difference was found in late apoptosis, with a greater tendency in the control group. This observation suggests that the subacute exposure period induces cell activation, enabling HGC-exposed cells to better withstand experimental handling conditions compared to control cells [49]. Nevertheless, we hypothesize that prolonged exposure to HG would lead to increased apoptosis in the HGC group, driven by mitochondrial dysfunction. Alterations in mitochondrial morphology and the elevated expression of mitochondrial proapoptotic proteins have been reported in cells exposed to HG as early as 24 h after exposure [50].
Furthermore, the increase in mitochondrial activity observed in the MTT assay suggests heightened mitochondrial glycolytic activity. This aligns with observations reported in astrocytes exposed to HGC conditions, where an increased extracellular acidification rate (ECAR) was analyzed as an indicator of lactate production derived from glycolysis. Elevated ECAR was also associated with increased cellular ATP production, which was significantly reduced following exposure to the ATP synthase inhibitor oligomycin, thereby confirming an increase in mitochondrial glycolytic activity under HGC conditions [37].
Hyperactivity of the glycolytic pathway favors the increased activity of the cytoplasmic isoform of aspartate aminotransferase (AATc) and the mitochondrial isoform of aspartate aminotransferase (AATm). This hyperactivity, combined with the inhibition of 2-oxoglutarate dehydrogenase, leads to an increase in 2-oxoglutarate concentration and subsequent aspartate depletion, an elevated cytosolic NADH/NAD ratio, and the generation of glutamate and oxaloacetate. These metabolic alterations are associated with an increased risk of excitotoxicity, as observed in DM models [51,52,53,54].
The primary impact of altered mitochondrial function, however, is the increased production of reactive oxygen species (ROS) and associated oxidative stress. This was evident in the DCFDA assay, where the HGC group demonstrated statistically significantly higher intracellular ROS production [44,54]. ROS contribute to the DM-AD link by inducing cell membrane peroxidation and direct DNA damage, with mitochondrial DNA being particularly vulnerable due to the lack of protective histones [34,55,56]. While acute periods of HGC exposure may induce mitochondrial biogenesis via the expression of PGC-1α (PPARγ coactivator-1α), which promotes the transcription of functional mitochondrial proteins [37,57], prolonged exposure results in mitochondrial dysfunction, and depletion of function [13].
These findings underscore the potential linkage of oxidative stress with the mitochondrial hypothesis of AD origin, integrating these mechanisms to better understand the DM-AD connection [17,34].
Oxidative stress causes significant damage to cellular components, resulting in altered membrane properties such as fluidity, ion transport, enzymatic activities, and protein cross-linking, ultimately leading to cell death [57]. This oxidative stress microenvironment can be considered a promoting factor for pTau generation, as oxidative stress plays a critical role in neurofibrillary tangle (NFT) formation in AD. Mechanisms such as mitochondrial SOD2 deficiency, the inhibition of glutathione synthesis with buthionine sulfoximine (BSO), the activation of PP1, the inhibition of PP2A, and increased GSK-3β activity contribute to Tau hyperphosphorylation at multiple sites [58].
The increased production of pTau has been proposed as a potential initiating step in sporadic AD. Postmortem analyses of human brains reveal the appearance of pTau up to 10 years prior to the formation of Aβ plaques. This coincides with evidence that neurofibrillary tangles impede the transit of APP-containing endosomes, thereby promoting increased Aβ production as the disease progresses. These findings support the concept of a bidirectional synergistic relationship between pTau and Aβ, wherein the early onset of one accelerates the production of the other, contributing to AD progression [59].
The study of the DM-AD linkage holds promise for identifying timely intervention strategies for patients with DM, aiming to prevent the development and progression of AD. Considering the wide time window between the onset of molecular alterations and the clinical manifestations of AD, understanding the molecular implications of this linkage facilitates the proposal of prevention strategies and pharmacological treatments. These approaches could target key proteins implicated in the DM-AD connection, offering new opportunities for mitigating AD risk in diabetic populations [60,61,62,63].

5. Conclusions

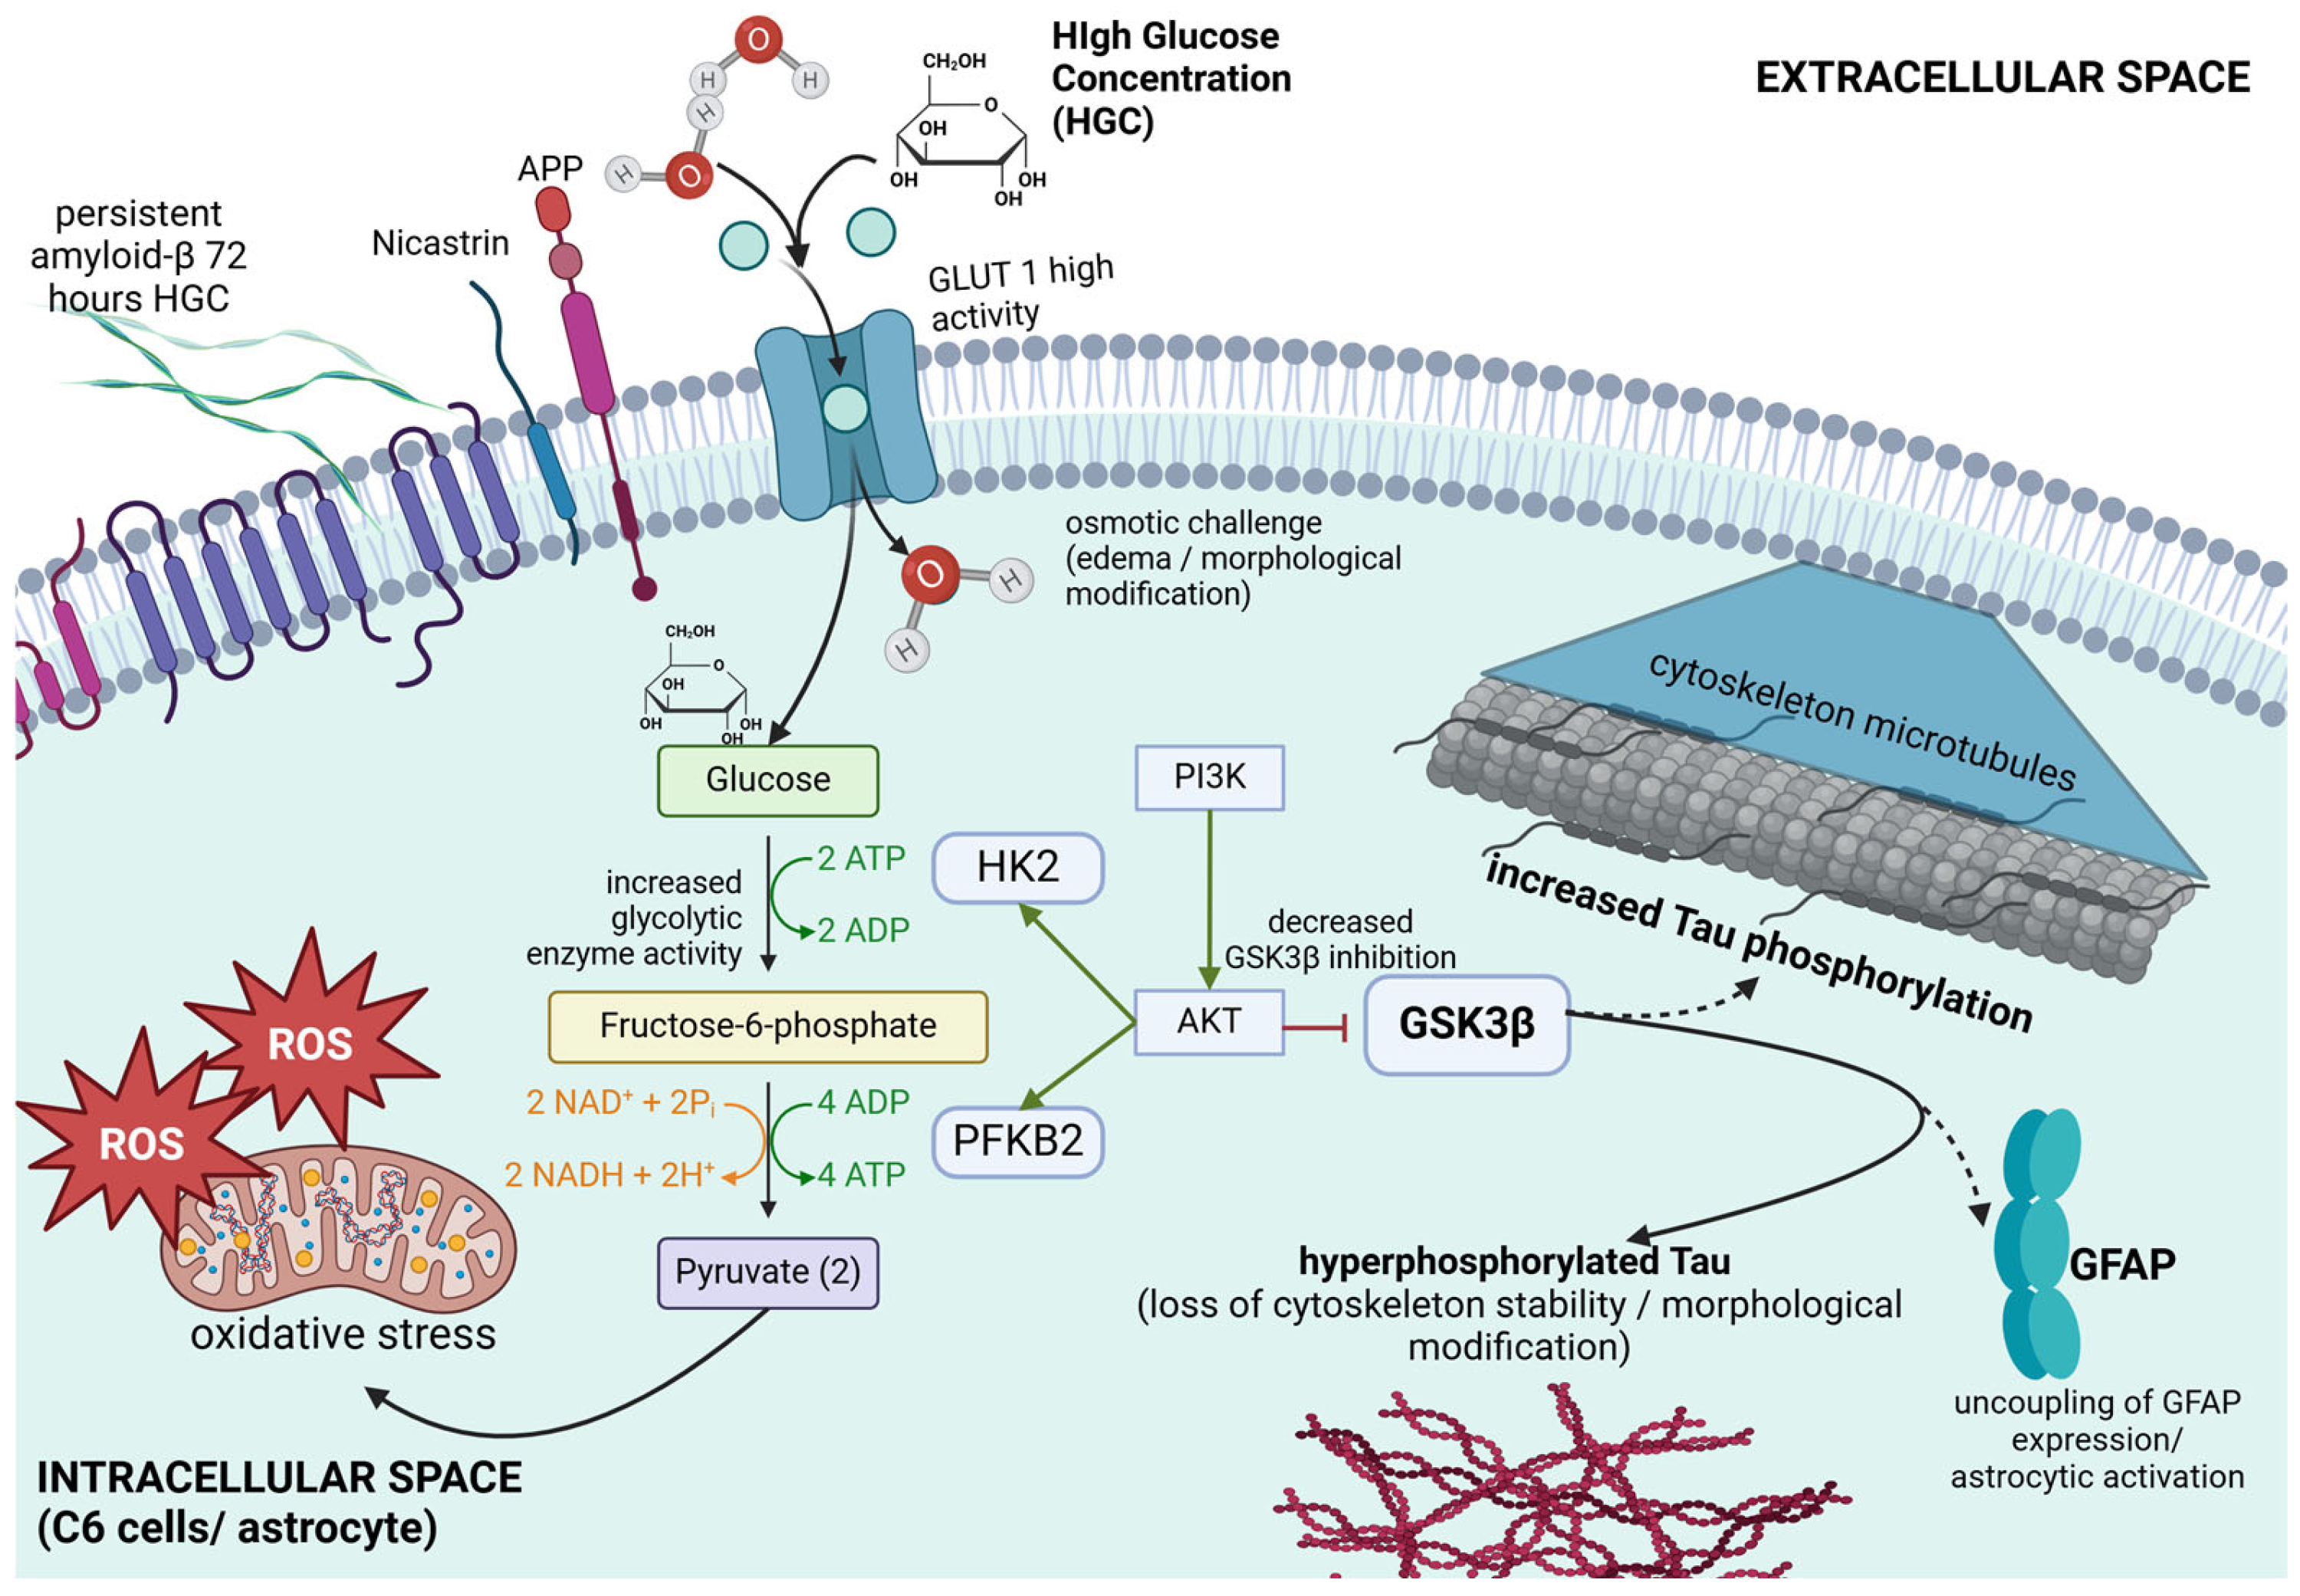
In our model (Figure 10), we observed that a 72 h exposure of astrocyte-like cells resulted in the increased production of pTau without a corresponding significant increase in Aβ production. It is suggested that pTau aggregates interfere with the displacement of APP transporter endosomes, retaining them and intensifying their cleavage into Aβ, predominantly in late-onset AD [64]. This indicates that the 72 h exposure period may be a critical factor in the temporal relationship between early pTau production and subsequent Aβ production. During this timeframe, Aβ production appears to remain similar to standard conditions.
The mechanism of Aβ clearance, primarily mediated by astrocytic degradation, seems adequate to regulate the availability of Aβ in the extracellular space, particularly in the context of the morphofunctional alterations indicative of astrocytic activation [12,39]. This could imply an increase in Aβ uptake by astrocytes, thereby preventing notable differences in extracellular Aβ bioavailability within the studied timeframe [65,66].
We propose that longer exposures to HGC may lead to dysfunction in astrocytic Aβ uptake mechanisms. Such dysfunction could compromise the ability of astrocytes to clear Aβ, resulting in the peptide’s accumulation in the extracellular milieu, as observed in tissues from animal models [64,67].

Author Contributions

Conceptualization, methodology, investigation, K.A.H.-C.; validation, F.R.-D., M.E.H.-A., D.H.-C., M.G.-V., J.M.-D., C.A.P.-E., F.R.R.-M. and R.T.-C.; investigation, resource, writing—original draft preparation, writing—review and editing, visualization, supervision, G.E.A.-A. All authors have read and agreed to the published version of the manuscript.

Funding

This research was funded by CONAHCYT-México K.A.H.C., grant number “Scholarship 958097”.

Institutional Review Board Statement

Not applicable.

Data Availability Statement

Data are contained within the article.

Acknowledgments

We deeply thank Carolina Barrientos for donating the C6 cells.

Conflicts of Interest

The authors declare no conflicts of interest.

References

  1. Better, M.A. Alzheimer’s Disease Facts and Figures. Alzheimers Dement. 2023, 19, 1598–1695. [Google Scholar] [CrossRef]
  2. Bolós, M.; Perea, J.R.; Avila, J. Alzheimer’s Disease as an Inflammatory Disease. Biomol. Concepts 2017, 8, 37–43. [Google Scholar] [CrossRef] [PubMed]
  3. Guo, T.; Zhang, D.; Zeng, Y.; Huang, T.Y.; Xu, H.; Zhao, Y. Molecular and Cellular Mechanisms Underlying the Pathogenesis of Alzheimer’s Disease. Mol. Neurodegener. 2020, 15, 40. [Google Scholar] [CrossRef] [PubMed]
  4. Vagelatos, N.T.; Eslick, G.D. Type 2 Diabetes as a Risk Factor for Alzheimer’s Disease: The Confounders, Interactions, and Neuropathology Associated with This Relationship. Epidemiol. Rev. 2013, 35, 152–160. [Google Scholar] [CrossRef]
  5. Sun, Y.; Ma, C.; Sun, H.; Wang, H.; Peng, W.; Zhou, Z.; Wang, H.; Pi, C.; Shi, Y.; He, X. Metabolism: A Novel Shared Link between Diabetes Mellitus and Alzheimer’s Disease. J. Diabetes Res. 2020, 2020, 4981814. [Google Scholar] [CrossRef]
  6. Khan, R.M.M.; Chua, Z.J.Y.; Tan, J.C.; Yang, Y.; Liao, Z.; Zhao, Y. From Pre-Diabetes to Diabetes: Diagnosis, Treatments and Translational Research. Medicina 2019, 55, 546. [Google Scholar] [CrossRef]
  7. Mechanick, J.I. Global Dimensions of Diabetes: Information and Synthesis. Ann. Glob. Health 2015, 81, 733–734. [Google Scholar] [CrossRef]
  8. Lin, X.; Xu, Y.; Pan, X.; Xu, J.; Ding, Y.; Sun, X.; Song, X.; Ren, Y.; Shan, P.F. Global, Regional, and National Burden and Trend of Diabetes in 195 Countries and Territories: An Analysis from 1990 to 2025. Sci. Rep. 2020, 10, 14790. [Google Scholar] [CrossRef]
  9. Steen, E.; Terry, B.M.; Rivera, E.J.; Cannon, J.L.; Neely, T.R.; Tavares, R.; Xu, X.J.; Wands, J.R.; de la Monte, S.M. Impaired Insulin and Insulin-like Growth Factor Expression and Signaling Mechanisms in Alzheimer’s Disease--Is This Type 3 Diabetes. J. Alzheimers Dis. 2005, 7, 63–80. [Google Scholar] [CrossRef]
  10. Simpson, I.A.; Dwyer, D.; Malide, D.; Moley, K.H.; Travis, A.; Vannucci, S.J. The Facilitative Glucose Transporter GLUT3: 20 Years of Distinction. Am. J. Physiol. Endocrinol. Metab. 2008, 295, E242–E253. [Google Scholar] [CrossRef]
  11. Chen, Z.; Yuan, Z.; Yang, S.; Zhu, Y.; Xue, M.; Zhang, J.; Leng, L. Brain Energy Metabolism: Astrocytes in Neurodegenerative Diseases. CNS Neurosci. Ther. 2023, 29, 24–36. [Google Scholar] [CrossRef] [PubMed]
  12. Quincozes-Santos, A.; Bobermin, L.D.; de Assis, A.M.; Gonçalves, C.A.; Souza, D.O. Fluctuations in Glucose Levels Induce Glial Toxicity with Glutamatergic, Oxidative and Inflammatory Implications. Biochim. Biophys. Acta Mol. Basis Dis. 2017, 1863, 1–14. [Google Scholar] [CrossRef] [PubMed]
  13. Staricha, K.; Meyers, N.; Garvin, J.; Liu, Q.; Rarick, K.; Harder, D.; Cohen, S. Effect of High Glucose Condition on Glucose Metabolism in Primary Astrocytes. Brain Res. 2020, 1732, 146702. [Google Scholar] [CrossRef] [PubMed]
  14. Fontana, I.C.; Scarpa, M.; Malarte, M.L.; Rocha, F.M.; Ausellé-Bosch, S.; Bluma, M.; Bucci, M.; Chiotis, K.; Kumar, A.; Nordberg, A. Astrocyte Signature in Alzheimer’s Disease Continuum through a Multi-PET Tracer Imaging Perspective. Cells 2023, 12, 1469. [Google Scholar] [CrossRef]
  15. Saroja, S.R.; Gorbachev, K.; Julia, T.; Goate, A.M.; Pereira, A.C. Astrocyte-Secreted Glypican-4 Drives APOE4-Dependent Tau Hyperphosphorylation. Proc. Natl. Acad. Sci. USA 2022, 119, e2108870119. [Google Scholar] [CrossRef]
  16. Zheng, Y.; Deng, Y.; Gao, J.M.; Lv, C.; Lang, L.H.; Shi, J.S.; Yu, C.Y.; Gong, Q.H. Icariside II Inhibits Lipopolysaccharide-Induced Inflammation and Amyloid Production in Rat Astrocytes by Regulating IKK/IκB/NF-ΚB/BACE1 Signaling Pathway. Acta Pharmacol. Sin. 2020, 41, 154–162. [Google Scholar] [CrossRef]
  17. Swerdlow, R.H. The Mitochondrial Hypothesis: Dysfunction, Bioenergetic Defects, and the Metabolic Link to Alzheimer’s Disease. Int. Rev. Neurobiol. 2020, 154, 207–233. [Google Scholar] [CrossRef]
  18. Martínez-Díaz, J.A.; Hernández-Aguilar, M.E.; Rojas-Durán, F.; Herrera-Covarrubias, D.; García-Hernández, L.I.; Mestizo-Gutiérrez, S.L.; Aranda-Abreu, G.E. Expression of Proteins Linked to Alzheimer’s Disease in C6 Rat Glioma Cells under the Action of Lipopolysaccharide (LPS), Nimesulide, Resveratrol and Citalopram. Turk. J. Biochem. 2020, 45, 793–801. [Google Scholar] [CrossRef]
  19. Barth, R.F.; Kaur, B. Rat Brain Tumor Models in Experimental Neuro-Oncology: The C6, 9L, T9, RG2, F98, BT4C, RT-2 and CNS-1 Gliomas. J. Neurooncol. 2009, 94, 299–312. [Google Scholar] [CrossRef]
  20. Lenting, K.; Verhaak, R.; Ter Laan, M.; Wesseling, P.; Leenders, W. Glioma: Experimental Models and Reality. Acta Neuropathol. 2017, 133, 263–282. [Google Scholar] [CrossRef]
  21. Devan, S.; Janardhanam, V.A. Effect of Naringenin on Metabolic Markers, Lipid Profile and Expression of GFAP in C6 Glioma Cells Implanted Rat’s Brain. Ann. Neurosci. 2011, 18, 151–155. [Google Scholar] [CrossRef] [PubMed]
  22. Loureiro, S.O.; Heimfarth, L.; Reis, K.; Wild, L.; Andrade, C.; Guma, F.T.; Gonçalves, C.A.; Pessoa-Pureur, R. Acute Ethanol Exposure Disrupts Actin Cytoskeleton and Generates Reactive Oxygen Species in C6 Cells. Toxicol. In Vitro 2011, 25, 28–36. [Google Scholar] [CrossRef] [PubMed]
  23. Al-Atrache, Z.; Lopez, D.B.; Hingley, S.T.; Appelt, D.M. Astrocytes Infected with Chlamydia Pneumoniae Demonstrate Altered Expression and Activity of Secretases Involved in the Generation of β-Amyloid Found in Alzheimer Disease. BMC Neurosci. 2019, 20, 6. [Google Scholar] [CrossRef]
  24. Wong, D.P.; Chu, J.M.; Hung, V.K.; Lee, D.K.; Cheng, C.H.; Yung, K.K.; Yue, K.K. Modulation of Endoplasmic Reticulum Chaperone GRP78 by High Glucose in Hippocampus of Streptozotocin-Induced Diabetic Mice and C6 Astrocytic Cells. Neurochem. Int. 2013, 63, 551–560. [Google Scholar] [CrossRef]
  25. Morato, E.; Mayor, F. Production of the Alzheimer’s Beta-Amyloid Peptide by C6 Glioma Cells. FEBS Lett. 1993, 336, 275–278. [Google Scholar] [CrossRef]
  26. Tramontina, A.C.; Nardin, P.; Quincozes-Santos, A.; Tortorelli, L.; Wartchow, K.M.; Andreazza, A.C.; Braganhol, E.; de Souza, D.O.; Gonçalves, C.A. High-Glucose and S100B Stimulate Glutamate Uptake in C6 Glioma Cells. Neurochem. Res. 2012, 37, 1399–1408. [Google Scholar] [CrossRef]
  27. Wang, J.; Li, G.; Wang, Z.; Zhang, X.; Yao, L.; Wang, F.; Liu, S.; Yin, J.; Ling, E.A.; Wang, L.; et al. High Glucose-Induced Expression of Inflammatory Cytokines and Reactive Oxygen Species in Cultured Astrocytes. Neuroscience 2012, 202, 58–68. [Google Scholar] [CrossRef]
  28. Ott, A.; Stolk, R.P.; van Harskamp, F.; Pols, H.A.; Hofman, A.; Breteler, M.M. Diabetes Mellitus and the Risk of Dementia: The Rotterdam Study. Neurology 1999, 53, 1937–1942. [Google Scholar] [CrossRef]
  29. ElSayed, N.A.; Aleppo, G.; Aroda, V.R.; Bannuru, R.R.; Brown, F.M.; Bruemmer, D.; Collins, B.S.; Gibbons, C.H.; Giurini, J.M.; Hilliard, M.E.; et al. 12. Retinopathy, Neuropathy, and Foot Care: Standards of Care in Diabetes-2023. Diabetes Care 2023, 46, S203–S215. [Google Scholar] [CrossRef]
  30. Li, Z.G.; Zhang, W.; Sima, A.A. Alzheimer-like Changes in Rat Models of Spontaneous Diabetes. Diabetes 2007, 56, 1817–1824. [Google Scholar] [CrossRef]
  31. Mestizo-Gutiérrez, S.L.; Hernández-Aguilar, M.E.; Rojas-Durán, F.; Manzo-Denes, J.; Aranda-Abreu, G.E. La Enfermedad de Alzheimer y La Diabetes Mellitus. ENeurobiología 2014, 5, 070914. [Google Scholar]
  32. Baglietto-Vargas, D.; Shi, J.; Yaeger, D.M.; Ager, R.; LaFerla, F.M. Diabetes and Alzheimer’s Disease Crosstalk. Neurosci. Biobehav. Rev. 2016, 64, 272–287. [Google Scholar] [CrossRef] [PubMed]
  33. Pellerin, L.; Bouzier-Sore, A.K.; Aubert, A.; Serres, S.; Merle, M.; Costalat, R.; Magistretti, P.J. Activity-Dependent Regulation of Energy Metabolism by Astrocytes: An Update. Glia 2007, 55, 1251–1262. [Google Scholar] [CrossRef]
  34. Tönnies, E.; Trushina, E. Oxidative Stress, Synaptic Dysfunction, and Alzheimer’s Disease. J. Alzheimers Dis. 2017, 57, 1105–1121. [Google Scholar] [CrossRef]
  35. Mosconi, L. Glucose Metabolism in Normal Aging and Alzheimer’s Disease: Methodological and Physiological Considerations for PET Studies. Clin. Transl. Imaging 2013, 1, 217–233. [Google Scholar] [CrossRef]
  36. Simpson, J.E.; Ince, P.G.; Lace, G.; Forster, G.; Shaw, P.J.; Matthews, F.; Savva, G.; Brayne, C.; Wharton, S.B.; MRC, C.F. and A.N.S.G. Astrocyte Phenotype in Relation to Alzheimer-Type Pathology in the Ageing Brain. Neurobiol. Aging 2010, 31, 578–590. [Google Scholar] [CrossRef]
  37. Li, W.; Roy Choudhury, G.; Winters, A.; Prah, J.; Lin, W.; Liu, R.; Yang, S.H. Hyperglycemia Alters Astrocyte Metabolism and Inhibits Astrocyte Proliferation. Aging Dis. 2018, 9, 674–684. [Google Scholar] [CrossRef]
  38. Zhou, B.; Zuo, Y.X.; Jiang, R.T. Astrocyte Morphology: Diversity, Plasticity, and Role in Neurological Diseases. CNS Neurosci. Ther. 2019, 25, 665–673. [Google Scholar] [CrossRef]
  39. Nardin, P.; Tramontina, F.; Leite, M.C.; Tramontina, A.C.; Quincozes-Santos, A.; de Almeida, L.M.; Battastini, A.M.; Gottfried, C.; Gonçalves, C.A. S100B Content and Secretion Decrease in Astrocytes Cultured in High-Glucose Medium. Neurochem. Int. 2007, 50, 774–782. [Google Scholar] [CrossRef]
  40. Salvadó, G.; Milà-Alomà, M.; Shekari, M.; Ashton, N.J.; Operto, G.; Falcon, C.; Cacciaglia, R.; Minguillon, C.; Fauria, K.; Niñerola-Baizán, A.; et al. Reactive Astrogliosis Is Associated with Higher Cerebral Glucose Consumption in the Early Alzheimer’s Continuum. Eur. J. Nucl. Med. Mol. Imaging 2022, 49, 4567–4579. [Google Scholar] [CrossRef]
  41. Landau, S.M.; Harvey, D.; Madison, C.M.; Koeppe, R.A.; Reiman, E.M.; Foster, N.L.; Weiner, M.W.; Jagust, W.J.; Alzheimer’s, D.N.I. Associations between Cognitive, Functional, and FDG-PET Measures of Decline in AD and MCI. Neurobiol. Aging 2011, 32, 1207–1218. [Google Scholar] [CrossRef] [PubMed]
  42. Carter, S.F.; Chiotis, K.; Nordberg, A.; Rodriguez-Vieitez, E. Longitudinal Association between Astrocyte Function and Glucose Metabolism in Autosomal Dominant Alzheimer’s Disease. Eur. J. Nucl. Med. Mol. Imaging 2019, 46, 348–356. [Google Scholar] [CrossRef] [PubMed]
  43. Kuete, V.; Karaosmanoğlu, O.; Sivas, H. Anticancer Activities of African Medicinal Spices and Vegetables. In Medicinal Spices and Vegetables from Africa; Elsevier: Amsterdam, The Netherlands, 2017; pp. 271–297. [Google Scholar]
  44. Dienel, G.A. Brain Glucose Metabolism: Integration of Energetics with Function. Physiol. Rev. 2019, 99, 949–1045. [Google Scholar] [CrossRef]
  45. Raha, S.; Robinson, B.H. Mitochondria, Oxygen Free Radicals, and Apoptosis. Am. J. Med. Genet. 2001, 106, 62–70. [Google Scholar] [CrossRef]
  46. Zorov, D.B.; Juhaszova, M.; Sollott, S.J. Mitochondrial Reactive Oxygen Species (ROS) and ROS-Induced ROS Release. Physiol. Rev. 2014, 94, 909–950. [Google Scholar] [CrossRef]
  47. Grimm, S. Respiratory Chain Complex II as General Sensor for Apoptosis. Biochim. Biophys. Acta 2013, 1827, 565–572. [Google Scholar] [CrossRef]
  48. Ciccarelli, R.; Sureda, F.X.; Casabona, G.; Di Iorio, P.; Caruso, A.; Spinella, F.; Condorelli, D.F.; Nicoletti, F.; Caciagli, F. Opposite Influence of the Metabotropic Glutamate Receptor Subtypes MGlu3 and -5 on Astrocyte Proliferation in Culture. Glia 1997, 21, 390–398. [Google Scholar] [CrossRef]
  49. Korenić, A.; Boltze, J.; Deten, A.; Peters, M.; Andjus, P.; Radenović, L. Astrocytic Mitochondrial Membrane Hyperpolarization Following Extended Oxygen and Glucose Deprivation. PLoS ONE 2014, 9, e90697. [Google Scholar] [CrossRef]
  50. Fan, Y.; Yang, Q.; Yang, Y.; Gao, Z.; Ma, Y.; Zhang, L.; Liang, W.; Ding, G. Sirt6 Suppresses High Glucose-Induced Mitochondrial Dysfunction and Apoptosis in Podocytes through AMPK Activation. Int. J. Biol. Sci. 2019, 15, 701–713. [Google Scholar] [CrossRef]
  51. Chabot, C.; Massicotte, G.; Milot, M.; Trudeau, F.; Gagné, J. Impaired Modulation of AMPA Receptors by Calcium-Dependent Processes in Streptozotocin-Induced Diabetic Rats. Brain Res. 1997, 768, 249–256. [Google Scholar] [CrossRef]
  52. Delyfer, M.N.; Forster, V.; Neveux, N.; Picaud, S.; Léveillard, T.; Sahel, J.A. Evidence for Glutamate-Mediated Excitotoxic Mechanisms during Photoreceptor Degeneration in the Rd1 Mouse Retina. Mol. Vis. 2005, 11, 688–696. [Google Scholar] [PubMed]
  53. Jayanarayanan, S.; Smijin, S.; Peeyush, K.T.; Anju, T.R.; Paulose, C.S. NMDA and AMPA Receptor Mediated Excitotoxicity in Cerebral Cortex of Streptozotocin Induced Diabetic Rat: Ameliorating Effects of Curcumin. Chem. Biol. Interact. 2013, 201, 39–48. [Google Scholar] [CrossRef] [PubMed]
  54. Borst, P. The Malate-Aspartate Shuttle (Borst Cycle): How It Started and Developed into a Major Metabolic Pathway. IUBMB Life 2020, 72, 2241–2259. [Google Scholar] [CrossRef] [PubMed]
  55. Ahmad, W.; Ijaz, B.; Shabbiri, K.; Ahmed, F.; Rehman, S. Oxidative Toxicity in Diabetes and Alzheimer’s Disease: Mechanisms behind ROS/ RNS Generation. J. Biomed. Sci. 2017, 24, 76. [Google Scholar] [CrossRef]
  56. Islam, M.T. Oxidative Stress and Mitochondrial Dysfunction-Linked Neurodegenerative Disorders. Neurol. Res. 2017, 39, 73–82. [Google Scholar] [CrossRef]
  57. Bouchez, C.; Devin, A. Mitochondrial Biogenesis and Mitochondrial Reactive Oxygen Species (ROS): A Complex Relationship Regulated by the CAMP/PKA Signaling Pathway. Cells 2019, 8, 287. [Google Scholar] [CrossRef]
  58. Liu, Z.; Li, T.; Li, P.; Wei, N.; Zhao, Z.; Liang, H.; Ji, X.; Chen, W.; Xue, M.; Wei, J. The Ambiguous Relationship of Oxidative Stress, Tau Hyperphosphorylation, and Autophagy Dysfunction in Alzheimer’s Disease. Oxid. Med. Cell. Longev. 2015, 2015, 352723. [Google Scholar] [CrossRef]
  59. Arnsten, A.F.T.; Datta, D.; Del Tredici, K.; Braak, H. Hypothesis: Tau Pathology Is an Initiating Factor in Sporadic Alzheimer’s Disease. Alzheimers Dement. 2021, 17, 115–124. [Google Scholar] [CrossRef]
  60. Schaffer, B.A.; Bertram, L.; Miller, B.L.; Mullin, K.; Weintraub, S.; Johnson, N.; Bigio, E.H.; Mesulam, M.; Wiedau-Pazos, M.; Jackson, G.R.; et al. Association of GSK3B with Alzheimer Disease and Frontotemporal Dementia. Arch. Neurol. 2008, 65, 1368–1374. [Google Scholar] [CrossRef]
  61. Hooper, C.; Killick, R.; Lovestone, S. The GSK3 Hypothesis of Alzheimer’s Disease. J. Neurochem. 2008, 104, 1433–1439. [Google Scholar] [CrossRef]
  62. Saleh, R.A.; Eissa, T.F.; Abdallah, D.M.; Saad, M.A.; El-Abhar, H.S. Peganum Harmala Enhanced GLP-1 and Restored Insulin Signaling to Alleviate AlCl3-Induced Alzheimer-like Pathology Model. Sci. Rep. 2021, 11, 12040. [Google Scholar] [CrossRef] [PubMed]
  63. Fang, J.; Zhang, P.; Wang, Q.; Chiang, C.W.; Zhou, Y.; Hou, Y.; Xu, J.; Chen, R.; Zhang, B.; Lewis, S.J.; et al. Artificial Intelligence Framework Identifies Candidate Targets for Drug Repurposing in Alzheimer’s Disease. Alzheimers Res. Ther. 2022, 14, 7. [Google Scholar] [CrossRef] [PubMed]
  64. Paspalas, C.D.; Carlyle, B.C.; Leslie, S.; Preuss, T.M.; Crimins, J.L.; Huttner, A.J.; van Dyck, C.H.; Rosene, D.L.; Nairn, A.C.; Arnsten, A.F.T. The Aged Rhesus Macaque Manifests Braak Stage III/IV Alzheimer’s-like Pathology. Alzheimers Dement. 2018, 14, 680–691. [Google Scholar] [CrossRef] [PubMed]
  65. Luo, R.; Su, L.Y.; Li, G.; Yang, J.; Liu, Q.; Yang, L.X.; Zhang, D.F.; Zhou, H.; Xu, M.; Fan, Y.; et al. Activation of PPARA-Mediated Autophagy Reduces Alzheimer Disease-like Pathology and Cognitive Decline in a Murine Model. Autophagy 2020, 16, 52–69. [Google Scholar] [CrossRef]
  66. Smit, T.; Deshayes, N.A.C.; Borchelt, D.R.; Kamphuis, W.; Middeldorp, J.; Hol, E.M. Reactive Astrocytes as Treatment Targets in Alzheimer’s Disease-Systematic Review of Studies Using the APPswePS1dE9 Mouse Model. Glia 2021, 69, 1852–1881. [Google Scholar] [CrossRef]
  67. Sadleir, K.R.; Kandalepas, P.C.; Buggia-Prévot, V.; Nicholson, D.A.; Thinakaran, G.; Vassar, R. Presynaptic Dystrophic Neurites Surrounding Amyloid Plaques Are Sites of Microtubule Disruption, BACE1 Elevation, and Increased Aβ Generation in Alzheimer’s Disease. Acta Neuropathol. 2016, 132, 235–256. [Google Scholar] [CrossRef]
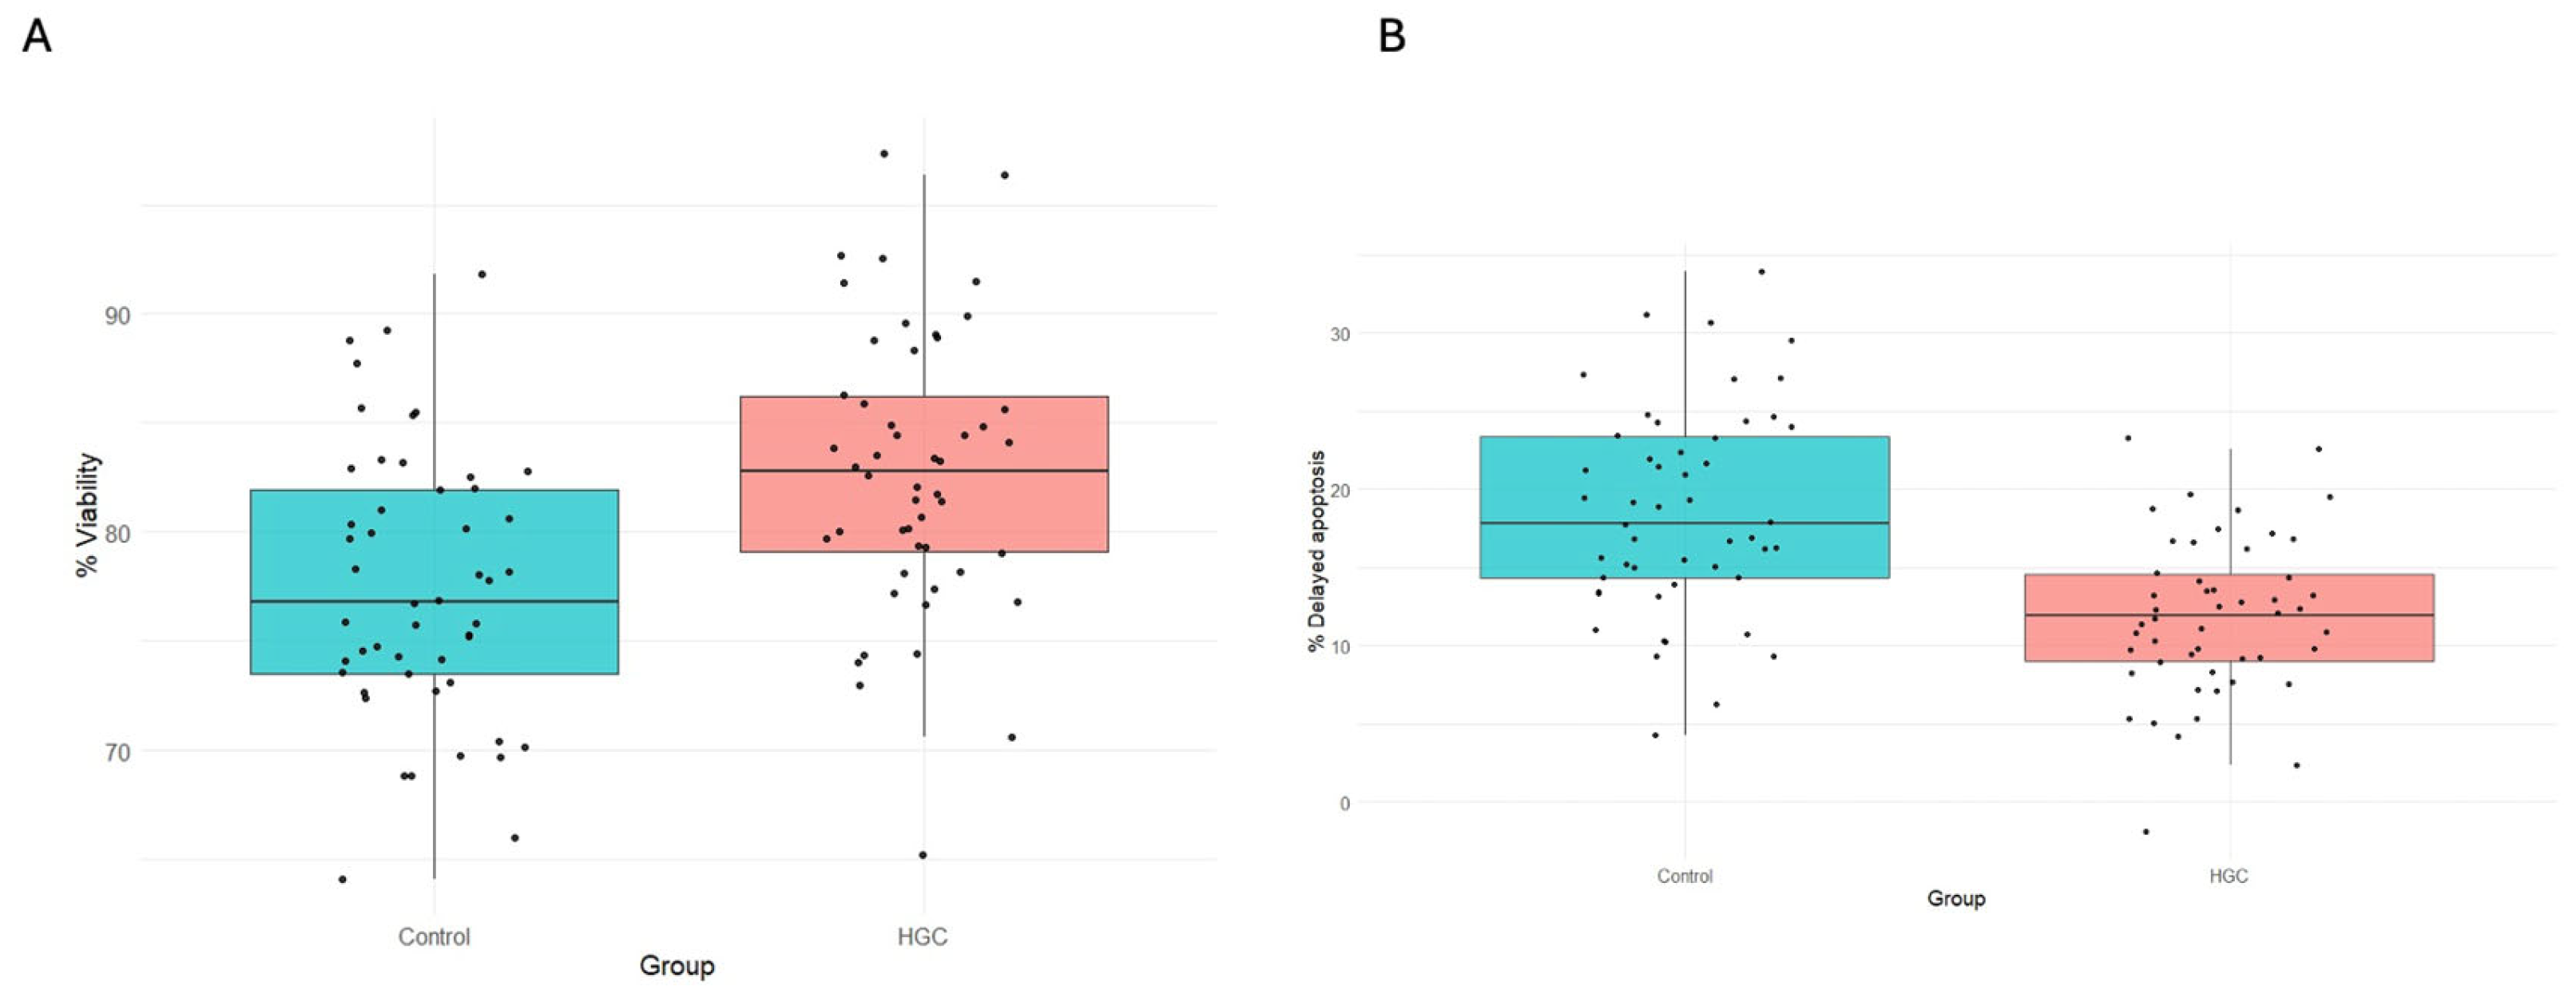
Figure 1. Determination of cell viability by flow cytometry fluorolabeling with propidium iodide and annexin. (A) No statistically significant differences were observed in the percentage of viable cells between the control and HGC groups. (B) A statistically significant trend toward a higher percentage of cells undergoing late necrosis was observed in the cells of the control group with respect to those of the HGC group.
Biomed 05 00003 g001
Figure 2. 35 mM glucose concentration for 24 h. A statistically significant difference is observed between the control group and HGC, the latter being the one that presumably presents a greater internalization of glucose as it presents a lower amount of glucose in the medium. Value of p = 0.0240.
Biomed 05 00003 g002
Figure 3. Mitochondrial activity. Absorbance is an indicator of mitochondrial activity in this MTT assay, with increased mitochondrial activity being observed in the HGC group, this difference being statistically significant. Value of p < 0.001.
Biomed 05 00003 g003
Figure 4. Mitochondrial membrane potential (ΔΨm). (A) Selection of cells according to weight (FSCH) and size (FSC A) distribution is shown; (B) selection of viable cells according to granurality (SSC A) and size (FSC A) distribution is shown; (C) ΔΨm in control group cells; (D) ΔΨm in HGC group cells; (E) corrected total fluorescence (CTCF) indicates the cellular concentration of rhodamine associated with ΔΨm, and this is observed increased in the HGC cell group with a value of p = 0.050.
Biomed 05 00003 g004
Figure 5. Intracellular ROS. (A) Photomicrographs of the fluorescence reaction by the 2′-7′-dichlorofluorescein diacetate method; (B) graph of the CTCF as an indicator of the concentration of intracellular ROS, showing an increase in the HGC group, this difference being statistically significant. Value of p = 0.0289. Scale bar = 10 μm.
Biomed 05 00003 g005
Figure 6. GFAP expression. (A) GFAP and GAPDH control obtained by the Western blot method; (B) Graph of GFAP expression. The relative intensity of the bands analyzed allows us to estimate that there is no statistically significant difference between the control and HGC group. Value of p = 0.287.
Biomed 05 00003 g006
Figure 7. Nicastrin expression. (A) Nicastrin and GAPDH control obtained by Western blotting; (B) graph of Nicastrin expression. The relative intensity of the bands analyzed allows us to estimate that there is no statistically significant difference between the control and HGC group. Value of p = 0.322.
Biomed 05 00003 g007
Figure 8. Tau expression. (A) Tau and GADPH control obtained by WB. (B) pTau expression. The relative intensity of the bands analyzed allows us to estimate that there are no statistically significant differences between the control and HGC group. Value of p = 0.025.
Biomed 05 00003 g008
Figure 9. β-amyloid expression. The measured absorbance suggests that there are no statistically significant differences in the expression of β-amyloid between the control group and HGC. Value of p = 0.088.
Biomed 05 00003 g009
Figure 10. High glucose concentration increases the activity of glucotransporters type 1 (GLUT1) that allows increased uptake of the metabolite favored by the concentration gradient. Together with the glucose molecules, the internalization of water increases due to the osmotic pressure of the molecule, leading to an “osmotic challenge” that favors edema and morphological modifications in the form (uncharacteristic shape) and increased size (hypertrophy). Increased glucose uptake leads to increased glycolytic enzymatic activity that demands increased interaction of Akt with the enzymes hexokinase 2 (HK2) and Phosphofructokinase-2 (PFK2), which could decrease the bioavailability of Akt to phosphorylate and inhibit GSK3β, This allows this kinase to increase its interaction with the Tau protein, increasing its phosphorylation state either in its phosphorylated or hyperphosphorylated form, which is associated with the loss of cytoskeleton stability and the consequent decrease in the characteristic shape of the cells; The increased production of Tau in its hyperphosphorylated form leads to uncoupling between GFAP expression and astrocytic activation. In parallel, the increase in glycolytic activity leads to an increase in pyruvate generation which increases mitochondrial activity, particularly at the level of the electron transport chain and the Krebs cycle, resulting in an increased production of reactive oxygen species (ROS) promoting an oxidative stress microenvironment. Regarding the production of Aβ, it is considered that the persistent regulated production of the peptide is due to the relatively short exposure time corresponding to 72 which allows us to observe the temporal relationship between the production of pTau and Aβ under HGC conditions.
Biomed 05 00003 g010
Disclaimer/Publisher’s Note: The statements, opinions and data contained in all publications are solely those of the individual author(s) and contributor(s) and not of MDPI and/or the editor(s). MDPI and/or the editor(s) disclaim responsibility for any injury to people or property resulting from any ideas, methods, instructions or products referred to in the content.