Abstract
The exponential growth in the number of devices connected via the internet has led to the need to achieve granular programmability for increased performance, resilience, reduced latency, and jitter. Software Defined Networking (SDN) and Programming Protocol independent Packet Processing (P4) are designed to introduce programmability into the control and data plane of networks, respectively. Despite their individual potential and capabilities, the performance of combining SDN and P4 remains underexplored. This study presents a comprehensive evaluation of SDN with data plane programmability using P4 (SDN+P4) against traditional SDN with Open vSwitch (SDN+OvS), aimed at answering the hypothesis that combining SDN and P4 strengthens the control and data plane programmability and offers improved management and adaptability, which would provide a platform with faster packet processing with reduced jitter, loss, and processing overhead. Mininet was employed to emulate three distinct topologies: multi-path, grid, and transit-stub. Various traffic types were transmitted to assess performance metrics across the three topologies. Our results demonstrate that SDN+P4 outperform SDN+OvS significantly due to parallel processing, flexible parsing, and reduced overhead. The evaluation demonstrates the potential of SDN+P4 to provide a more resilient and stringent service with improved network performance for the future internet and its heterogeneity of applications.
1. Introduction
Software Defined Networking (SDN) [1,2] allows for the decoupling of the control plane from the data forwarding plane facilitating an improved performance via programmable network management. The flexibility obtained enables virtualisation, and centralised control for the network, with routing tables being generated and updated centrally by an OpenFlow controller. The separation of the control plane and data plane is made possible through a clearly defined interface which connects the switches to the network controller. This interface employs an Application Programming Interface (API), which allows the controller to exert direct control over the data plane elements (networked devices). The protocol OpenFlow [3,4], is a notable example of such an API.
An OpenFlow forwarding rule consists of a ‘match’ and ‘action’. The ‘match’ involves the matching of packet header fields such as source and destination fields and an ‘action’ to be performed such as forward or drop a packet. This function is referred to as ‘match+action’ [5]. The controller installs these flow entries in the Flowtables of the SDN enabled devices. If a matching flow entry is found against a packet in the data flow, then the predefined action (pass, drop) for that entry is performed on the matched packet. If no match is found, the packet is forwarded to the network controller as a Packet-in Message. The controller is responsible for determining how the packet should be handled. This involves returning the specific packet to the switch and stating which port it should be forwarded to (Packet-out message).
OpenFlow was first introduced with 12 ‘match’ header fields [6], which have now been increased to 44 header fields, as described in the OpenFlow specification 1.5.1 [4]. These are anticipated to grow exponentially in the foreseeable future, in response to the evolution and heterogeneity of the internet. This could potentially be a problem as the application of new header field extensions cannot be achieved when using a stringent-fixed parser at run time, whilst the switches are processing packets.
An alternative to extending the OpenFlow specification is to employ a novel parser that can carry out ‘match+action’ in parallel allowing for programmability in the data forwarding plane without having to modify the OpenFlow specification. In our abstract model, switches forward packets via a programmable parser followed by multiple stages of match+action, arranged either in series, parallel or a combination of both. The forwarding model is controlled by two types of operation: Configure and Populate. The Configure operation, which is composed of Parse graph, Control Program, Table configuration, and Action set; program the parser, arrange the order of match+action, and specify the order of fields processed by each stage. The Populate operation, adds and removes entries to and from the match+action tables that were specified during configuration. Such a parser can be updated, extended, and modified without interrupting packet processing and forwarding, thereby enabling the integration of heterogeneous applications. A protocol that can be employed to carry out ‘match+action’ in parallel is P4 the Programming Protocol for Independent Packet Processing [6]. Parallel processing can be achieved in P4 by employing one of the following.
- Multiple Processing Cores: Some network devices have multiple CPU cores or processing units. P4 programs can be designed to distribute packet processing tasks across these cores to achieve parallelism. For example, one core might handle packet parsing, while another core handles packet forwarding.
- Parallel Pipelines: P4 allows the definition of multiple packet processing stages within a pipeline. These stages can be designed to operate in parallel, with each stage processing packets independently. For instance, one stage might perform access control checks while another stage performs packet routing.
- Hardware Offload: In some cases, P4 programs can be used to offload certain packet processing tasks to specialized hardware accelerators or programmable ASICs. These hardware components can operate in parallel with the CPU, further increasing packet processing efficiency.
- Load Balancing: P4 can be used to implement load balancing mechanisms, where incoming packets are distributed across multiple processing units or network paths, enabling parallel processing of packets.
P4 has three main properties: re-configurability, protocol independence, and target independence. These allow a network administrator to determine the functions and capabilities of a switch rather than adhering to vendor specification [7]. Utilising a common open interface, the administrator can leverage P4 to program a flexible parser to match new header fields as opposed to working with a fixed parser in OpenFlow which would require a specification update in order to process new header fields.
Extensive research carried out by [8,9] indicates that the majority of future network traffic is expected to be the result of using hand-held smart devices. It is claimed that the increased traffic due to hand-held devices has resulted in approximately 52% of all consumer Internet traffic [9]. A study conducted by Ericsson [10] reports that mobile traffic for 2024 reached 1.3 zettabytes, supporting conjectures from earlier studies. The increase in end-user IP traffic threatens to lead to network congestion, resulting in a reduced Quality of Service (QoS) in terms of, for example, jitter, packet loss, and throughput [11] with service providers trying to maintain an acceptable level of service. In thus context we note, the research by Monserrat et al. [12], in which they suggest that the majority of the delay in data communication occurs at the core of the network due to an exponential growth in periodic updates used to maintain the network state, [13,14].
1.1. Motivations
Control and data plane programmable functions motivate us to investigate how this emerging approach can improve the performance of a network by processing packets faster. It is, we feel, crucial to investigate the extent to which a solution with programmability in both the control plane and forwarding plane will provide an improved core network that can accommodate both stringent performance and flexibility as the amount of network traffic continues to increase.
After reviewing related work (see Section 2), this study is motivated to addressing the research gaps that while there are performance bottlenecks in SDN+Open vSwitch, the performance evaluation of combining SDN+P4 is underexplored, especially across different topologies representing the Internet at different scales, and with a varied traffic types, combinations, and protocols. The above issues are important because of the following.
- Programmability at both control plane and data plane provides the potential to meet dynamic and stringent network performance;
- Evaluating data plane and control plane programmability against control plane programmability will help in guiding research to the adaptation of programmable networks;
- Resilience, low processing overhead, and high throughput are crucial for future networks. The potential benefits provided via the programmability at both the control and data plane, can pave the way for increased performance in the core network.
In this paper, we hypothesise that a combination of data plane and control plane programmability (SDN+P4) will elevate the performance of the network, to accommodate stringent performance requirements for future applications in comparison to ‘Open vSwitch (OvS) [15] coupled with control plane programmability’ (SDN+OvS). The performance of SDN+P4 and SDN+OvS will be considered for different topologies, involving a range of different types of traffic.
1.2. Contributions
This paper makes the following contribution to improving network performance by utilising the faster packet processing of P4. In particular, we have:
- Investigated the overhead created due to the slow path utilisation of OvS and the performance variation in comparison to a P4 target switch. With more and more packets requiring processing using a controller, a network model that utilises a slow path approach, such as OvS will potentially lead to an exponential growth in traffic congestion.
- Evaluated the performance of networks when SDN+P4 is employed rather than SDN+OvS. The evolution of 5G and beyond has led to the need to evaluate methods for reducing the delay at the core. Initialising programmability in the network has been shown to increase performance at the core. To the best of our knowledge, current literature does not evaluate the performance of the network when the control plane and data plane programmability (SDN+P4) is employed in comparison to the control plane (SDN+OvS) programmability.
- For a time-sensitive application with minimal latency requirements, reducing the delay at the core can be essential. For example, Vehicle-to-Vehicle (V2V) and Ultra Reliable Low Latency Communication (URLLC) applications. A solution, that processes packets in parallel as opposed to sequential processing in OvS, has been considered in this research and its effect on performance in applications. Our research has established that with the initialisation of SDN+P4 with parallel processing of packets, various applications have better performance in comparison to applications run over SDN+OvS.
- Evaluated the quality of applications and the effect SDN+P4 had on the network traffic of ICMP, TCP, UDP, SIP and CDN in comparison to SDN+OvS. The statistics, such as increased bps and throughput, reduced delay jitter, packet loss, delay, and buffering time, have led to a higher quality of performance at the receiver’s end
1.3. Structure of the Paper
The rest of the paper is organised as follows. Related work are discussed in Section 2. System platforms employed for this research are discussed at Section 3, outlining the platforms and programs used. This is followed by the experimental design in Section 4. Results and analysis for individual applications are presented in Section 5, followed by results for the simultaneous execution of applications in Section 6. The overall results obtained from our research are discussed in Section 7. Concluding observations are presented in Section 8.
2. Related Work
2.1. Applications and Network Performance Enhancements Using P4
Respective research by Cerovic et al. [16] and Hauser et al. [17] have highlighted technological enhancements for networks, such as OpenFlow, P4, the Data Plane Development Kit and Click-based solutions. It has been established that the protocol independent nature of the high-level language P4 [6], together with independence from the underlying hardware and header limitation, benefits the network, increasing performance through the faster processing of packets.
The utilisation of the language P4 has been presented for many applications [7,18,19,20,21,22,23,24,25,26,27,28]. Sivaraman et al. in [7] applied the programmability of P4 to create an application capable of handling data centre traffic. Sharma et al. [18], presented a congestion control mechanism together with P4, and the research by Silva et al. [19] employed mechanisms for packet processing capabilities through P4 utilised with a Robust Header Compression (ROHC) scheme for improving performance. Further examples include a tool for developing and evaluating data plane applications [20], Service Function Chaining on P4 devices in [21], and an extension to the application of Open vSwitch, to act as a hypervisor switch presented by Shahbaz et al. [22]. A recent study by Saqib et al. [24] promoted a classification approach employing data plane programming to improve QoS by embedding Service Level Objectives into packets. Another recent study by Wang et al. [25] presented a design, implementation, and evaluation of a high-performance, high-precision NetFlow/IPFIX flow-monitoring system on a P4 hardware switch. Designed using the same P4 architecture as employed in our research they focused on traffic monitoring, highlighting the broader applicability of P4 in enhancing data-plane operations and high performance. Similar to the work by Wang et al. [25], Hill et al. [26] employed the same P4 architecture to show the flexibility of packet processing, which allows efficient and comprehensive flow tracking to facilitate improved security and performance. Rizzi et al. [27] introduced a load balancer implemented using P4. The study confirmed that the employment of P4 resulted in a higher throughput, reduced latency, and a higher Quality of Service. Ke et al. [28] suggested a hybrid approach of control plane and data plane programmability, which was aimed at enhancing resilience and fault tolerance whilst reducing processing overhead.
2.2. Network Performance in SDN Architectures
Studies conducted by Fares et al. [29], Bagci et al. [30] have employed an identical topology to that initially presented by Calvert et al. [31], which emphasises the validity of their respective initial work. The research presented by Fares et al. [29] employed a Transit Autonomous system setup with dynamic path computation based on real-time network statistics, enabling improved QoS through the use of a centralised controller. A study by Bagci et al. [30] focused on economic factors from a hypothetical migration towards OpenFlow for Network Service Providers (NSP) but did not evaluate network performance. Kotronis et al. [32] and Kotronis et al. [33] have presented a methodology to orchestrate a dynamic end-to-end (E2E) path between transit stub domains with the idea of SDN successfully managing traffic between NSPs. How an SDN controller should be placed between NSPs was discussed by Heller et al. [34], as a means of improving performance. This was achieved through the ‘correct’ and optimal placement of SDN controllers at various topological locations. A similar approach has been employed by Fonseca et al. [35] in which a second controller was employed to mitigate traffic overload in the core network. Hock et al. [36] suggested that in order to achieve better performance, a minimum of 20% of the nodes in the core network should operate as SDN controllers with control plane programmability. Machado et al. [37] and Zhang et al. [38] utilised control plane functions in an SDN controller to improve performance. In addition, Smith et al. [39] have proposed the use of a high-level specification template for management patterns in order to improve performance in SDN networks.
2.3. Research Gaps and Our Work
As discussed in the related work above, various researchers have leveraged P4 and its capabilities to enhance specific aspects of the network [25,26,27,28], however, these studies have only demonstrated the applicability and versatility of P4 for a specific case study or scenario. Similarly, studies presented in [29,30,32,33,34,35,36,37,38,39] investigated various control plane programmability methods in order to improve network performance without integrating a data plane programmability method.
In contrast, our research evaluates the benefits and impact of combining control plane and data plane programmability (SDN+P4) in comparison to control plane programmability (SDN+OvS). This research presents a generalised and scalable architecture capable of addressing the need to provide stringent service to the evolving protocol stacks and diverse traffic demands. It builds upon the foundational concepts introduced in our earlier work [40], where the notion of evaluating SDN through the application of SDN+P4 was initially tested. This allows for comprehensive performance analysis that demonstrates the flexibility and scalability of SDN+P4, beyond the targeted optimisations presented in prior work.
3. System Platforms
To explore the research questions, a network emulation was built on Ubuntu 18.04LTS running on VMWare with a Core i7 CPU with 3.40 GHz together with an Open Networking Operating System (ONOS) [41]. Mininet [42] was utilised to emulate the networks, as shown in Figure 1.
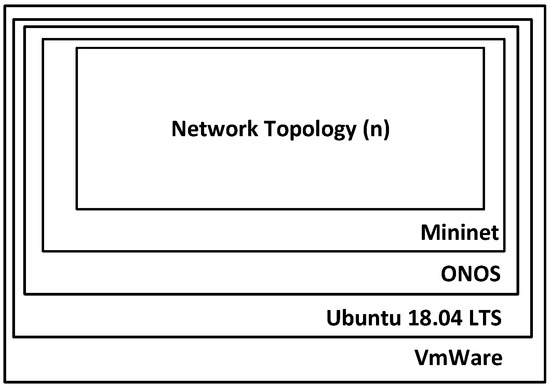
Figure 1.
System Platform.
3.1. SDN Platform
ONOS is an open-source SDN network operating system built to provide a platform for service provider networks [41]. ONOS facilitates the control plane for network components such as switches, links, or software [43]. Being highly reliable, resilient, and scalable makes ONOS, we believe, the best open-source option [44,45] available for building and catering for SDN networks. A real-time GUI provides a global view of the network that aids administrators in monitoring and managing resources. ONOS provides two APIs: the southbound API interacts with devices and the northbound API offers services to applications. The controller inside ONOS can push a switch configuration towards a forwarding device. We chose ONOS as a platform in this research for the above features and its ability to maintain a network’s state without compromising performance.
3.2. Mininet
Mininet [42], developed by Stanford University, is an open-source, lightweight and easy-to-deploy network emulator that provides a programmable interface to launch and initialise networks either in wireless or wired mode. Mininet has the ability to initialise a large network with multiple hosts and switches on a physical host. Mininet supports the emulation of OpenFlow enabled switches such as OvS for this research. OvS coupled with an ONOS controller was used to emulate the SDN+OvS environment for this research.
3.3. P4 Switch
Upon selecting ONOS for the SDN platform, we chose the bmv2 switch [46] as our P4 software switch. A bmv2 switch can configure a custom parser with ingress and egress pipelines working in parallel to perform match+action. The program utilised is independent of the target switch design and can be employed to represent different switch designs should the need arise. The P4 software switch, bmv2 was instantiated without using specific metadata or specific port forwarding to specific traffic, to ensure fairness between the OvS switch and the bmv2 switch. The bmv2 switch coupled with the ONOS controller was employed to emulate the SDN+P4 environment in this research.
SDN+P4 will enable programmability in both the control and data forwarding plane. Unlike the previous instance (SDN+OvS), SDN+P4 has the capability to modify the switch configuration as with a flexible parser, ‘match+action’ which can operate in parallel or series or include metadata and buffer, using a JavaScript Open Notation (JSON) obtained from a P4 program [6]. By utilising a P4 switch, a fixed parser in OvS has been replaced with a flexible parser, which can process packets more efficiently and effectively.
4. Experimental Design
4.1. Network Topologies
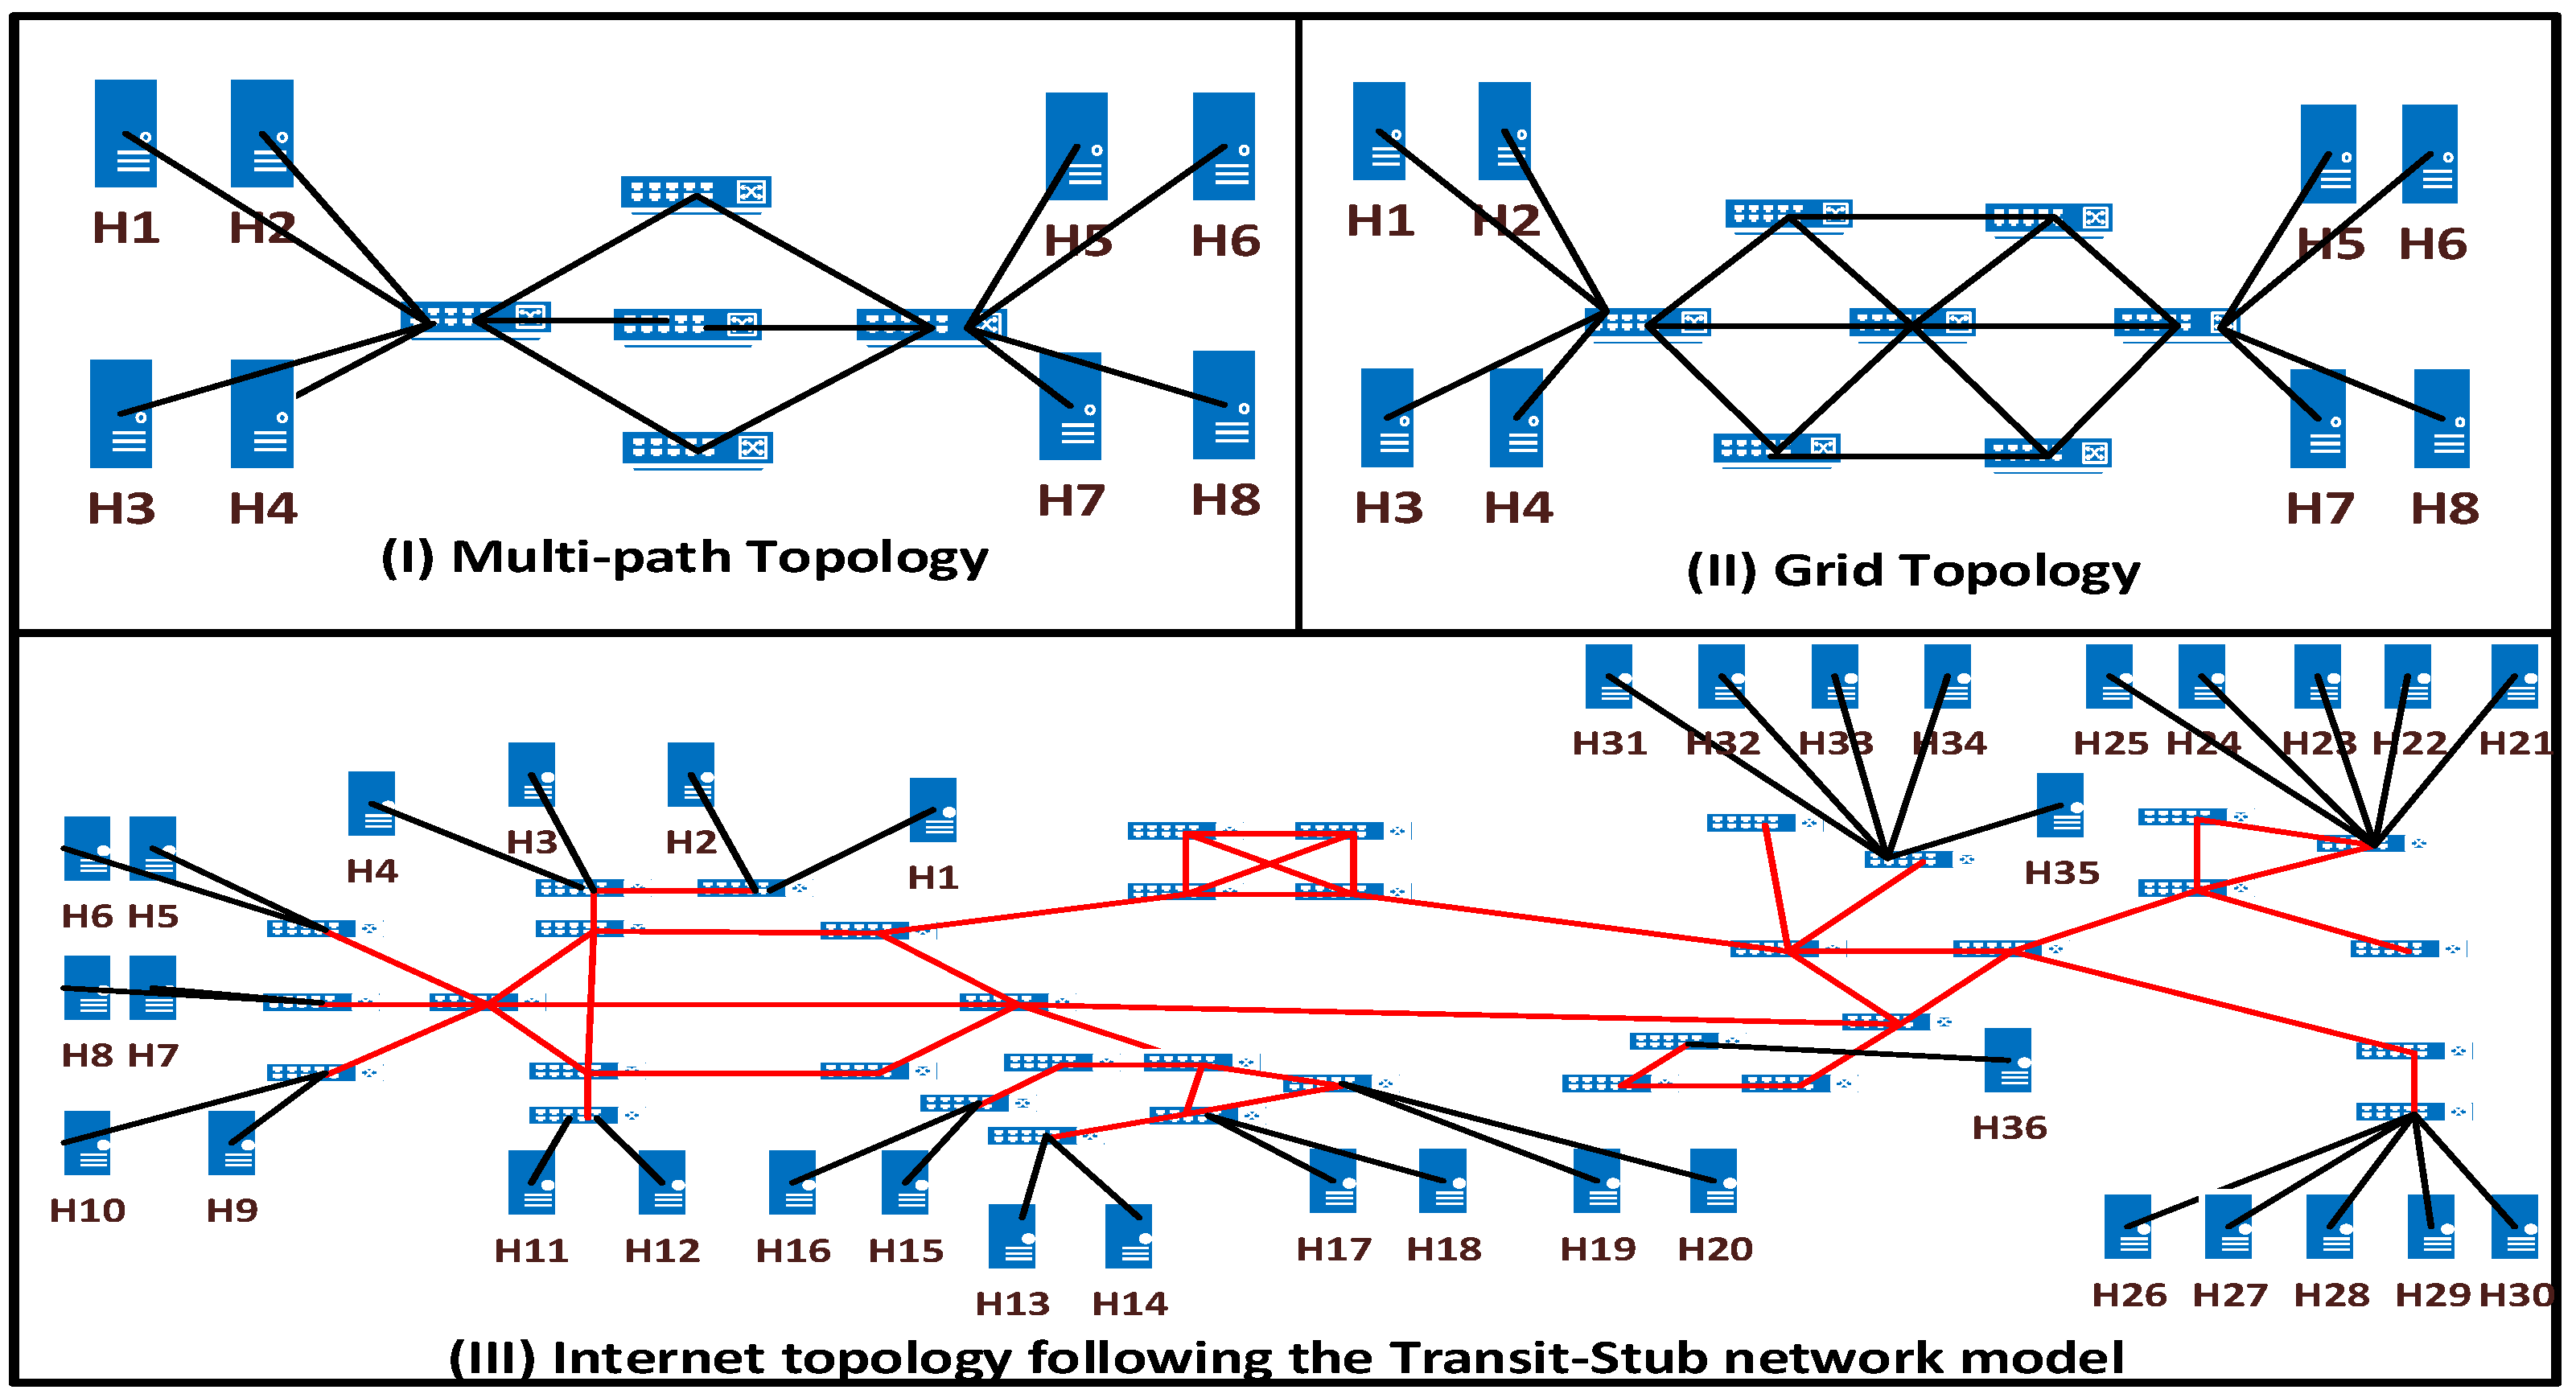
Figure 2 illustrates the three topologies that we employed. Topology I is a multi-path topology that extends the spine-leaf [47] topology used by data centres. Multi-path topology was employed to test the effectiveness of SDN+OvS and SDN+P4 in a popular topology employed to simulate a data centre network. A gradual increase in the number of nodes used, as in [40], together with the ease in programming contributed towards the rationality for the multi-path topology. Topology II was employed to emulate an environment with a simple-grid topology. A similar topology has been presented by Zhang et al. [38], Al-Rubaye et al. [48], and Josbert et al. [49]. Further extension of the multi-path topology with additional nodes being included in the network and the popularity of similar topologies being employed for SDN research directed our rationale towards employing the simple grid topology. Topology III emulates the transit-stub network model also known as the Internet topology initially presented by Calvert et al. [31], and subsequently by [29,30,50,51,52,53,54,55,56]. Extensive research conducted towards an SDN based internet, and the popularity of similar topologies being employed for such research formed our rationale for employing the internet topology.
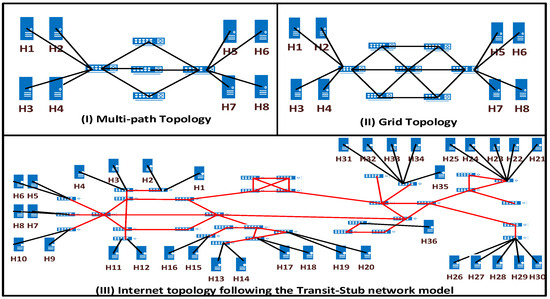
Figure 2.
Topologies employed for this research, (I) multi-path topology (II) grid topology and (III) a Transit stub network model. (H denotes Host. Red indicates links with 1 Gbps, and black indicates links with 100 Mbps).
4.2. Traffic Design
In order to mimic the Internet as closely as possible, traffic types such as Internet Control Message Protocol (ICMP), Transmission Control Protocol (TCP) [57], User Datagram Protocol (UDP) [58] and Content Delivery Network (CDN) were chosen. The traffic types were selected based on research presented by Yildirim et al. [59], in which the authors focused on popular downloaded traffic. ICMP traffic is widely used as a measurement tool for troubleshooting, control and error messaging services. TCP can be considered as one of the main protocols of the IP suite. TCP is considered as one of the most trustworthy and reliable protocols utilised by applications on the internet. UDP is widely used to send messages with a minimum protocol mechanism. Based on the research presented by Balevi et al. [60] and the popularity of UDP applications, we included UDP traffic. A recent study by Enea et al. [61] confirmed the network traffic trends for 2024, indicating that TCP and UDP constitute the majority of Internet traffic. Finally, with the popularity and demand for CDN as indicated in the respective works of Cisco [8], Saroiu et al. [62], and AppLogic [63], we have included a case study emulating the same. The study by AppLogic [63], published in 2025, reports that an average user consumes approximately 6 GB of CDN data per day. The distinct traffic types above were each examined both on an individual basis and a mixed basis to test and evaluate the performance of both SDN+OvS and SDN+P4 for the network topologies.
Our experiments were carried out in two stages. The first stage, (Tier 1), involved one type of traffic at a time being run over the network, the types being ICMP, TCP, UDP or CDN, with each forming a single case study. The second stage, (Tier 2), involved all four types of traffic being run simultaneously over the network in topologies II and III.
4.3. Tier 1—Single Type of Traffic Run
Table 1 shows the configuration of simple types of traffic run during this stage.

Table 1.
Configuration of traffic. Hosts are shown in Figure 2.
- Case Study 1—ICMP
For this case study a custom Python v2.7 script was utilised to send ICMP traffic between the designated hosts simultaneously to emulate an unpredictable traffic load in the network. ICMP traffic was generated using the ping command. A total of 1000 ICMP sequenced packets were saved for calculations for multi-path and grid topologies and 2000 sequenced packets for the Internet topology, each with a packet size of 1500 bytes and a data rate of 12 Kbps. Data was saved for both SDN+OvS and SDN+P4 in each of the three topologies. The default ping command encompasses the aforementioned packet size and the data rate. Hence, our rationality in choosing these configurations. The number of ICMP packets transferred for multi-path and grid topologies was chosen for ease of calculation. Due to the size of the network, the number of ICMP packets saved was doubled for the Internet topology.
- Case Study 2—TCP Traffic
In this case study, to establish a connection with the server and the client and to transmit data between the client and the server, iPerf [64] v2.0 was used. iPerf’s capabilities and functions were thoroughly examined and presented by Yildirim et al. [59]. Given the stability of v2.0 over v3.0 in iPerf, the former was selected for the experiments. For multi-path and grid topologies, data with a file size limitation of 1 GB was encapsulated, as TCP was chosen. For the Internet topology, a data burst for 1200 s was chosen to identify which network abstraction was able to process the largest amount of data. For ease of emulation and calculation, a download with a file size of 1 GB was chosen for multi-path and grid topologies. The 1 GB file size served as an example to a scenario where a user intends to download a file of a fixed size from a File Transfer Protocol (FTP) server. For a scenario where the user is engaged in a TCP transmission with a time constraint (i.e., Secure Shell (SSH) or Telnet), a time limitation of 1200 s was employed for the Internet topology. This was also applied with respect to the size of the network and for extending the download time, and the amount of data.
- Case Study 3—UDP Traffic
For this case study, iPerf was utilised to stream UDP traffic. Similar to case study 2, we used 1 GB of traffic for topologies I and II, with a data burst of 1200 s for topology III. The iPerf traffic was initiated with a bound of 12 MBps between the client and the server for both UDP and TCP due to resource limitations in the system platform. Similar to the TCP case study, a download with a file size of 1 GB was chosen for Topologies I and II. This case study setting was designed with the intent of emulating a user downloading multimedia content, which will be bound by a file size. For topology III, a UDP download was conducted for 1200 s with the intention of emulating a user engaged in online gaming or video conferencing. A time constraint of 1200 s was also applied with respect to the size of the network to extend the download time and amount of data. Measurements such as throughput, delay jitter, and transmission completion time were collected for both SDN+OvS and SDN+P4 for each of the three topologies.
- Case Study 4—Content Delivery Network
An emulation was designed to explore video traffic with live stream, using VLC-player [65] to send videos with the quality of 1080p and H.264 compression due to the demand and popularity for high-quality video streaming. For multi-path and grid topologies, a video of 600 s long was chosen, and for the Internet topology, a video of similar quality was chosen with a 1200 s duration. The length of the two video files (600 s and 1200 s) was used for the ease of emulation and for calculation purposes. As the Internet topology was larger in size in comparison to the multi-path and grid topologies, a larger video file was employed. The Internet topology emulated a higher number of hosts and switches involved. In order to establish an emulation reinforcing a live video stream, a Python script was utilised that determined transfers between multiple clients with a server.
4.4. Tier 2—Multiple Types of Traffic Running Simultaneously
Networks will carry different types of traffic, executing simultaneously. Tier 2 involves two case studies.
- Case Study 5—Simultaneous Traffic in Grid Topology
We attempted to saturate the links by launching multiple applications simultaneously using a custom Python script that was applied to all of the traffic in Table 1. In order to make it easier to evaluate the performance, the client and server configurations were kept the same as they were for the individual case studies. This allows us to easily observe the variance in performance between individual execution and simultaneous execution. The distinction of traffic types and their usage remains the same with the addition of VoIP traffic. VoIP traffic was not presented individually since the results between SDN+OvS and SDN+P4 had less significance due to the smaller volume of traffic involved in the communication.
- Case Study 6—Simultaneous Traffic in the Internet Topology
In this case study, we launched all of the traffic simultaneously in the Internet topology as described in Table 1, in order to closely mimic the way that the Internet operates with multiple clients and servers sending and receiving traffic. By stressing the network with a large amount of traffic and applications, we are able to collect valuable data on key performance metrics such as delay, delay jitter, packet loss, bps, and throughput. This data is collected on the client side.
5. Results and Analysis of Tier 1—Single Type of Traffic Run
In this section, we present and analyse the results of the experiments for Tier 1, a single type of traffic run. Data for both SDN+OvS and SDN+P4 will be presented under each case study followed by their analysis.
5.1. Case Study 1—ICMP
The ICMP traffic for the configuration given in Table 1 commenced at the same time. At the client end, Wireshark collected 1000 ICMP packets. Following the completion of the transfer, the average throughput for each connection was recorded.
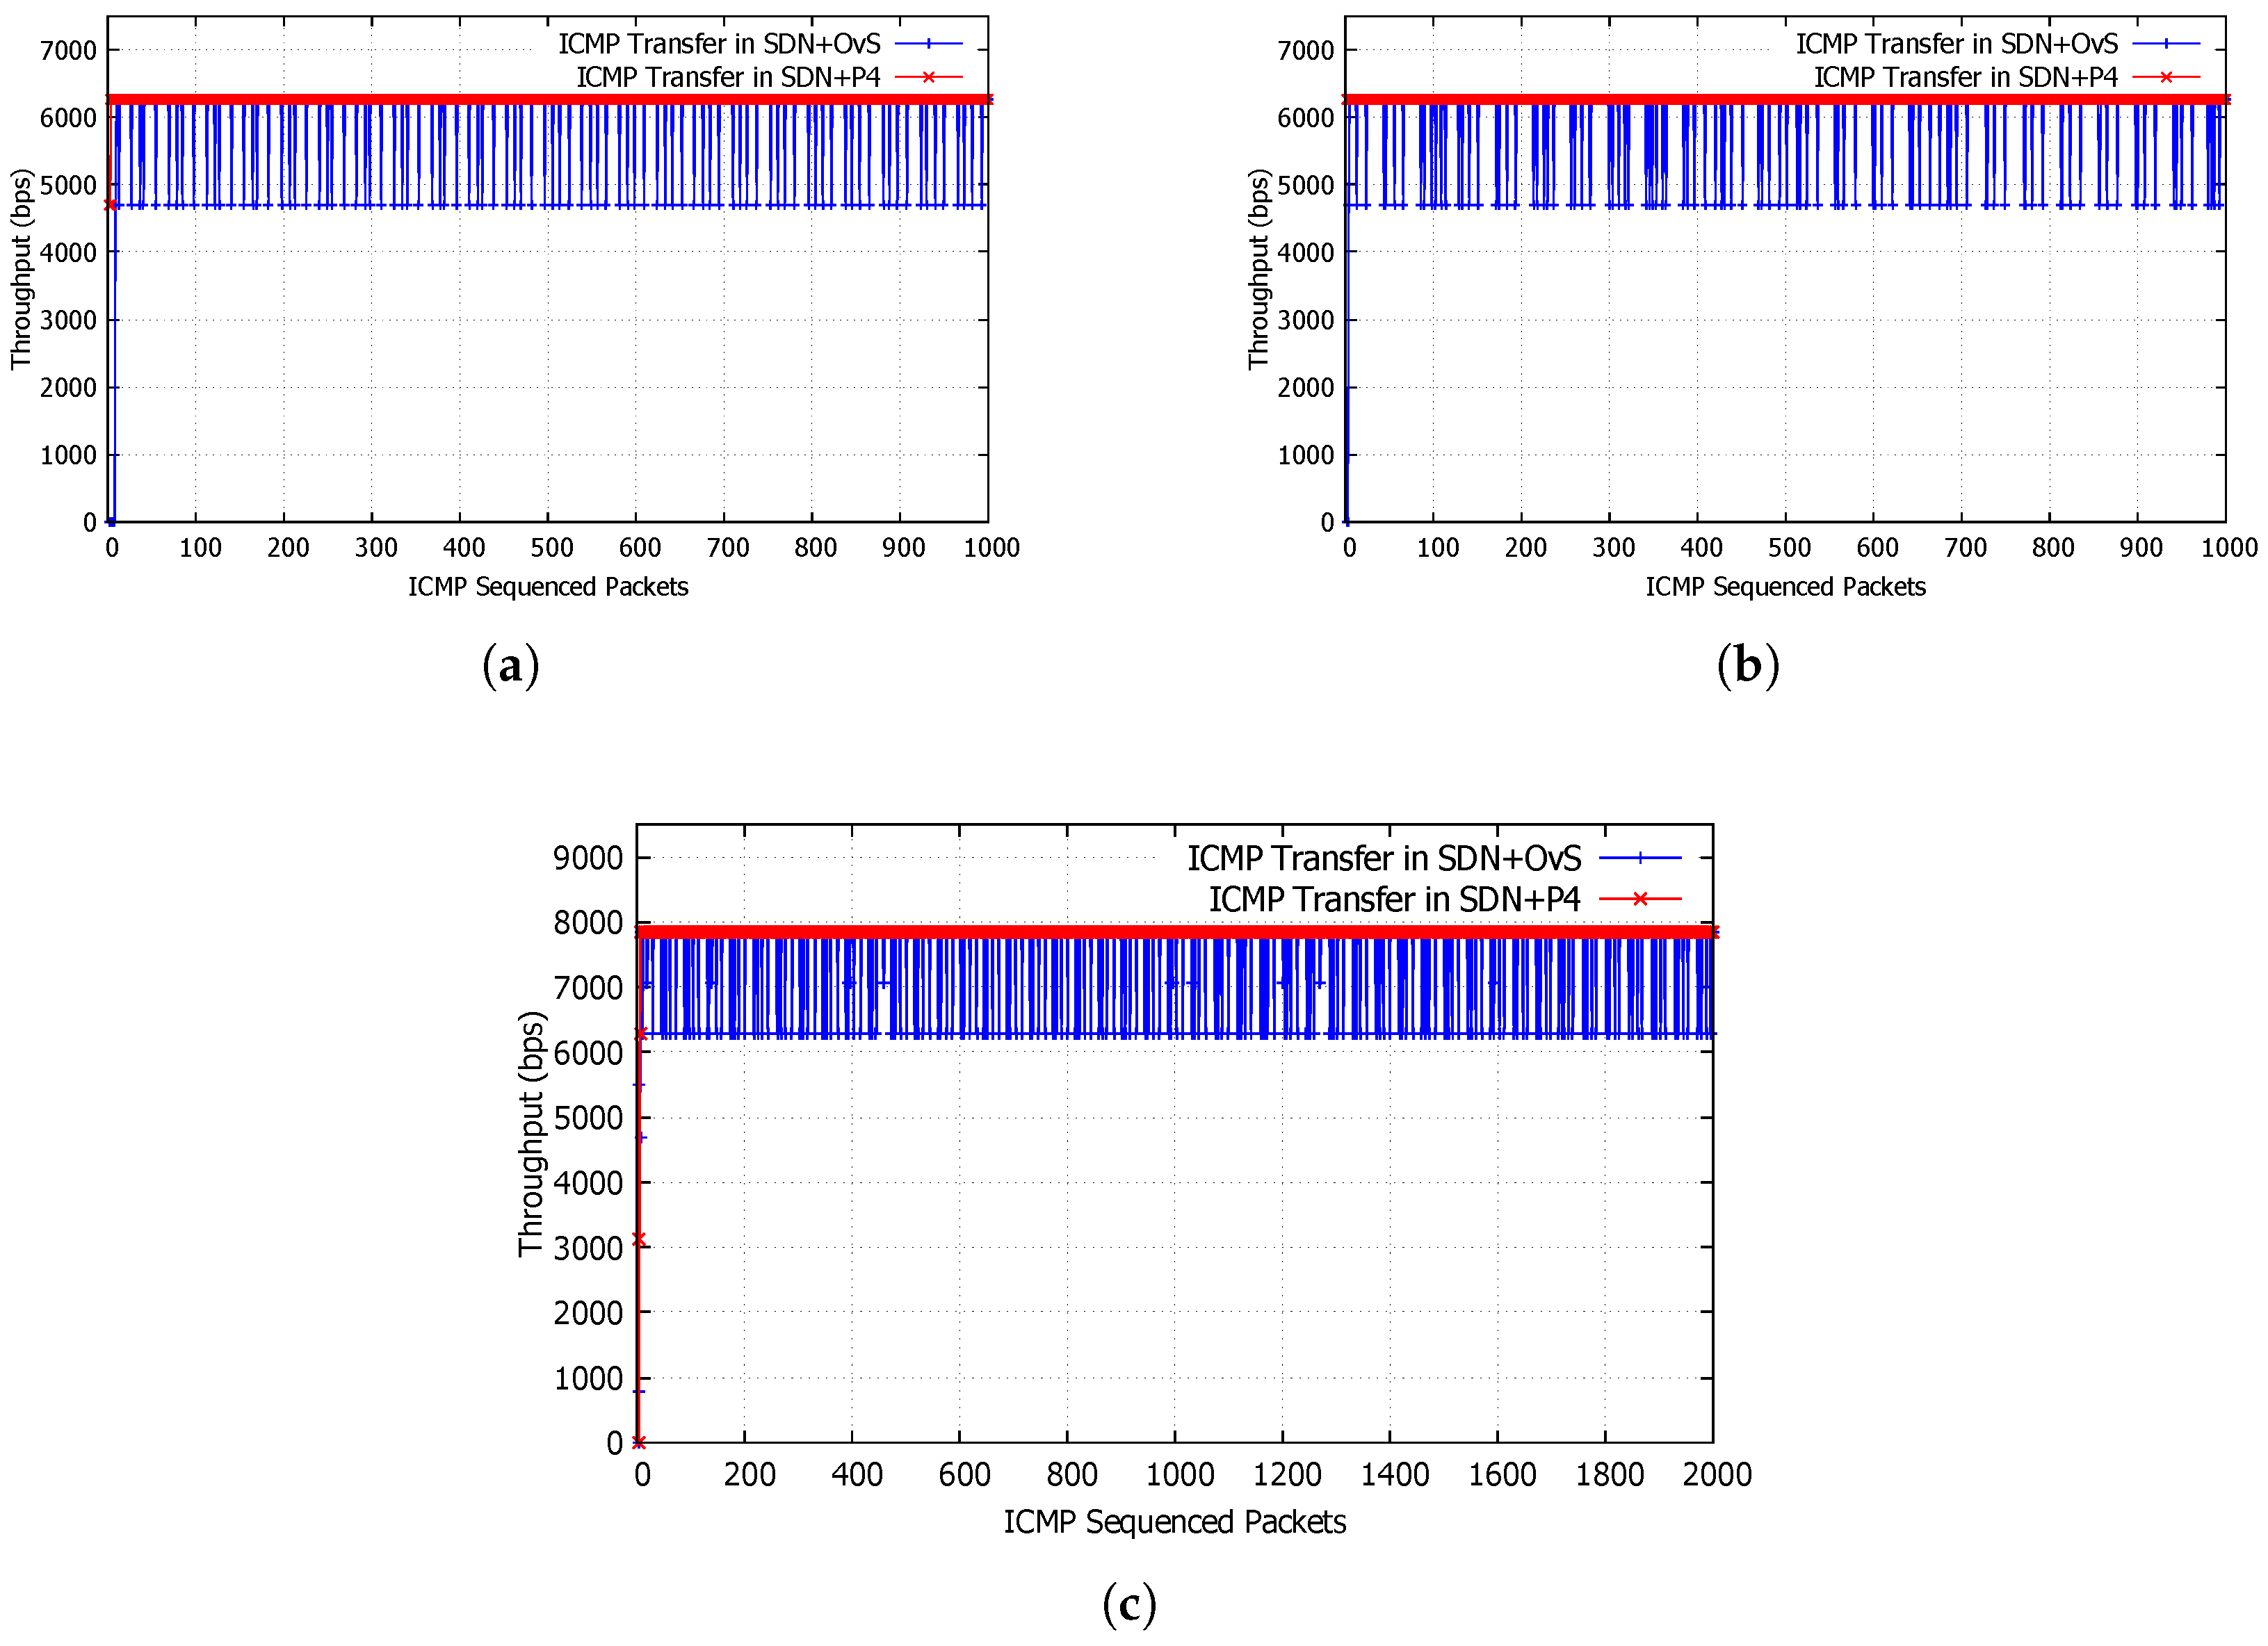
Figure 3 presents the ICMP throughput for SDN+OvS networking and SDN+P4 networking, over the three topologies given in Figure 1. For multi-path and grid topologies, the SDN+P4 networking has maintained a steady stream of ICMP traffic with a constant throughput of approximately 6300 bps until the end of transmission (see the red line in Figure 3a,b). The SDN+OvS emulation recorded recurring drops in throughput from approximately 6300 bps to 4800 bps (see the blue lines in Figure 3a,b). The same patterns occurred in Figure 3c, the transit-stub network model, with values of approximately 7800 bps for SDN+P4 and recurring drops in throughout to approximately 6200 bps for SDN+OvS. We accumulated results over ten executions of the experiments to inspect the average values for throughput. However, in Figure 3c, the throughput has registered an aperiodic drop for SDN+OvS as shown by the blue lines. This could be due to one of the two following factors, processing requirements or congestion. When faced with processing requirements or congestion, SDN networks tend to face performance degradation and cause packet loss. The same has also been observed by Rahman et al. [66].
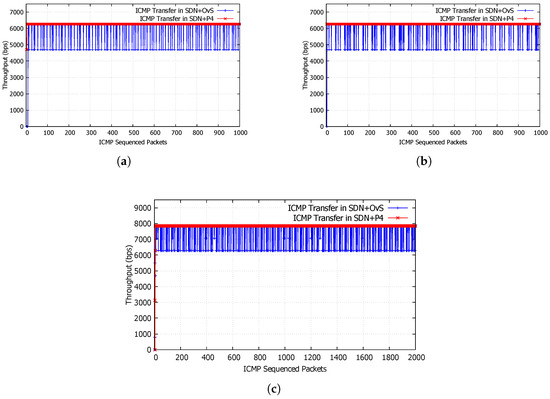
Figure 3.
Throughput of ICMP transfer in case study 1. (a) ICMP transfer of 1000 packets in multi-path topology. (b) ICMP transfer of 1000 packets in grid topology. (c) ICMP transfer of 2000 packets in transit-stub network model.
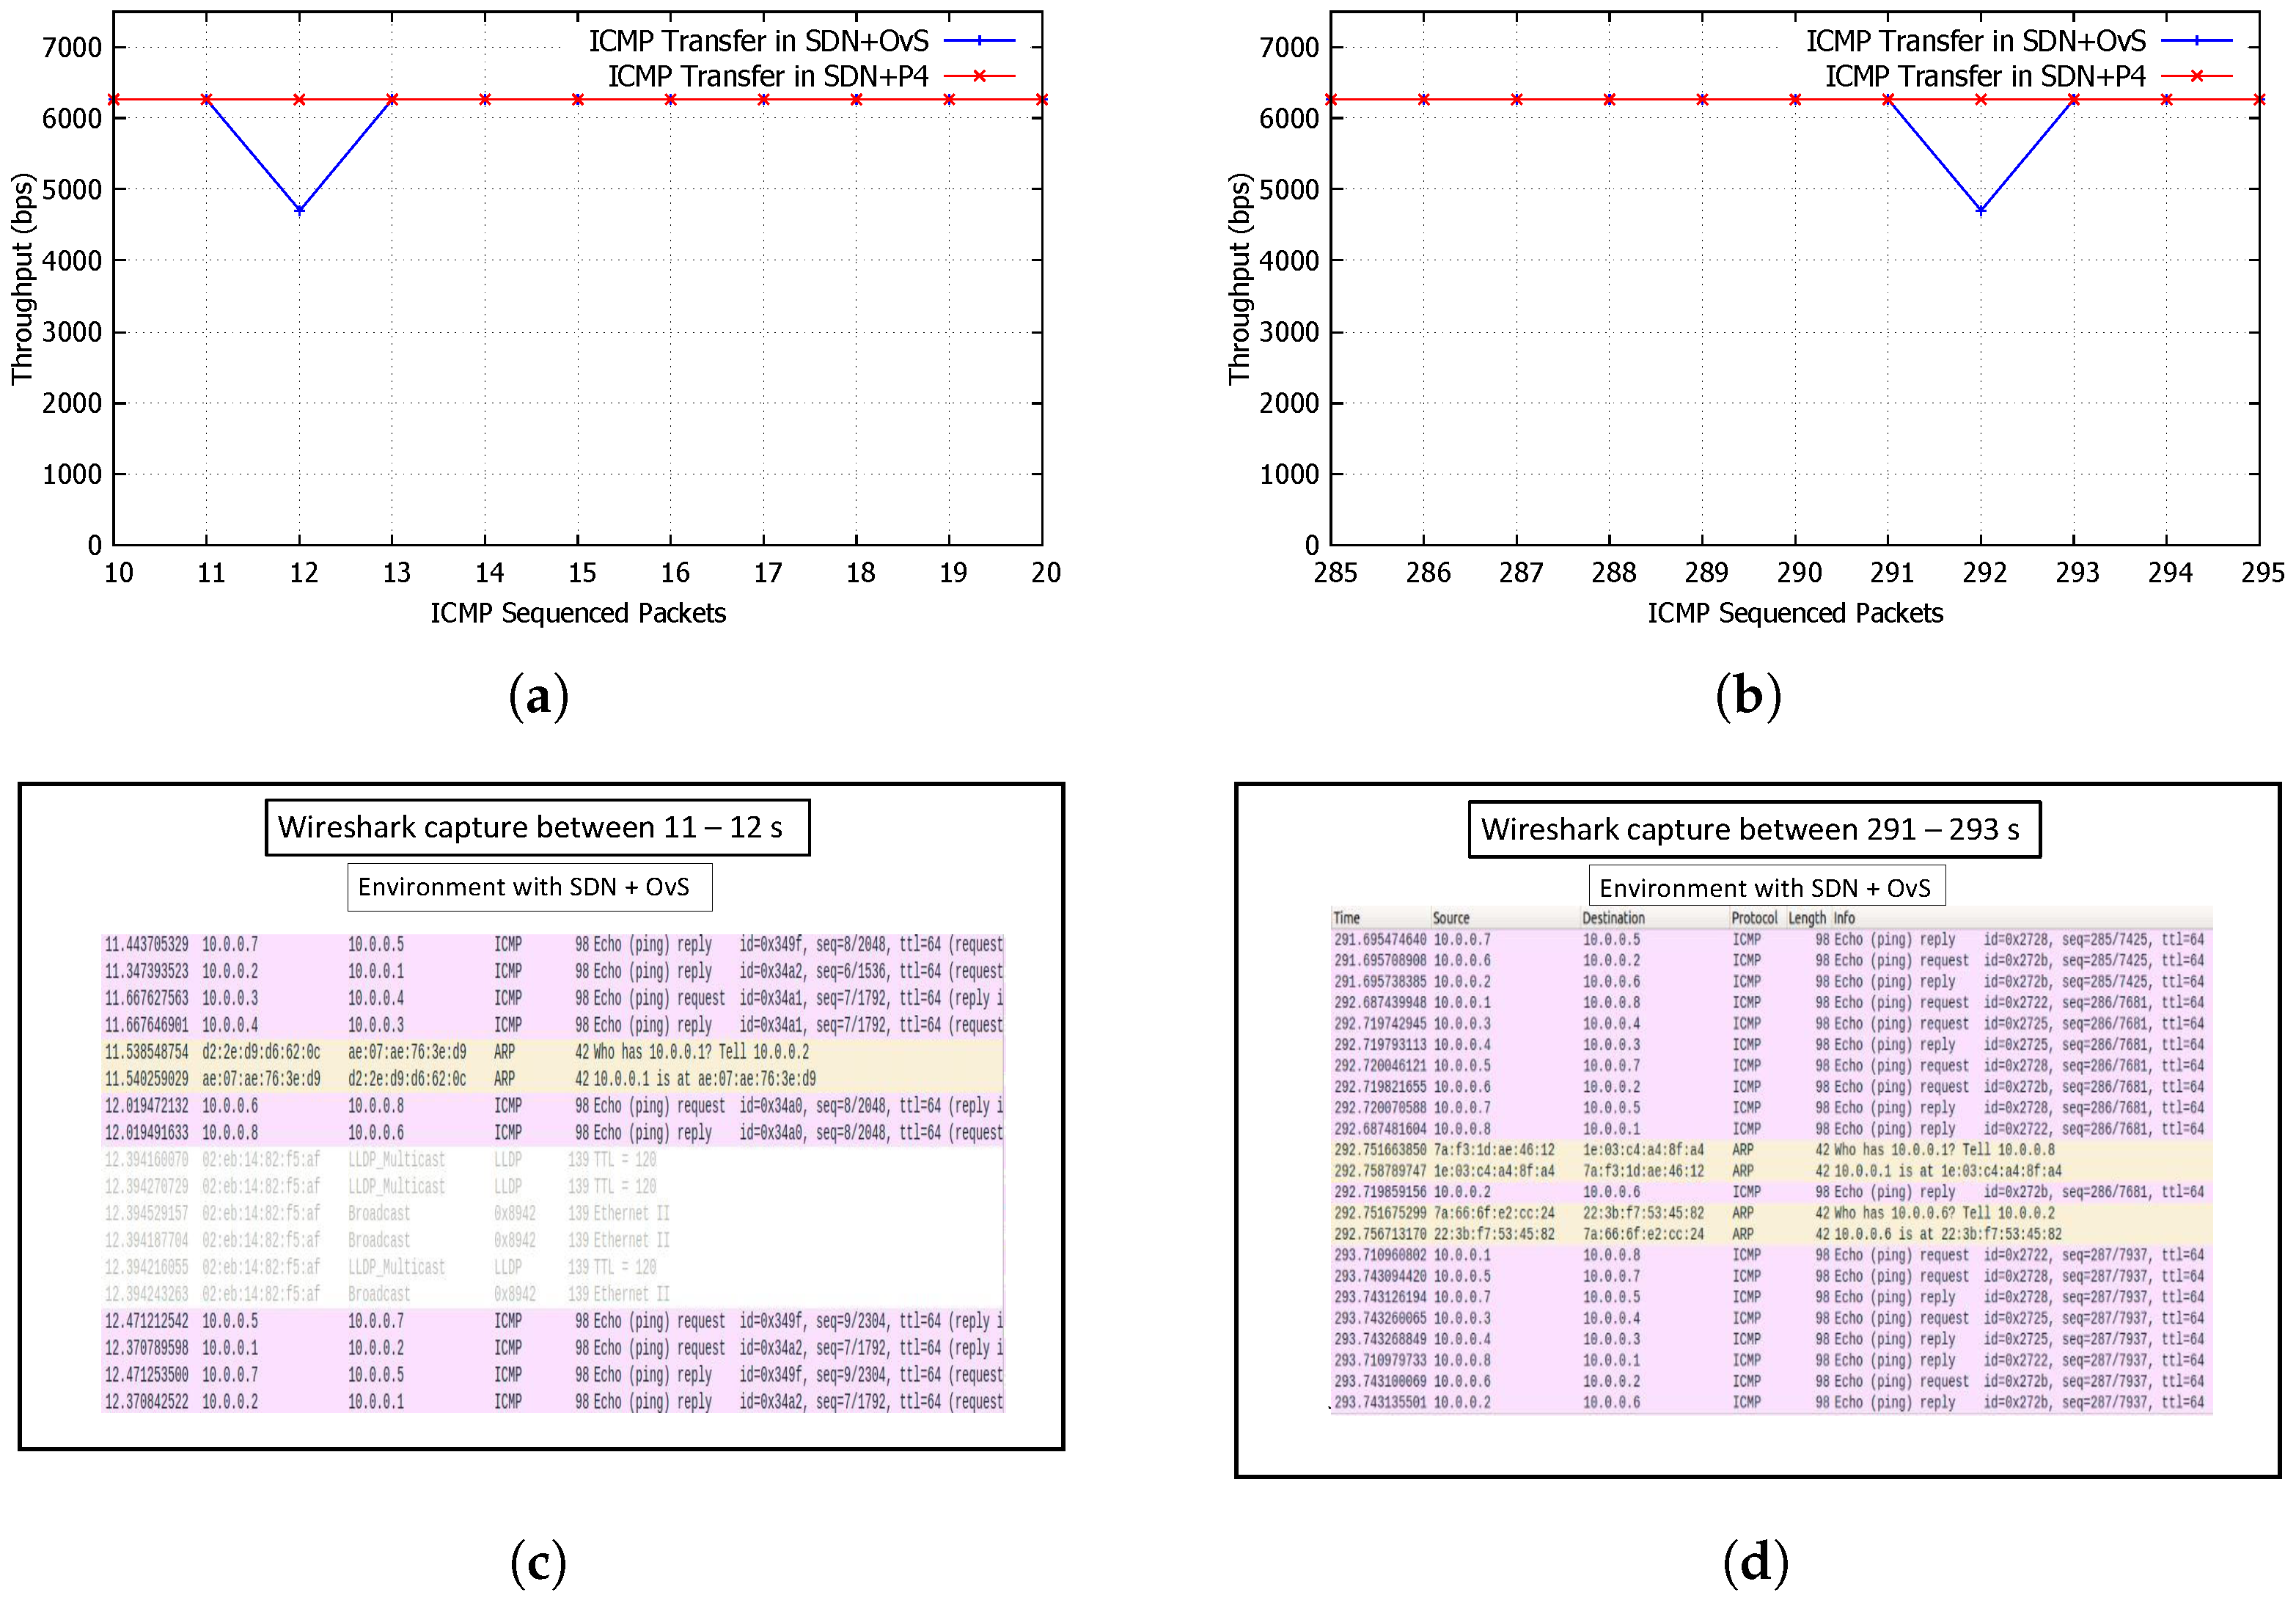
We investigated the throughput drop for the SDN+OvS experiments. Figure 4 shows the throughput drops at 12 s and 292 s (Figure 4a,b) together with the Wireshark captures Figure 4c,d at those times for multi-path topology. Out of the two controller states, reactive and proactive, the reactive state was chosen to avoid misconfigurations during the installation of FlowRules when using the Reactive Forwarding application in the ONOS controller. Given that the controller was in a reactive state, PACKET_IN and PACKET_OUT control messages played a crucial role in maintaining ARP/IP address mapping information [67]. The drop in throughput for SDN+OvS resulted from the ARP and LLDP packets, (observed in Figure 4c,d), being routed towards the slow path of the OvS, detouring from the caching layer. A detour occurs when the OvS sends a PACKET_IN message to the SDN controller to resolve the headers. Until a response arrives as a form of PACKET_OUT from the SDN controller, the packet will remain in the switch buffer. Deviating from the caching layer or fast path can create an overhead [68] in the network which leads to a deterioration in performance. Combining SDN+P4 has also been instrumental in the work presented by Ke et al. [28], where the P4 architecture has shown a reduced processing overhead. Research by Boteanu et al. [13], Antichi et al. [69], and Giotsas et al. [70] have established that ARP messages can create a bottleneck in the network due to high volume and frequency [71,72,73]. Therefore, deviating from a fast path in the OvS architecture can create a substantial overhead in the network. Processing requirements from the CPU towards the ARP/LLDP packets can also affect the processing of application centric packets, ultimately resulting in a poor quality of service. Since each emulated host represents a networked host with Ubuntu 18.04, the default ARP update time is 60 s. Hence, a periodic ARP update will be generated automatically. The results in Figure 3 and Figure 4 demonstrate how the network performance has been affected in the SDN+OvS architecture through periodic ARP updates.
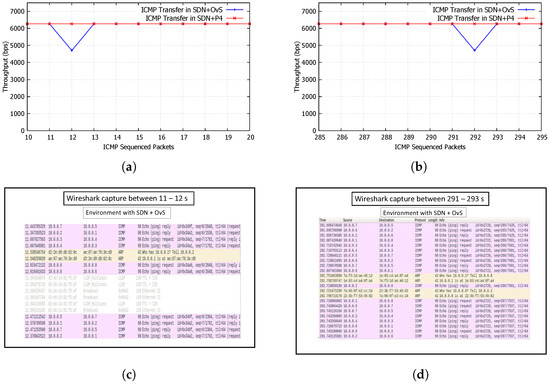
Figure 4.
ICMP data capture at 10–20 s and 285–295 s in multi-path topology. (a) ICMP throughput at 10–20 s. (b) ICMP throughput at 285–295 s. (c) Wireshark capture of ARP and LLDP messages at 11–12 s. (d) Wireshark capture of ARP and LLDP messages at 291–293 s.
In the SDN+P4 experiments, the P4 switch processed headers in parallel, thus, the LLDP and ARP packets did not interfere with ICMP packets in the pipeline. The SDN+P4 environment, therefore, did not experience a throughput drop (as shown by the red line in Figure 3). Due to parallel processing for headers and packets, the bmv2 switch was able to process packets faster, reducing delay in the core network. Given the periodic nature of the ARP packets (60 s by default), the exponential growth associated with a higher number of connected devices and ARP storms caused by network outages, a bottleneck may occur if the packets are not processed faster. Hence utilising SDN+P4 will help in meeting some stringent requirements for future applications, given its ability to process packets faster for both application centric and network centric traffic.
5.2. Case Study 2—TCP
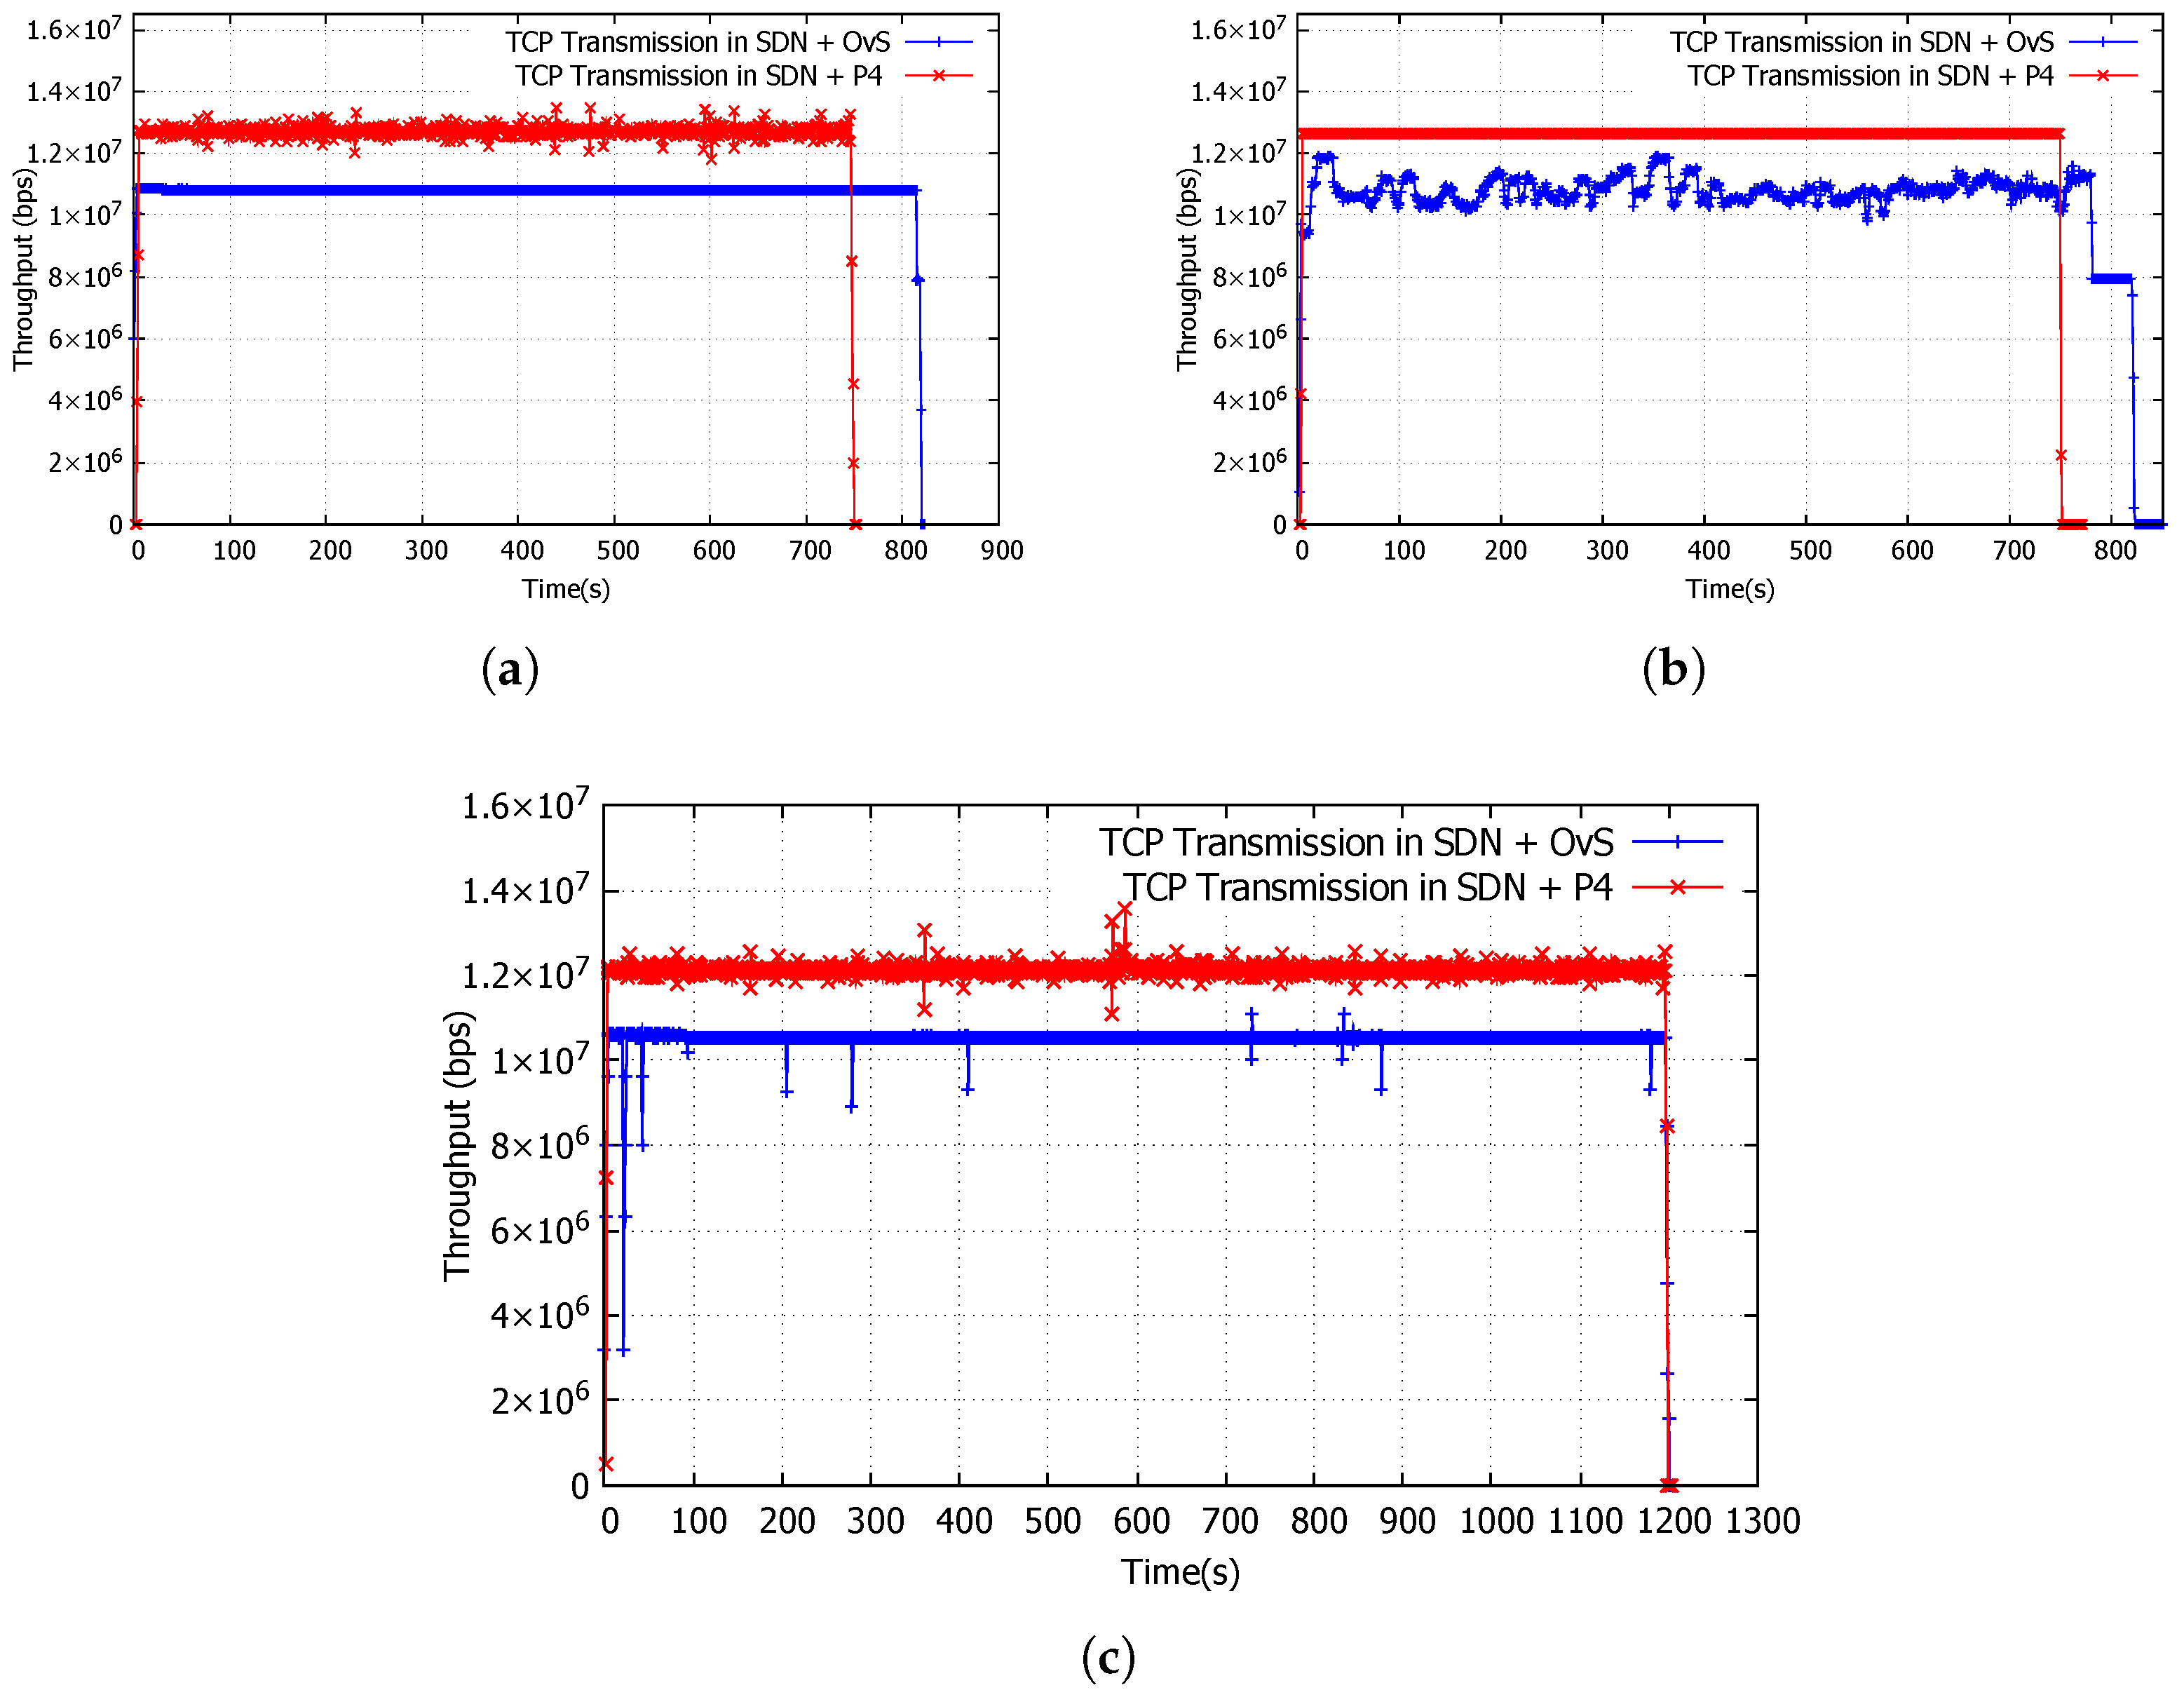
TCP traffic was generated via a file download of 1 GB using iPerf for multi-path and grid topologies. For the Internet topology, a transmission of TCP for 1200 s was employed. See Figure 1 and Table 1 for respective topologies and traffic configuration. The results for the experiments are shown in Figure 5 with a summary of the results given in Table 2.
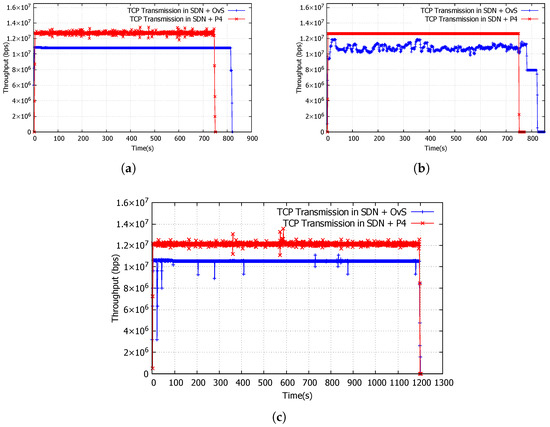
Figure 5.
Throughput of TCP data transfer in case study 2. (a) TCP transfer of 1 GB data using iPerf in multi-path topology. (b) TCP transfer of 1 GB data using iPerf in grid topology. (c) TCP transfer for 1200 s using iPerf in the Internet topology.
Table 2.
Network performance for case study 2—TCP traffic.
In SDN+P4 (red line) TCP has achieved a higher and more constant throughput in comparison to SDN+OvS (blue line). In Figure 5a,b, the fixed sized TCP download completed earlier for SDN+P4 in approximately 750 s as opposed to approximately 820 s for SDN+OvS. In Figure 5b, (the blue line) experienced fluctuations in throughput. TCP traffic, by design, requires acknowledgements. As the data packets and the acknowledgements traverse in the same route (as observed by accessing the ONOS GUI), the throughput fluctuates due to the saturation of links. It is also noteworthy that for both SDN+P4 and SDN+OvS, TCP traffic traversed in the same route for the grid topology. However, the SDN+P4 didn’t record fluctuations in throughput due to its faster processing capability. For multi-path topology (Figure 5a), a fluctuation of throughput was not recorded in the SDN+OvS due to the small size of the network and fewer nodes with processing requirements. For the Internet topology (Figure 5c), similar results were observed as per multi-path topology. This is because the links in the Internet topology were not saturated with network traffic.
Figure 5c presents the transmission of TCP traffic in the Internet topology. In contrast to a fixed download size (Figure 5a,b), the TCP traffic file downloading from iPerf was run with a time constraint of 1200 s. Again, SDN+P4 (red) achieves a higher throughput than that achieved with SDN+OvS (blue), demonstrating that P4 switches process packet forwarding in SDN+P4 faster than OvS switches in SDN+OvS.
Table 2 summarises the performance metrics in terms of throughput, packet loss, Syn packet delay, delay, amount of data transmitted and transmission time for this group of experiments, averaged over the connections for each of the topologies given in Table 1. In all counts, SDN+P4 has shown significant improvement over SDN+OvS. Throughput has shown improvements in all three topologies, by 9%, 11% and 12% respectively. Syn delay has also been reduced for SDN+P4, by 77%, 94% and 64%, respectively, for the three topologies. The TCP Syn Delay [74] has been calculated by determining which switch architecture can complete the TCP handshake more efficiently and effectively to establish a TCP connection. Given the nature of the TCP traffic, SYN packets play a crucial rule in establishing a TCP connection. As shown in Table 2, SDN+P4 has spent the least amount of time in synchronising the stateful connection between the respective client and server. Having achieved a higher throughput for all cases in SDN+P4, total transmission time has been reduced by 8% and 9%, respectively, for multi-path and grid topologies, with a 12% increase on the total data transmitted for the Internet topology. The application of SDN+P4 has improved the performance of the network significantly.
5.3. Case Study 3—UDP
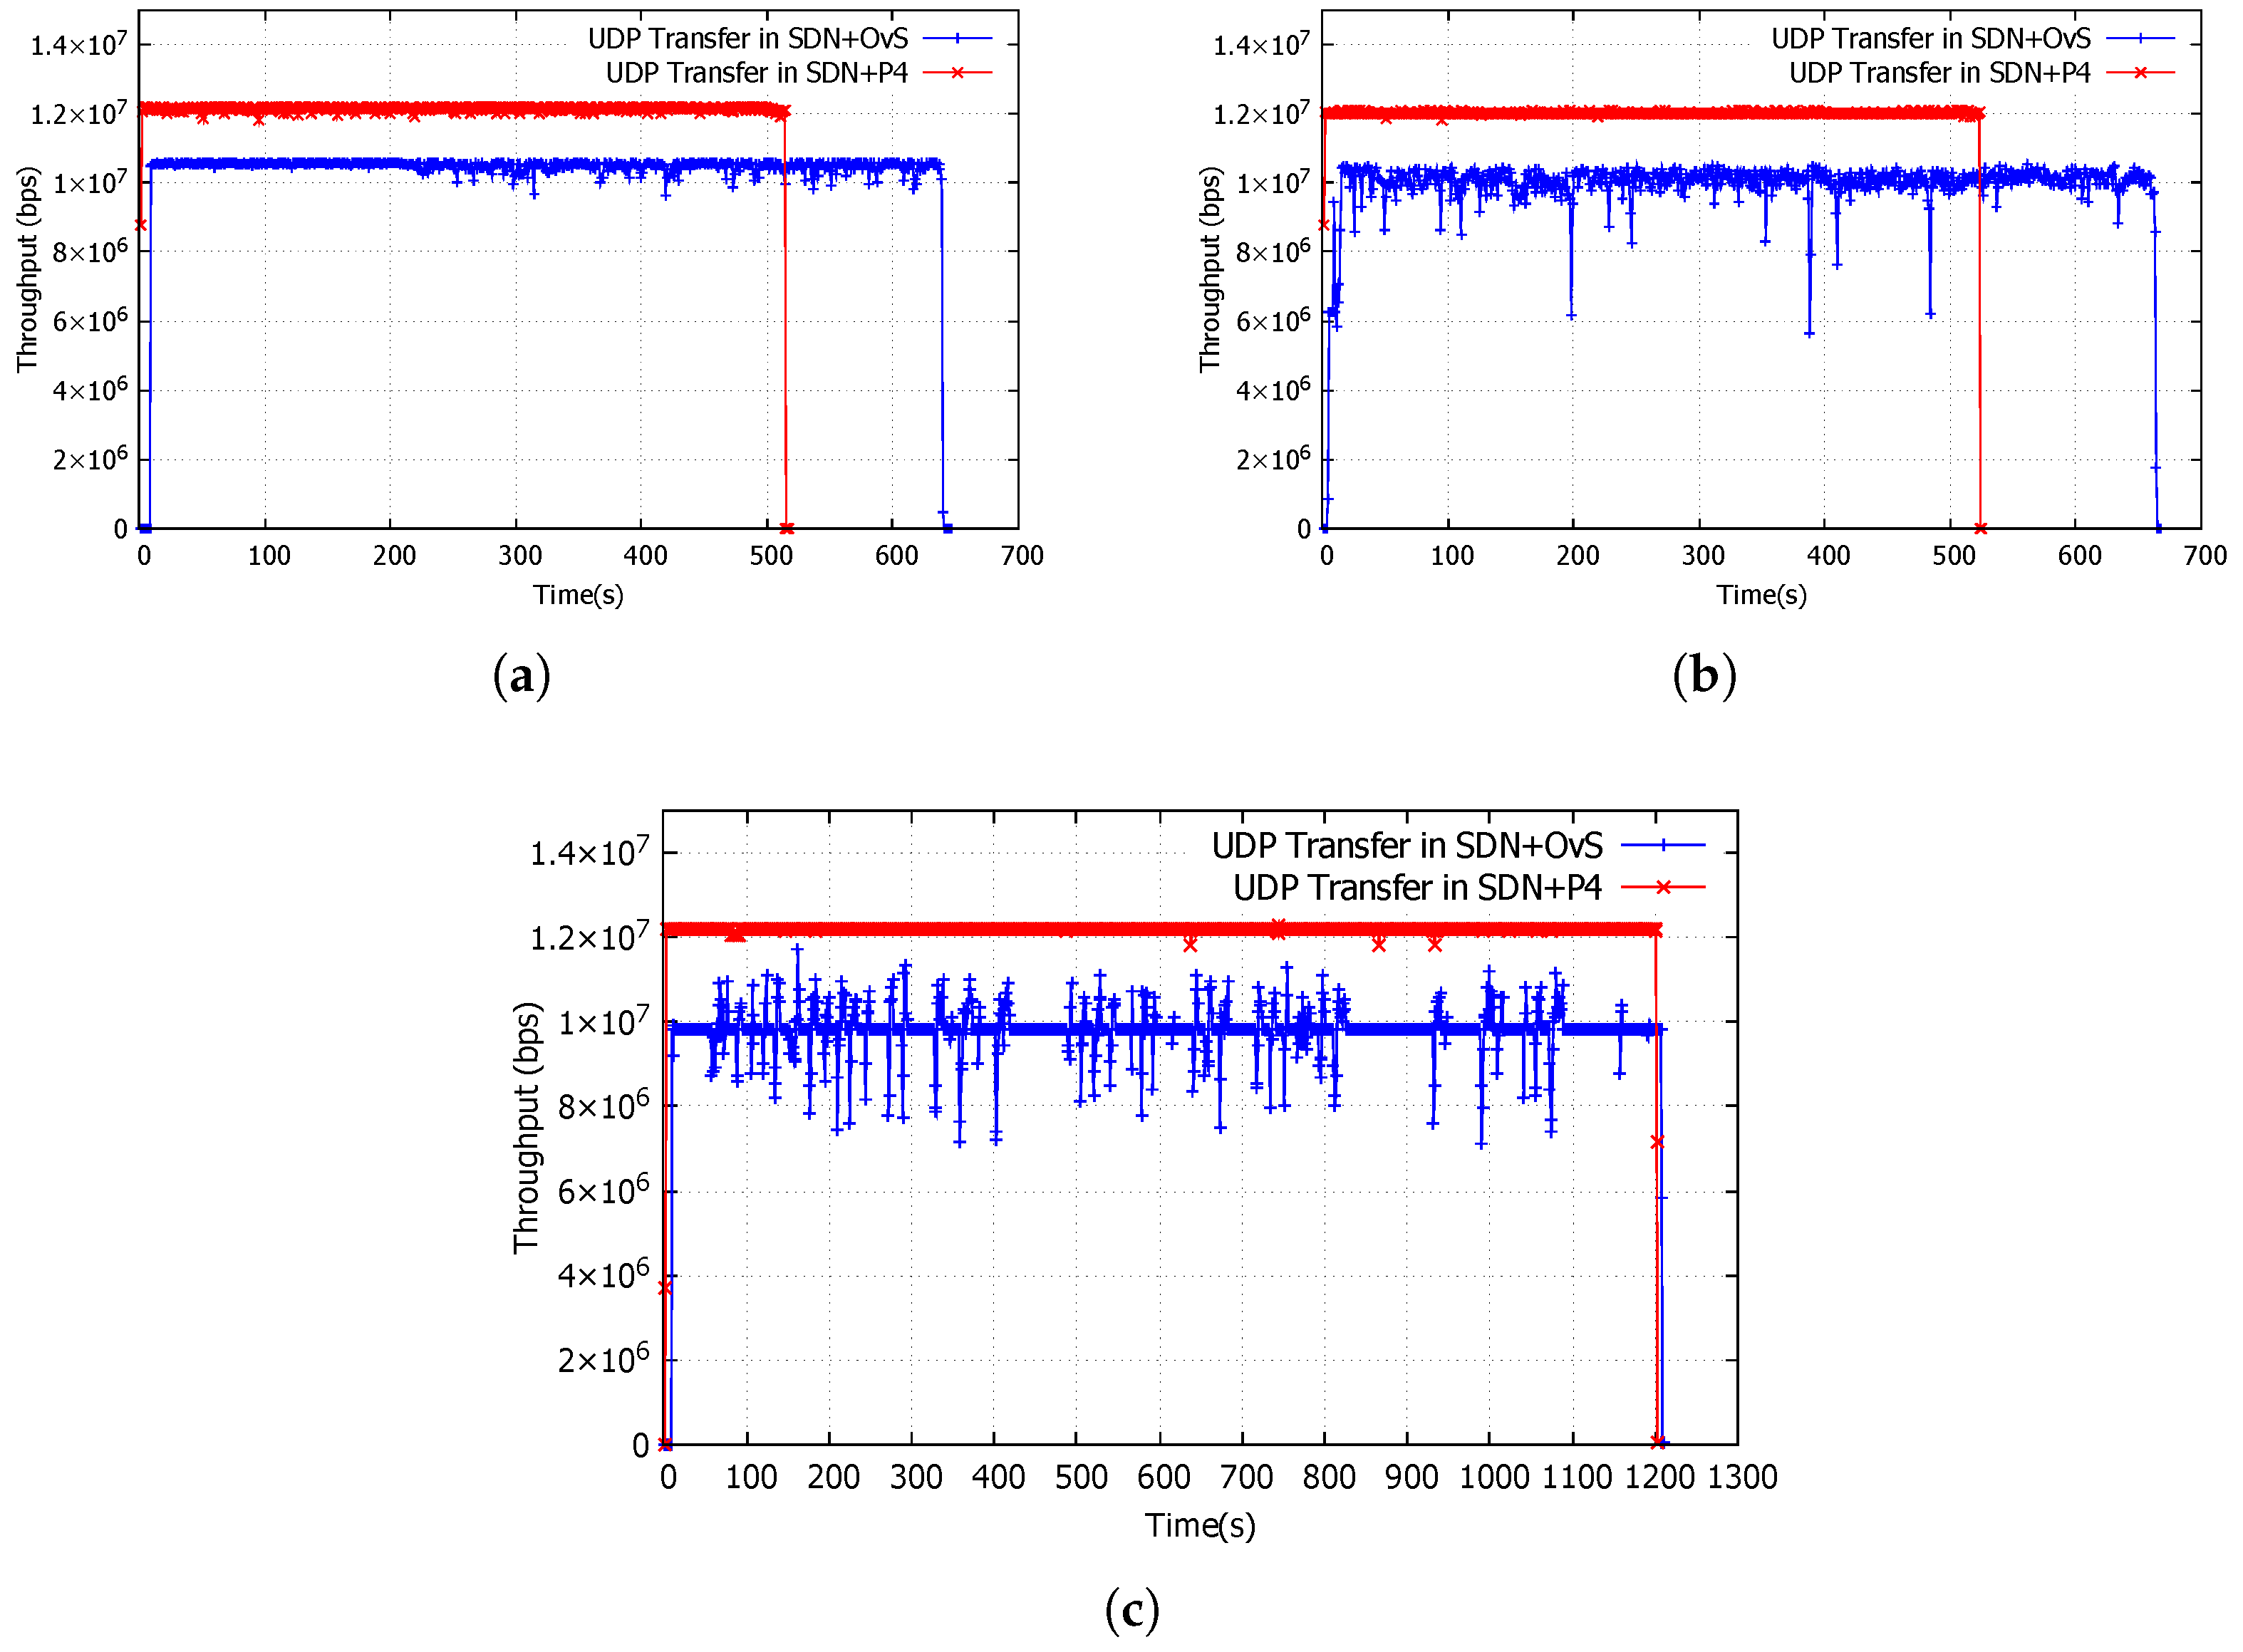
In case study 3, UDP traffic was generated via file downloads using iPerf. Clients downloaded a file of 1 GB from respective servers for multi-path and grid topologies, and considered a UDP transmission of 1200 s for the Internet topology. The results of the experiments are presented in Figure 6 together with a summary of the results given in Table 3.
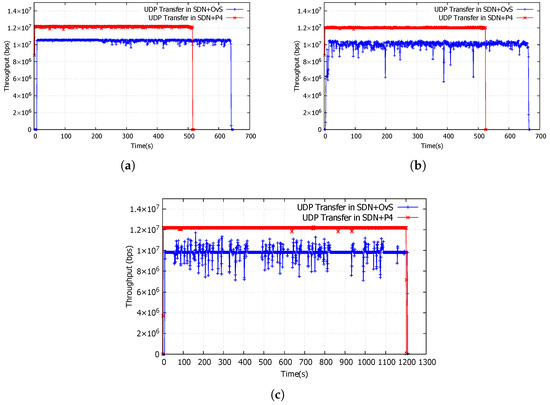
Figure 6.
Throughput of UDP data transfer in case study 3. (a) UDP transfer of 1 GB data using iPerf in multi-path topology. (b) UDP transfer of 1 GB data using iPerf in grid topology. (c) UDP transfer for 1200 s using iPerf in the Internet topology.
Table 3.
Network performance for case study 3—UDP traffic.
For all three experiments, Figure 6a–c show that SDN+P4 achieved a higher and constant throughput in comparison to SDN+OvS. The initial delay in SDN+OvS was longer than for SDN+P4, because the route discovery delay is significant in SDN+OvS but less so with SDN+P4. With a successful population of FlowRules, consuming a greater time for route discovery, bottlenecks can result in real-time applications that involve a demanding service, such as, Vehicle-to-Everything (V2X).
In Figure 6a, the fixed size UDP download completed earlier for SDN+P4 (in approximately 510 s (Figure 6a), than for SDN+OvS which took approximately 640 s, (Figure 6b). In both SDN+P4 and SDN+OvS, traffic traversed the same route for topologies I and II. In contrast to Figure 6a,b, the UDP traffic file download in iPerf ran for a fixed 1200 s in the Internet topology. As shown in Figure 6c, SDN+P4 (red) achieved a higher throughput than SDN+OvS (blue). In all cases the P4 switches process packet forwarding in SDN+P4 faster than non-P4 switches in SDN+OvS.
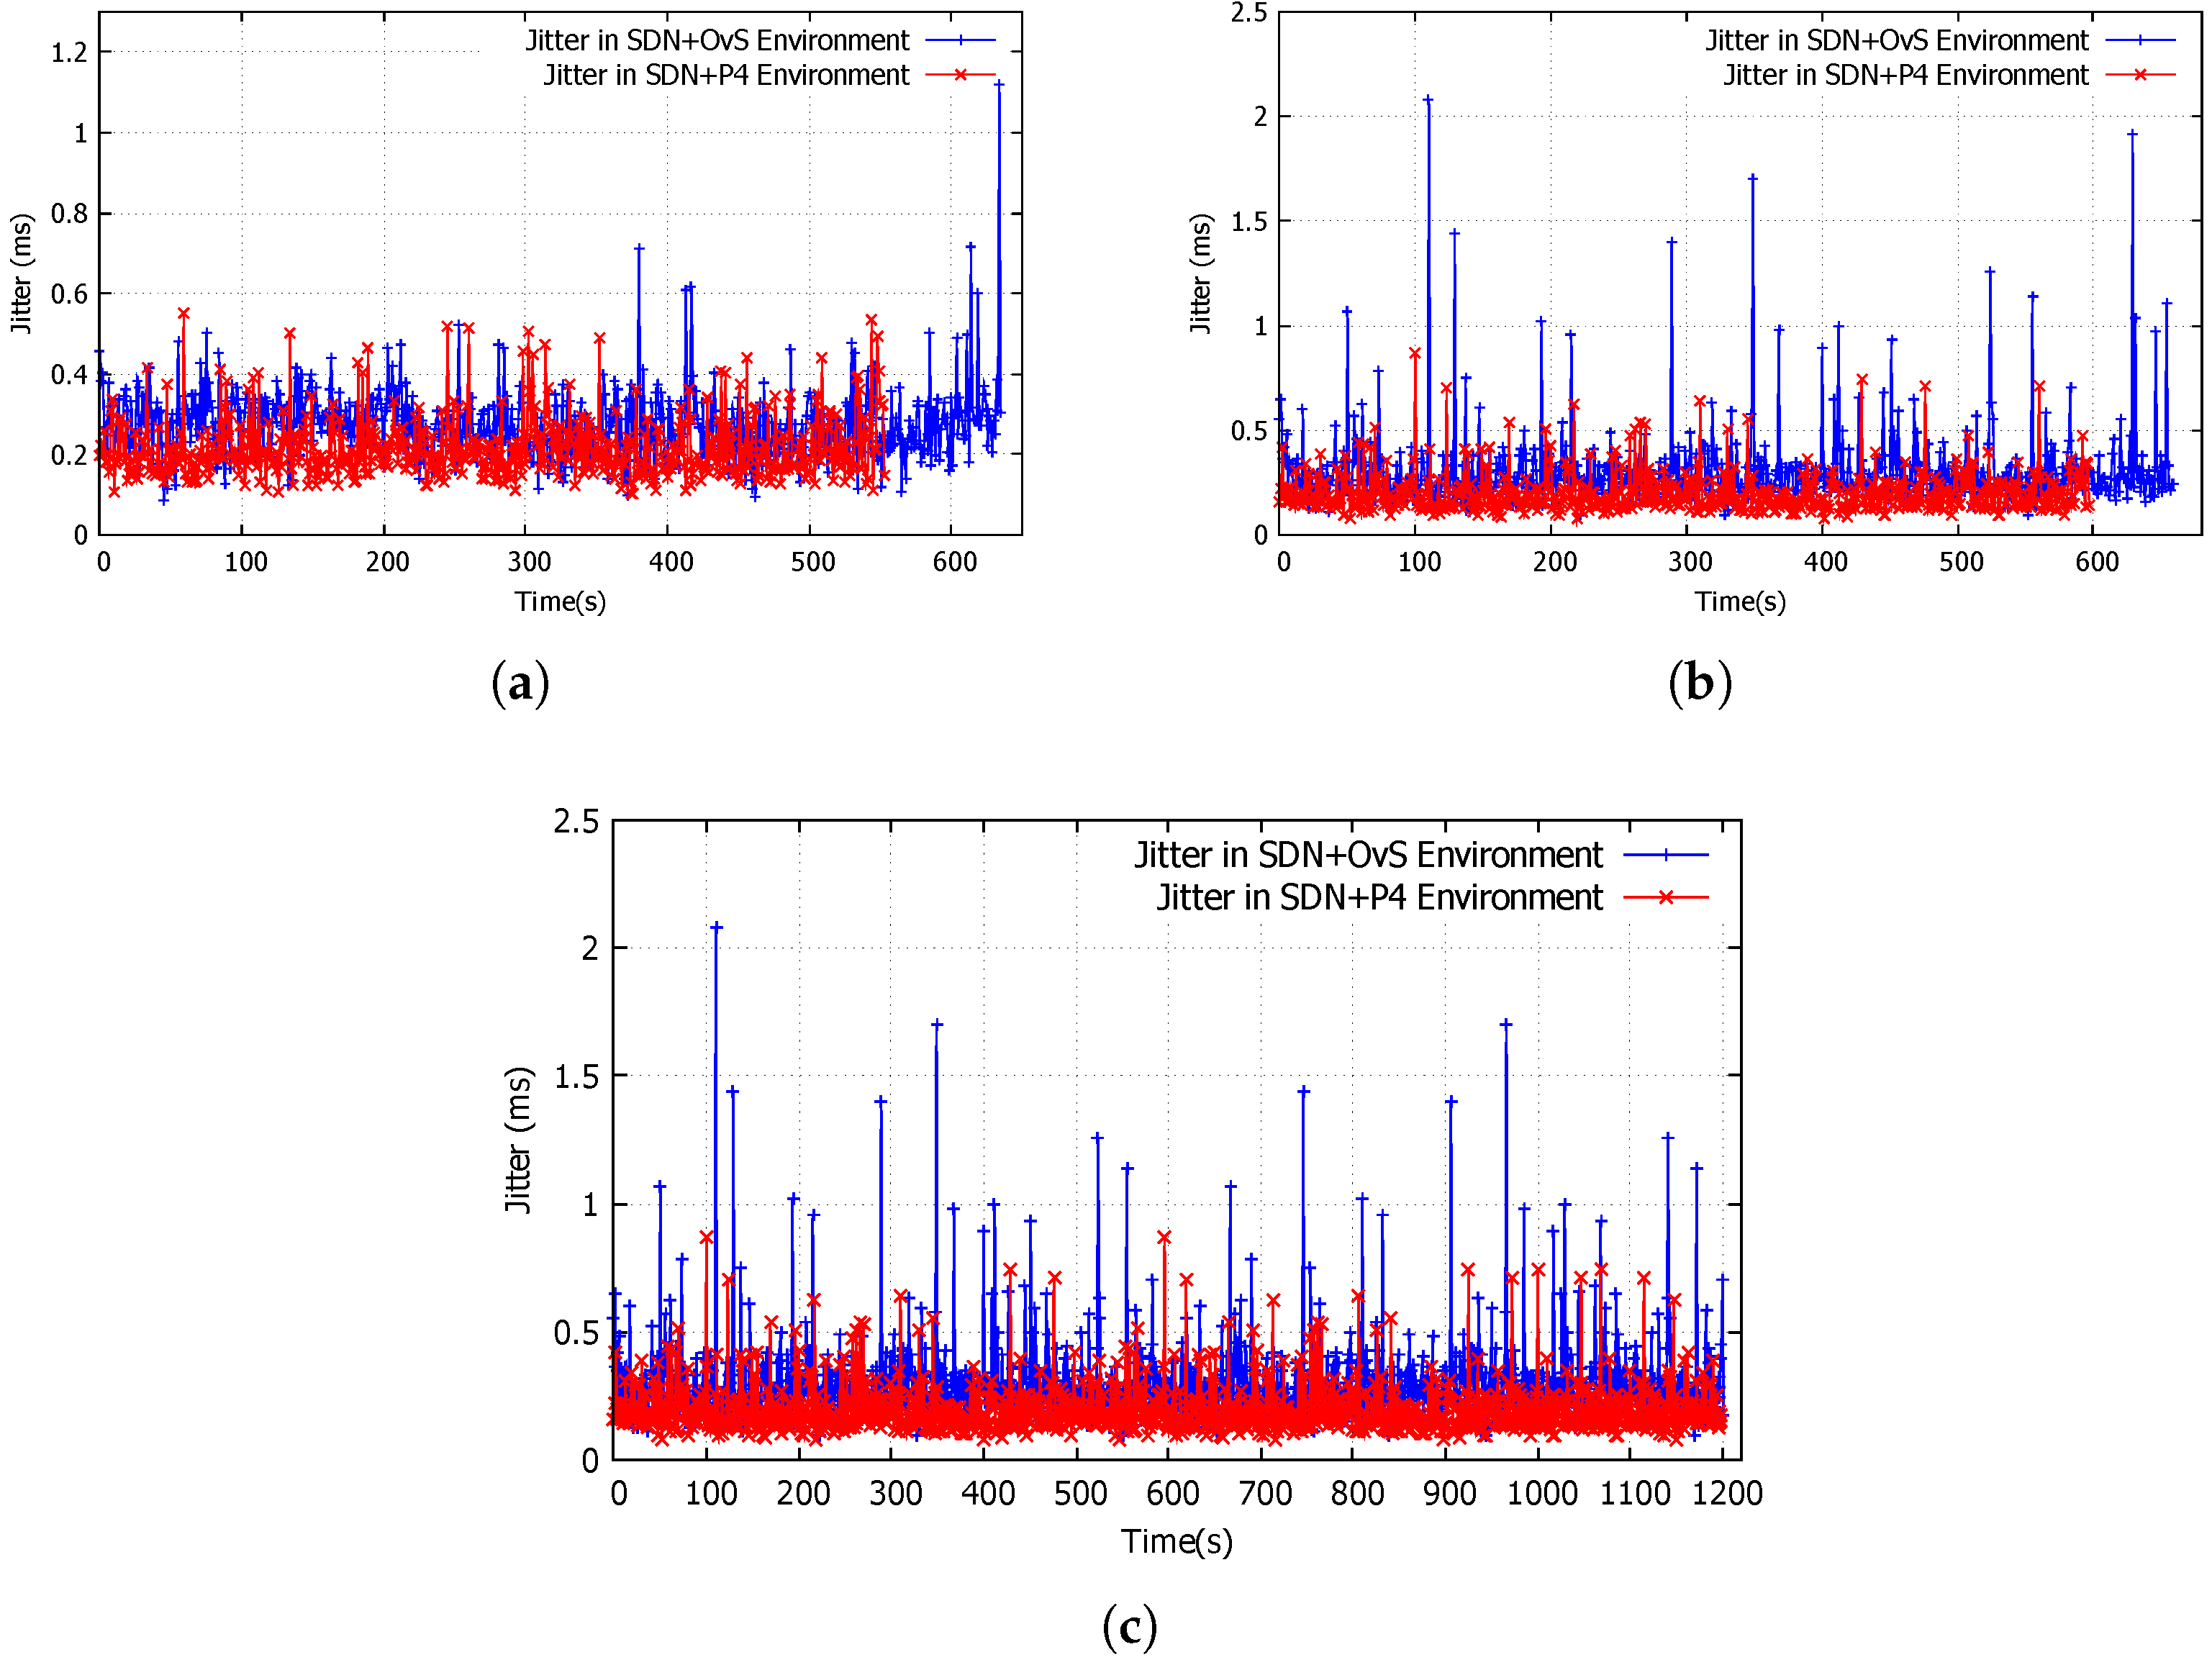
For case study 3, Figure 7a–c present jitter for UDP packets. As observed in Figure 7a,b, jitter in SDN+OvS (the blue lines) indicate a lower jitter than that collated by SDN+P4. Albeit being recorded for a fraction of a few seconds in a quasi-periodic trend, an argument can be presented that these should not contribute towards an application that requires stringent jitter constraints. The primary reason for this quasi-periodic pattern of higher jitter is the higher throughput that was recorded by SDN+P4. This has been corroborated by Emma et al. [75]. In Table 3, SDN+OvS recorded an average jitter of 0.298 ms while SDN+P4 produced an average of 0.231 ms using Equation (1).
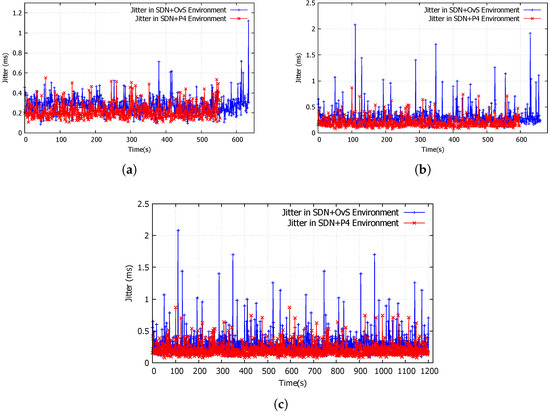
Figure 7.
Jitter of UDP data transmission in case study 3. (a) Jitter experienced for UDP Transmission in multi-path topology. (b) Jitter experienced for UDP Transmission in grid topology. (c) Jitter experienced for UDP Transmission in the Internet topology.
Here M represents the number of flows in the network, Nf denotes the number of packets in flow f and Jfi represents the jitter in packet i of flow f. With the application of Equation (1) and the analysis of jitter, SDN+P4 recorded a reduction in jitter of 22% in comparison to SDN+OvS.
Table 3 summarises the performance metrics in terms of throughput, packet loss, delay, amount of data transmitted and transmission time for this group of experiments, averaged over the respective connections given in Table 1. In all cases, SDN+P4 has demonstrated a significant improvement in network related statistics in comparison to SDN+OvS. For example, the grid topology has demonstrated a 13% improvement in throughput for SDN+P4 in comparison to SDN+OvS. SDN+P4 has reduced the packet loss from 22% to 9%, a reduction of 59%. Recorded delay for UDP traffic has reduced from 1.95 s for SDN+OvS to 0.32s for SDN+P4, a reduction of 83%. Lastly, the total transmission time has reduced by 14% due to the faster download speed achieved by SDN+P4 over that achieved with SDN+OvS. Although the above results for each case study were conducted on software switches, the experiments can be conducted on hardware switches to further support our hypothesis for improved results [21].
5.4. Case Study 4- Content Delivery Network
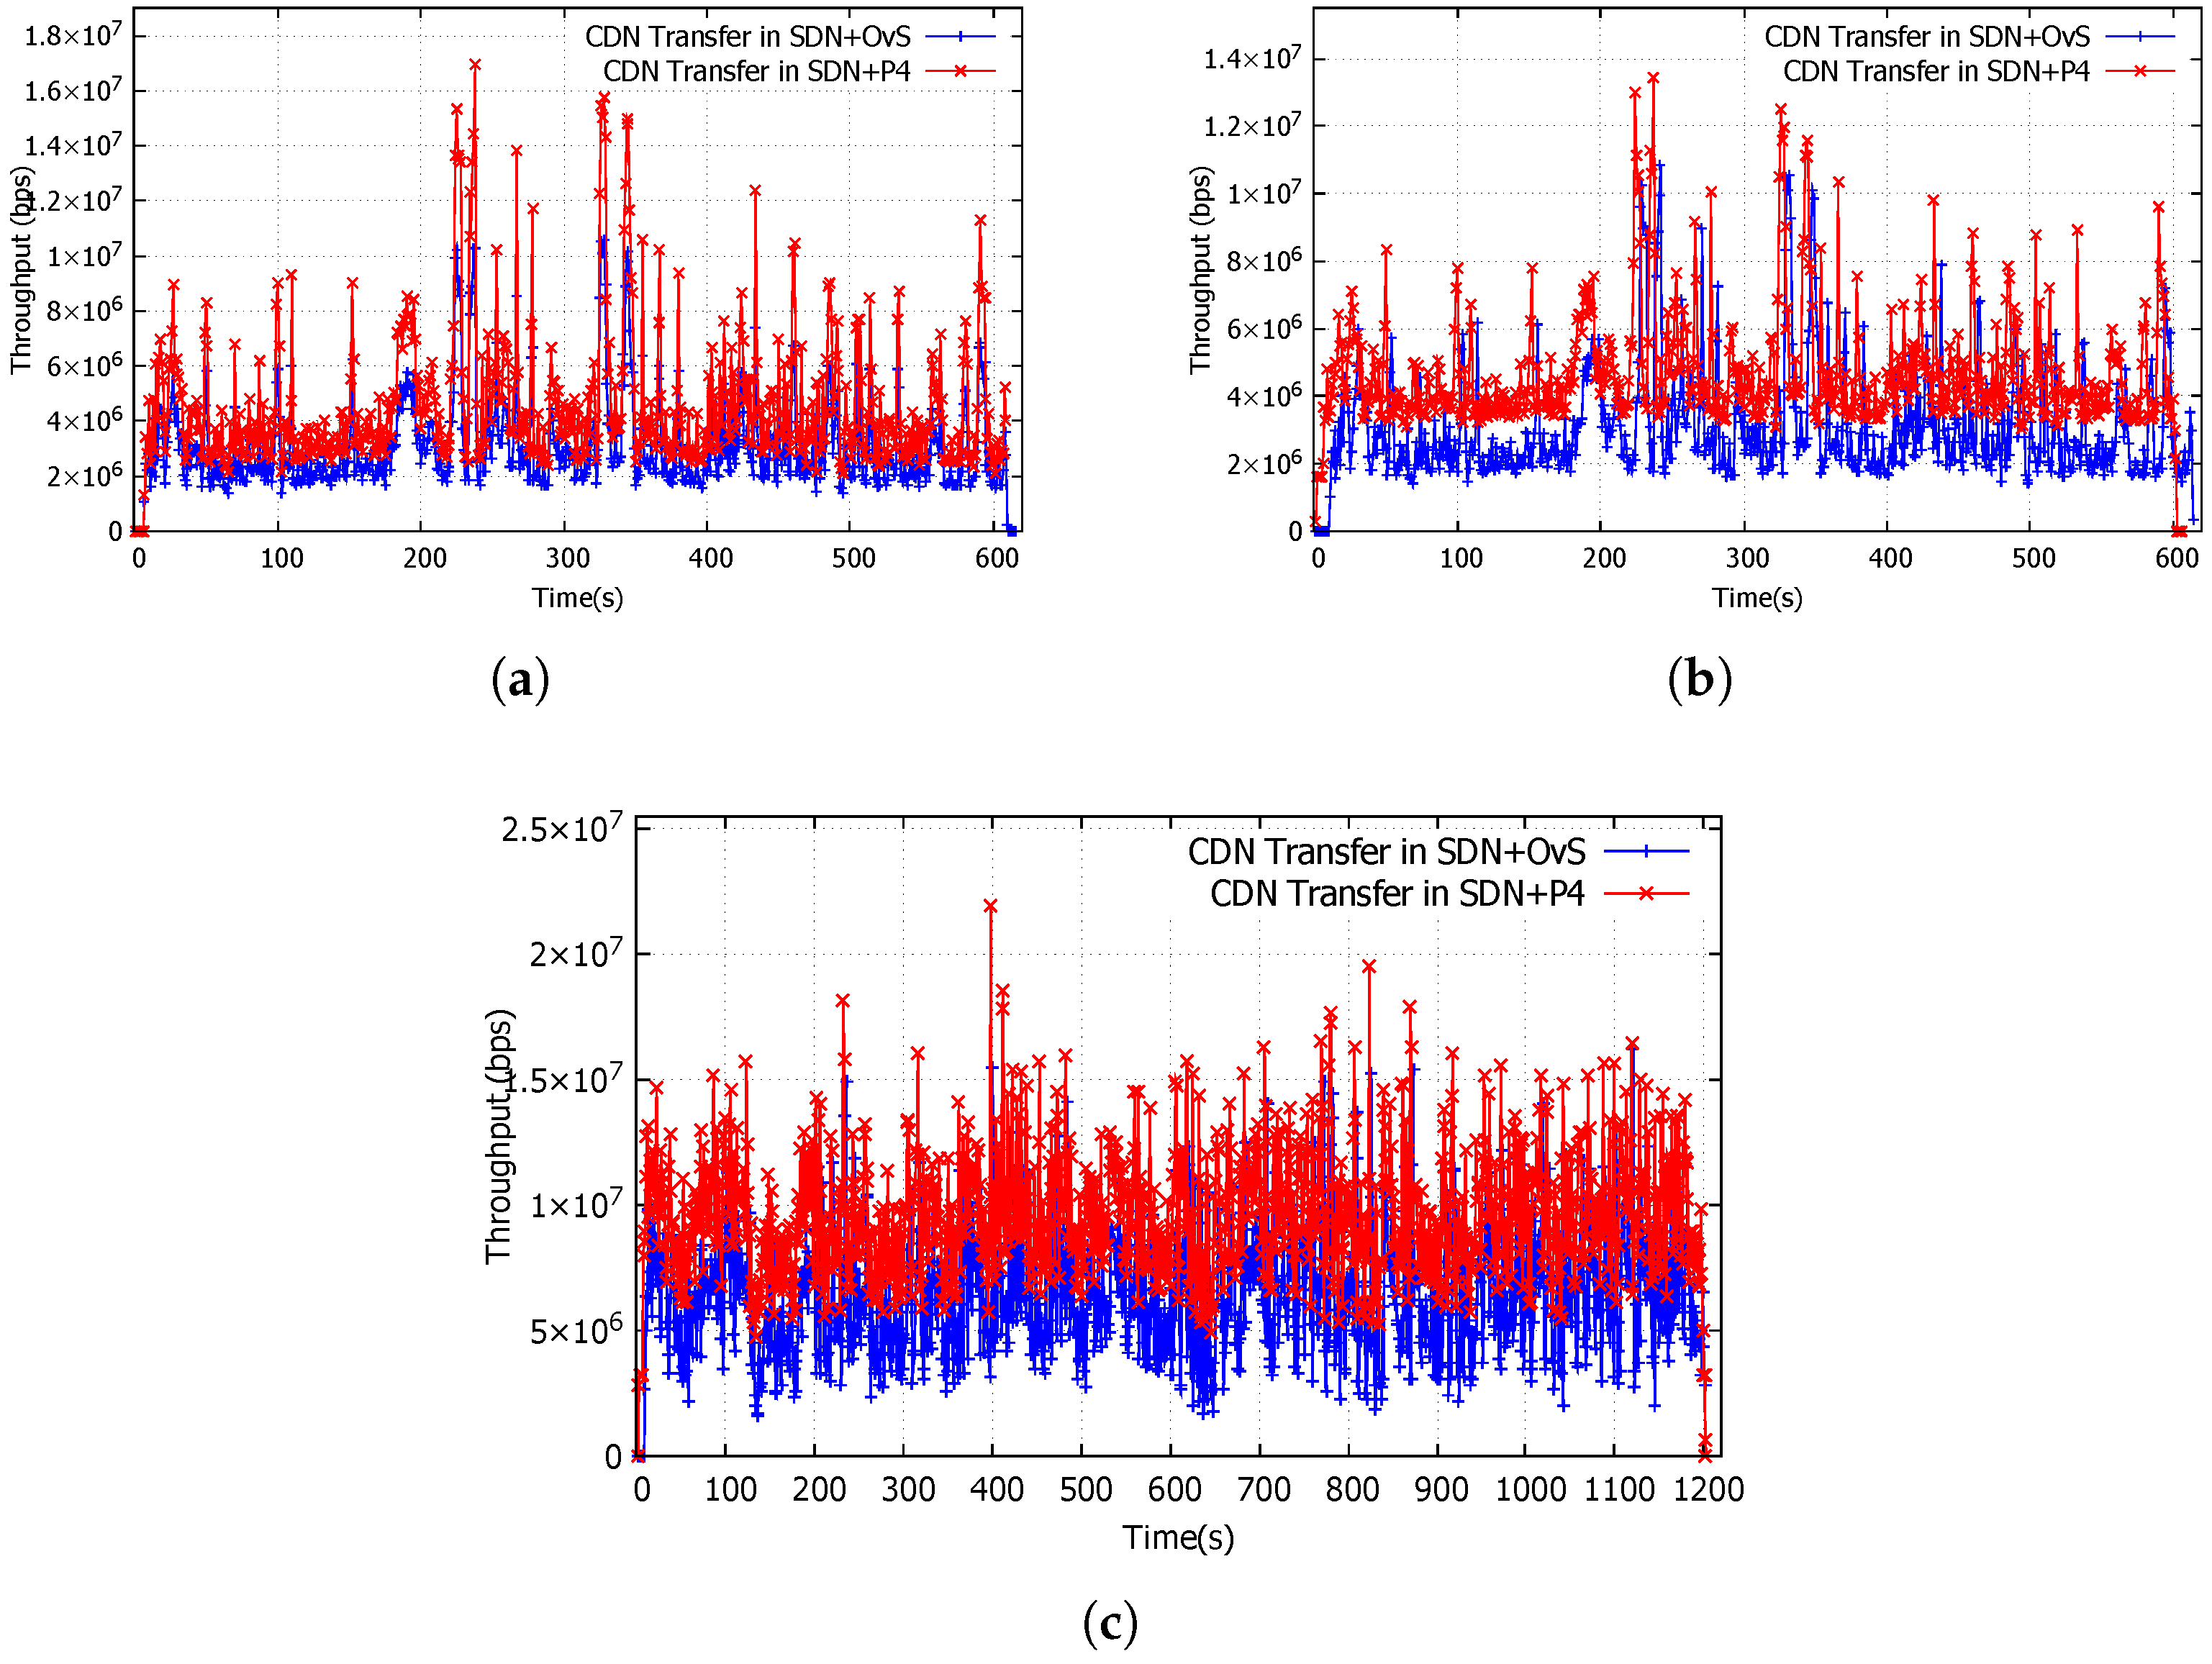
In this case study, we used a VLC-player for our experiments due to its ability to program video streaming via a Python script and to collect data for video traffic and its lightweight deployment. Figure 8 presents the captured data of a video stream for all three topologies.
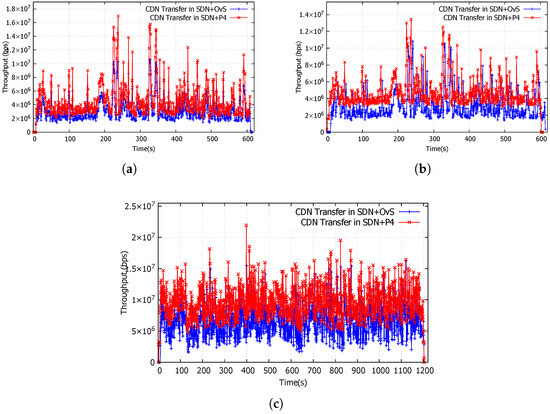
Figure 8.
Throughput of video content transfer in case study 4. (a) Live video stream in multi-path topology for 600 s. (b) Live video stream in grid topology for 600 s. (c) Live video stream in the Internet topology for 1200 s.
Figure 8a–c show that for each of the three topologies, the video for SDN+P4 had a higher throughput than with SDN+OvS. Table 4 shows further that, throughput has improved by 60% in the multi-path topology, 77% in the grid topology and 60% in the Internet topology for SDN+P4 in comparison to SDN+OvS. The high throughput achieved with SDN+P4, resulted in an increased amount of data being transferred between hosts. As shown in Table 4, the amount of data transmitted improved by 46% in the multi-path topology, 50% in the grid topology and 43% in the Internet topology for SDN+P4 in comparison to SDN+OvS. A notable delay in initiating the video stream can be observed in Figure 8a–c for SDN+OvS (blue line). This again is due to the delay caused in route discovery, resulting in a delayed start for the video with later termination for SDN+OvS. This can be seen by observing the averaged buffering delay illustrated in Table 4. Buffering delay in SDN+P4 has been reduced by 69%, 84% and 83% for topologies I, II and III respectively in comparison to SDN+OvS. Figure 9a–c present the observed jitter during the CDN transmission. Equation (1) was used once again to calculate the averaged values for the jitter. As shown in Table 4, jitter in SDN+P4 has been reduced by 35%, 41% and 23% respectively in comparison to SDN+OvS for all three topologies. In our experiments, multi-path and grid topologies streamed a video for 600s, whilst the Internet topology streamed a video for 1200 s. Although the streaming times are different, the performance gain remained constant across all three topologies.
Table 4.
Network performance for case study 4—CDN traffic.
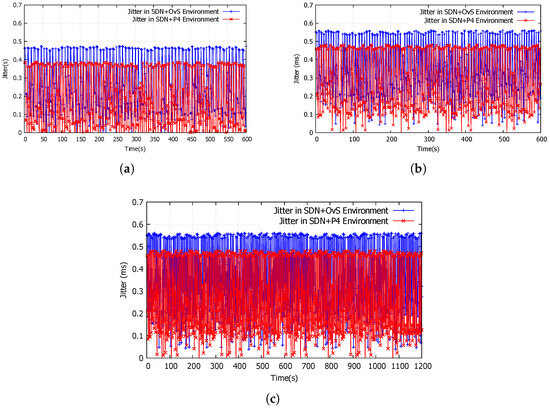
Figure 9.
Jitter of CDN data transmission in case study 4. (a) Jitter experienced in CDN Transmission in multi-path topology. (b) Jitter experienced in CDN Transmission in grid topology. (c) Jitter experienced in CDN Transmission in the Internet topology.
6. Results and Analysis of Tier 2—Multiple Types of Traffic Running Simultaneously
Having investigated the performance of single types of traffic running over different network topologies for SDN+P4 and SDN+OvS, we now study the performance of mixed types of traffic running simultaneously over grid topology and the Internet topology.
6.1. Case Study 5—Mixed Type of Traffic over Grid Topology
Five types of traffic from Table 1, ICMP, VoIP, TCP, UDP and CDN, were run simultaneously. The performance of each type of traffic is presented in Table 5. Table 5 (ICMP traffic) reports an improvement of 6.7% in throughput for SDN+P4 in comparison to the throughput achieved by SDN+OvS. Table 5 (TCP traffic) records an improvement of 12% in throughput from 1.05 × bps for SDN+OvS to 1.18 × bps for SDN+P4. These are represented in Figure 10a,b by the blue line. Packet loss, packet delay, synchronisation delay and total transmission time achieved significant reductions for SDN+P4 over SDN+OvS of 36%, 6%, 77% and 18% respectively.
Table 5.
Network Performance of for case study 5.

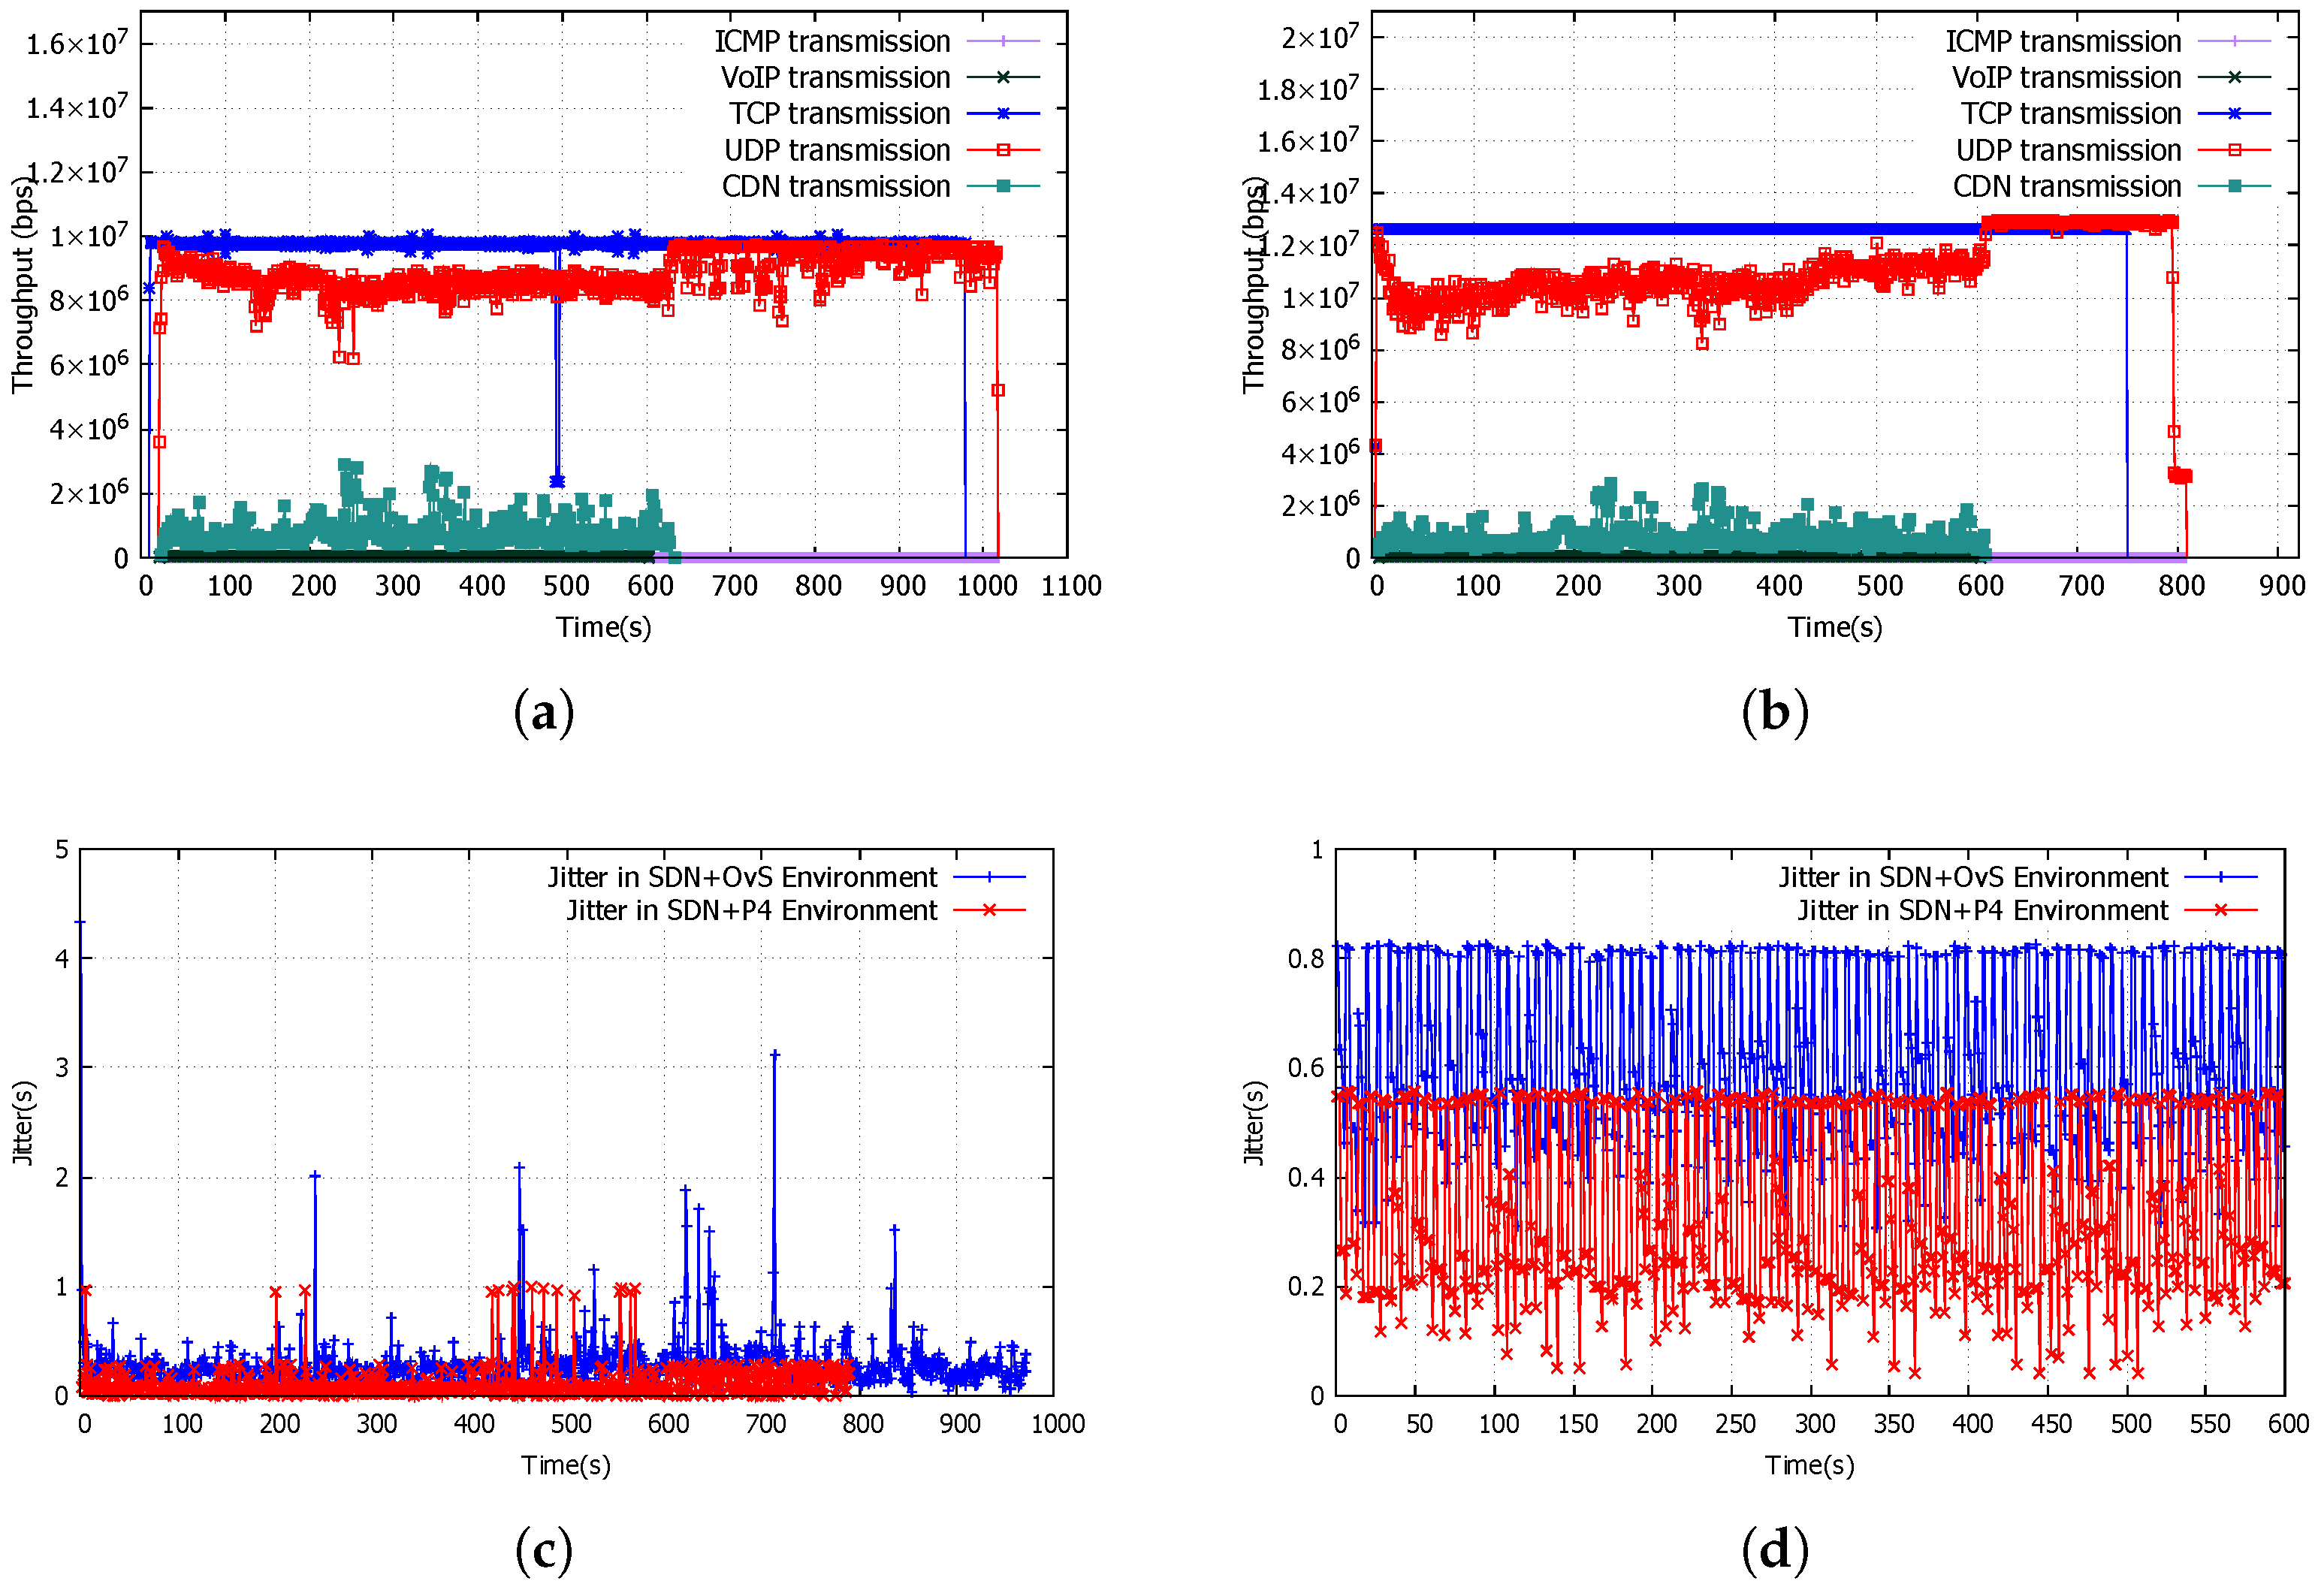
Figure 10.
Data for mixed traffic over the simple-grid topology—case study 5. (a) Throughput for mixed traffic for SDN+OvS. (b) Throughput for mixed traffic for SDN+P4. (c) Jitter in UDP Transmission for mixed traffic. (d) Jitter in CDN Transmission for mixed traffic.
Table 5 (UDP traffic) reports an increase in UDP throughput of 43% (from 7 × 10⁶ bps for SDN+OvS to 1.0 × 10⁷ bps for SDN+P4) as illustrated in Figure 10a,b by the red line. It was also observed that SDN+P4 completed the download of 1 GB of UDP traffic in 800 s in contrast to SDN+OvS which took 1020 s. Packet loss, delay, and jitter were each observed to have reduced values for SDN+P4 in comparison to those obtained using SDN+OvS, these being 73%, 78% and 48% respectively. The reduction in jitter for UDP packets is shown in Figure 10c.
Table 5 (CDN traffic) records an increase of 5% in throughput from 3.8 × bps for SDN+OvS to 4 × bps for SDN+P4. This is illustrated by the green line in Figure 10a,b. Higher throughput resulted in SDN+P4 transferring more data (817.54 MB) in comparison to SDN+OvS (588.41 MB), an improvement of 38% for the same video file. Buffer delay and jitter in SDN+P4 resulted in significant reductions of 38% and 5% respectively, in contrast to SDN+OvS. The reduction in jitter is shown in Figure 10d.
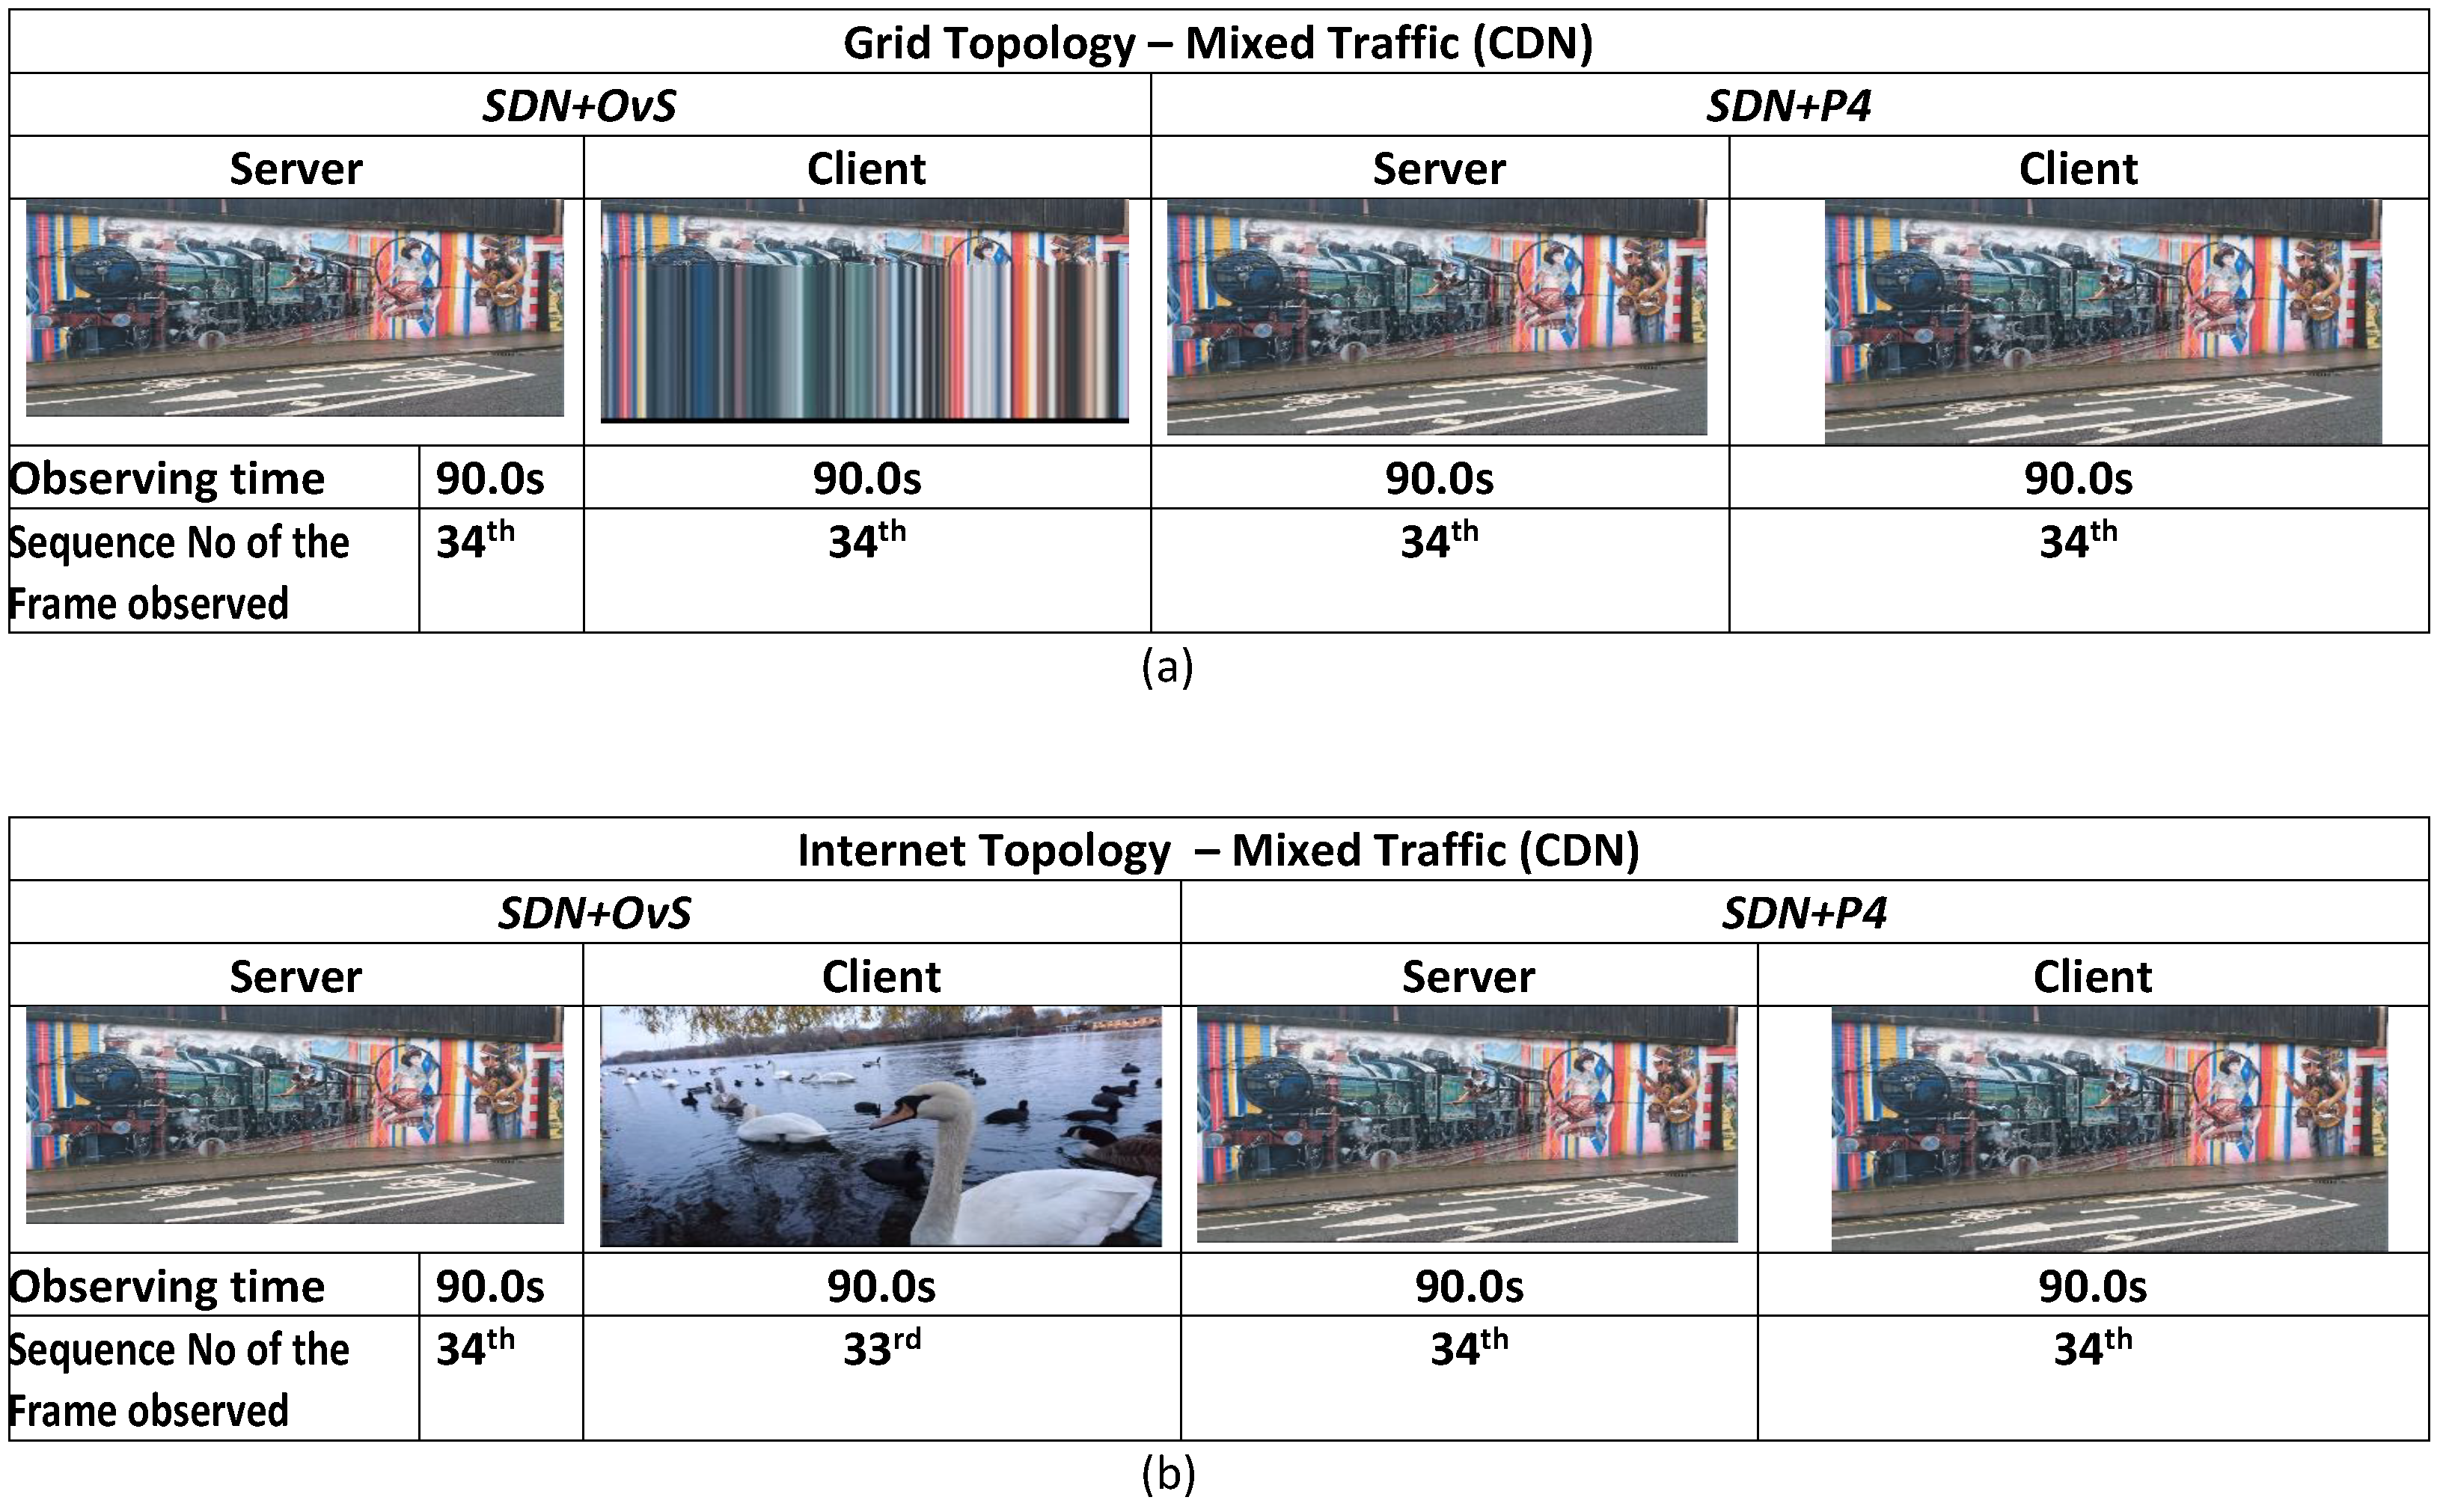
The difference in throughput has an effect on the quality of the video. Figure 11a shows a comparison for the 34th frame captured during the experiments for both SDN+OvS and SDN+P4. The same frame was sent from the server side, with the client side in SDN+OvS displaying a distorted frame in comparison to that received by the client with SDN+P4.

Figure 11.
Comparison of CDN frames for both SDN+OvS and SDN+P4 for case studies 5 and 6. (a) Grid topology at 90s (b) Internet topology at 90s.
6.2. Case Study 6—Simultaneous Run over the Internet Topology
Table 6 presents the data collected during this case study. In Table 6, the ICMP throughput shows an improvement of 6.7% for SDN+P4 in comparison to SDN+OvS.
Table 6.
Network performance for case study 6.
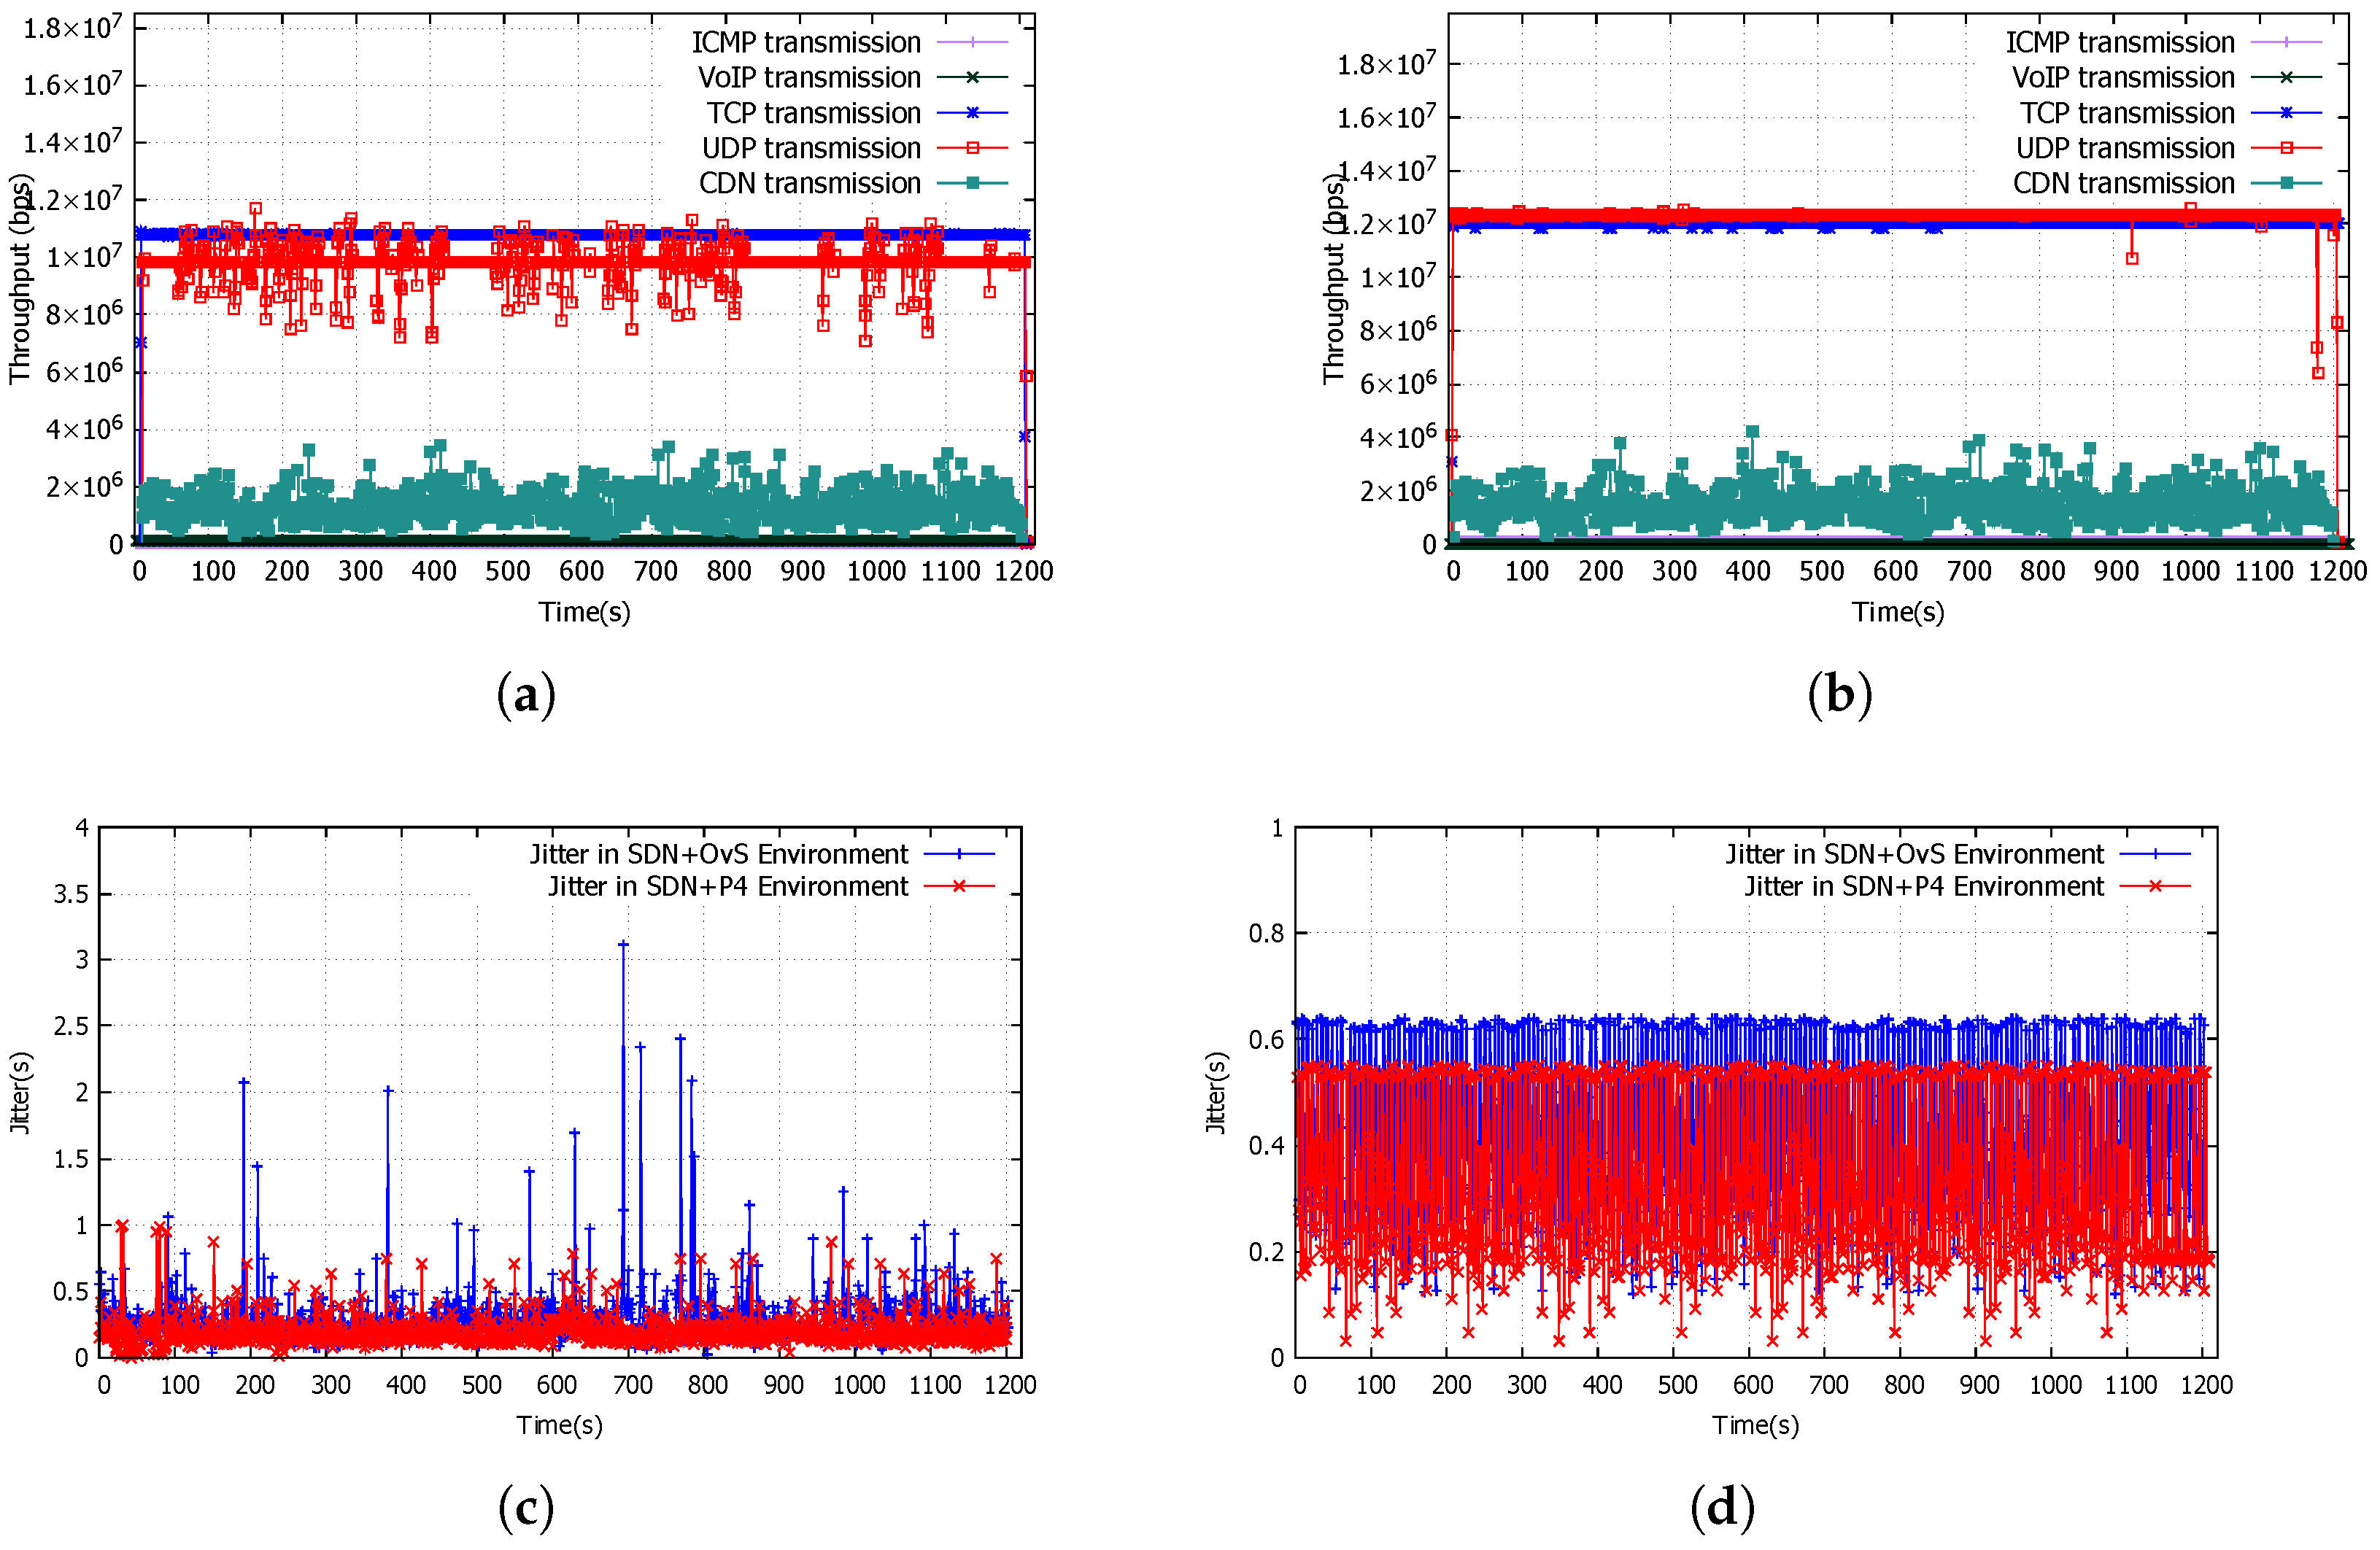
Table 6 (TCP traffic) records an increase in TCP throughput of 19% from 0.99 × bps for SDN+OvS to 1.18 × bps for SDN+P4. These are illustrated by the blue lines in Figure 12a,b. Packet loss, packet delay and synchronisation delay for SDN+P4 reflect significant reductions in comparison to that achieved using SDN+OvS of 75%, 65% and 45% respectively. The data transmitted achieved a 23% improvement from 0.82 GB for SDN+OvS to 1.01 GB with SDN+P4.

Figure 12.
Data of mixed traffic over the Internet topology—case study 6. (a) Mixed traffic throughput for SDN+OvS. (b) Mixed traffic throughput for SDN+P4. (c) Jitter experienced in UDP Transmission while simultaneous applications occupy the network space. (d) Jitter experienced in CDN Transmission while simultaneous applications occupy the network space.
Table 6 (UDP traffic) records an increase in UDP throughput of 33% from 9 × bps for SDN+OvS to 1.2 × bps for SDN+P4. These are illustrated by the red lines in Figure 12a,b. Packet loss, delay and jitter in SDN+P4 reflect significant reductions in comparison to that achieved using SDN+OvS of 69%, 58% and 31% respectively. A reduction in jitter for UDP packets is shown in Figure 12c. The higher speed, reduced delay, jitter and packet loss in SDN+P4 result in an increase in data transmission (1.602 GB) for SDN+P4 in comparison to (1.456 GB) for SDN+OvS.
Table 6 (CDN traffic) shows an increase in throughput of 44% from 0.97 × bps in SDN+OvS to 1.4 × bps in SDN+P4. This is illustrated by the green line in Figure 12a,b. Higher throughput resulted in SDN+P4 transferring more data (1451.3 MB) in comparison to SDN+OvS (1183.4 MB), an improvement of 23% for the same video file. Buffer delay and jitter in SDN+P4 resulted in significant reductions of 61% and 21% respectively, in comparison to SDN+OvS. The reduction in jitter is shown in Figure 12d.
The difference in throughput has directly affected the quality of the video. Figure 11b gives a comparison for the 34th frame captured during the experiments for both SDN+OvS and SDN+P4. The same frame was sent from the server side. At the client side, SDN+OvS displayed the previous frame (33rd) in comparison to that received by the client via SDN+P4 (34th).
7. Discussion
In the context of this research, we explored the performance of SDN with OvS (SDN+OvS) and SDN with P4 (SDN+P4). We have seen that SDN+P4 outperforms SDN+OvS for each of our case studies using different types of traffic and topologies.
We investigated the overhead created due to the slow path utilisation of OvS and the performance variation in comparison to a P4 target switch. With the evolution of the Internet and the increased number of connected devices, networks will face congestion. With more and more packets requiring processing using a controller, a network model that utilises a slow path approach such as OvS will potentially lead to an exponential growth in traffic congestion. During this research, we have saturated the links in our elected network (Section 5.1 and Section 5.2) to test how the network will cope with an increased load in traffic. Our results suggest that the network can maintain a gain in performance whilst links are saturated with traffic for the SDN+P4 environment in comparison to that experienced with SDN+OvS.
The evolution of 5G and beyond has led to the need to evaluate methods for reducing the delay at the core. Initialising programmability in the network has been shown to increase performance at the core. To the best of our knowledge, current literature does not evaluate the performance of the network when the control plane and data plane programmability (SDN+P4) is employed in comparison to the control plane (SDN+OvS) programmability.
We evaluated the performance of applications in Section 4 and Section 5, where SDN+P4 has been employed in contrast to SDN+OvS. For a time-sensitive application with minimal latency requirements, reducing the delay at the core can be essential. For example, for Vehicle-to-Vehicle (V2V) and Ultra Reliable Low Latency Communication (URLLC) applications. A solution, that processes packets in parallel as opposed to sequential processing in OvS, has been considered in this research and its effect on performance in applications. Our research has established that with the initialisation of SDN+P4 with parallel processing of packets, various applications have achieved an improvement in performance in comparison to applications run over SDN+OvS. We also evaluated the quality of applications that occurred due to faster processing achieved with SDN+P4 in comparison to SDN+OvS. The statistics such as increased bps and throughput, reduced delay jitter, packet loss, delay and buffering time have led to a higher quality of application at the receiver’s end. Improvement of the quality of the video at the receiver end for a video streaming application (Figure 11) has also been presented.
We investigated whether the type of traffic has a bearing on performance for SDN+P4 in comparison to SDN+OvS. Given that the majority of network traffic will be accumulated by multimedia applications in the future, a fair switching mechanism that enhances the performance of such applications will provide a beneficial resource for service providers. As the majority of the downloaded traffic in a modern context consists of UDP traffic (multimedia applications) and the demand for such applications is expected to grow exponentially in the future, the employment of SDN+P4 is a viable solution for service providers looking to provide an improved service. Protocols such as Google Quick UDP Internet Connections (GQUIC) in mobile telecommunication will also benefit from the employment of SDN+P4. The employment of SDN+P4 will also benefit non-media applications where a connection-less protocol is employed by a service provider. For example, communication between a Radio Device and eNB, Multi-access Edge Clouds (MEC) or between Radio Access Networks (RAN) and Fog nodes [60] each can benefit through the use of SDN+P4. To meet the requirements for faster convergence and faster processing of packets, SDN+P4 will, we believe, serve as an inventive and improved solution.
8. Conclusions
The above study has answered the research questions given at the beginning of this paper. We conclude that the application of SDN+P4 has enabled networks to improve their performance for different topologies and types of traffic. The results from our experiments show an improvement for, for example, delay and packet loss, which have reduced significantly with SDN+P4, whilst throughput has increased for all case studies. SDN+P4 has improved performance in the networks through the use of parallel processing in P4, which has complemented the standardised SDN architecture. The results for all case studies indicate that SDN+P4 is a promising alternative to SDN+OvS, providing a resilient approach for future networking.
Through a combination of SDN and P4 (control plane programmability with data plane programmability), we have established that it is possible to provide an improved service to clients using SDN+P4 rather than with SDN+OvS. Across all case studies, parallel processing in P4 has provided an increase in available queues for processing traffic with the utilisation of a flexible parser. With the evolution of the internet and the heterogeneity of the applications being used, SDN+P4 will, we believe, provide an improved service to all use cases for 5G and beyond. Based on the results collated from this study, we implemented an SDN+P4 environment in our 5G testbed paper [76]. The programmable switch was developed using P4, incorporating parsers, match-action pipelines, and control logic capable of processing Ethernet and IPv4 headers, which we deployed on an Intel 10GbE x520 NIC, enabling high-throughput and low-latency packet forwarding, with data plane programmability. A Software Defined Radio USRP x310 [77] was integrated in the testbed to provide radio access, with the host system configured to manage flow rules and policies, facilitating control plane programmability. Future research in this area will involve the application of machine learning algorithms on the SDN+P4 platform for intrusion detection.
Author Contributions
Conceptualisation, O.A.F., H.X. and J.S.; methodology, O.A.F., H.X. and J.S.; software, O.A.F.; validation, O.A.F., H.X. and J.S.; formal analysis, O.A.F., H.X. and J.S.; investigation, O.A.F., H.X. and J.S.; resources, O.A.F., H.X. and J.S.; data curation, O.A.F., H.X. and J.S.; writing—original draft preparation, O.A.F., H.X. and J.S.; writing—review and editing, H.X., J.S. and X.C.; visualisation, O.A.F., H.X. and J.S.; supervision, H.X., J.S. and X.C.; project administration, O.A.F., H.X. and J.S. All authors have read and agreed to the published version of the manuscript.
Funding
This research received no external funding.
Data Availability Statement
The original contributions presented in this study are included in the article.
Conflicts of Interest
The authors declare no conflicts of interest.
References
- Kirkpatrick, K. Software-defined networking. Commun. ACM 2013, 56, 16–19. [Google Scholar] [CrossRef]
- Kreutz, D.; Ramos, F.M.; Verissimo, P.E.; Rothenberg, C.E.; Azodolmolky, S.; Uhlig, S. Software-defined networking: A comprehensive survey. Proc. IEEE 2014, 103, 14–76. [Google Scholar] [CrossRef]
- McKeown, N.; Anderson, T.; Balakrishnan, H.; Parulkar, G.; Peterson, L.; Rexford, J.; Shenker, S.; Turner, J. OpenFlow: Enabling innovation in campus networks. ACM SIGCOMM Comput. Commun. Rev. 2008, 38, 69–74. [Google Scholar] [CrossRef]
- Nygren, A.; Pfaff, B.; Lantz, B.; Heller, B.; Barker, C.; Beckmann, C.; Cohn, D.; Malek, D.; Talayco, D.; Erickson, D.; et al. OpenFlow Switch Specification Version 1.5.1. Open Networking Foundation, Tech. Rep. 2015. Available online: https://opennetworking.org/wp-content/uploads/2014/10/openflow-switch-v1.5.1.pdf (accessed on 31 May 2025).
- Isolani, P.H.; Wickboldt, J.A.; Both, C.B.; Rochol, J.; Granville, L.Z. Interactive monitoring, visualization, and configuration of OpenFlow-based SDN. In Proceedings of the 2015 IFIP/IEEE International Symposium on Integrated Network Management (IM), Ottawa, ON, Canada, 11–15 May 2015; pp. 207–215. [Google Scholar]
- Bosshart, P.; Daly, D.; Gibb, G.; Izzard, M.; McKeown, N.; Rexford, J.; Schlesinger, C.; Talayco, D.; Vahdat, A.; Varghese, G.; et al. P4: Programming protocol-independent packet processors. ACM SIGCOMM Comput. Commun. Rev. 2014, 44, 87–95. [Google Scholar] [CrossRef]
- Sivaraman, A.; Kim, C.; Krishnamoorthy, R.; Dixit, A.; Budiu, M.D. p4: Programming the forwarding plane of a data-center switch. In Proceedings of the 1st ACM SIGCOMM Symposium on Software Defined Networking Research, Santa Clara, CA, USA, 17–18 June 2015; pp. 1–8. [Google Scholar]
- Index, C.V.N. Forecast and Methodology, 2016–2021; White Paper, June; Cisco: San Jose, CA, USA, 2017. [Google Scholar]
- Cisco, V. The Zettabyte Era: Trends And Analysis; Updated (07/06/2017); Cisco: San Jose, CA, USA, 2017. [Google Scholar]
- Ericsson. Mobile Data Traffic Forecast–Ericsson Mobility Report. 2024. Available online: https://www.ericsson.com/en/reports-and-papers/mobility-report/dataforecasts/mobile-traffic-forecast (accessed on 31 May 2025).
- Sugeng, W.; Istiyanto, J.E.; Mustofa, K.; Ashari, A. The impact of QoS changes towards network performance. Int. J. Comput. Netw. Commun. Secur. 2015, 3, 48–53. [Google Scholar]
- Monserrat, J.F.; Mange, G.; Braun, V.; Tullberg, H.; Zimmermann, G.; Bulakci, Ö. METIS research advances towards the 5G mobile and wireless system definition. EURASIP J. Wirel. Commun. Netw. 2015, 2015, 53. [Google Scholar] [CrossRef]
- Boteanu, V.; Bagheri, H.; Pels, M. Minimizing ARP Traffic in the AMS-IX Switching Platform Using OpenFlow; University of Amsterdam: Amsterdam, The Netherlands, 2013; p. 7. [Google Scholar]
- Mahmood, A.; Yuksel, M. Resource Sharing on the Internet: A Comprehensive Survey on ISP Peering. ACM Comput. Surv. 2025, 57, 1–37. [Google Scholar] [CrossRef]
- Open vSwitch. Open vSwitch: Production Quality, Multilayer Open Virtual Switch. Open vSwitch Project, Tech. Rep. 2023. Available online: https://www.openvswitch.org/ (accessed on 31 May 2025).
- Cerović, D.; Del Piccolo, V.; Amamou, A.; Haddadou, K.; Pujolle, G. Fast packet processing: A survey. IEEE Commun. Surv. Tutor. 2018, 20, 3645–3676. [Google Scholar] [CrossRef]
- Hauser, F.; Häberle, M.; Merling, D.; Lindner, S.; Gurevich, V.; Zeiger, F.; Frank, R.; Menth, M. A survey on data plane programming with p4: Fundamentals, advances, and applied research. J. Netw. Comput. Appl. 2023, 212, 103561. [Google Scholar] [CrossRef]
- Sharma, N.K.; Kaufmann, A.; Anderson, T.; Krishnamurthy, A.; Nelson, J.; Peter, S. Evaluating the power of flexible packet processing for network resource allocation. In Proceedings of the 14th {USENIX} Symposium on Networked Systems Design and Implementation ({NSDI} 17), Boston, MA, USA, 27–29 March 2017; pp. 67–82. [Google Scholar]
- Da Silva, J.S.; Boyer, F.R.; Chiquette, L.O.; Langlois, J.P. Extern objects in P4: An ROHC header compression scheme case study. In Proceedings of the 2018 4th IEEE Conference on Network Softwarization and Workshops (NetSoft), Montreal, QC, Canada, 25–29 June 2018; pp. 517–522. [Google Scholar]
- Wang, H.; Soulé, R.; Dang, H.T.; Lee, K.S.; Shrivastav, V.; Foster, N.; Weatherspoon, H. P4fpga: A rapid prototyping framework for p4. In Proceedings of the Symposium on SDN Research, Santa Clara, CA, USA, 3–4 April 2017; pp. 122–135. [Google Scholar]
- Chen, X.; Zhang, D.; Wang, X.; Zhu, K.; Zhou, H. P4sc: Towards high-performance service function chain implementation on the p4-capable device. In Proceedings of the 2019 IFIP/IEEE Symposium on Integrated Network and Service Management (IM), Arlington, VA, USA, 8–12 April 2019; pp. 1–9. [Google Scholar]
- Shahbaz, M.; Choi, S.; Pfaff, B.; Kim, C.; Feamster, N.; McKeown, N.; Rexford, J. Pisces: A programmable, protocol-independent software switch. In Proceedings of the 2016 ACM SIGCOMM Conference, Florianópolis, Brazil, 22–26 August 2016; pp. 525–538. [Google Scholar]
- Patra, P.G.K.; Cesen, F.E.R.; Mejia, J.S.; Feferman, D.L.; Csikor, L.; Rothenberg, C.E.; Pongracz, G. Toward a Sweet Spot of Data Plane Programmability, Portability, and Performance: On the Scalability of Multi-Architecture P4 Pipelines. IEEE J. Sel. Areas Commun. 2018, 36, 2603–2611. [Google Scholar] [CrossRef]
- Saqib, M.; Elbiaze, H.; Glitho, R.; Ghamri-Doudane, Y. An Intelligent & Programmable Data Plane for QoS-Aware Packet Processing. IEEE Trans. Mach. Learn. Commun. Netw. 2024, 2, 1540–1557. [Google Scholar]
- Wang, S.Y.; Lin, T.C. Design, Implementation, and Performance Evaluation of a High-Performance and High-Precision NetFlow/IPFIX Flow-Monitoring System on a P4 Hardware Switch. SSRN Electron. J. 2025. Available online: https://papers.ssrn.com/sol3/papers.cfm?abstract_id=5170479 (accessed on 31 May 2025).
- Hill, J.; Aloserij, M.; Grosso, P. Tracking network flows with P4. In Proceedings of the 2018 IEEE/ACM Innovating the Network for Data-Intensive Science (INDIS), Dallas, TX, USA, 10–13 November 2018; pp. 23–32. [Google Scholar]
- Rizzi, C.; Yao, Z.; Desmouceaux, Y.; Townsley, M.; Clausen, T. Charon: Load-aware load-balancing in p4. In Proceedings of the 2021 17th International conference on network and service management (CNSM), Izmir, Turkey, 25–29 October 2021; pp. 91–97. [Google Scholar]
- Ke, C.H.; Hsu, S.J. Load balancing using P4 in software-defined networks. J. Internet Technol. 2020, 21, 1671–1679. [Google Scholar]
- Fares, O.; Dandoush, A.; Aitsaadi, N. Sdn-based platform enabling intelligent routing within transit autonomous system networks. In Proceedings of the 2022 IEEE 19th Annual Consumer Communications & Networking Conference (CCNC), Las Vegas, NV, USA, 8–11 January 2022; pp. 909–912. [Google Scholar]
- Bagci, K.T.; Tekalp, A.M. SDN-enabled distributed open exchange: Dynamic QoS-path optimization in multi-operator services. Comput. Netw. 2019, 162, 106845. [Google Scholar] [CrossRef]
- Calvert, K.L.; Doar, M.B.; Zegura, E.W. Modeling internet topology. IEEE Commun. Mag. 1997, 35, 160–163. [Google Scholar] [CrossRef]
- Kotronis, V.; Gämperli, A.; Dimitropoulos, X. Routing centralization across domains via SDN: A model and emulation framework for BGP evolution. Comput. Netw. 2015, 92, 227–239. [Google Scholar] [CrossRef]
- Kotronis, V.; Klöti, R.; Rost, M.; Georgopoulos, P.; Ager, B.; Schmid, S.; Dimitropoulos, X. Stitching inter-domain paths over IXPs. In Proceedings of the Symposium on SDN Research, Santa Clara, CA, USA, 14–15 March 2016; pp. 1–12. [Google Scholar]
- Heller, B.; Sherwood, R.; McKeown, N. The controller placement problem. ACM SIGCOMM Comput. Commun. Rev. 2012, 42, 473–478. [Google Scholar] [CrossRef]
- Fonseca, P.; Bennesby, R.; Mota, E.; Passito, A. A replication component for resilient OpenFlow-based networking. In Proceedings of the 2012 IEEE Network Operations and Management Symposium, Maui, HI, USA, 16–20 April 2012; pp. 933–939. [Google Scholar]
- Hock, D.; Hartmann, M.; Gebert, S.; Jarschel, M.; Zinner, T.; Tran-Gia, P. Pareto-optimal resilient controller placement in SDN-based core networks. In Proceedings of the 2013 25th International Teletraffic Congress (ITC), Shanghai, China, 10–12 September 2013; pp. 1–9. [Google Scholar]
- Machado, C.C.; Granville, L.Z.; Schaeffer-Filho, A. ANSwer: Combining NFV and SDN features for network resilience strategies. In Proceedings of the 2016 IEEE Symposium on Computers and Communication (ISCC), Messina, Italy, 27–30 June 2016; pp. 391–396. [Google Scholar]
- Zhang, X.; Wei, K.; Guo, L.; Hou, W.; Wu, J. SDN-based resilience solutions for smart grids. In Proceedings of the 2016 International Conference on Software Networking (ICSN), Jeju Island, Republic of Korea, 23–26 May 2016; pp. 1–5. [Google Scholar]
- Smith, P.; Schaeffer-Filho, A.; Hutchison, D.; Mauthe, A. Management patterns: SDN-enabled network resilience management. In Proceedings of the 2014 IEEE Network Operations and Management Symposium (NOMS), Krakow, Poland, 5–9 May 2014; pp. 1–9. [Google Scholar]
- Fernando, O.; Xiao, H.; Che, X. Evaluation of Underlying Switching Mechanism for Future Networks with P4 and SDN (Workshop Paper). In Proceedings of the International Conference on Collaborative Computing: Networking, Applications and Worksharing; Springer: Berlin/Heidelberg, Germany, 2019; pp. 549–568. [Google Scholar]
- Sanvito, D.; Moro, D.; Gulli, M.; Filippini, I.; Capone, A.; Campanella, A. ONOS Intent Monitor and Reroute service: Enabling plug&play routing logic. In Proceedings of the 2018 4th IEEE Conference on Network Softwarization and Workshops (NetSoft), Montreal, QC, Canada, 25–29 June 2018; pp. 272–276. [Google Scholar]
- Mininet Team. Mininet: An Instant Virtual Network on your Laptop (or other PC). Mininet Project, Tech. Rep. 2024. Available online: https://mininet.org/ (accessed on 31 May 2025).
- ONOS Project. ONOS: Open Network Operating System. Open Networking Foundation, Tech. Rep. 2024. Available online: https://opennetworking.org/onos/ (accessed on 31 May 2025).
- Ruchel, L.V.; Turchetti, R.C.; de Camargo, E.T. Evaluation of the robustness of SDN controllers ONOS and ODL. Comput. Netw. 2022, 219, 109403. [Google Scholar] [CrossRef]
- Mamushiane, L.; Shozi, T. A QoS-based evaluation of SDN controllers: ONOS and OpenDayLight. In Proceedings of the 2021 IST-Africa Conference (IST-Africa), Virtual, 10–14 May 2021; pp. 1–10. [Google Scholar]
- P4 Language Consortium; Bosshart, P.; Daly, D.; Gibb, G.; Izzard, M.; McKeown, N.; Rexford, J.; Schlesinger, C.; Talayco, D.; Vahdat, A.; et al. P4 Behavioral Model (BMv2). P4.org, Tech. Rep. 2018. Available online: https://github.com/p4lang/behavioral-model (accessed on 10 June 2025).
- Alizadeh, M.; Edsall, T. On the data path performance of leaf-spine datacenter fabrics. In Proceedings of the 2013 IEEE 21st Annual Symposium on High-Performance Interconnects, San Jose, CA, USA, 21–23 August 2013; pp. 71–74. [Google Scholar]
- Al-Rubaye, S.; Kadhum, E.; Ni, Q.; Anpalagan, A. Industrial internet of things driven by SDN platform for smart grid resiliency. IEEE Internet Things J. 2017, 6, 267–277. [Google Scholar] [CrossRef]
- Josbert, N.N.; Ping, W.; Wei, M.; Li, Y. Industrial networks driven by SDN technology for dynamic fast resilience. Information 2021, 12, 420. [Google Scholar] [CrossRef]
- Zegura, E.W.; Calvert, K.L.; Donahoo, M.J. A quantitative comparison of graph-based models for Internet topology. IEEE/ACM Trans. Netw. 1997, 5, 770–783. [Google Scholar] [CrossRef]
- Pastor-Satorras, R.; Vespignani, A. Evolution and Structure of the Internet: A Statistical Physics Approach; Cambridge University Press: Cambridge, UK, 2007. [Google Scholar]
- Khandaker, F.; Oteafy, S.; Hassanein, H.S.; Farahat, H. A functional taxonomy of caching schemes: Towards guided designs in information-centric networks. Comput. Netw. 2019, 165, 106937. [Google Scholar] [CrossRef]
- Yang, B.; Chai, W.K.; Xu, Z.; Katsaros, K.V.; Pavlou, G. Cost-efficient NFV-enabled mobile edge-cloud for low latency mobile applications. IEEE Trans. Netw. Serv. Manag. 2018, 15, 475–488. [Google Scholar] [CrossRef]
- Matos, F.; Matos, A.; Simoes, P.; Monteiro, E. Provisioning of Inter-Domain QoS-Aware Services. J. Comput. Sci. Technol. 2015, 30, 404–420. [Google Scholar] [CrossRef]
- Fernandes, S. Methods and Techniques for Measurements in the Internet. In Performance Evaluation for Network Services, Systems and Protocols; Springer: Cham, Switzerland, 2017; pp. 45–73. [Google Scholar]
- Chen, G.; Fan, Z.; Li, X. Modelling the complex Internet topology. In Complex Dynamics in Communication Networks; Springer: Berlin/Heidelberg, Germany, 2005; pp. 213–234. [Google Scholar]
- Postel, J. Transmission Control Protocol; Internet Engineering Task Force (IETF): Fremont, CA, USA, 1981. [Google Scholar]
- Postel, J. RFC0768: User Datagram Protocol; USC/Information Sciences Institute: Marina del Rey, CA, USA, 1980. [Google Scholar]
- Yildirim, E.; Suslu, I.H.; Kosar, T. Which network measurement tool is right for you? a multidimensional comparison study. In Proceedings of the 2008 9th IEEE/ACM International Conference on Grid Computing, Tsukuba, Japan, 29 September–1 October 2008; pp. 266–275. [Google Scholar]
- Balevi, E.; Gitlin, R.D. Unsupervised machine learning in 5G networks for low latency communications. In Proceedings of the 2017 IEEE 36th International Performance Computing and Communications Conference (IPCCC), San Diego, CA, USA, 10–12 December 2017; pp. 1–2. [Google Scholar]
- Enea. TCP vs. UDP: The Fight for Space on a Shared Network. Enea Insights. 2024. Available online: https://www.enea.com/insights/tcp-vs-udp-the-fight-for-space-on-a-shared-network/ (accessed on 31 May 2025).
- Saroiu, S.; Gummadi, K.P.; Dunn, R.J.; Gribble, S.D.; Levy, H.M. An analysis of internet content delivery systems. ACM SIGOPS Oper. Syst. Rev. 2002, 36, 315–327. [Google Scholar] [CrossRef]
- AppLogic Networks. AppLogic Networks Unveils 2025 Global Internet Phenomena Report: Key Insights into Internet Traffic Trends. Business Wire. 2025. Available online: https://www.businesswire.com/news/home/20250303445046/en/AppLogic-Networks-Unveils-2025-Global-Internet-Phenomena-Report-Key-Insights-into-Internet-Traffic-Trends (accessed on 31 May 2025).
- Gueant, V. iPerf—The Ultimate Speed Test Tool for TCP, UDP and SCTPTest the Limits of Your Network + Internet Neutrality Test. Available online: https://iperf.fr/ (accessed on 31 May 2025).
- VideoLAN. VLC Media Player for Ubuntu. VideoLAN Organization. 2025. Available online: https://www.videolan.org/vlc/download-ubuntu.html (accessed on 31 May 2025).
- Rahman, M.; Yaakob, N.; Amir, A.; Ahmad, R.; Yoon, S.; Abd Halim, A. Performance analysis of congestion control mechanism in software defined network (SDN). In Proceedings of the MATEC Web of Conferences, Kuala Lumpur, Malaysia, 15–17 July 2017; EDP Sciences: Les Ulis, France, 2017; Volume 140, p. 1033. [Google Scholar]
- Bifulco, R.; Boite, J.; Bouet, M.; Schneider, F. Improving sdn with inspired switches. In Proceedings of the Symposium on SDN Research, Santa Clara, CA, USA, 14–15 March 2016; pp. 1–12. [Google Scholar]
- Aliyu, A.L.; Bull, P.; Abdallah, A. Performance implication and analysis of the OpenFlow SDN protocol. In Proceedings of the 2017 31st International Conference on Advanced Information Networking and Applications Workshops (WAINA), Taipei, Taiwan, 27–29 March 2017; pp. 391–396. [Google Scholar]
- Antichi, G.; Castro, I.; Chiesa, M.; Fernandes, E.L.; Lapeyrade, R.; Kopp, D.; Han, J.H.; Bruyere, M.; Dietzel, C.; Gusat, M.; et al. Endeavour: A scalable sdn architecture for real-world ixps. IEEE J. Sel. Areas Commun. 2017, 35, 2553–2562. [Google Scholar] [CrossRef]
- Giotsas, V.; Dietzel, C.; Smaragdakis, G.; Feldmann, A.; Berger, A.; Aben, E. Detecting peering infrastructure outages in the wild. In Proceedings of the Conference of the ACM Special Interest Group on Data Communication, Los Angeles, CA, USA, 21–25 August 2017; pp. 446–459. [Google Scholar]
- Sharma, S.; Staessens, D.; Colle, D.; Pickavet, M.; Demeester, P. Enabling fast failure recovery in OpenFlow networks. In Proceedings of the 2011 8th International Workshop on the Design of Reliable Communication Networks (DRCN), Krakow, Poland, 10–12 October 2011; pp. 164–171. [Google Scholar]
- Awobuluyi, O. Periodic control update overheads in OpenFlow-based enterprise networks. In Proceedings of the 2014 IEEE 28th International Conference on Advanced Information Networking and Applications, Victoria, BC, Canada, 13–16 May 2014; pp. 390–396. [Google Scholar]
- Groma, M.; Boros, T.; Helebrandt, P. Scalable Cache-Based Address Resolution Protocol Handling in Software-Defined Networks. In Proceedings of the 2019 XXVII International Conference on Information, Communication and Automation Technologies (ICAT), Sarajevo, Bosnia and Herzegovina, 20–23 October 2019; pp. 1–6. [Google Scholar]
- Lai, Y.C.; Ali, A.; Hossain, M.S.; Lin, Y.D. Performance modeling and analysis of TCP and UDP flows over software defined networks. J. Netw. Comput. Appl. 2019, 130, 76–88. [Google Scholar] [CrossRef]
- Emma, D.; Loreto, S.; Pescapé, A.; Ventre, G. Measuring SCTP throughput and jitter over heterogeneous networks. In Proceedings of the 20th International Conference on Advanced Information Networking and Applications—Volume 1 (AINA’06), Vienna, Austria, 18–20 April 2006; Volume 2, p. 5. [Google Scholar]
- Fernando, O.A.; Xiao, H.; Spring, J. Developing a Testbed with P4 to Generate Datasets for the Analysis of 5G-MEC Security. In Proceedings of the 2022 IEEE Wireless Communications and Networking Conference (WCNC), Austin, TX, USA, 10–13 April 2022; pp. 2256–2261. [Google Scholar]
- Ettus Research. USRP X310 Software Defined Radio (SDR) Kit. National Instruments. 2025. Available online: https://www.ettus.com/all-products/x310-kit/ (accessed on 31 May 2025).


Disclaimer/Publisher’s Note: The statements, opinions and data contained in all publications are solely those of the individual author(s) and contributor(s) and not of MDPI and/or the editor(s). MDPI and/or the editor(s) disclaim responsibility for any injury to people or property resulting from any ideas, methods, instructions or products referred to in the content. |
© 2025 by the authors. Licensee MDPI, Basel, Switzerland. This article is an open access article distributed under the terms and conditions of the Creative Commons Attribution (CC BY) license (https://creativecommons.org/licenses/by/4.0/).