3.1. Oxidation of SW and HW Kraft Pulps
In this study, fully bleached softwood (SW) and hardwood (HW) pulps with chemical composition profiles, as reported in
Table 1, were oxidized under three different conditions using oxygen (O
2) oxidation methods. Initially, high consistency (20–28%), medium consistency (10–14%), and low consistency (3–5%) oxygen conditions were considered. However, due to the limitation of the operating apparatus, which could not operate at 20–28% consistency, low (4%), medium (10%), and high-end of medium consistency (14%) were utilized to oxidize pulps. The details of oxidation reaction conditions are reported in
Table 2.
The reactions of carbohydrates under oxygen delignification conditions have been reviewed by Sjöström [
14]. Generally, the reactions can be divided into two categories—those attacking glycosidic linked units and those attacking terminal reducing sugar units. The latter reaction can be both stabilizing and degrading [
15].
Reactions of the first type cause or initiate depolymerization, which can lead to a drop-in viscosity and weakening of the mechanical strength of fibres. It diminishes pulp yield during oxygen pulping and bleaching if not adequately controlled.
Reactions of the second type can cause modifications of sugar units from the reducing-end of polysaccharides, causing either alkali stabilization by acid end-units, which is important and characteristic for oxygen-alkali oxidation, or peeling, which results in low-molecular-weight acid.
Although both reactions are associated with carbohydrate degradation, the first type (random chain cleavage) is more significant since it has a greater impact on cellulose chain breakage leading to a lower average length of cellulose. In addition, transition metals such as iron, manganese, and copper, when found in small quantities in unbleached pulps, promote carbohydrate degradation.
Several studies [
14,
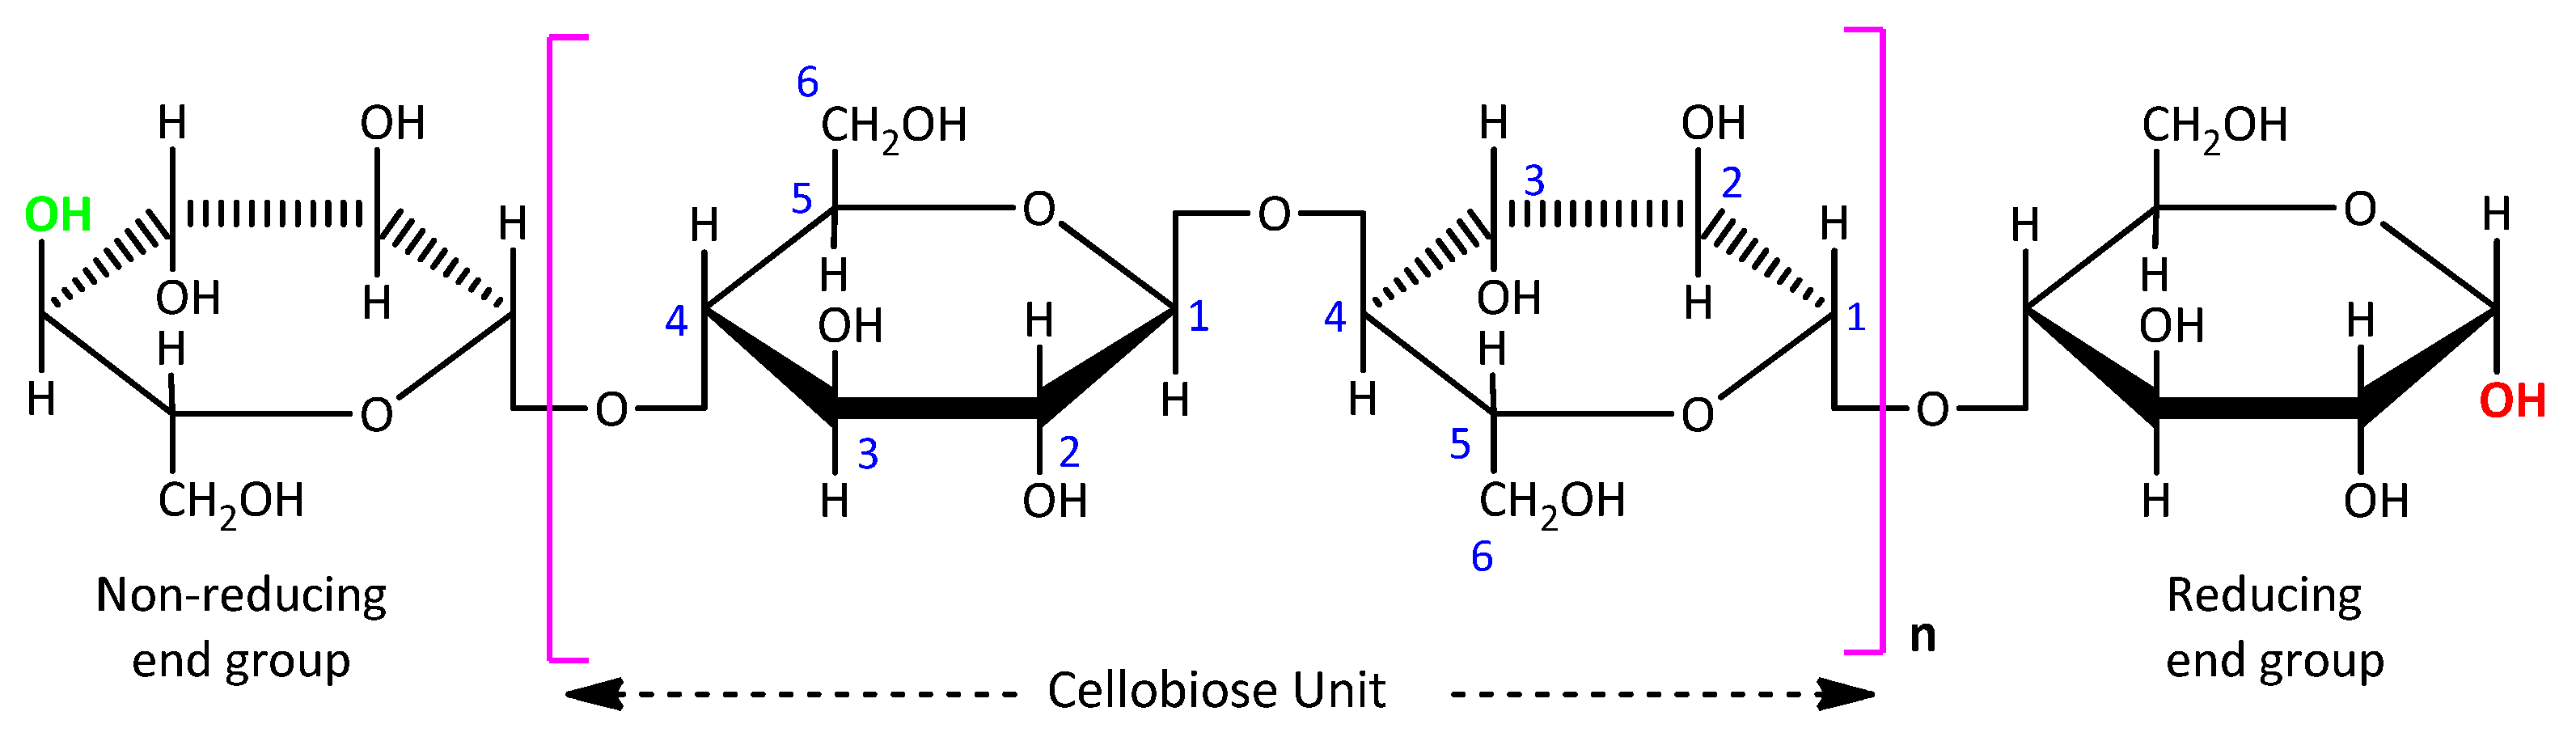
15] proposed that the rate-determining step during glycosidic degradation is the hydrogen abstraction from a carbon atom of an ionized or un-ionized sugar hydroxyl group. The oxidation of this group to their corresponding carbonyl group and its position on the glycosidic units play an important role in determining the oxidation pathway of these cyclic sugar rings. The oxidation of carbohydrates may lead to degradation of the cellulosic chain by a β-elimination mechanism or may not cause chain cleavage but instead results in the formation of acidic products. As illustrated in
Figure 2, most of these newly formed compounds bear at least one carboxylate group. Amongst a variety of these compounds, furanosidic glucoside is the most dominant product formed from the diketo compound by a benzilic acid type of rearrangement.
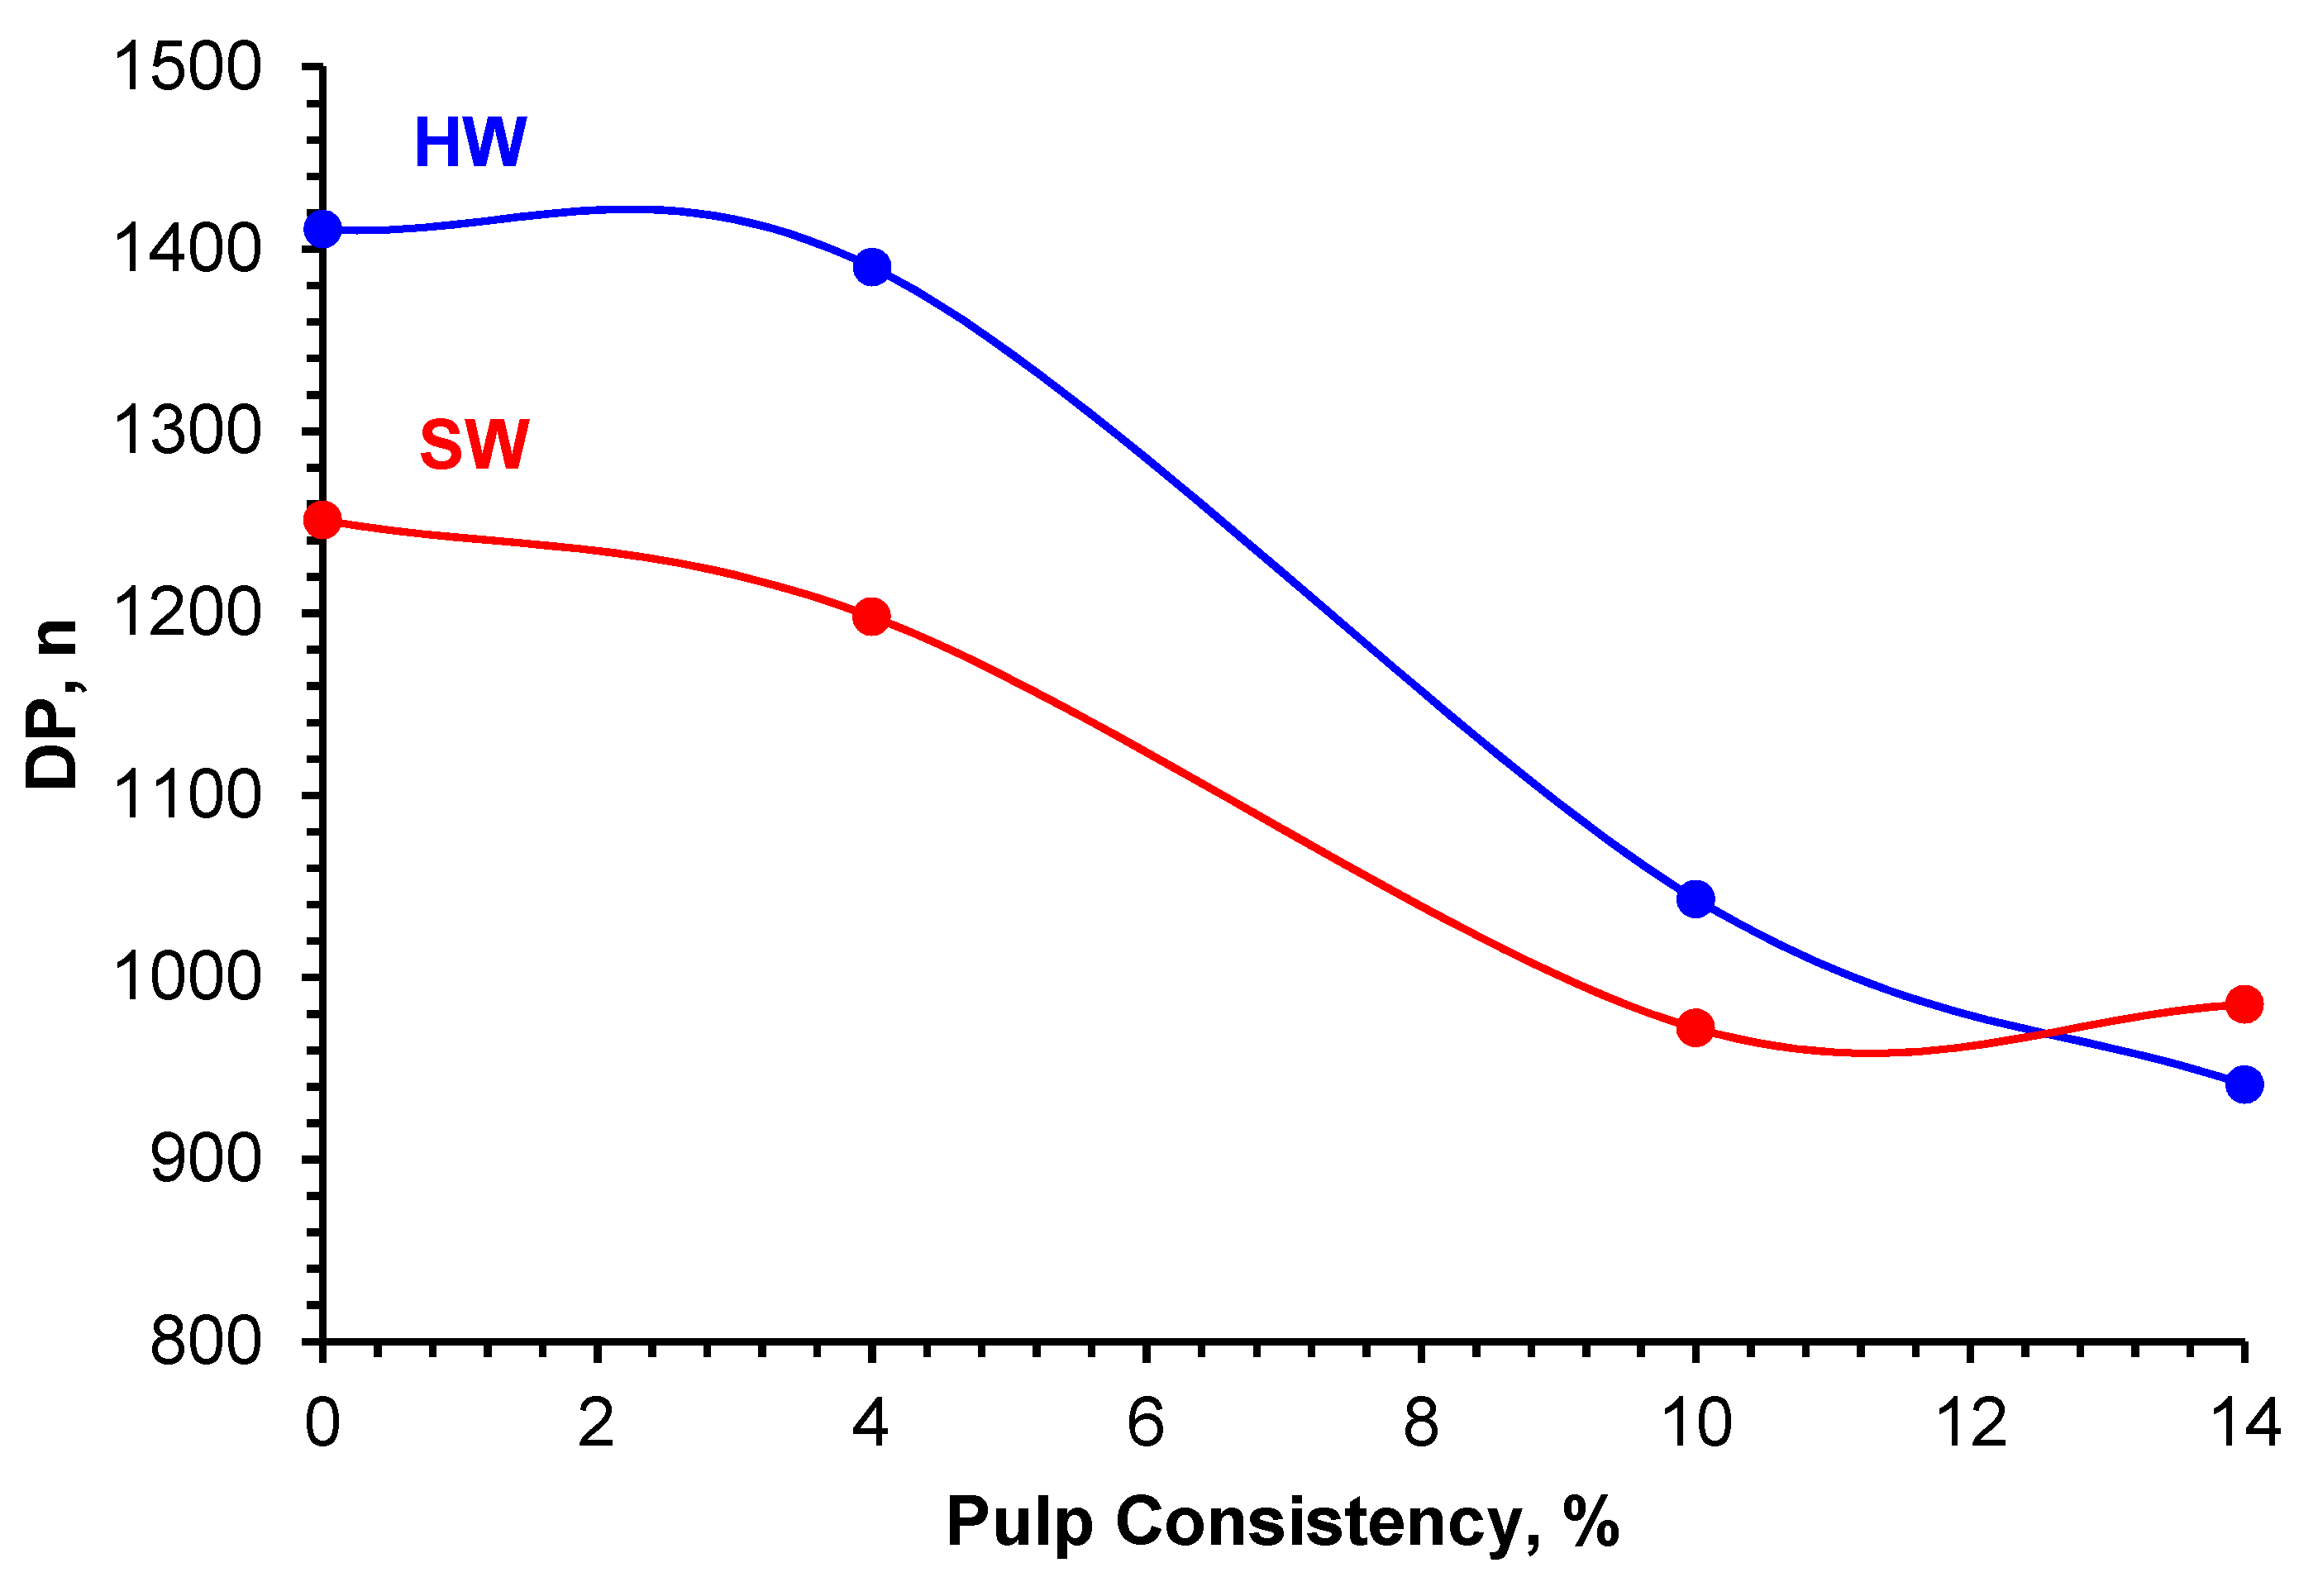
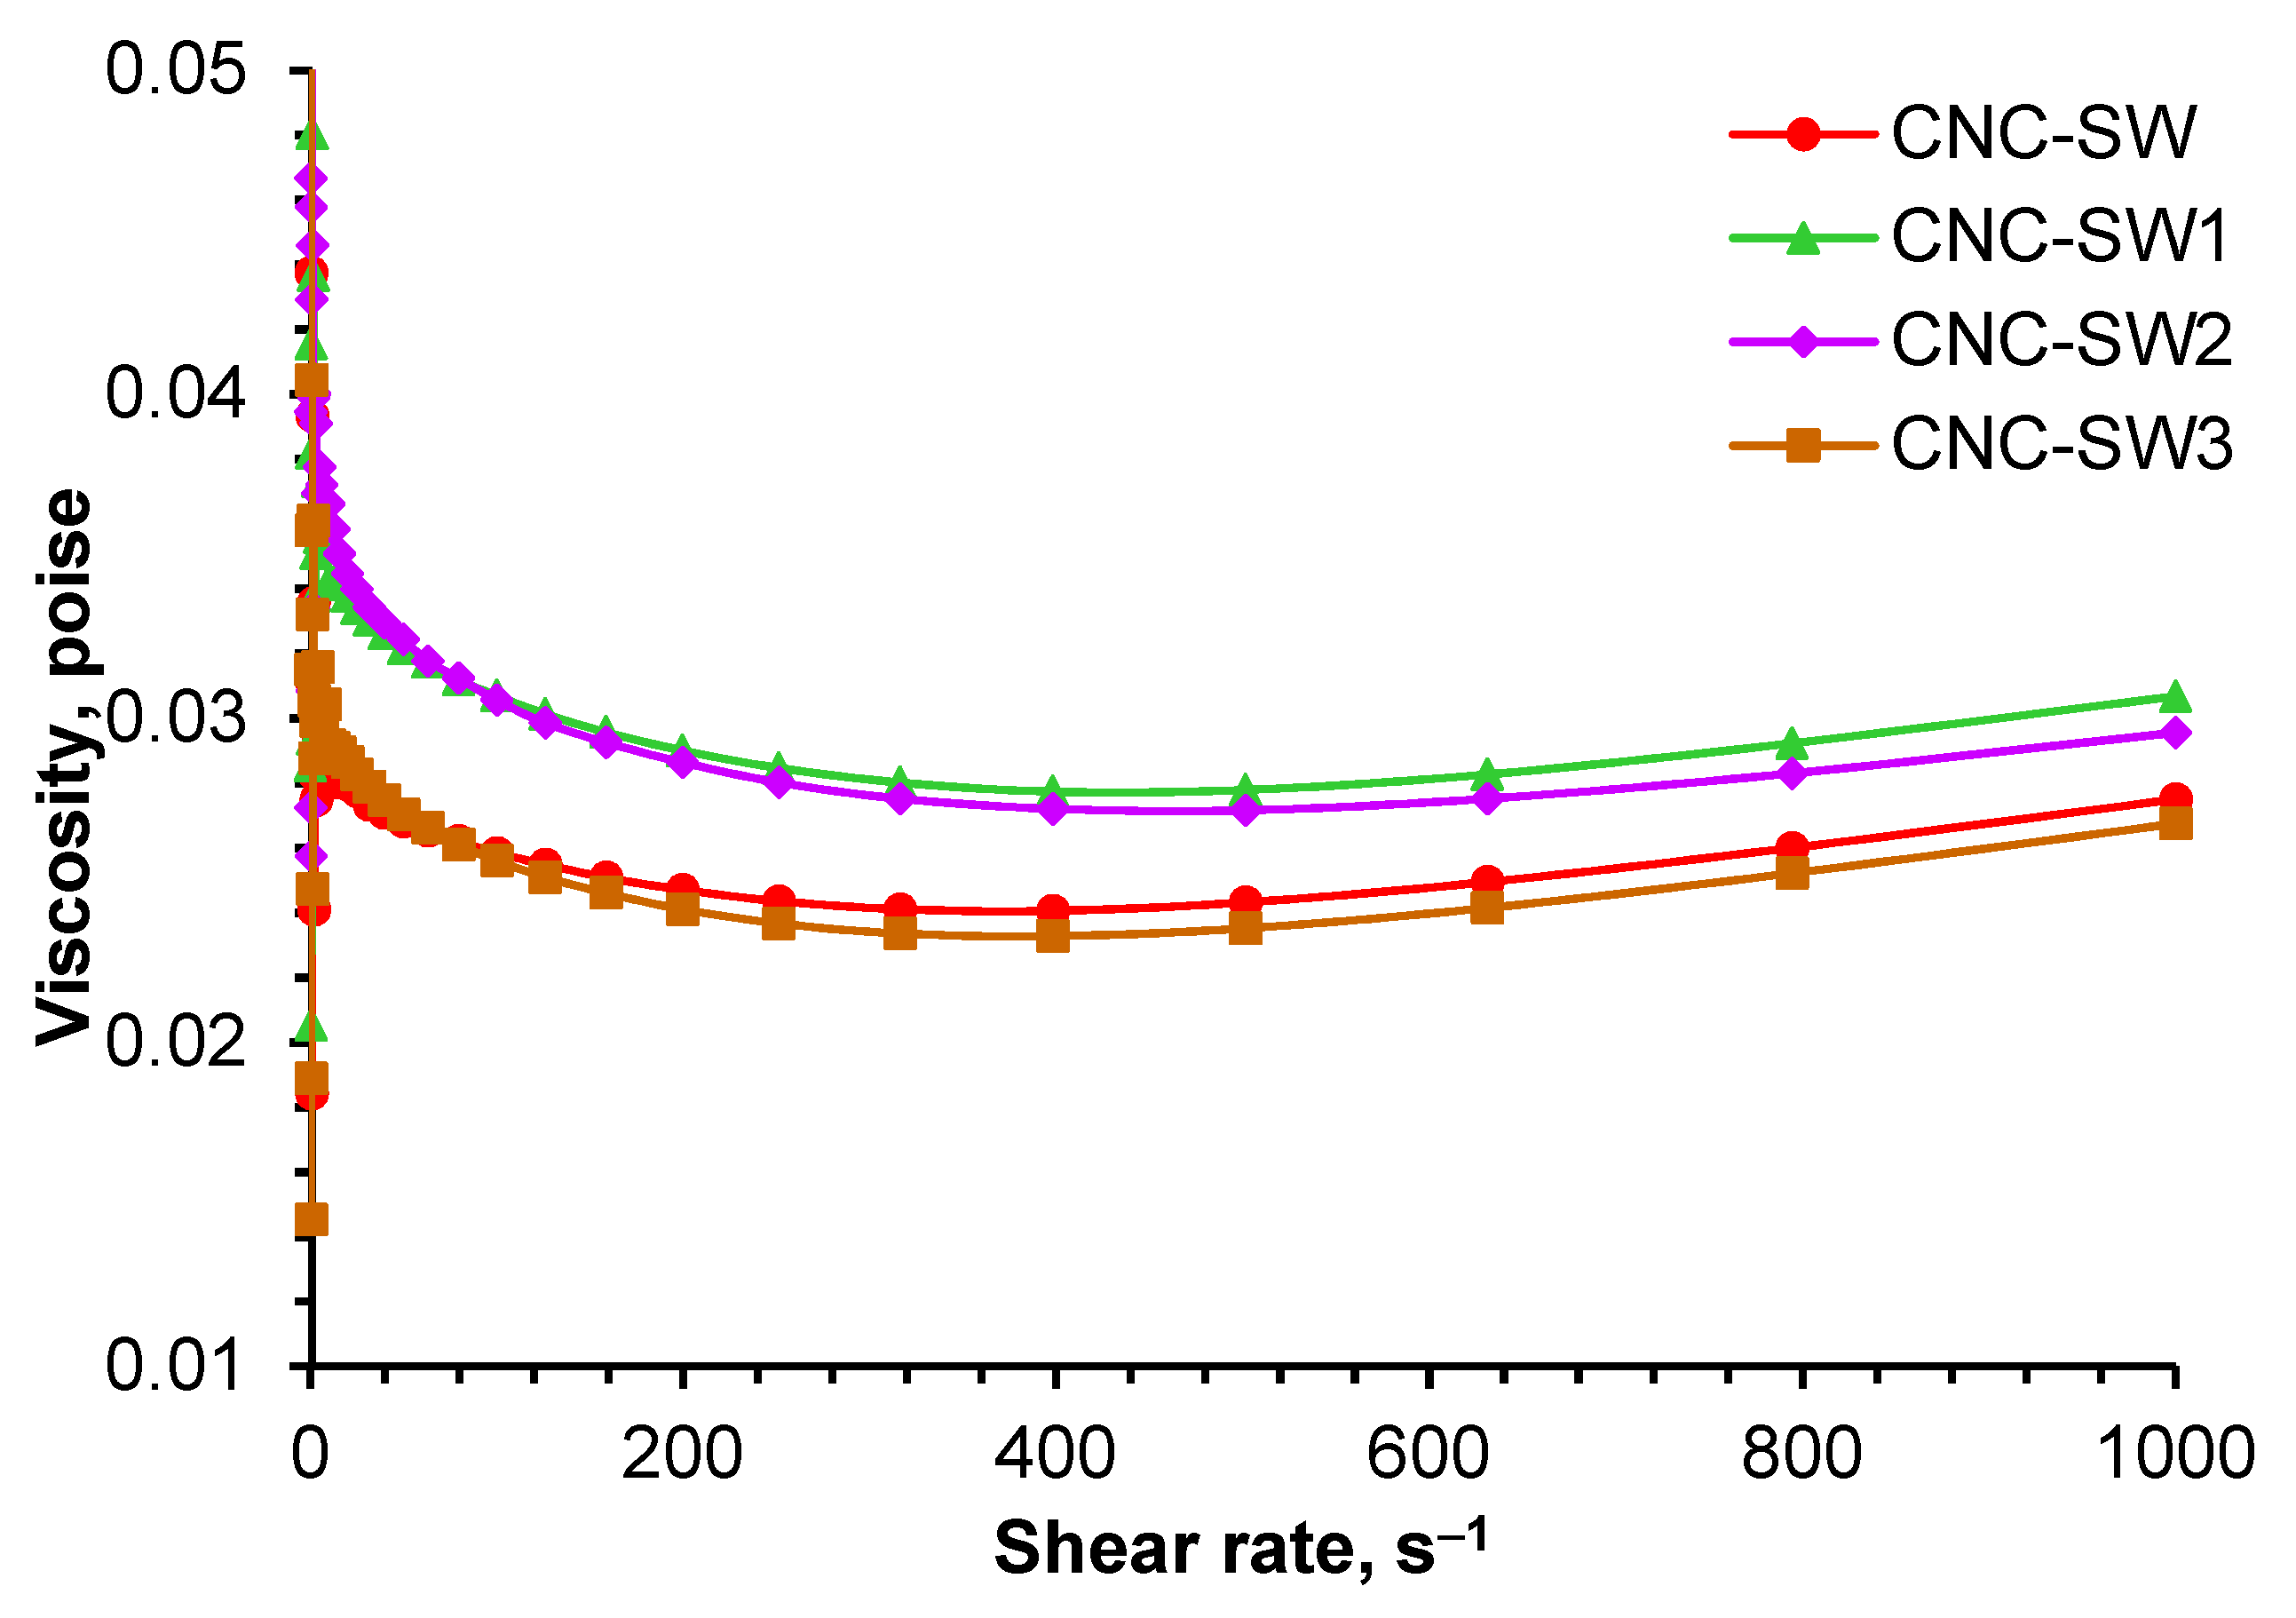
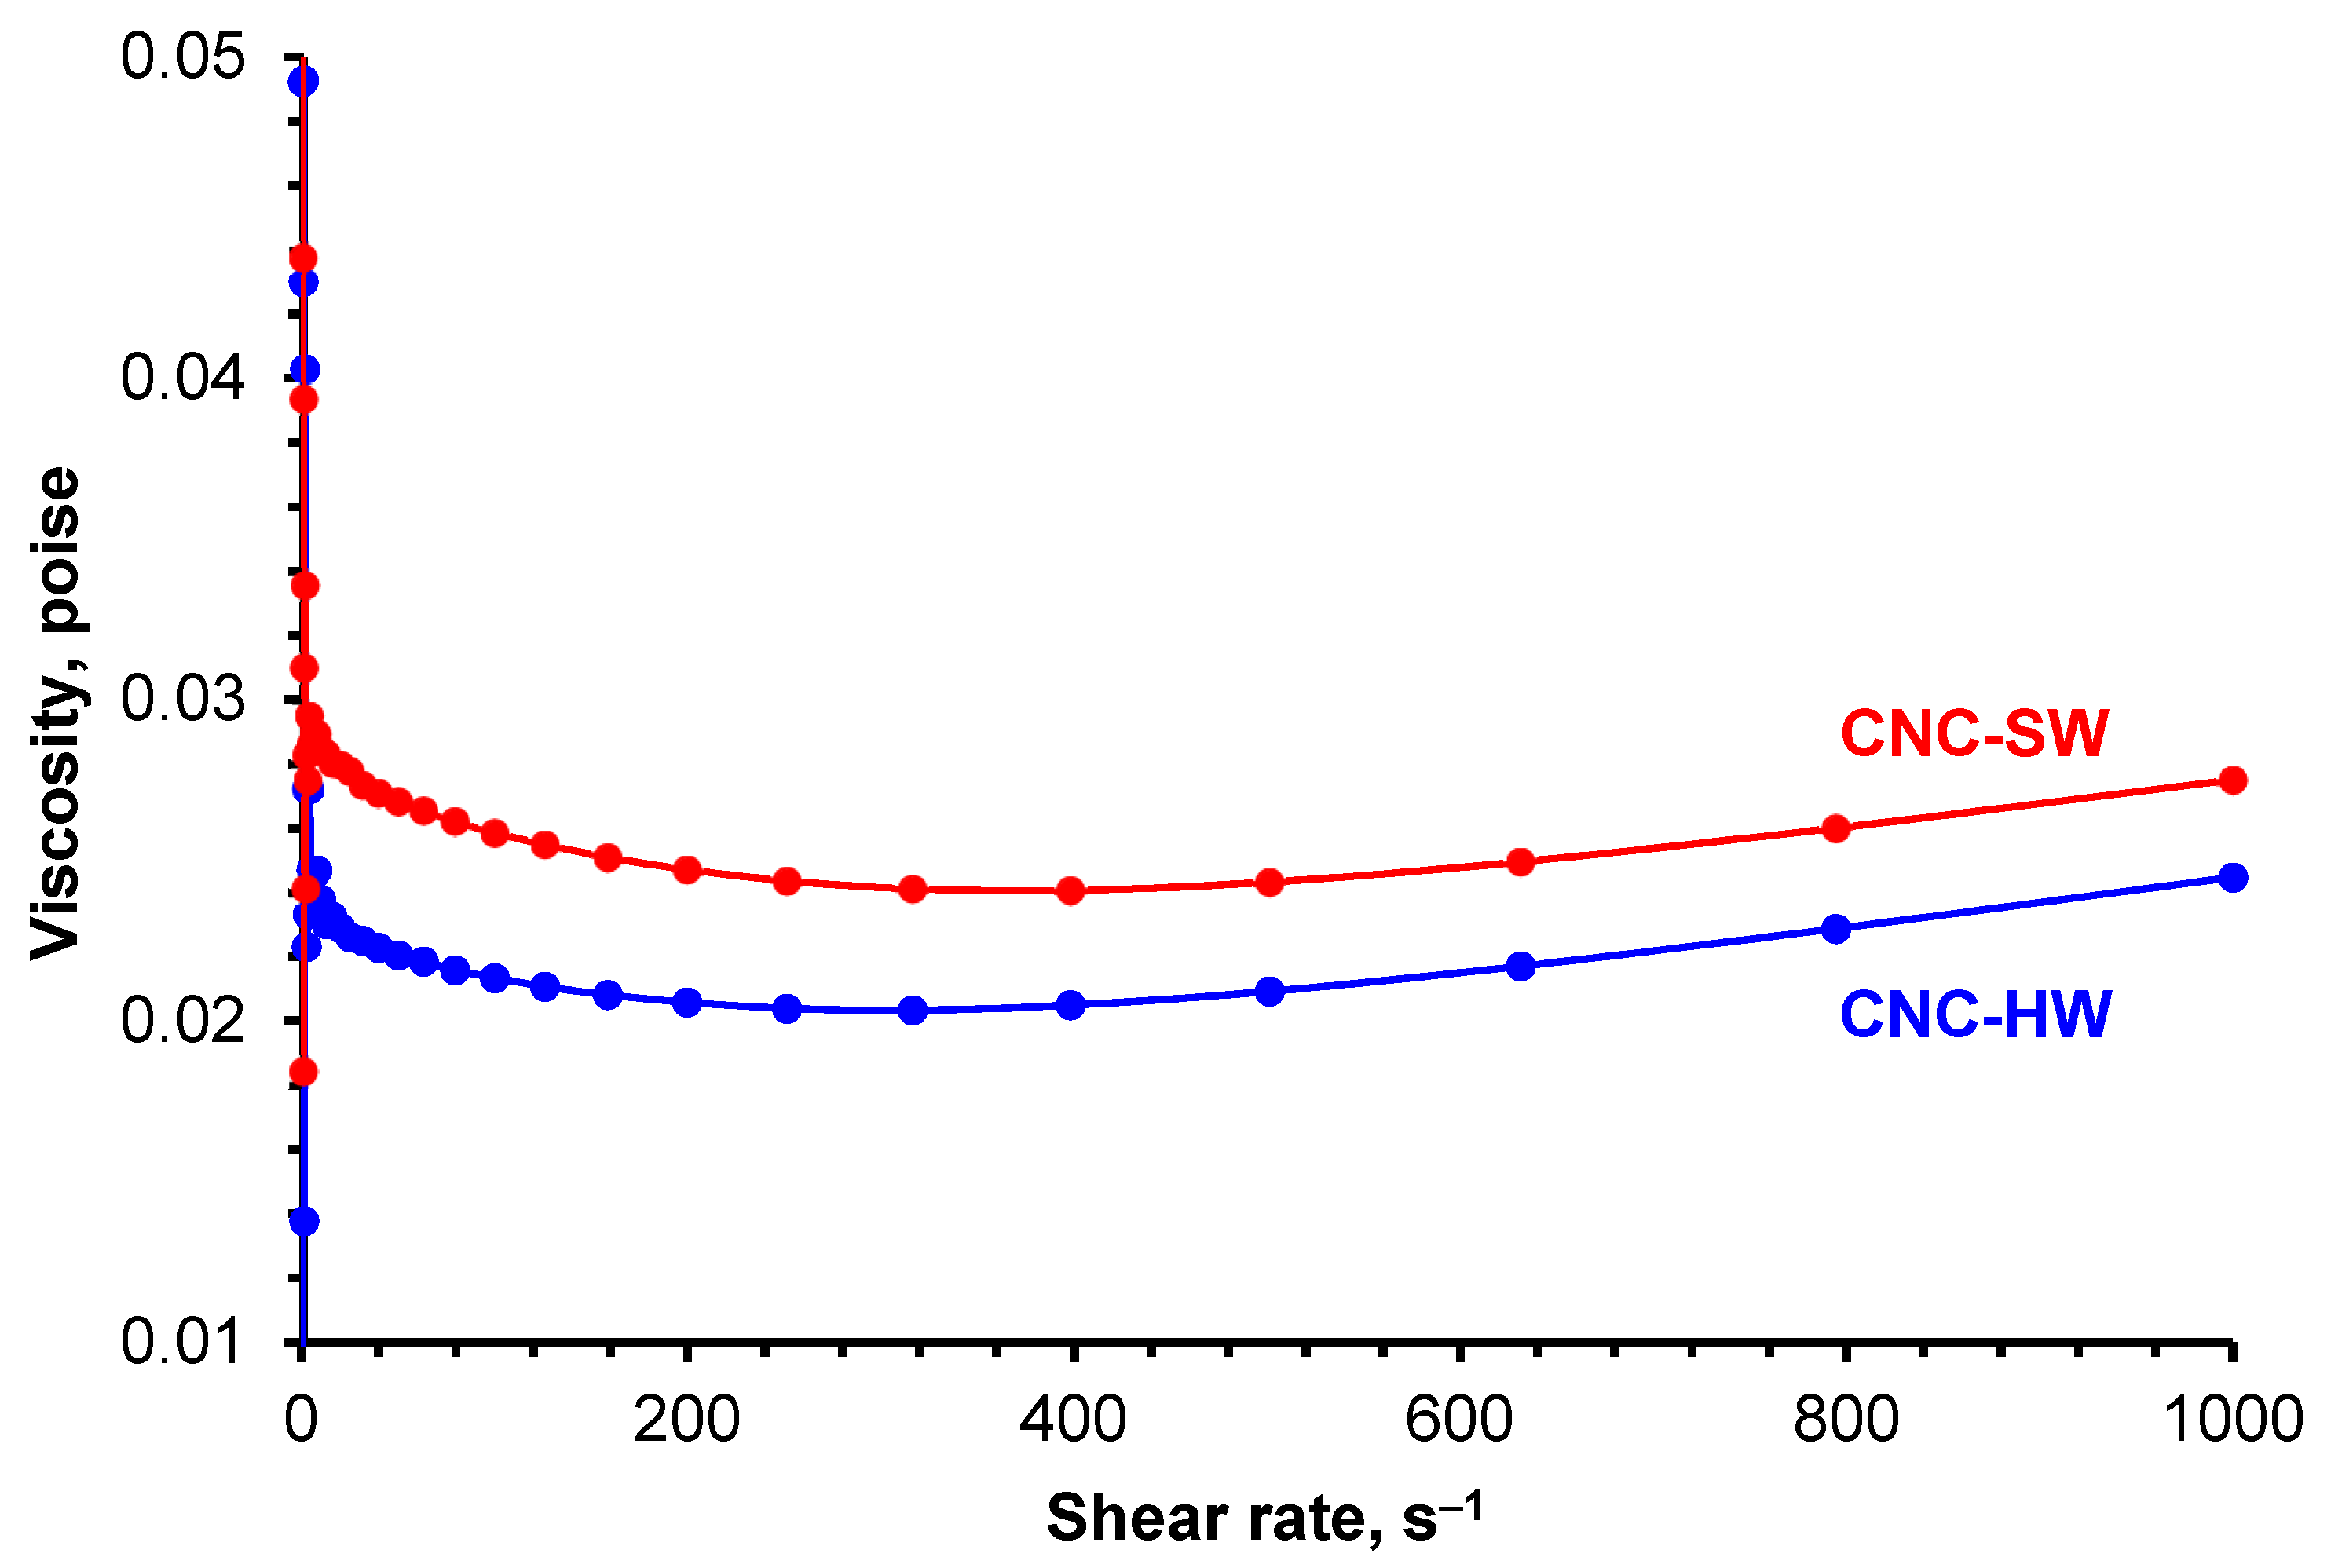
The effect of oxygen oxidation on the pulp viscosity for HW and SW was measured under different consistencies and compared to the starting materials. The detailed information is reported in
Table 3 and illustrated in
Figure 3.
The experimental data show the pulp DP dropped as the consistency increased from 4% to 14%. The DP for SW pulp was recorded to be lower than the HW pulp.
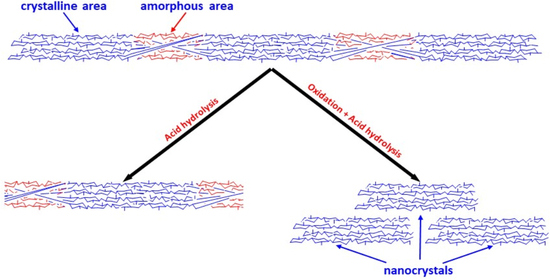
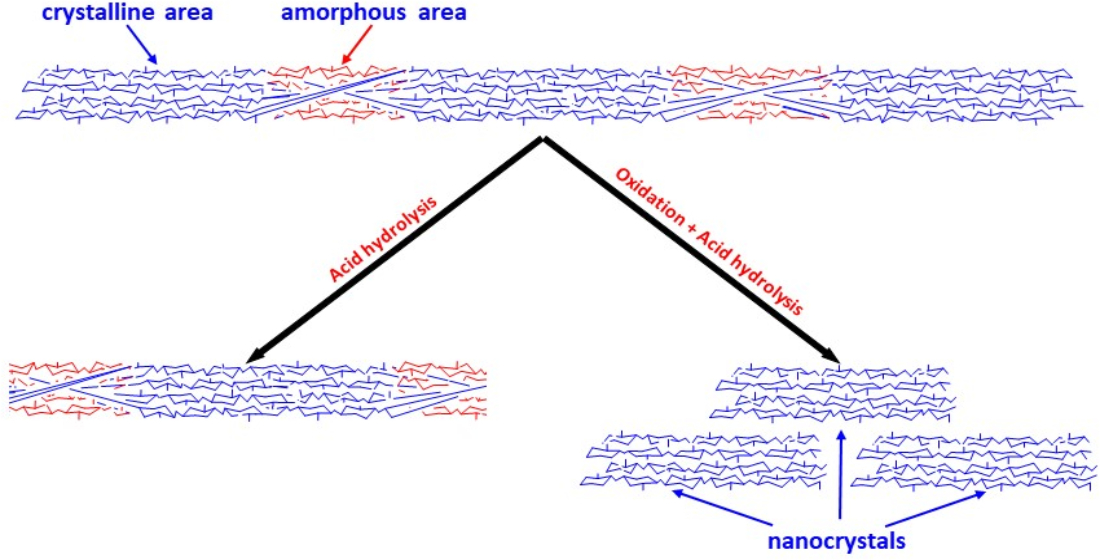
3.2. CNC Preparation
The oxidized pulp samples were subsequently subjected to acid hydrolysis for the preparation of CNC under conventional conditions. The CNC was prepared at 63.5% sulfuric acid, 45 °C, 120 min, with an 11.3:1 acid-to-pulp ratio under 200 rpm.
For the CNC and reject yields calculations, each neutralized sample was dialyzed to bring its conductivity to about 100 μS/cm and then centrifuged to separate its content into its corresponding CNC and reject materials. After that, known amounts of suspensions were oven-dried for yield determination. The corresponding CNC and reject yields for each purified sample are reported in
Table 4. Data show that the yields of CNC from oxidized HW and SW pulps were higher than those from HW Control and SW Control. For example, the yields of CNC from oxidized HW pulps are in the 18.2 and 21.4% range compared to 13.4% for CNC-HW Control. The corresponding yields for the CNC from oxidized SW pulps are 19.1 and 23.1%, compared to 17.3% for CNC-SW Control. Generally, data show that the oxidation promoted the increase of the CNC production yields regardless of the pulp’s source and grade. In all cases, lower than 10% reject yields were obtained.
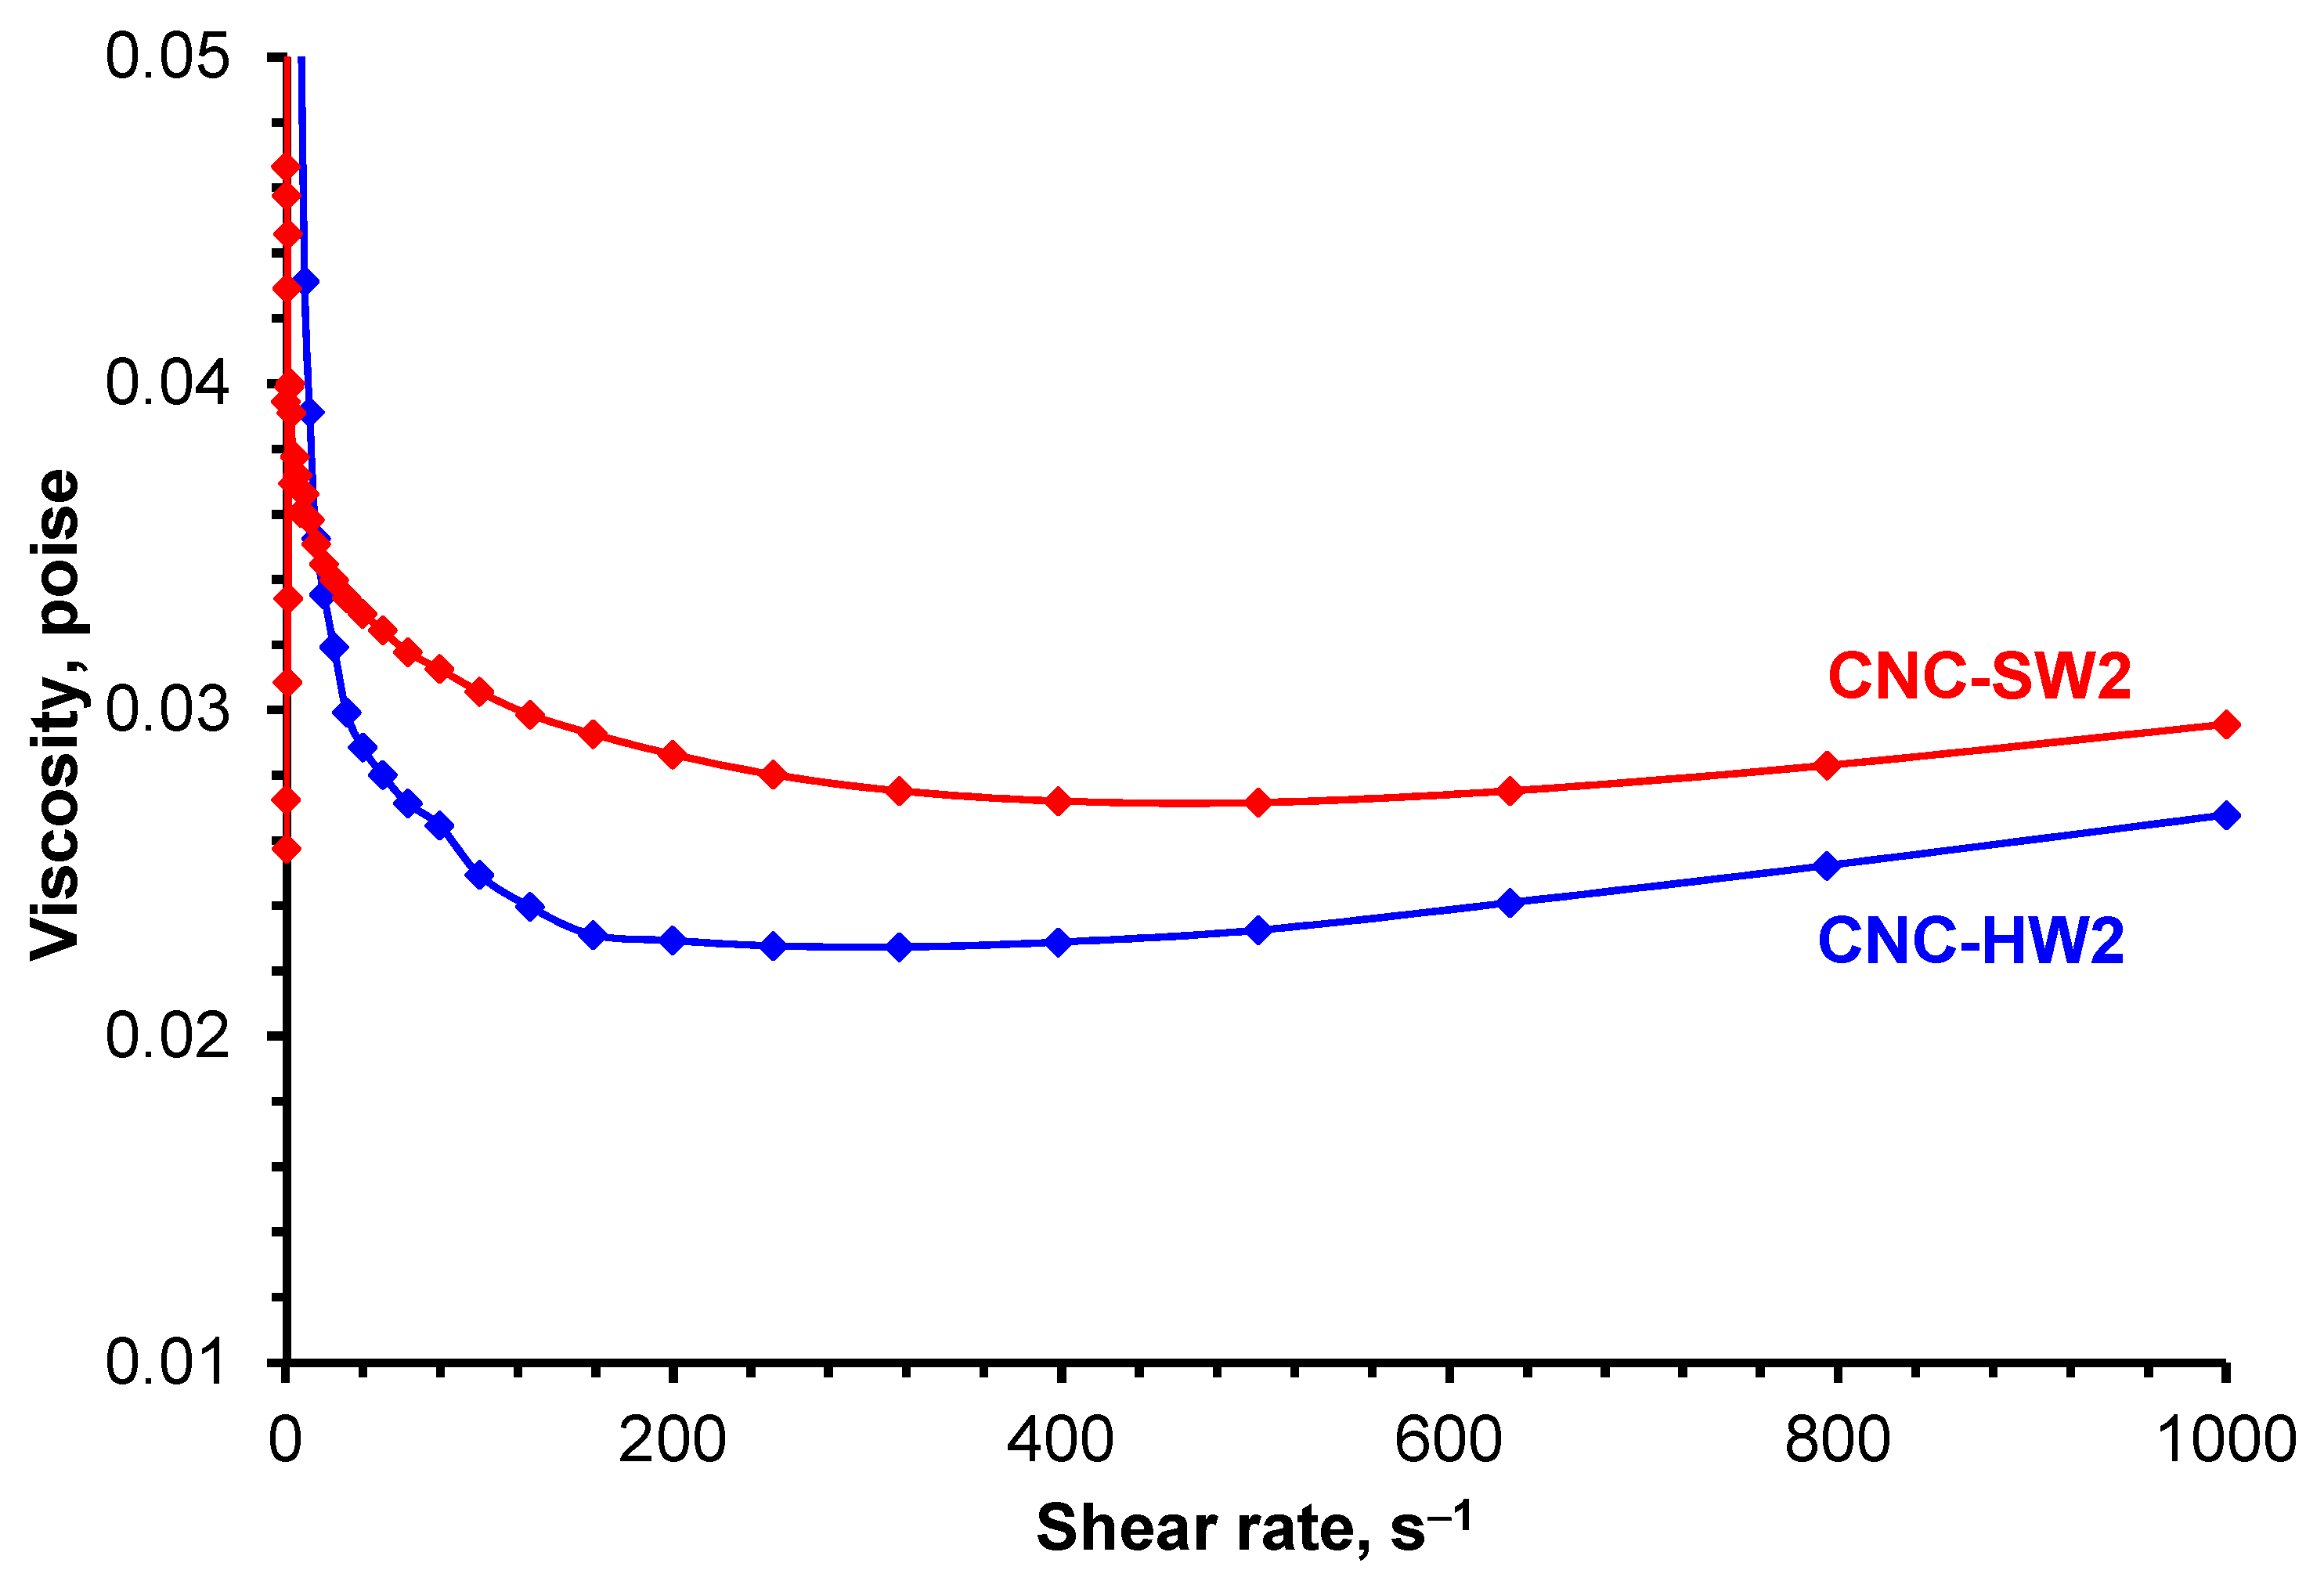
The particle size distribution (PSD) of CNC suspensions derived from control and oxidized HW and SW pulps were analyzed by DLS. At the same time, their surface charges and colloidal stability were evaluated by Zeta Potential (ZP) measurements. Data presented in
Table 5 confirmed the presence of negative charges (“negative ZP values”) on the CNC surface and the stability of resulting CNC suspensions (ZP values < −31 mV) in all cases.
DLS data show average particle sizes (PS) in the range of 116 and 383 nm for CNC suspensions prepared using control and oxidized HW pulps. Especially, CNC-HW2 showed bimodal average particles size of 116 and 383 nm. The lowest average PS was obtained with CNC-HW Control. Overall, the data also show that the average particle sizes of CNC prepared from oxidized HW pulps are larger than the ones prepared from HW Control. In
Table 5, the polydispersity index (PDI), a dimensionless measure of the broadness of the size distribution, was found to be in the 0.436 and 0.723 range for CNC from oxidized HW pulps as compared to 0.397 for CNC from HW Control. This indicates that CNC from oxidized HW pulps has broad PSD and contains larger particles. In
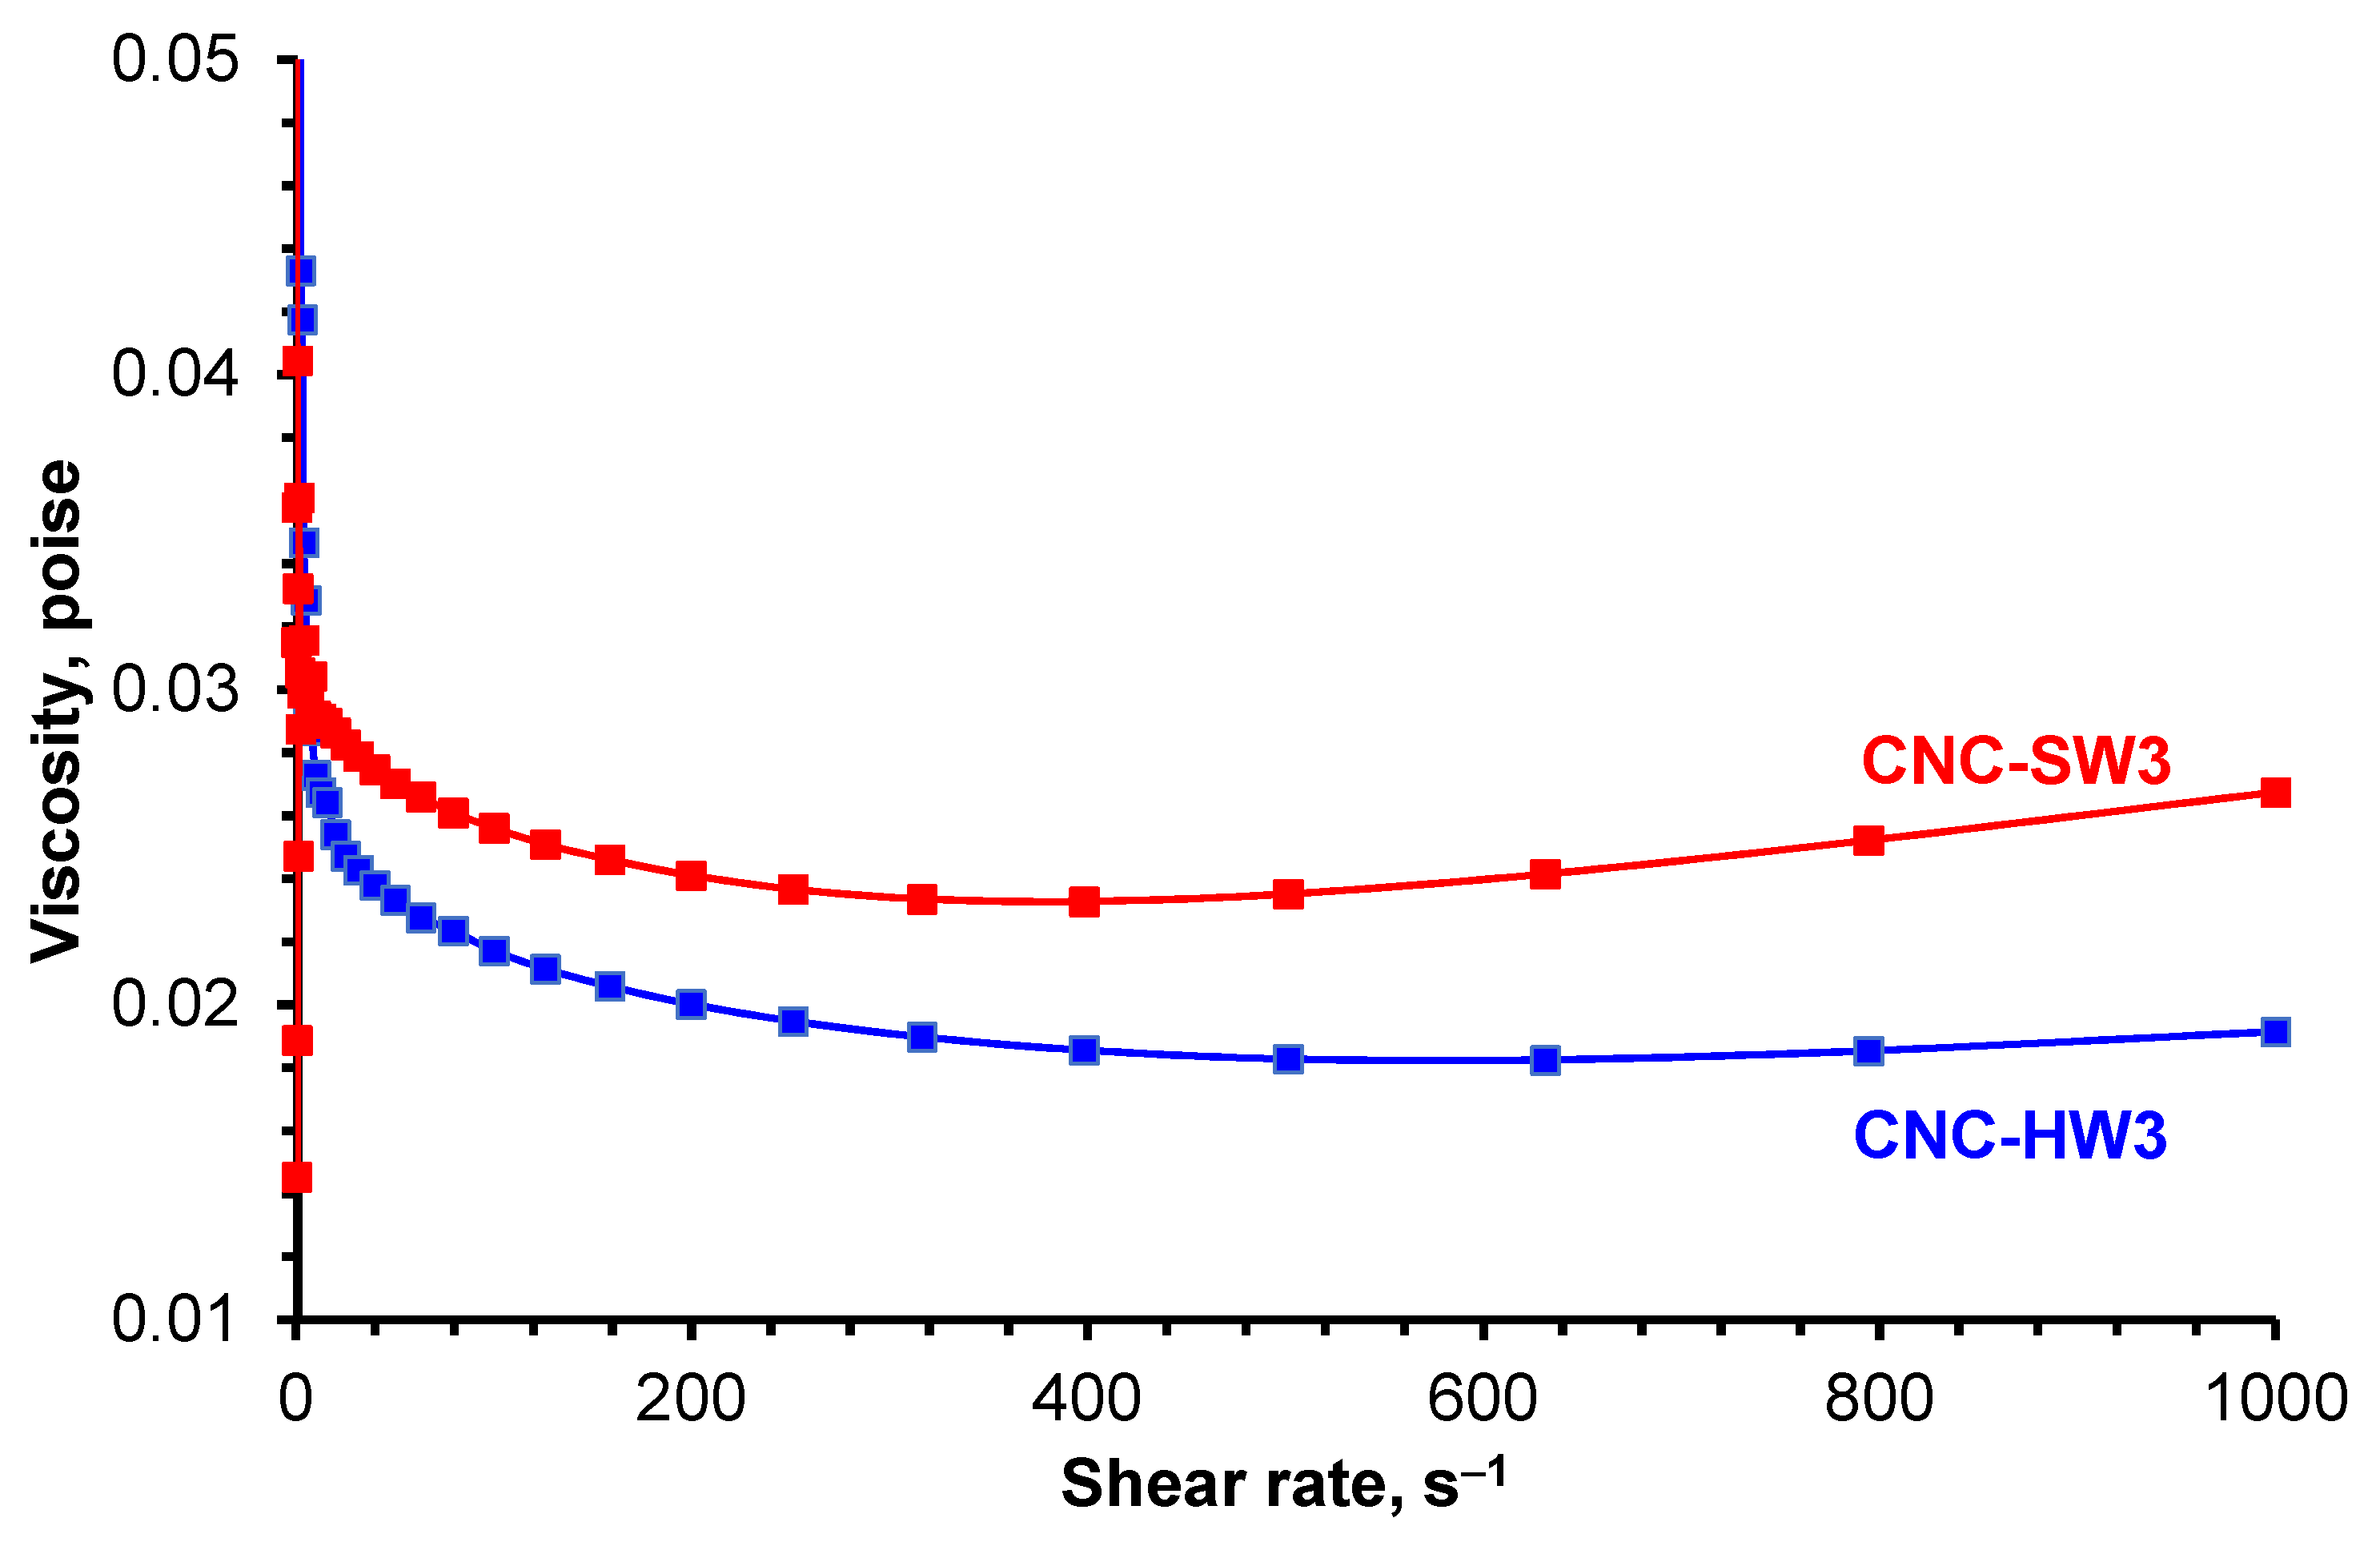
Table 5, data show that CNC suspensions prepared from SW Control and oxidized SW pulps displayed average particle sizes in the 102 and 173 nm range. The lowest value of average PS was obtained with CNC-SW Control. The PDI of CNC from oxidized SW pulps was found to be in the 0.437 and 0.570 range compared to 0.424 for CNC-SW Control. This PDI range for CNC from oxidized SW pulps also indicates that these samples have broad PSD and contain larger particles. The latter shows that the level of oxidation slightly impacted the PSD of the CNC SW samples series. According to DLS data, CNC materials from the SW pulps series seem to behave differently than those from the HW pulps series.
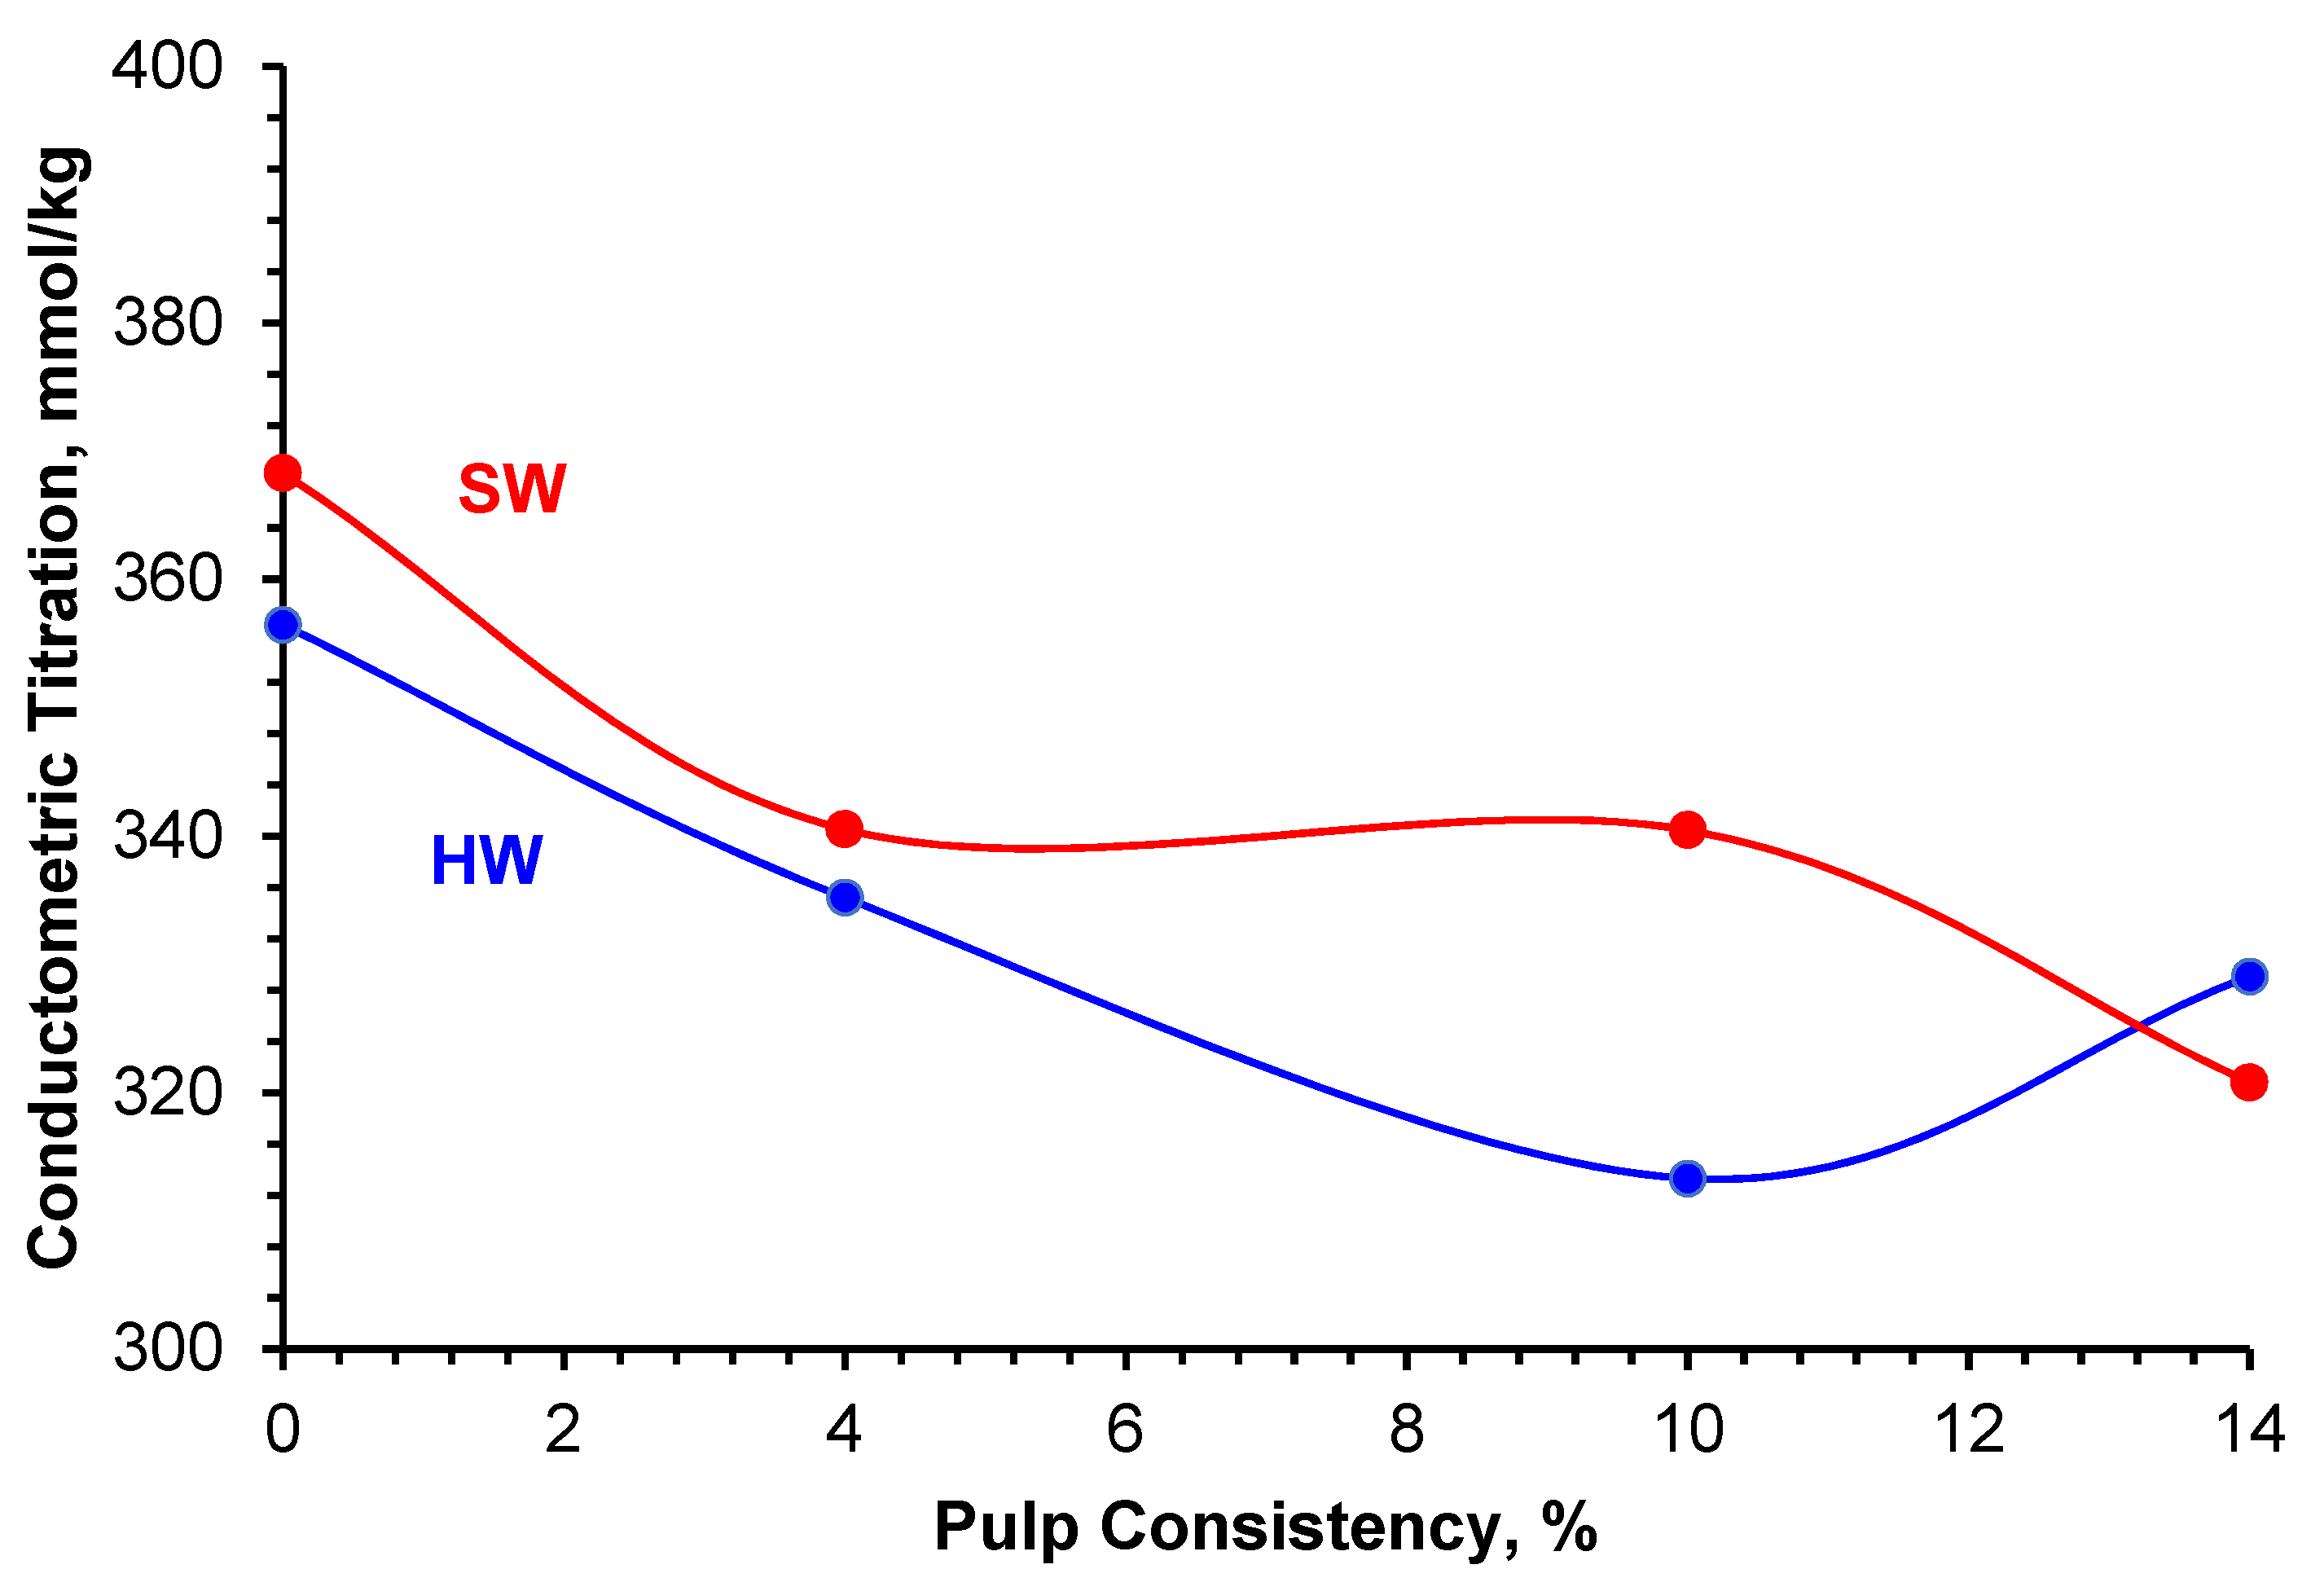
Conductometric titration was performed to determine the sulfate half-ester contents of CNC materials. This method is more accurate than elemental analysis (EA) by combustion (CHNS). The latter considers the total sulfur content, meaning all sulfate groups attached to the CNC surface and as impurities. At the same time, the conductometric titration involved a highly purified CNC suspension (removal of traces by dialysis). Data in
Table 6 and graphs in
Figure 4 show that the sulfate half-ester contents of all HW and SW-derived CNC materials fall between 313 and 369 mmol/kg. The highest sulfate half-ester contents were obtained with CNC-HW Control and CNC-SW Control as compared to the ones for CNC from oxidized HW and SW pulps where changes in contents were not substantial. This may indicate that the oxidation level was insufficient to impact the surface charge density. Still, the oxidation process seems to demonstrate the control of the sulfate half-ester contents on the CNC surface.
3.3. Thermogravimetric Analysis (TGA)
This test method allows the assessment of dry material (untreated and oxidized pulps, derived CNC, etc.) thermal stability through the determination of the temperature at which the material starts to decompose and may also provide an indication of usability for high-temperature processing and end-use.
The thermal properties of control and oxidized HW and SW pulps and their derived CNC samples were evaluated using TGA under a nitrogen atmosphere. The resulting data are reported in
Table 7 and
Table 8, while
Figure 5 and
Figure 6 show their thermogravimetric (TGA) and differential gravimetric (DTG) curves.
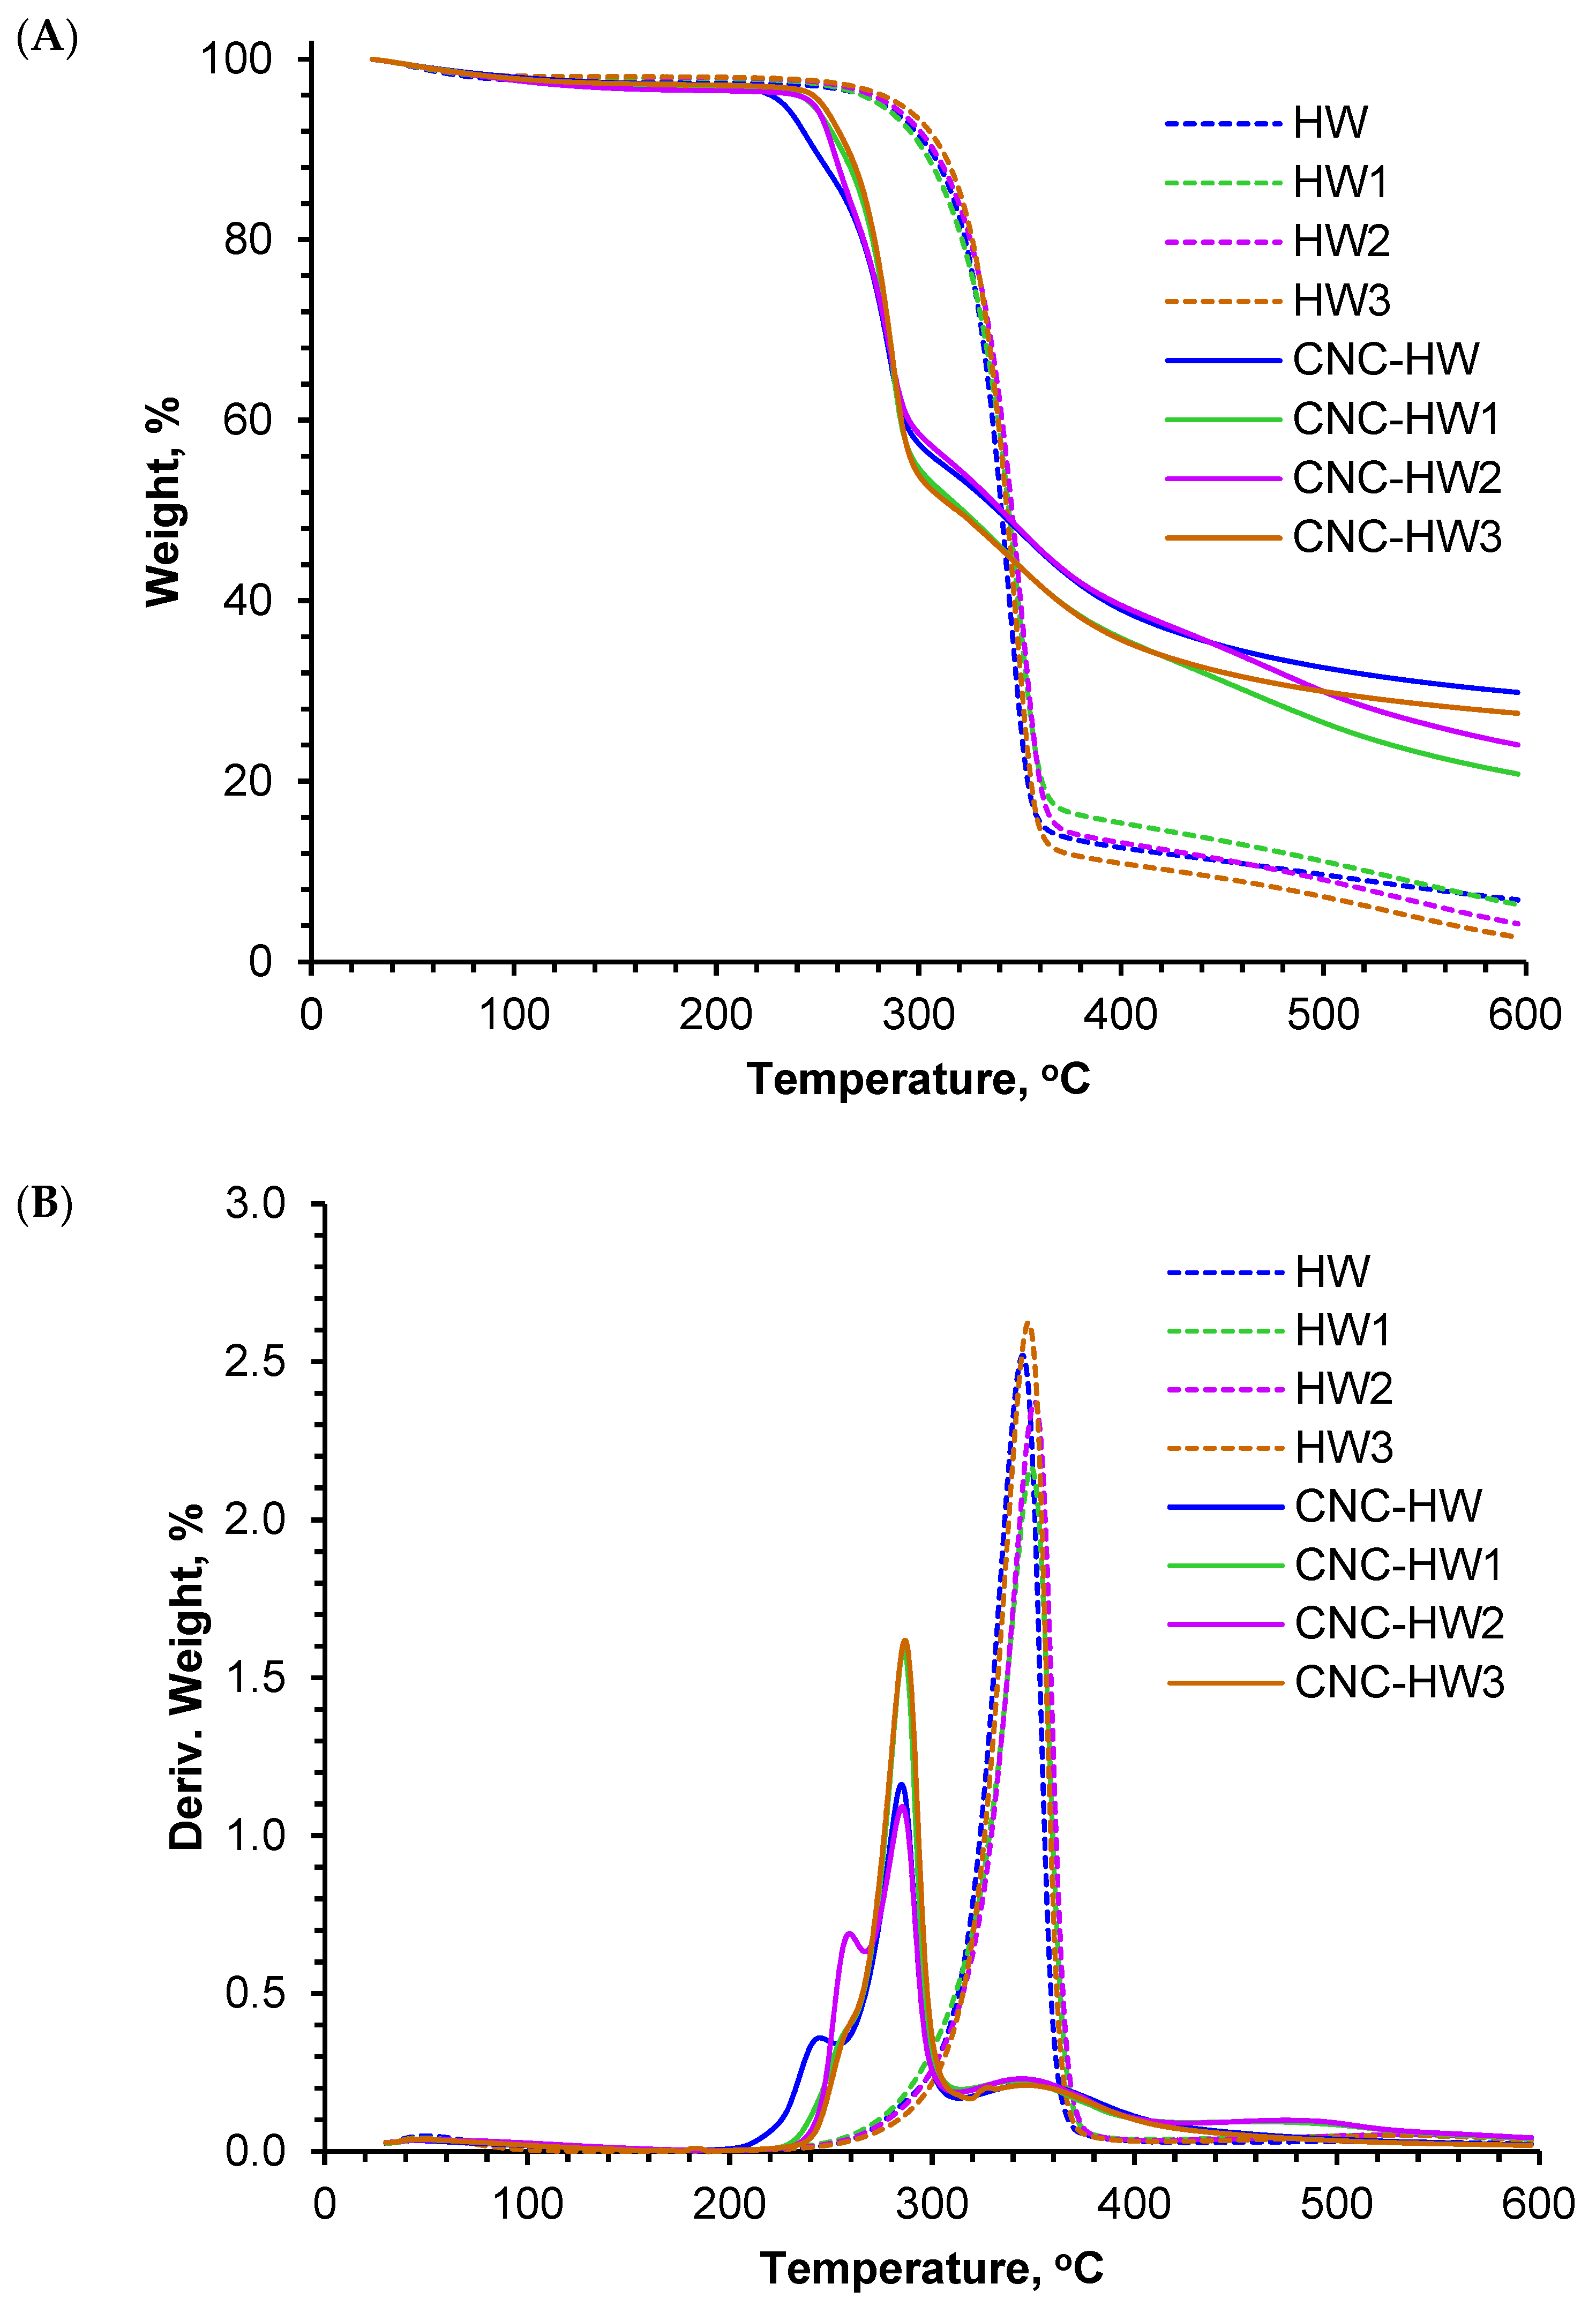
Generally, the degradation profile of pulps and CNC by TGA is divided into three stages.
First stage: all samples displayed a small weight loss in the 30–150 °C temperature range, as shown in
Figure 5 and
Figure 6. This loss is associated with the evaporation of the moisture contained in the pulp and CNC samples and is in the 3 to 4.5% range, as reported in
Table 7 and
Table 8. A plateau follows this loss until the initial degradation temperature (T
iD), as reported in
Table 7 and
Table 8 and shown in
Figure 5 and
Figure 6 for each sample (pulp or CNC), is reached. The T
iD of HW Control and SW Control, as well as their oxidized derivatives, were about 275 °C and were higher than the T
iD of their corresponding CNC materials because of the absence of sulfate groups on the pulps’ surface. In addition, in
Table 7, the number of residues from oxidized HW pulps decreases with increased consistency (percentage of oxidation) but stays lower as compared to the HW Control. The trend is as follows: 6.8 wt% (HW Control, 0%) > 6.3 wt% (HW1, 4%) > 4.2 wt% (HW2, 10%) > 2.7 wt% (HW3, 14%). On the contrary, it was found that the number of residues from oxidized SW pulps increases with increased consistency and stays higher compared to the SW Control. The trend is as follows: 8.1 wt% (SW1, 4%) > 8.0 wt% (SW3, 14%) > 6.8 wt% (SW2, 10%) > 5.5 wt% (SW Control, 0%).
Second stage: the degradation of cellulose usually occurs after the plateau in the 250 °C and 400 °C temperature range [
16]. The latter is affected by the level of purity of the cellulose. For instance, the presence of sulfate groups on the CNC surface will lower their T
iD as compared to the ones of their pure cellulose-based precursors. This is validated by data reported in
Table 7 and
Table 8 for all CNC materials. Again, the higher the density of sulfate groups on the CNC surface, the lower the T
iD will be. TGA and DTG curves in
Figure 5 and
Figure 6 show that the T
iD range of pure cellulose shifted from 250–400 °C to 200–315 °C due to the presence of sulfate groups on the CNC materials surface. In these ranges, the primary pyrolysis of cellulose is catalyzed by sulfate groups onto CNC materials surface. The presence of sulfate groups on the CNC surface was confirmed by conductometric titration data in
Table 6 and zeta potential (ZP) measurements in
Table 5. The effect of impurities on the T
iD of any CNC material may also be revealed by the level of residue generated after TGA. For example, CNC from oxidized HW pulps displayed residues in the 20.6 and 27.2% range, compared to 29.5% for the CNC-HW Control. That may explain the higher T
iD of CNC materials from oxidized HW pulps compared to the CNC-HW Control. The T
iD for CNC from oxidized HW pulps was in the 235–240 °C range compared to 220 °C for HW-CNC Control.
In contrast, CNC from oxidized SW pulps displayed residues in the 23.1 and 26.4% range, compared to 21.9% for the CNC-SW Control. Therefore, the T
iD of the CNC from oxidized SW pulps was lower than that of CNC-SW Control. The T
iD for CNC from oxidized SW pulps was in the 205–210 °C range compared to 220 °C for CNC-SW Control. In all cases, the T
iD of the resulting CNC materials was out of the 250–275 °C range for current CNC materials. These lower T
iD values, as reported in
Table 8, may also originate from either the severity of the reaction conditions as revealed by the high levels of sulfate half-ester contents of HW and SW CNC-derived samples or the generation of new types of CNC materials.
Third and last stage: pyrolysis of hydrocarbon chains occurs along with the slow charring process of the solid residue [
17,
18] and corresponds to 400–600 °C temperature range for pulps (control and oxidized) and 315–600 °C temperature range for their derived CNC materials.
The DTG data in
Table 7 and curves in
Figure 5 show that the maximum decomposition temperatures (T
max) positions of oxidized HW pulps were almost the same (~348–350 °C) and slightly higher than the HW Control (344 °C). For their corresponding CNC, as shown in
Table 8 and
Figure 6, the T
max positions were almost the same (~285–286 °C). For the SW pulps series, data in
Table 7 and DTG curves in
Figure 5 show that the T
max positions for oxidized SW pulps were almost the same (350–351 °C) and slightly higher than the SW Control (352 °C). This observation indicates that the oxidation process and its level do not affect the T
max position of the SW pulps series.
Generally, the DTG curves for CNC materials show one (one T
max) only in the 250 and 325 °C temperature range. This range may be affected by the hydrolysis reaction conditions and the pulp quality. This is the case for CNC-HW1 and CNC-HW3 in
Figure 6, where the T
max positions were around 286 °C and in the 220 and 315 °C temperature range. CNC-HW2 and CNC-HW Control samples also displayed T
max positions at about 286 °C with two short T
max positions (shoulders) at 259 and 244 °C, respectively, as reported in
Table 8 and shown in
Figure 6.
For the CNC-SW samples series, the DTG curves show that the Tmax also fell in the 200–315 °C temperature range, which may also be due to the high density of sulfate groups on the CNC materials surface. One peak with a position around 285 °C was observed for CNC-SW Control. At the same time, each CNC sample from the oxidized SW pulps series (CNC-SW1, CNC-SW2 or CNC-SW3) displayed two maximum decomposition peaks (one minimum and one maximum). The minima and maxima were around 240 °C and 285 °C, respectively.
Overall, the DTG curves for CNC samples in
Figure 6 show two or multiple maximum decomposition temperatures in the 200 and 315 °C temperature range, indicating that several specimens have been decomposed in this temperature range. In addition, the initial decomposition temperatures (T
iD) for the CNC-SW samples series were lower than the ones of the CNC-HW samples series. This may be due to the lower DP of SW pulps series, which probably allows them to break down into smaller sizes of CNC materials.


_Ngo.png)


