Simple Summary
Four Vietnamese breeding lines (2 Japonica and 2 Indica) were directly compared in field settings for phenotypic traits associated with yield. These Vietnamese rice genomes were newly de novo assembled and annotated, and a phylogenetic analysis of the phytochrome C (phyC) confirmed the positioning and diversity between the four varieties. The four lines showed enough phenotypic and genetic differences to be used as parental lines for climate-adaptation breeding programs.
Abstract
This study begins by examining phenotypic variations in field growth among four parental Vietnamese rice lines, consisting of two Indica (PD211/GL37) and two Japonica (J23/SRA2-1) cultivars, which differ in life-cycle durations. Their phenotypic observations revealed both similarities and differences in growth patterns and field responses, setting the stage for further genomic investigation. We then focused on the sequencing and de novo genome assembly of these lines using high-coverage Illumina sequencing and achieving pseudochromosome assemblies ranging between 379 Mbp and 384 Mbp. The assemblies were further enhanced by annotation processes, designating between 44,427 and 48,704 gene models/genome. A comparative genomic analysis revealed that the Japonica varieties (J23/SRA2-1) exhibited more genetic similarity than the Indica varieties (PD211/GL37). From this, a phylogenetic analysis on the phytochrome C (phyC) gene distinctly positions the Indica and Japonica lines within their respective clades, affirming their genetic diversity and lineage accuracy. These genomic resources will pave the way for identifying quantitative trait loci (QTLs) critical for developing rice cultivars with shorter life cycles, thus enhancing resilience to adverse climatic impacts in Vietnam. This study provides a foundational step towards leveraging genomic data for rice breeding programs aimed at ensuring food security in the face of climate change.
1. Introduction
Rice (Oryza sativa L.) is one of the most important food crops, feeding more than 3.5 billion people worldwide. Asian countries had the largest area harvested, with Vietnam harvesting more than 7 million ha of rice in 2022 [1], ranking fifth in the global rice production market, with India and China as the biggest producers. However, by 2035, the steadily increasing population is causing a rise in the demand for rice of >112 million metric tons [2]. Climate change also demands better land use, with rice cultivars adapted to local conditions and resilient to multiple (a) biotic stresses. Historically, the two major rice groups are O. sativa Xian group, referred to as Indica, and O. sativa Geng group, also referred to as Japonica [3,4]. Despite there being thousands of rice-accession genomes available in different repositories worldwide [2,5,6], Vietnamese rice has been understudied despite possessing a rich germplasm [7].
Vietnam is an important country in global rice production. This nation is endowed with a high diversity of climates that significantly influence agricultural outputs. Particularly in the north, the Red River Delta and the northern mountain areas experience cold and unpredictable weather during the seedling stage, which poses challenges to rice cultivation. Concurrently, the North of Central Midlands Province has been enduring continuous flooding and low temperatures in recent years, with climate models forecasting even more severe weather conditions in the near future [8]. These climatic adversities not only threaten the staple food supply but also the economic stability of the region. Rice, being a central element of Vietnam’s agriculture, has varieties historically adapted to diverse environmental conditions. However, the recent extremities caused by climate change demand innovative approaches to crop breeding. The average temperature in the North of Vietnam is 23.9 °C (ranging from 13.2 °C to 31.5 °C), while the average humidity is 78.9% (ranging from 66 to 90%). Rice sowing is divided into two seasons: spring season (or dry season, with an average temperature of 22.9 °C (ranging from 13.2 °C to 29.5 °C)), with sowing happening between December and January and harvest between May and June, and summer season (or wet season, with an average temperature of 26.5 °C (ranging from 18.5 to 31.5 °C)), with sowing happening between May and July and harvest between September to November [9]. Developing new rice cultivars that can be sown later in the spring could mitigate losses due to the early cold snaps and flooding, a method that may prevent the damaging impacts of typhoons, which are becoming increasingly frequent and intense. In this context, genomic studies play a crucial role. By identifying quantitative trait loci (QTLs), breeders can develop varieties with shorter life cycles, tailored to withstand and thrive in the altered climatic conditions of Vietnam.
In this work, we phenotypically characterized two Indica (PD211/GL37) and two Japonica (J23/SRA2-1) lines that will be part of a pre-breeding program to generate early flowering, high-yield rice varieties. The lines were compared directly in field settings under both the spring and summer growing seasons. These lines showed different flowering times and different yield traits, which make them ideal for crossing to develop varieties with shorter life cycles and potentially high yields. To facilitate future molecular breeding, QTL mapping, and marker-assisted selection, genomic information will be critical. We thus successfully assembled and annotated the genomes of four parental rice lines, two Indica (PD211/GL37) and two Japonica (J23/SRA2-1), utilizing high-coverage Illumina sequencing technology. These genomic assemblies were from very high coverage and have been meticulously annotated, revealing between 44,427 and 48,704 gene models per genome, with the substantial coverage of functional annotations. Our phylogenetic analysis of the phytochrome C (phyC) gene, chosen for being a useful marker in angiosperm phylogenetic work [10], distinctly positioned these lines within their respective clades, confirming the accuracy of their genetic lineage and diversity. Our comparative genomic analysis has highlighted clear genetic distinctions between the Indica and Japonica groups, revealing that these four lines are sufficiently different to serve as a foundation to climate-resilience breeding by targeting the genetics of life-cycle duration.
2. Materials and Methods
2.1. Phenotypic Data
The four rice lines were cultivated in designated field sites at the Experimental Station, Field Crops Research Institute, Hai Duong (Vietnam), and data were collected during the summer of 2019 and the spring of 2020, with observations recorded for five plants per line each year. We measured four life cycle-related traits: the number of days from seeding to heading (flowering time), the duration of flowering from start to finish, the days from the end of flowering to when 85% of the grains on the panicle were mature, and the total growth duration from seeding to grain ripening. Additionally, various yield-related traits were assessed, including plant height (cm), tillering ability (tillers per plant), number of panicles per plant, number of grains per panicle, percentage of sterile grains, the weight of 1000 grains (g), and grain yield expressed as grams per plant and quintals per hectare. Statistical analyses of the data were conducted using R. Plots were generated using the ggplot package, reflecting the data collected across both years. Differences between the varieties within a cultivar were assessed using lmer in R (package lme4) by maintaining the time and technical replicates as random factors. Pearson, when the data was normally distributed, or Spearman correlation, as a non-parametric test, were performed with cor.test in R to assess the correlation between flowering and maturity time with grain yield and harvested yield.
2.2. Plant Growth, Sequencing, Genome Assembly, and Annotation
Four rice varieties, SRA2-1, J23, PD211, and GL37, were grown in trays. About 100 mg of leaves from 20-day-old seedlings were collected and ground in liquid nitrogen. GeneJET Plant Genomic DNA Purification Mini Kit (K0792, Thermo Fisher Scientific, Waltham, MA, USA) was used to extract DNA according to GeneJET Plant Genomic DNA Purification Mini Kit instructions. These were then sequenced using Novogene UK services using a NovaSeq 6000 platform and paired-end strategy. Raw reads were filtered to keep 100× coverage using BBMap [11] and assembled de novo using SPAdes [12], setting the k-mer parameter (substrings of length k in a given string) to the recommended default 21, 33, 55, 77. The genome was then polished using PILON version 1.24 [13]. To obtain pseudochromosomes, we used the rice Nipponbare reference genome (IRGSP-1.0, https://rapdb.dna.affrc.go.jp/download/irgsp1.html, accessed on 1 November 2023) and Sibeliaz [14] to obtain collinear blocks and Ragout to order the contigs [15,16]. To assess the genome size and the N50, we used SEQKIT instead, and the Benchmarking Universal Single-Copy Orthologs (BUSCO version 5.5; [17]) was used to assess the completeness of the genome against the Poales database.
Genome annotations were performed by initially masking the genomes using REPEATMODELER (version 2.1) and REPEATMASKER (version 2.1) [18] followed by using de novo BRAKER (version 1.9) [19] using the protein pipeline against the Viridiplantae (downloaded November 2023; https://v100.orthodb.org/download/odb10_plants_fasta.tar.gz, accessed on 15 November 2023 [20]) database, to which the Nipponbare protein annotation was added. Functional annotations of the gene models were obtained with eggNOG [21,22] by previously filtering by structure and function using gFACS (Version 1.1.2) [23] and EnTAP [24]. BLASTn was used to find the nomenclature correspondence between each of the de novo annotated genes and the Japonica reference genome (IRGSP). The Extensive de novo TE Annotator (EDTA) [25] was used to identify transposable elements (TE) and tandem repeats.
2.3. Comparison between Genomes
MASH distance, estimating the mutation rate between two genomes, was assessed using k = 11 [26]. Pairwise comparison between all possible combinations of these 4 lines was assessed. A maximum likelihood phylogenetic tree was constructed by first retrieving the sequence of phyC (using the GenBank sequence: AB018442.1) for each genome and then aligning with mafft [27] and trimming with trimAI [28] with automated1 set-up to decide optimal thresholds according to gap and similarity scores. The phyC sequence from 211 rice accessions was retrieved from https://agrigenome.dna.affrc.go.jp/tasuke/ricegenomes/, accessed on 13 March 2024, retrieving the variants in chromosome 3 for all 211 genomes (coordinates from 31,004,724 to 31,009,758 bp) using the BLAST tool against the same phyC sequence (GenBank: AB018442.1). The alignment was also manually trimmed, keeping 2357 bp. IQ-Tree [29] was used to create the maximum likelihood tree with 1000 bootstraps and with the model with the best Bayesian Information Criterion according to ModelFinder [30]. The selected model out of 484 DNA models was HKY (unequal transition/transversion rates and unequal base frequencies [31] +F (empirical base frequencies) +I (allowing for a proportion of invariable sites) +R2 (FreeRate model [32,33]. The rice variety of each of the 211 accessions was indicated as tropical japonica [TRJ], temperate japonica [TEJ], indica [IND], aus [AUS], aromatic [ARO], and admixture [ADM].
3. Results
3.1. Flowering Time and Yield
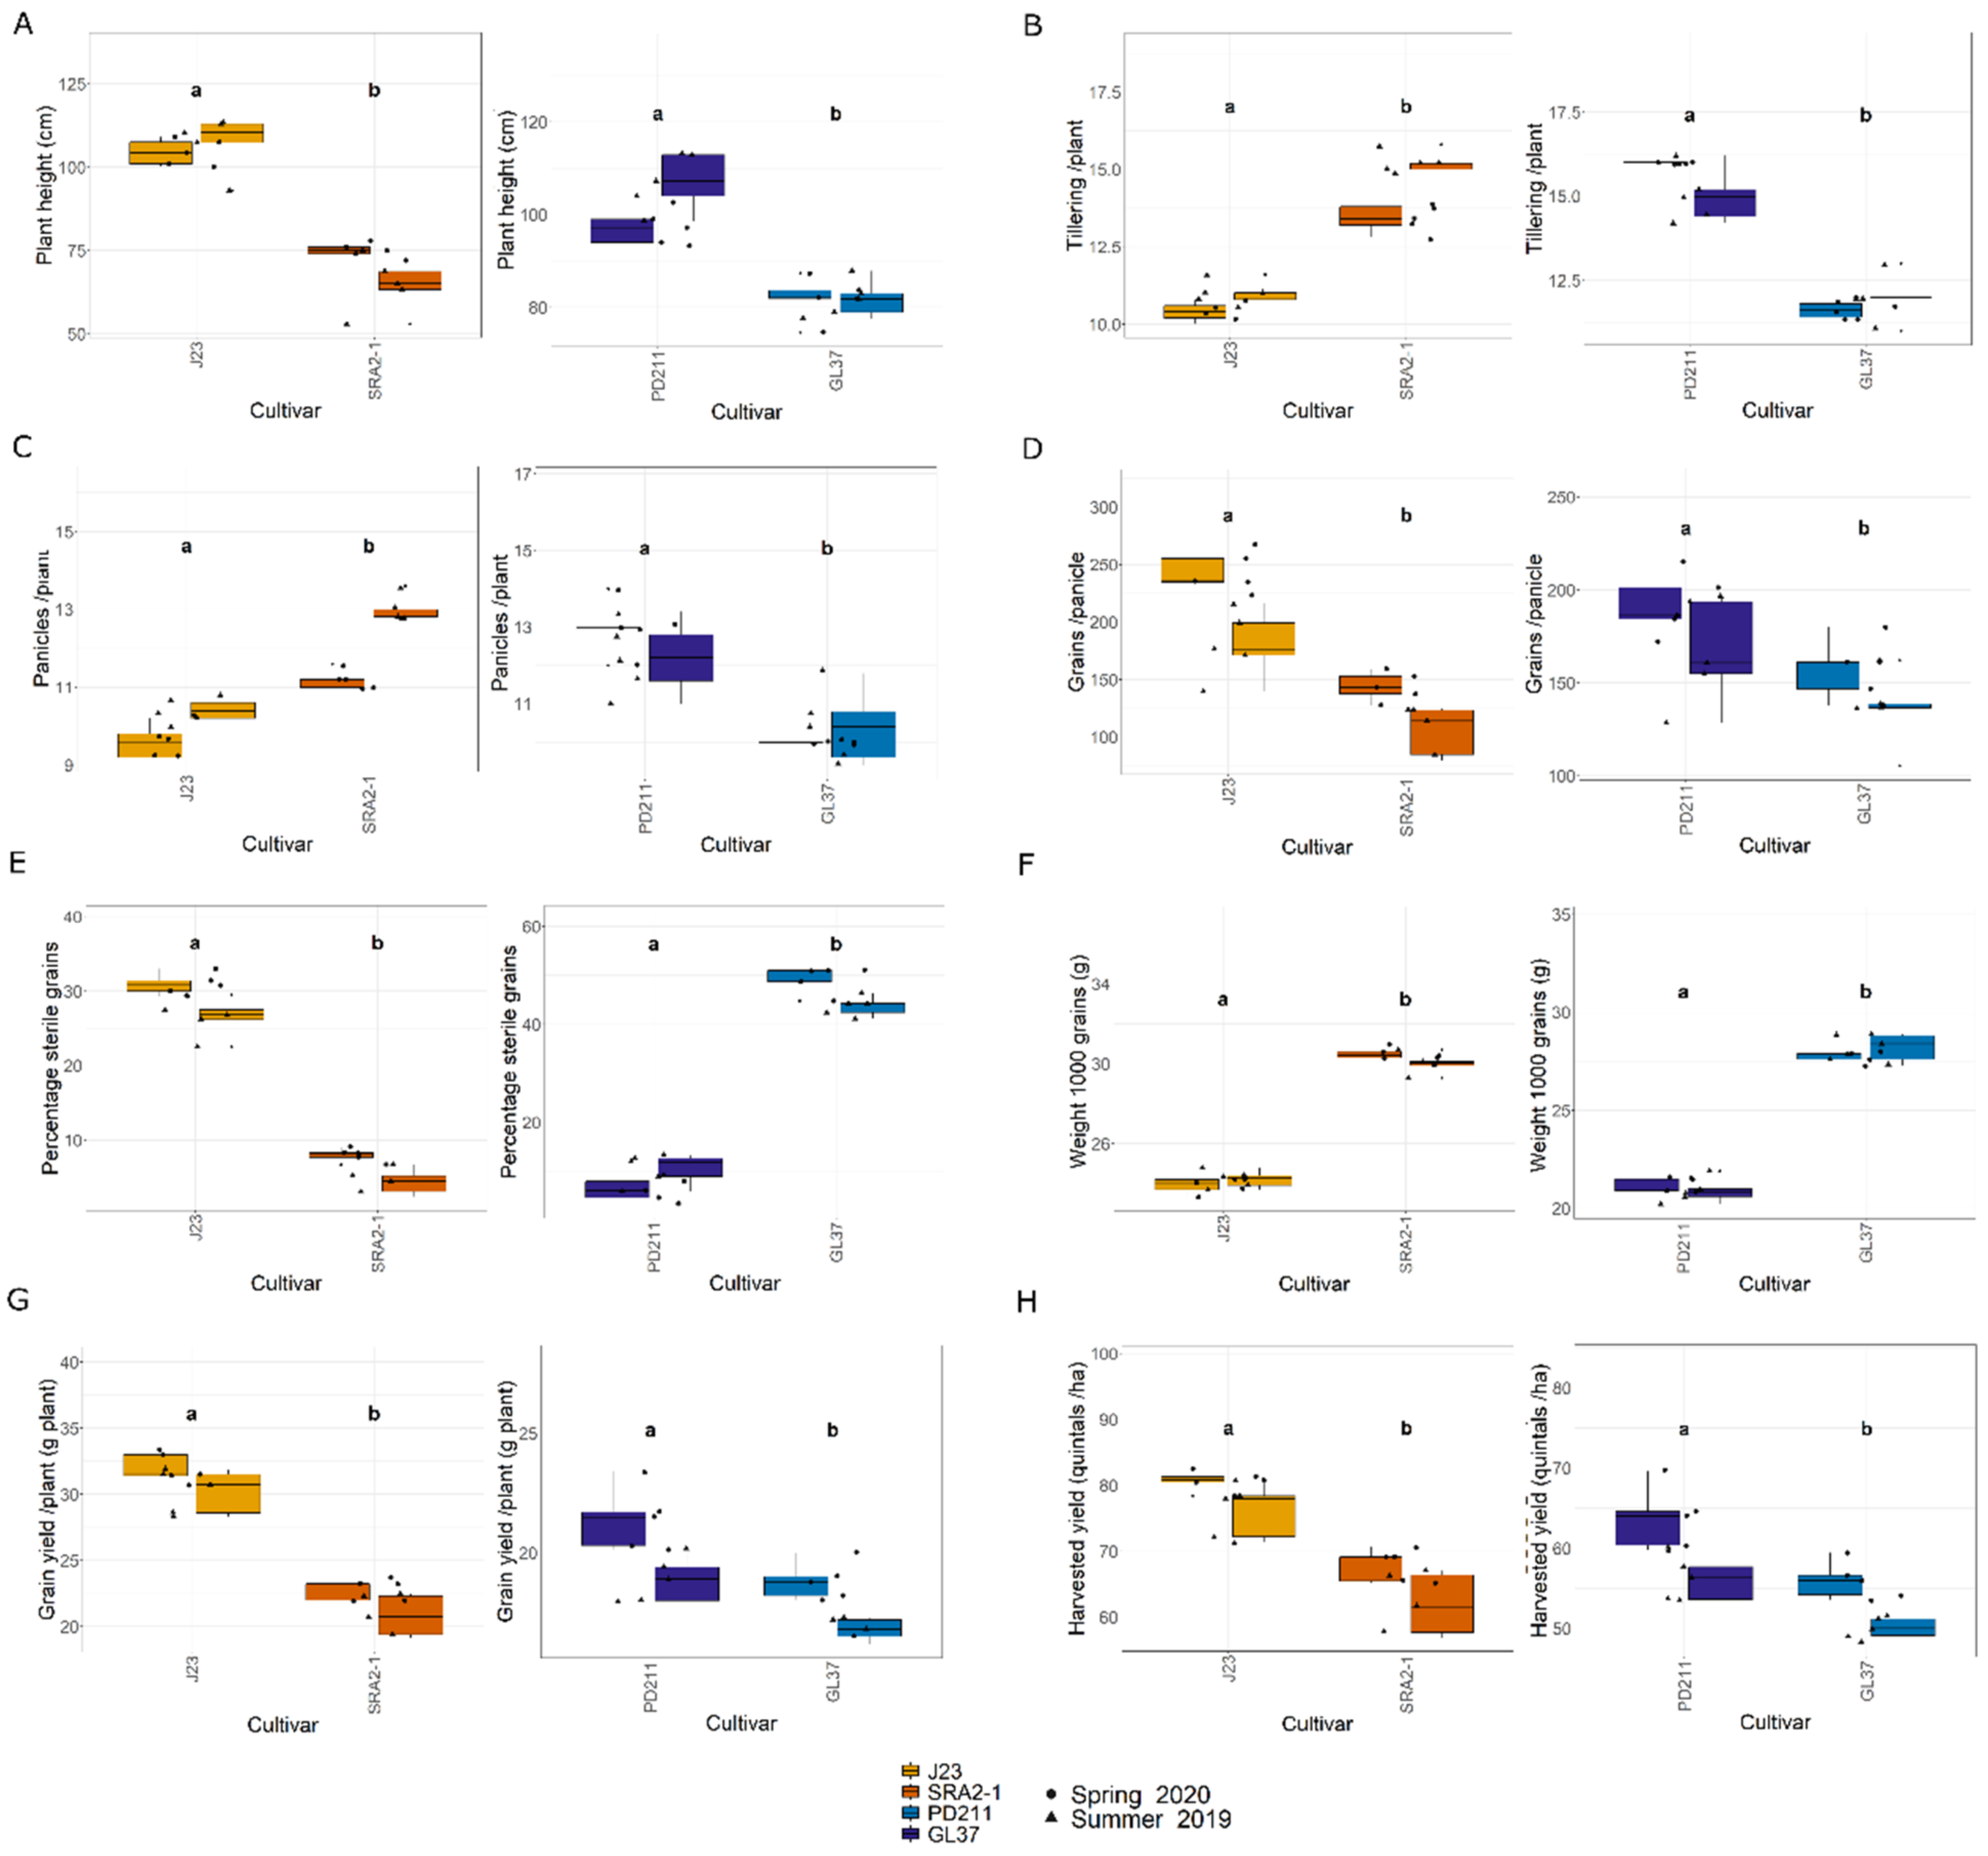
In this study, the flowering times varied significantly between the two groups of rice lines (Figure 1, Table 1 and Table 2). The Japonica variety SRA2-1 displayed a shorter flowering period count on the days from seeding to heading, averaging 76 days, compared to 93 days for J23. Differences in flowering times were also observed within the Indica varieties, with a significantly shorter period for GL37 (78 days) compared to 98 days for PD211 (Figure 1A). There was also a clear distinction when considering maturity time and full growth duration (from seeding to grain maturity) (Figure 1B,C) between the two Japonica lines and the two Indica, indicating a clear genetic distinction in life cycle duration between varieties. When examining yield components, distinct patterns emerged among the varieties. J23, one of the Japonica lines, exhibited the highest yield efficiency, producing the most grains per panicle and achieving the highest grain yield per plant and per hectare (Figure 2, Table 1 and Table 2). This contrasted sharply with SRA2-1, which had the lowest number of grains per panicle among the studied lines. Among the Indica lines, PD211 outperformed GL37 in terms of grain yield both per plant and per hectare, underscoring its potential as a superior parental line for breeding purposes. Only for the Japonica lines, the flowering time showed a positive Spearman correlation with plant height (r(18) = 0.46, p = 0.04) and the percentage of sterile grains (r(18) = 0.74, p = 1.97 × 10⁻⁴) and a negative correlation with the number of panicles per plant (r(18) = −0.74, p = 1.71 × 10⁻⁴) and the number of tillers/plant (r(18) = −0.73, p = 2.317 × 10⁻⁴). However, we observed, for both Indica and Japonica varieties, a positive correlation between the flowering time and grain yield/plant (g/plant) (r(18) = 0.55, p = 0.01; r(18) = 0.84, p = 4.57 × 10⁻⁶, respectively) and between the flowering time and the harvested yield (quintals/ha) (r(18) = 0.45, p = 0.04; r(18) = 0.84, p = 4.47 × 10⁻⁶, respectively). These results highlight the diverse phenotypic traits of the four rice lines, demonstrating that crossing them could yield progenies with varied growth durations and potentially enhanced yield traits. This diversity is essential for the development of rice cultivars that are not only high-yielding but also adapted to varying environmental and climatic conditions. The clear differences in yield components, flowering times, and growth times are instrumental for future molecular breeding strategies, where these traits can be targeted to develop rice varieties with optimized growth characteristics suitable for diverse ecosystems.
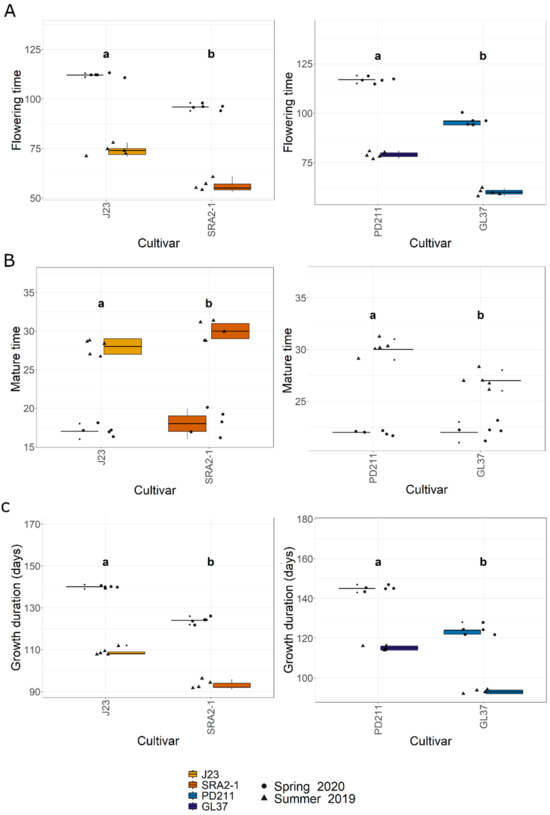
Figure 1.
(A). The flowering time (days) from seeding to heading; (B). The maturity time (days); (C). The growth duration (days) from the seeding to grain ripening of the 4 rice lines used in this study. J23 and SRA2-1 belong to the Japonica group and PD211 and GL37 to the Indica group. Different letters inside the panels indicate statistically significant difference.

Table 1.
The average of phenotypic data in the spring season for each of the 4 varieties. J23 and SRA2-1 belong to the Japonica group and PD211 and GL37 to the Indica group.
Table 2.
The average of phenotypic data in the summer season for each of the 4 varieties. J23 and SRA2-1 belong to the Japonica group and PD211 and GL37 to the Indica group.
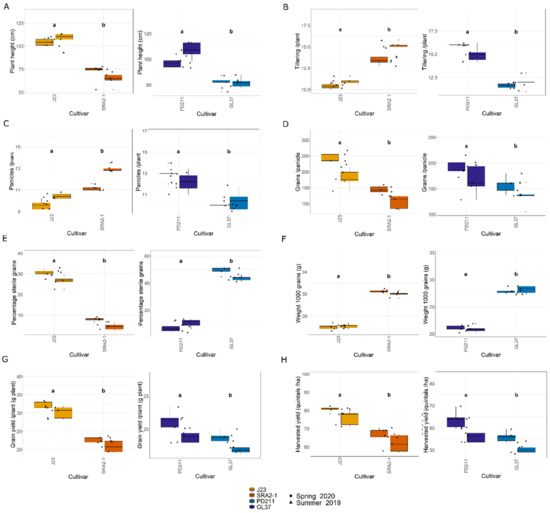
Figure 2.
(A). Plant height (cm); (B). Tillering ability calculated as the number of tillers/plant; (C). The number of panicles/plant; (D). The number of grains/panicle; (E). The percentage of sterile grain; (F). The weight of 1000 grains; (G). Grain yield/plant (g/plant); (H). The harvested yield (quintals/ha) of the 4 rice lines used in this study. J23 and SRA2-1 belong to the Japonica group and PD211 and GL37 to the Indica group. Different letters inside the panels indicate statistically significant difference.
3.2. Genome Statistics
Each genome was assembled into contigs (101,153 to 106,013) (Table 3), which were then polished with PILON [13] and assembled into pseudochromosomes using the Nipponbare chromosome-level genome (Table 3). The pseudochromosome assemblies ranged between 379 Mbp and 384 Mbp in total length, with a percentage of undetermined nucleotides ranging from 19.7% to 23.5% (Table 4) and a coverage >100× for each genome and high completeness reaching between 90.5% and 96.9% (Table 5). The number of gene models ranged from 44,427 to 48,704 with a high percentage (95%) functionally annotated. Gene models and their nomenclature correspondence with the reference gene are indicated in Tables S1–S4. The percentage of TEs in the genome ranged from 28.3% to 30.96% (Table 6).
Table 3.
Statistics of each genome contigs after polishing using Pilon.
Table 4.
The statistics of each genome according to GC%, N50 length, the total length of the genome, and the percentage of underdetermined nucleotides. The genomes were assembled into pseudochromosomes using the Nipponbare IGSRP-1.0 reference.
Table 5.
The BUSCO scores of the genomes of each of the 4 samples.
Table 6.
The number of gene models and the number and percentage of gene models with functional annotation. The total transposable elements are listed according to being long terminal repeat retrotransposons, DNA transposons, or unclassified.
3.3. Similarity between Genomes
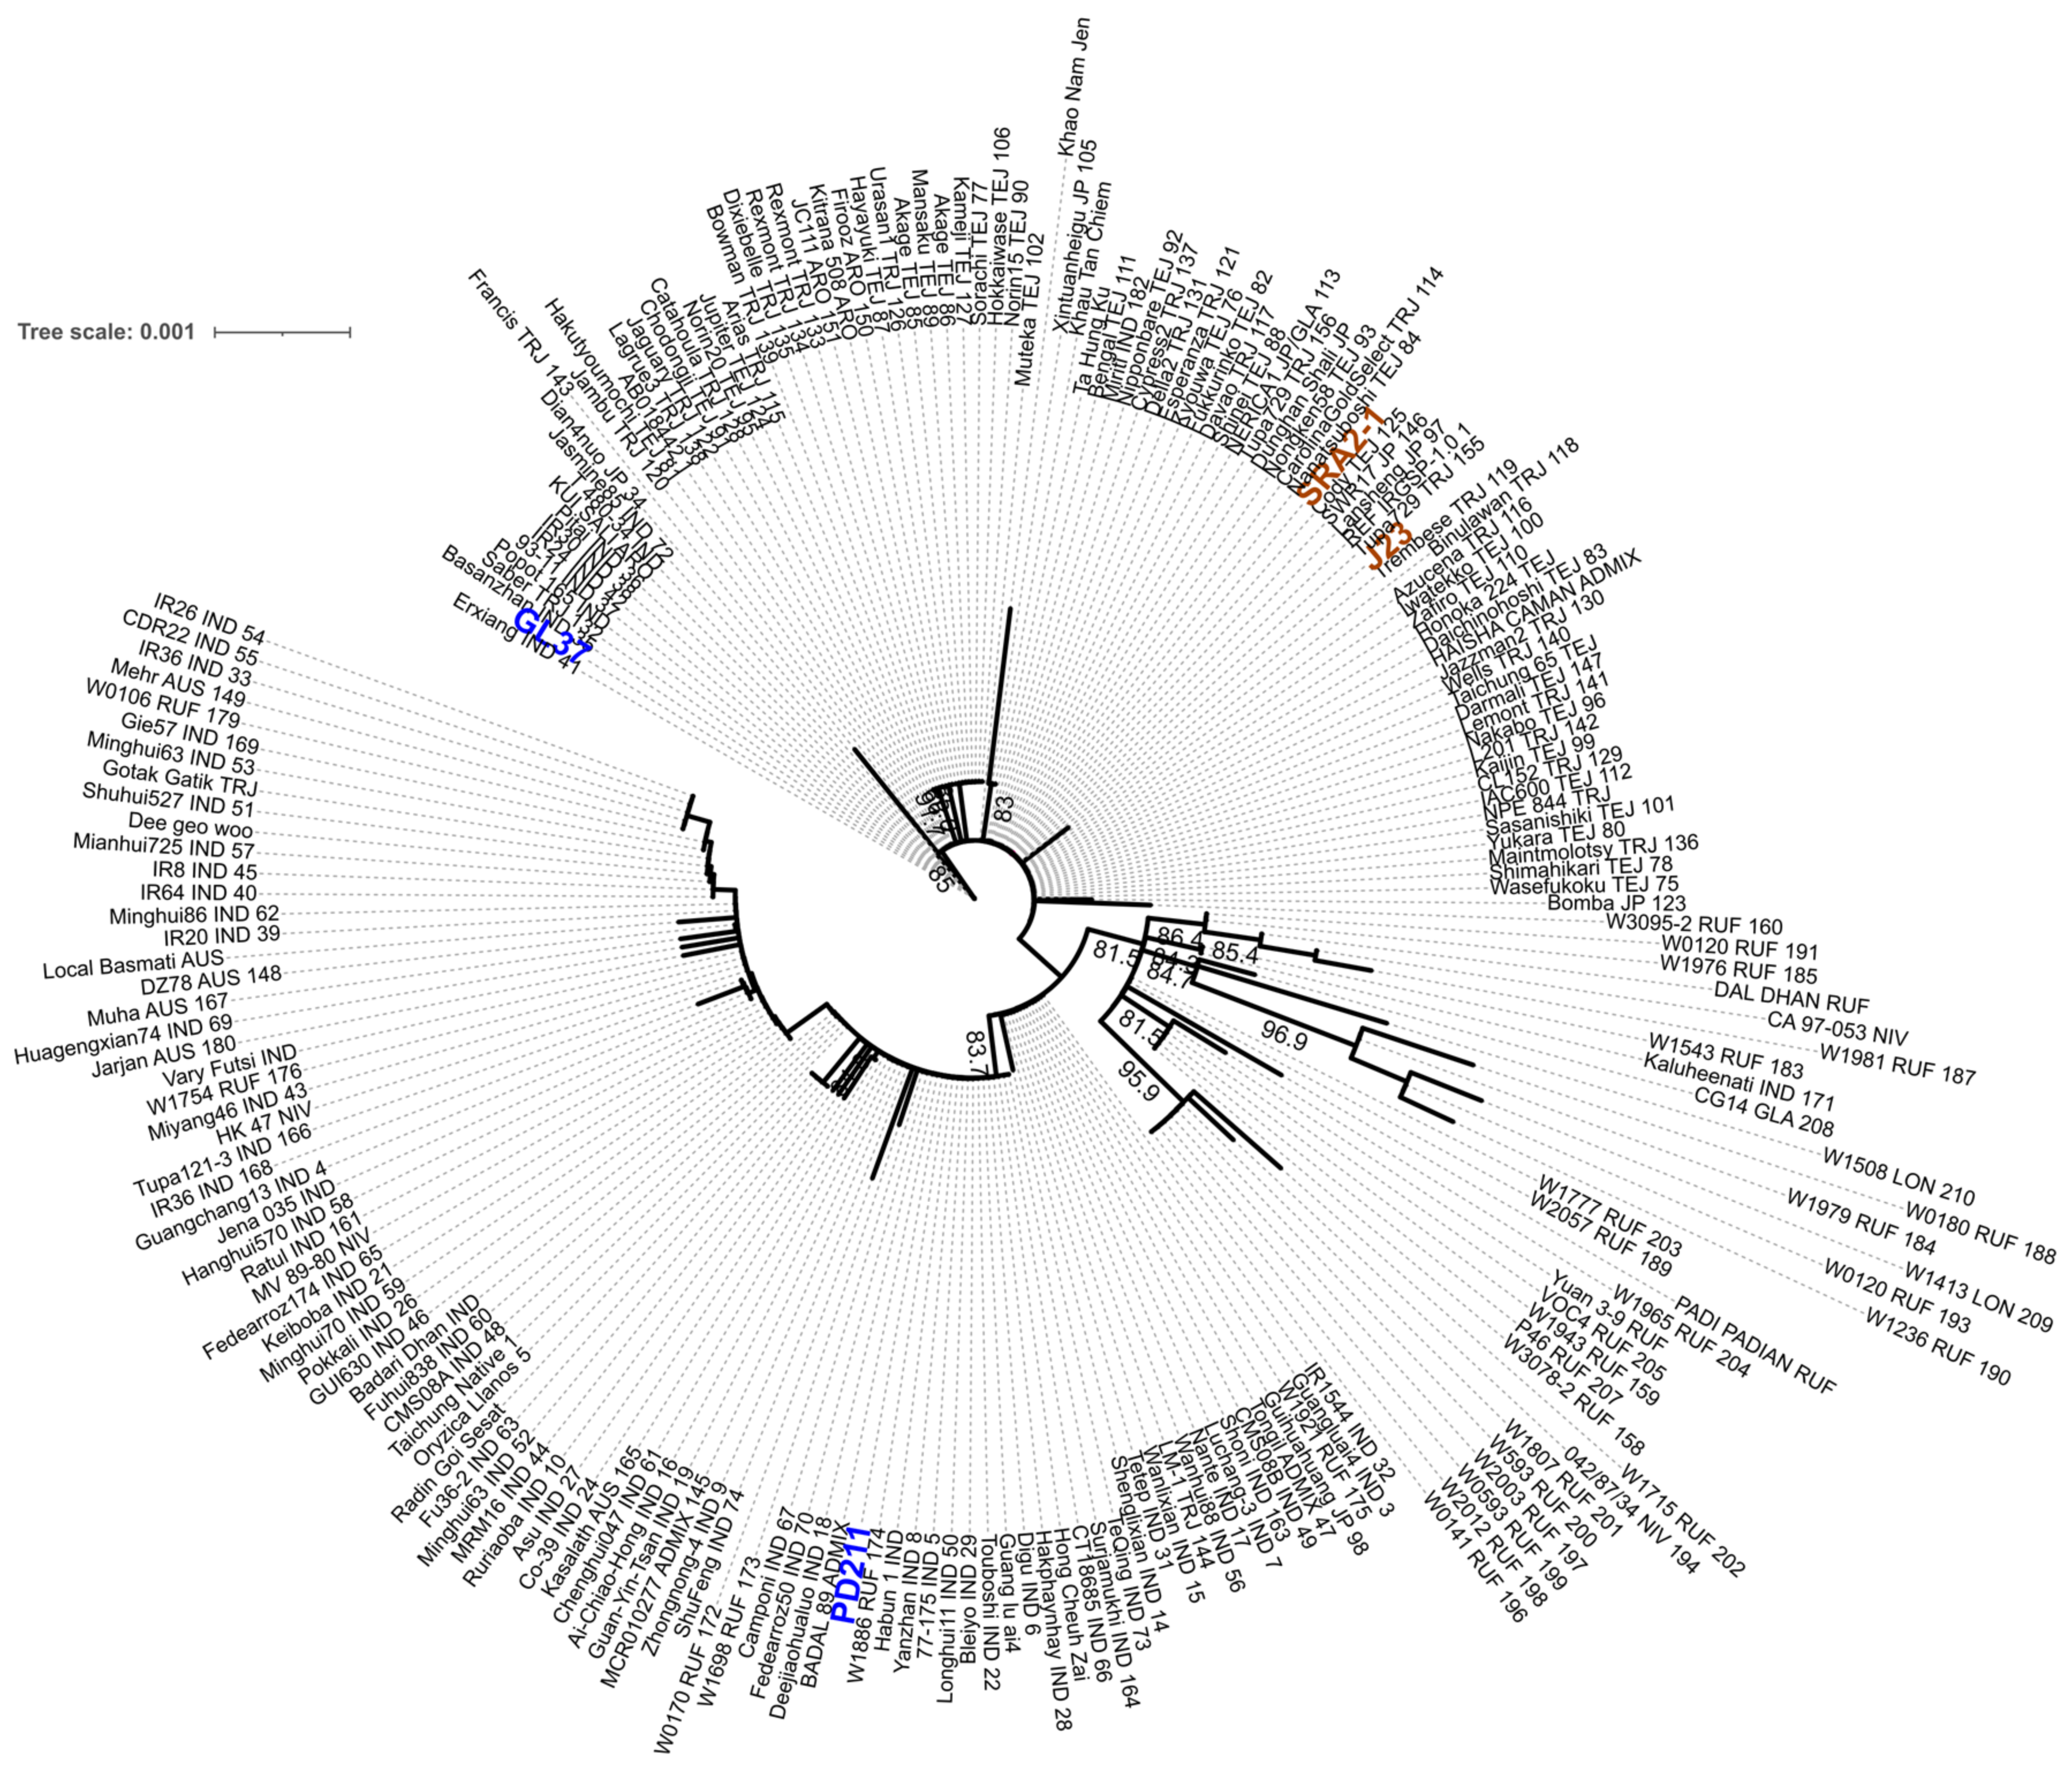
To assess if these four genomes have the potential to be used in breeding programs to obtain high-yielding progeny with shorter life cycles, we first assessed the similarity between the four genomes. We used MASH to estimate the genomic distance in a pairwise analysis. (Table 7) The Japonica genomes SRA2-1 and J23 were more similar (they shared the highest number of hashes 890/1000) than the Indica varieties PD211 and GL37 (Table 5), but overall, this confirmed that the four genomes are sufficiently different to be used for breeding purposes. We also explored if there were differences in gene markers associated with flowering by generating a phylogenetic tree of the gene phytochrome C, an essential light receptor that has proven useful in angiosperm phylogenetic work [10]. The phylogenetic tree clustered together both Japonica lines but grouped the two Indica lines into two clades (Figure 3), suggesting higher diversity, which projects to be useful when breeding.
Table 7.
The pairwise MASH distance between genomes. Shared-hashes reports the similarity between the two genomes.

Figure 3.
The maximum likelihood phylogenetic tree with the model HKY + F + I + R2 constructed from the phytochrome C (phyC) sequence of the 4 genomes assembled in this work and 211 rice accessions retrieved from https://agrigenome.dna.affrc.go.jp/tasuke/ricegenomes/, accessed on 13 March 2024. The rice variety of each of the 211 accessions was indicated as tropical japonica [TRJ], temperate japonica [TEJ], indica [IND], aus [AUS], aromatic [ARO], and admixture [ADM]. J23 and SRA2-1 (orange) belong to the Japonica group and PD211 and GL37 (blue) to the Indica group.
4. Discussion
This study has provided a comprehensive phenotypic and genomic analysis of four Vietnamese rice lines, two Indica (PD211/GL37) and two Japonica (J23/SRA2-1), revealing key insights into their distinct flowering times, yields, and genetic structures. These genomes will assist in breeding by developing markers to facilitate QTL migration in germplasm and guided molecular-assisted breeding. Additionally, these genomes will aid in characterizing all available germplasms at the FCRI breeding center by providing a molecular background on the levels of genomic diversity in these key lines.
Currently, the duration of mainly cultivated rice varieties in the north of Vietnam is around 125–150 days in the spring season and about 100–125 days in the summer season. These four lines are then placed on the extreme ends of the growth duration of cultivated rice, making them ideal for breeding purposes to obtain high-yielding short-duration varieties, which will improve the options for responding to climate change and the need for intensified cultivation.
Progeny of these four lines could have similar desirable phenotypes as some genotypes studied by Won et al. (2020) [34], who reported that three cultivars not only showed early maturity but also higher yields (between 11 to 38%) than the short-duration IRR104, a widely grown rice cultivar in Southeast Asia. Won et al. (2020) [34] also suggested that changes in other phenotypic characteristics, such as increasing the height of the short-life cycle varieties, can relate to higher yields. We observed positive correlations between the flowering time and grain and harvested yields for both of these four Indica and Japonica lines and also between the flowering time and plant height in the Japonica lines, which could also help in breeding for higher yields. Thuy et al. (2022) [35] also reported other positive correlations with other traits, such as the number of tillers/plant, individual dried straw weight, harvest index, spikelet fertility percentage, or panicle length, confirming the importance of considering these phenotypic traits to obtain higher yields in short-life cycle varieties. In addition, despite showing differences between seasons, J23 and SRA2-1 did not underperform during the summer season, despite Japonica lines performing better under cooler conditions while Indica yields are higher in tropical conditions [36], suggesting additional desirable heat tolerance traits in J23 and SRA2-1.
We also obtained high-coverage genome assemblies that identified between 44,427 and 48,704 gene models per genome, with approximately 95% functional annotation coverage, and used them for our comparative genomic analysis, which highlighted more pronounced genetic differentiation within the Indica lines than within the Japonica varieties. Further differentiation is evident from our phylogenetic analysis, where the phyC gene distinctly grouped the Japonica and Indica lines into separate clades, distinct from the Japonica clade that included both lines. This confirms the unique evolutionary trajectories of Indica and Japonica lines and underscores the genetic diversity that influences phenotypic traits, such as the flowering time and yield efficiency. Intriguingly, despite the fact that the phyC gene was used due to it being a useful marker for a phylogenetic analysis in angiosperms [10], it is also known for its role in the rice life cycle, which could make it suggest potential targets for genetic improvement, as null alleles have been associated with shortened flowering times [37].
The phenotypic adaptations of these lines are tightly linked to their genetic backgrounds, with Indica varieties flowering significantly earlier than their Japonica counterparts, yet all lines demonstrated similar total growth durations. Notably, PD211 exhibited superior yield metrics per plant and per hectare compared to GL37, while J23 led in grain production per panicle among the Japonica lines. These insights into the genetic determinants of the yield and flowering times provide valuable tools for advancing rice breeding strategies.
Vietnam, accounting for over 8% of global rice production, faces significant agricultural challenges due to its diverse climatic zones and frequent natural disasters, such as typhoons and floods. The genetic diversity of Vietnamese rice, adapted to these varying conditions, plays a crucial role in national food security. Recent genomic studies, like those by Higgins et al. (2021, 2022) [7,38], have revealed a complex population structure and identified multiple QTLs for traits such as grain size, further emphasizing the genetic richness within the region.
Our targeted breeding strategies, underpinned by detailed genomic and phenotypic data, aim to enhance resilience and yield stability in rice varieties. This approach is crucial in developing new cultivars capable of withstanding the erratic weather patterns of Vietnam. Our extensive genomic analyses, including MASH distance assessments and phylogenetic comparisons with over 200 varieties, have confirmed the distinctiveness of the Japonica and Indica groups, enabling the precise identification of QTLs critical for rice breeding.
Ultimately, this study represents a significant step towards securing rice production in Vietnam against the challenges posed by global environmental changes. By identifying key QTLs, we provide breeders with the tools to select traits that enhance resilience and yield stability, laying a robust foundation for developing rice varieties suited to diverse and harsh climatic conditions. This integrated effort not only contributes to global rice genetic improvement but also bolsters agricultural productivity and sustainability, ensuring food security in climatically vulnerable regions.
Supplementary Materials
The following supporting information can be downloaded at https://www.mdpi.com/article/10.3390/dna4030016/s1, Table S1. The BLAST results between the GL37 genes and IRGSP-1.0. Table S2. The BLAST results between the J23 genes and IRGSP-1.0. Table S3. The BLAST results between the PD211 genes and IRGSP-1.0. Table S4. The BLAST results between the SRA2-1 genes and IRGSP-1.0.
Author Contributions
S.F.O.: genomics, writing and draft preparation; L.T.T. (Luu Thi Thuy): rice generation and maintenance, writing and draft preparation; N.T.K.: rice generation and maintenance; L.T.H.: rice generation and maintenance; T.T.Y.: rice generation and maintenance; L.T.N.: rice generation and maintenance; L.T.T. (Le Thi Thanh): rice generation and maintenance P.T.T.: rice generation and maintenance; X.O.: genomics; W.T.: genomics; S.J.: genomics; L.G.: genomics; A.M.D.: project coordination; L.D.G.: project administration; A.L.H.: project administration and genomics; S.J.M.-M. (deceased): funding acquisition, project administration; D.X.T.: rice generation and maintenance; S.J.D.: funding acquisition, project administration, review, editing. All authors have read and agreed to the published version of the manuscript.
Funding
This project was funded by the Royal Society Global Challenges Research Fund (GCRF), grant ICA\R1\180130: Improving food security and adaptation to climate change in Northern Vietnam by developing rapid-maturation rice varieties. Additional support is from the BBSRC BB/V006665/1, the National Natural Science Foundation of China (32270250), and the National Science Foundation of Fujian Province of China (2022J02004).
Institutional Review Board Statement
Not applicable.
Informed Consent Statement
Not applicable.
Data Availability Statement
The genomes are available under the NCBI BioProject: PRJNA1075498, including raw data, genome assemblies, and annotations. Genomes with full annotation are available here: https://webfiles.york.ac.uk/Harper/Oryza_sativa/, accessed on 19 July 2024. Scripts used in this study can be found in https://github.com/sfortega/Rice_genomes, accessed on 19 July 2024.
Acknowledgments
This project was undertaken on the University of York High-Performance Computing service: Viking and Viking2. The authors would like to thank the Bioscience Technology Facility at the University of York for assistance.
Conflicts of Interest
The authors declare no conflicts of interest.
References
- FAOSTAT. Available online: https://www.fao.org/faostat/en/#data/QCL (accessed on 9 February 2024).
- Wang, W.; Mauleon, R.; Hu, Z.; Chebotarov, D.; Tai, S.; Wu, Z.; Li, M.; Zheng, T.; Fuentes, R.R.; Zhang, F.; et al. Genomic Variation in 3,010 Diverse Accessions of Asian Cultivated Rice. Nature 2018, 557, 43–49. [Google Scholar] [CrossRef] [PubMed]
- Garris, A.J.; Tai, T.H.; Coburn, J.; Kresovich, S.; McCouch, S. Genetic Structure and Diversity in Oryza sativa L. Genetics 2005, 169, 1631–1638. [Google Scholar] [CrossRef]
- Glaszmann, J.C. Isozymes and Classification of Asian Rice Varieties. Theor. Appl. Genet. 1987, 74, 21–30. [Google Scholar] [CrossRef] [PubMed]
- FAO. The Contribution of Plant Genetic Resources for Food and Agriculture to Food Security and Sustainable Agricultural Development. In The Second Report on the State of the World’s Plant Genetic Resources for Food and Agriculture; FAO: Rome, Italy, 2010; pp. 182–201. [Google Scholar]
- Li, Z.; Fu, B.Y.; Gao, Y.M.; Wang, W.S.; Xu, J.L.; Zhang, F.; Zhao, X.Q.; Zheng, T.Q.; Zhou, Y.L.; Zhang, G.; et al. The 3,000 Rice Genomes Project. Gigascience 2014, 3, 7. [Google Scholar] [CrossRef] [PubMed]
- Higgins, J.; Santos, B.; Khanh, T.D.; Trung, K.H.; Duong, T.D.; Doai, N.T.P.; Khoa, N.T.; Ha, D.T.T.; Diep, N.T.; Dung, K.T.; et al. Resequencing of 672 Native Rice Accessions to Explore Genetic Diversity and Trait Associations in Vietnam. Rice 2021, 14, 52. [Google Scholar] [CrossRef] [PubMed]
- Cao, T.M.; Lee, S.H.; Lee, J.Y. The Impact of Natural Disasters and Pest Infestations on Technical Efficiency in Rice Production: A Study in Vietnam. Sustainability 2023, 15, 11633. [Google Scholar] [CrossRef]
- General Statistics Office. Available online: https://www.gso.gov.vn/en/data-and-statistics/2024/07/statistical-yearbook-of-2023/ (accessed on 18 July 2024).
- Mathews, S.; Donoghue, M.J. The Root of Angiosperm Phylogeny Inferred from Duplicate Phytochrome Genes. Science 1999, 286, 947–950. [Google Scholar] [CrossRef]
- BBMap Guide—DOE Joint Genome Institute. Available online: https://jgi.doe.gov/data-and-tools/software-tools/bbtools/bb-tools-user-guide/bbmap-guide/ (accessed on 2 January 2024).
- Prjibelski, A.; Antipov, D.; Meleshko, D.; Lapidus, A.; Korobeynikov, A. Using SPAdes De Novo Assembler. Curr. Protoc. Bioinform. 2020, 70, e102. [Google Scholar] [CrossRef] [PubMed]
- Walker, B.J.; Abeel, T.; Shea, T.; Priest, M.; Abouelliel, A.; Sakthikumar, S.; Cuomo, C.A.; Zeng, Q.; Wortman, J.; Young, S.K.; et al. Pilon: An Integrated Tool for Comprehensive Microbial Variant Detection and Genome Assembly Improvement. PLoS ONE 2014, 9, e112963. [Google Scholar] [CrossRef]
- Minkin, I.; Medvedev, P. Scalable Multiple Whole-Genome Alignment and Locally Collinear Block Construction with SibeliaZ. Nat. Commun. 2020, 11, 6327. [Google Scholar] [CrossRef]
- Kolmogorov, M.; Raney, B.; Paten, B.; Pham, S. Ragout—A Reference-Assisted Assembly Tool for Bacterial Genomes. Bioinformatics 2014, 30, i302–i309. [Google Scholar] [CrossRef] [PubMed]
- Kolmogorov, M.; Armstrong, J.; Raney, B.J.; Streeter, I.; Dunn, M.; Yang, F.; Odom, D.; Flicek, P.; Keane, T.M.; Thybert, D.; et al. Chromosome Assembly of Large and Complex Genomes Using Multiple References. Genome Res. 2018, 28, 1720–1732. [Google Scholar] [CrossRef] [PubMed]
- Manni, M.; Berkeley, M.R.; Seppey, M.; Zdobnov, E.M. BUSCO: Assessing Genomic Data Quality and Beyond. Curr. Protoc. 2021, 1, e323. [Google Scholar] [CrossRef] [PubMed]
- Flynn, J.M.; Hubley, R.; Goubert, C.; Rosen, J.; Clark, A.G.; Feschotte, C.; Smit, A.F. RepeatModeler2 for Automated Genomic Discovery of Transposable Element Families. Proc. Natl. Acad. Sci. USA 2020, 117, 9451–9457. [Google Scholar] [CrossRef] [PubMed]
- Brůna, T.; Hoff, K.J.; Lomsadze, A.; Stanke, M.; Borodovsky, M. BRAKER2: Automatic Eukaryotic Genome Annotation with GeneMark-EP+ and AUGUSTUS Supported by a Protein Database. NAR Genom. Bioinform. 2021, 3, lqaa108. [Google Scholar] [CrossRef] [PubMed]
- Zdobnov, E.M.; Kuznetsov, D.; Tegenfeldt, F.; Manni, M.; Berkeley, M.; Kriventseva, E.V. OrthoDB in 2020: Evolutionary and Functional Annotations of Orthologs. Nucleic Acids Res. 2021, 49, 389–393. [Google Scholar] [CrossRef] [PubMed]
- Huerta-Cepas, J.; Szklarczyk, D.; Heller, D.; Hernández-Plaza, A.; Forslund, S.K.; Cook, H.; Mende, D.R.; Letunic, I.; Rattei, T.; Jensen, L.J.; et al. EggNOG 5.0: A Hierarchical, Functionally and Phylogenetically Annotated Orthology Resource Based on 5090 Organisms and 2502 Viruses. Nucleic Acids Res. 2019, 47, 309–314. [Google Scholar] [CrossRef] [PubMed]
- Cantalapiedra, C.P.; Hernández-Plaza, A.; Letunic, I.; Bork, P.; Huerta-Cepas, J. EggNOG-Mapper v2: Functional Annotation, Orthology Assignments, and Domain Prediction at the Metagenomic Scale. Mol. Biol. Evol. 2021, 38, 5825–5829. [Google Scholar] [CrossRef] [PubMed]
- Caballero, M.; Wegrzyn, J. GFACs: Gene Filtering, Analysis, and Conversion to Unify Genome Annotations Across Alignment and Gene Prediction Frameworks. Genom. Proteom. Bioinform. 2019, 17, 305. [Google Scholar] [CrossRef]
- Hart, A.J.; Ginzburg, S.; Xu, M.; Fisher, C.R.; Rahmatpour, N.; Mitton, J.B.; Paul, R.; Wegrzyn, J.L. EnTAP: Bringing Faster and Smarter Functional Annotation to Non-Model Eukaryotic Transcriptomes. Mol. Ecol. Resour. 2020, 20, 591–604. [Google Scholar] [CrossRef]
- Ou, S.; Su, W.; Liao, Y.; Chougule, K.; Agda, J.R.A.; Hellinga, A.J.; Lugo, C.S.B.; Elliott, T.A.; Ware, D.; Peterson, T.; et al. Benchmarking Transposable Element Annotation Methods for Creation of a Streamlined, Comprehensive Pipeline. Genome Biol. 2019, 20, 275. [Google Scholar] [CrossRef] [PubMed]
- Ondov, B.D.; Treangen, T.J.; Melsted, P.; Mallonee, A.B.; Bergman, N.H.; Koren, S.; Phillippy, A.M. Mash: Fast Genome and Metagenome Distance Estimation Using MinHash. Genome Biol. 2016, 17, 132. [Google Scholar] [CrossRef] [PubMed]
- Katoh, K.; Standley, D.M. MAFFT Multiple Sequence Alignment Software Version 7: Improvements in Performance and Usability. Mol. Biol. Evol. 2013, 30, 772. [Google Scholar] [CrossRef] [PubMed]
- Capella-Gutiérrez, S.; Silla-Martínez, J.M.; Gabaldón, T. TrimAl: A Tool for Automated Alignment Trimming in Large-Scale Phylogenetic Analyses. Bioinformatics 2009, 25, 1972–1973. [Google Scholar] [CrossRef] [PubMed]
- Nguyen, L.T.; Schmidt, H.A.; Von Haeseler, A.; Minh, B.Q. IQ-TREE: A Fast and Effective Stochastic Algorithm for Estimating Maximum-Likelihood Phylogenies. Mol. Biol. Evol. 2015, 32, 268. [Google Scholar] [CrossRef] [PubMed]
- Kalyaanamoorthy, S.; Minh, B.Q.; Wong, T.K.F.; Von Haeseler, A.; Jermiin, L.S. ModelFinder: Fast Model Selection for Accurate Phylogenetic Estimates. Nat. Methods 2017, 14, 587–589. [Google Scholar] [CrossRef]
- Hasegawa, M.; Kishino, H.; Yano, T. aki Dating of the Human-Ape Splitting by a Molecular Clock of Mitochondrial DNA. J. Mol. Evol. 1985, 22, 160–174. [Google Scholar] [CrossRef] [PubMed]
- Yang, Z. A Space-Time Process Model for the Evolution of DNA Sequences. Genetics 1995, 139, 993–1005. [Google Scholar] [CrossRef]
- Soubrier, J.; Steel, M.; Lee, M.S.Y.; Der Sarkissian, C.; Guindon, S.; Ho, S.Y.W.; Cooper, A. The Influence of Rate Heterogeneity among Sites on the Time Dependence of Molecular Rates. Mol. Biol. Evol. 2012, 29, 3345–3358. [Google Scholar] [CrossRef]
- Won, P.L.P.; Liu, H.; Banayo, N.P.M.; Nie, L.; Peng, S.; Islam, M.R.; Cruz, P.S.; Collard, B.C.Y.; Kato, Y. Identification and Characterization of High-yielding, Short-duration Rice Genotypes for Tropical Asia. Crop. Sci. 2020, 60, 2241. [Google Scholar] [CrossRef]
- Thúy, L.T.; Vu, T.-N.; Pham, V.-T.; Nguyen, A.-D.; Nguyen, T.-K. Variability, Correlation and Path Analysis for Several Quantitative Traits Derived Multi-Parent Advanced Generation Inter-Cross (Magic) F2 Population of Rice (Oryza sativa L.). Int. J. Sci. Res. Manag. 2022, 10, 356–363. [Google Scholar] [CrossRef]
- Jing, Q.; Spiertz, J.H.J.; Hengsdijk, H.; Van Keulen, H.; Cao, W.; Dai, T. Adaptation and Performance of Rice Genotypes in Tropical and Subtropical Environments. NJAS 2010, 57, 149–157. [Google Scholar] [CrossRef]
- Li, B.; Du, X.; Fei, Y.; Wang, F.; Xu, Y.; Li, X.; Li, W.; Chen, Z.; Fan, F.; Wang, J.; et al. Efficient Breeding of Early-Maturing Rice Cultivar by Editing PHYC via CRISPR/Cas9. Rice 2021, 14, 86. [Google Scholar] [CrossRef] [PubMed]
- Higgins, J.; Santos, B.; Khanh, T.D.; Trung, K.H.; Duong, T.D.; Doai, N.T.P.; Hall, A.; Dyer, S.; Ham, L.H.; Caccamo, M.; et al. Genomic Regions and Candidate Genes Selected during the Breeding of Rice in Vietnam. Evol. Appl. 2022, 15, 1141. [Google Scholar] [CrossRef] [PubMed]

Disclaimer/Publisher’s Note: The statements, opinions and data contained in all publications are solely those of the individual author(s) and contributor(s) and not of MDPI and/or the editor(s). MDPI and/or the editor(s) disclaim responsibility for any injury to people or property resulting from any ideas, methods, instructions or products referred to in the content. |
© 2024 by the authors. Licensee MDPI, Basel, Switzerland. This article is an open access article distributed under the terms and conditions of the Creative Commons Attribution (CC BY) license (https://creativecommons.org/licenses/by/4.0/).