Article

Carbon Dioxide Fluxes Associated with Prokaryotic and Eukaryotic Communities in Ice-Free Areas on King George Island, Maritime Antarctica

by
Luiz H. Rosa
1,*,
Vívian N. Gonçalves
1,
Débora Luiza Costa Barreto
1,
Marcio Rocha Francelino
2,
Clara Glória Oliveira Baldi
2,
Danilo Cesar Mello
3,
Kárita C. R. Santos
4,
Fabyano A. C. Lopes
4,
Micheline Carvalho-Silva
5,
Peter Convey
6,7,8,9 and
Paulo E. A. S. Câmara
4,10
1
Laboratório de Microbiologia Polar e Conexões Tropicais, Departamento de Microbiologia, Universidade Federal de Minas Gerais, P.O. Box 486, Belo Horizonte 31270, Brazil
2
Departamento de Solos, Universidade Federal de Viçosa, Viçosa 36570, Brazil
3
Departamento de Solos, Escola Superior de Agricultura Luiz de Queiroz/USP, Piracicaba 13418, Brazil
4
Laboratório de Microbiologia, Universidade Federal do Tocantins, Porto Nacional 77402, Brazil
5
Departamento de Botânica, Universidade de Brasília, Brasília 71966, Brazil
6
British Antarctic Survey, NERC, High Cross, Madingley Road, Cambridge CB3 0ET, UK
7
Department of Zoology, University of Johannesburg, P.O. Box 524, Auckland Park 2006, South Africa
8
Millennium Institute Biodiversity of Antarctic and Subantarctic Ecosystems (BASE), Santiago 8331150, Chile
9
School of Biosciences, University of Birmingham, Edgbaston, Birmingham B15 2TT, UK
10
Programa de Pós-Graduação em Algas Fungos e Plantas, UFSC, Florianópolis 88000, Brazil
*
Author to whom correspondence should be addressed.
Submission received: 21 December 2024 / Revised: 31 January 2025 / Accepted: 5 March 2025 / Published: 10 March 2025

Abstract

:
Background and Methods: We assessed the prokaryotic and eukaryotic diversity present in non-vegetated and vegetated soils on King George Island, Maritime Antarctic, in combination with measurements of carbon dioxide fluxes. Results: For prokaryotes, 381 amplicon sequence variants (ASVs) were assigned, dominated by the phyla Actinobacteriota, Acidobacteriota, Pseudomonadota, Chloroflexota, and Verrucomicrobiota. A total of 432 eukaryotic ASVs were assigned, including representatives from seven kingdoms and 21 phyla. Fungi dominated the eukaryotic communities, followed by Viridiplantae. Non-vegetated soils had higher diversity indices compared with vegetated soils. The dominant prokaryotic ASV in non-vegetated soils was Pyrinomonadaceae sp., while Pseudarthrobacter sp. dominated vegetated soils. Mortierella antarctica (Fungi) and Meyerella sp. (Viridiplantae) were dominant eukaryotic taxa in the non-vegetated soils, while Lachnum sp. (Fungi) and Polytrichaceae sp. (Viridiplantae) were dominant in the vegetated soils. Measured CO2 fluxes indicated that the net ecosystem exchange values measured in vegetated soils were lower than ecosystem respiration in non-vegetated soils. However, the total flux values indicated that the region displayed positive ecosystem respiration values, suggesting that the soils may represent a source of CO2 in the atmosphere. Conclusions: Our study revealed the presence of rich and complex communities of prokaryotic and eukaryotic organisms in both soil types. Although non-vegetated soils demonstrated the highest levels of diversity, they had lower CO2 fluxes than vegetated soils, likely reflecting the significant biomass of photosynthetically active plants (mainly dense moss carpets) and their resident organisms. The greater diversity detected in exposed soils may influence future changes in CO2 flux in the studied region, for which comparisons of non-vegetated and vegetated soils with different microbial diversities are needed. This reinforces the necessity for studies to monitor the impact of resident biota on CO2 flux in different areas of Maritime Antarctica, a region strongly impacted by climatic changes.

Graphical Abstract

1. Introduction

Antarctica hosts a variety of soil ecosystems, which face large and rapid variation in temperature and water content, exposure to high levels of solar (including ultra-violet) radiation, and typically low nutrient availability that ranges from moderate to ultra-oligotrophic [1]. However, locally eutrophic nutrient levels can be present, especially close to vertebrate aggregations [2]. Despite the typically extreme conditions, Antarctic soils often contain considerable microbial biodiversity, offering unique opportunities for ecological studies of the consequences of regional and global environmental change [3,4,5,6,7].
Soil development and properties vary widely across the different ice-free regions of Antarctica, based on the underlying geology, abiotic and biotic weathering processes, environmental conditions, and the biodiversity present [8]. They host all major microbial groups (bacteria, archaea, microalgae, and fungi), microinvertebrates (protozoans, nematodes, rotifers, and tardigrades), and microarthropods (mites and springtails), as well as providing an important substratum for Antarctica’s dominant cryptogamic vegetation (bryophytes, lichens, and macroscopic algae) and the continent’s two native flowering plant species [9]. Soils on the Keller Peninsula, located in Admiralty Bay (King George Island, South Shetland Islands, Maritime Antarctic) are commonly acid–sulphate soils, which are known as ‘yellow points’ due to their yellow–orange colour, which is produced by the oxidation reactions of the sulphides present in the local geology (andesites) [8,9]. These acid–sulphate soils are typically oligotrophic and have high concentrations of sulphides [10]. Sulphides can affect the resident soil microbiota and their enzymatic activities, with consequential impacts on the soil structure, nutrient cycling, and organic matter decomposition [11].
Globally, carbon dioxide (CO2) release from soils represents one of the major contributions to the global carbon cycle [12]. Small changes in these CO2 emissions can significantly influence atmospheric CO2 concentration [13]. In the polar regions, soil temperature variation is considered the primary controlling factor of temporal and spatial variability in soil CO2 emissions [14]. The Maritime Antarctic (which includes the western Antarctic Peninsula region and Scotia Arc archipelagos) hosts extreme environments and terrestrial habitats that have been strongly impacted by regional climatic changes since the mid-twentieth century, and their ecosystems are highly sensitive to environmental change [15,16].
Antarctic soils, therefore, provide a potentially important resource with which to address questions about the relationships between temperature increase, CO2 uptake and release, and flux changes over time [17]. They offer opportunities to investigate the regional-to-global influence of their microbial community structure and function on climatic changes and vice versa [3,7,18,19]. In this study, we applied a DNA metabarcoding approach to detect and characterize the prokaryotic and eukaryotic communities of vegetated and non-vegetated soils on Keller Peninsula (King George Island, South Shetland Islands), relating these findings to measures of CO2 flux carried out at the same locations.

2. Methods

2.1. Study Areas

Seven locations on the Keller Peninsula (King George Island, South Shetland Islands, Maritime Antarctic; 62°5′23.695″ S; 58°24′24.162″ W) were selected for soil sampling during the austral summer in February 2022 (Figure 1). Three sites (1–3) comprised exposed soils at an altitude of 13.6 m a.s.l., which were characterized as very gravelly (Leptosol skeletic) and with no vegetation cover. The underlying geology comprises basalt and andesite, forming a scree slope. Four sites (4–7) comprised vegetated soils at an altitude of 49.3 m a.s.l, with a plant community mainly consisting of carpet-forming mosses (mostly Sanionia uncinata and Polytrichastrum alpinum), small plants of the angiosperms Deschampsia antarctica and Colobanthus quitensis, and the foliose lichen Usnea antarctica growing on rock fragments.

2.2. Soil Sampling

Seven soil samples were collected, one from each study location—three from non-vegetated areas (sampled to 10 cm depth below the surface) and four from vegetated areas (sampled to 10 cm depth below the vegetation). Approximately 500 g of each sample was then immediately sub-sampled (in triplicate), sealed, placed in sterile Whirl-pack bags, and frozen at −20 °C until processing in the laboratory at the Federal University of Minas Gerais, Brazil. There, the samples were gradually thawed at 4 °C for 24 h before DNA extraction.

2.3. DNA Extraction, Data Analyses, and Organism Identification

The three sub-samples from each of the seven sites were processed separately to recover the total prokaryotic and eukaryotic DNA. Total DNA was extracted using the FastDNA Spin Kit for Soil (MPBIO, Solon, OH, USA), following the manufacturer’s instructions. Extracted DNA was used as template for generating PCR-amplicons. For the eukaryotic groups of plants, invertebrates, and fungi, the internal transcribed spacer 2 (ITS2) of the nuclear ribosomal DNA was used as a DNA barcode for molecular species identification [20,21]. PCR-amplicons were generated using the universal primers ITS3 and ITS4 [22]. For prokaryotes, we used the 16S rRNA gene V3–V4 region, and primers 341F and 805R [23,24]. The amplicons obtained were subjected to high-throughput sequencing at Macrogen Inc. (Seoul, Republic of Korea) on an Illumina MiSeq sequencer (3 × 300 bp), using the MiSeq Reagent Kit v3 (600-cycle), following the manufacturer’s protocol. Raw fastq files were filtered using BBDuk version 38.87 (BBMap) [25], with the following parameters: Illumina adapters removing (Illumina artefacts and the PhiX Control v3 Library); ktrim = l; k = 23; mink = 11; hdist = 1; minlen = 50; tpe; tbo; qtrim = rl; trimq = 20; ftm = 5; and maq = 20. The remaining sequences were imported to QIIME2 version 2022.2 for bioinformatics analyses [26]. For fungi, the qiime2-dada2 plugin (a complete pipeline) was used for filtering, dereplication, merging paired-end fastq files, and the removal of chimeras [27]. Taxonomic assignments were determined for amplicon sequence variants (ASVs) using the qiime2 feature classifier [28] classify-sklearn against the SILVA 138 Ref NR 99 for bacteria, the UNITE database version 10.0 for fungi and invertebrates [29], and the PLANiTS2 database for plants and microalgae [30], which was trained with Naive Bayes classifier and a confidence threshold of 98.5%. The remaining unclassified ASVs were filtered and aligned against the National Center for Biotechnological Information (NCBI) nonredundant nucleotide sequences (nt) database (August 2024) using BLASTn with default parameters. Krona [31] was used for generating taxonomic profiles. Sequences were submitted to GenBank database under the accession numbers SAMN44524491-SAMN44524508.
Many factors, including extraction, PCR, and primer bias, as well as the number of 16S (or ITS) sequences per genome, can affect the number of reads obtained [32], and thus lead to the misinterpretation of abundance [33]. However, Giner et al. [34] concluded that such biases did not affect the proportionality between reads and cell abundance, implying that more reads are linked with higher abundance [35,36]. Therefore, for comparative purposes, we used the number of reads as a proxy for relative abundance.

2.4. Diversity Indices

The number of DNA reads was used to quantify the prokaryotic and eukaryotic taxa (assigned ASVs) present in the samples, with taxon diversity, richness, and dominance described using (i) Fisher’s α, (ii) Margalef’s, and (iii) Simpson’s indices, respectively. Organism ASVs with a relative abundance > 1% were considered dominant, while those with <1% were considered as minor (rare) components of the fungal community [37]. Species accumulation curves were generated using the Mao Tao index. All results were obtained with 95% confidence, and bootstrap values were calculated from 1000 replicates using PAST 1.90 [38]. Venn diagrams were prepared following Bardou et al. [39] to visualize the assemblages present in the different sampling areas.

2.5. Carbon Dioxide Flux

Carbon dioxide (CO2) fluxes were measured in two reference areas—one with exposed soil and the other with vegetated soil. Measurements were taken under conditions that allowed photosynthesis and conditions that prevented it, enabling distinction between net CO2 exchange and ecosystem respiration. In this approach, the net ecosystem exchange of CO2 (NEE) corresponds to the balance between the CO2 flux emitted and absorbed by the ecosystem. This flux was measured using a transparent chamber, which allows light to enter, enabling both photosynthesis and respiration. In contrast, ecosystem respiration (ER) represents the CO2 released by the respiration of autotrophic and heterotrophic organisms. This flux was measured using an opaque chamber, which blocks light and prevents photosynthesis, recording only the CO2 release from respiration. Negative values indicate CO2 uptake by soil and vegetation (carbon sink), while positive values indicate CO2 release (carbon source).
Carbon dioxide (CO2) fluxes were measured using optical absorption spectroscopy with a gas exchange system equipped with an infrared gas analyzer (IRGA) LI-8100A (LI-COR, Lincoln, NE, USA). This system comprised a control unit and two chambers—one transparent and one opaque. To execute measurements, polyvinyl chloride (PVC) rings with a diameter of 20 cm were inserted into the soil to a depth of 3 ± 1 cm. A laptop was used for system operation and data storage. Collection times ranged from 1 min to 1.5 min, the number of replicates per collection area ranged from 9 to 14, and measurement locations were arranged in a semicircle, according to terrain conditions. Measurements were made during the day, between 08:00 and 17:30 local time.
The stored raw data were individually preprocessed using “FileViewer 3.0” software. Linear regression models were adjusted for each reading, and their angular coefficients were considered as the CO2 flux rate (μmol CO2 m−2 s−1) for NEE and ER measures at each measurement location. The data were filtered, and inconsistencies such as low coefficients of determination (R2), high variability, excessive noise (indicative of chamber leakage), or absence of CO2 flow pattern were excluded. After filtering, an exploratory analysis of the data was performed. Measures of central tendency and descriptive statistics were used to present the flux data, along with the application of a non-parametric test (Kruskal–Wallis test at a 5% significance), using R software v4.1.2 (R CORE TEAM).

3. Results

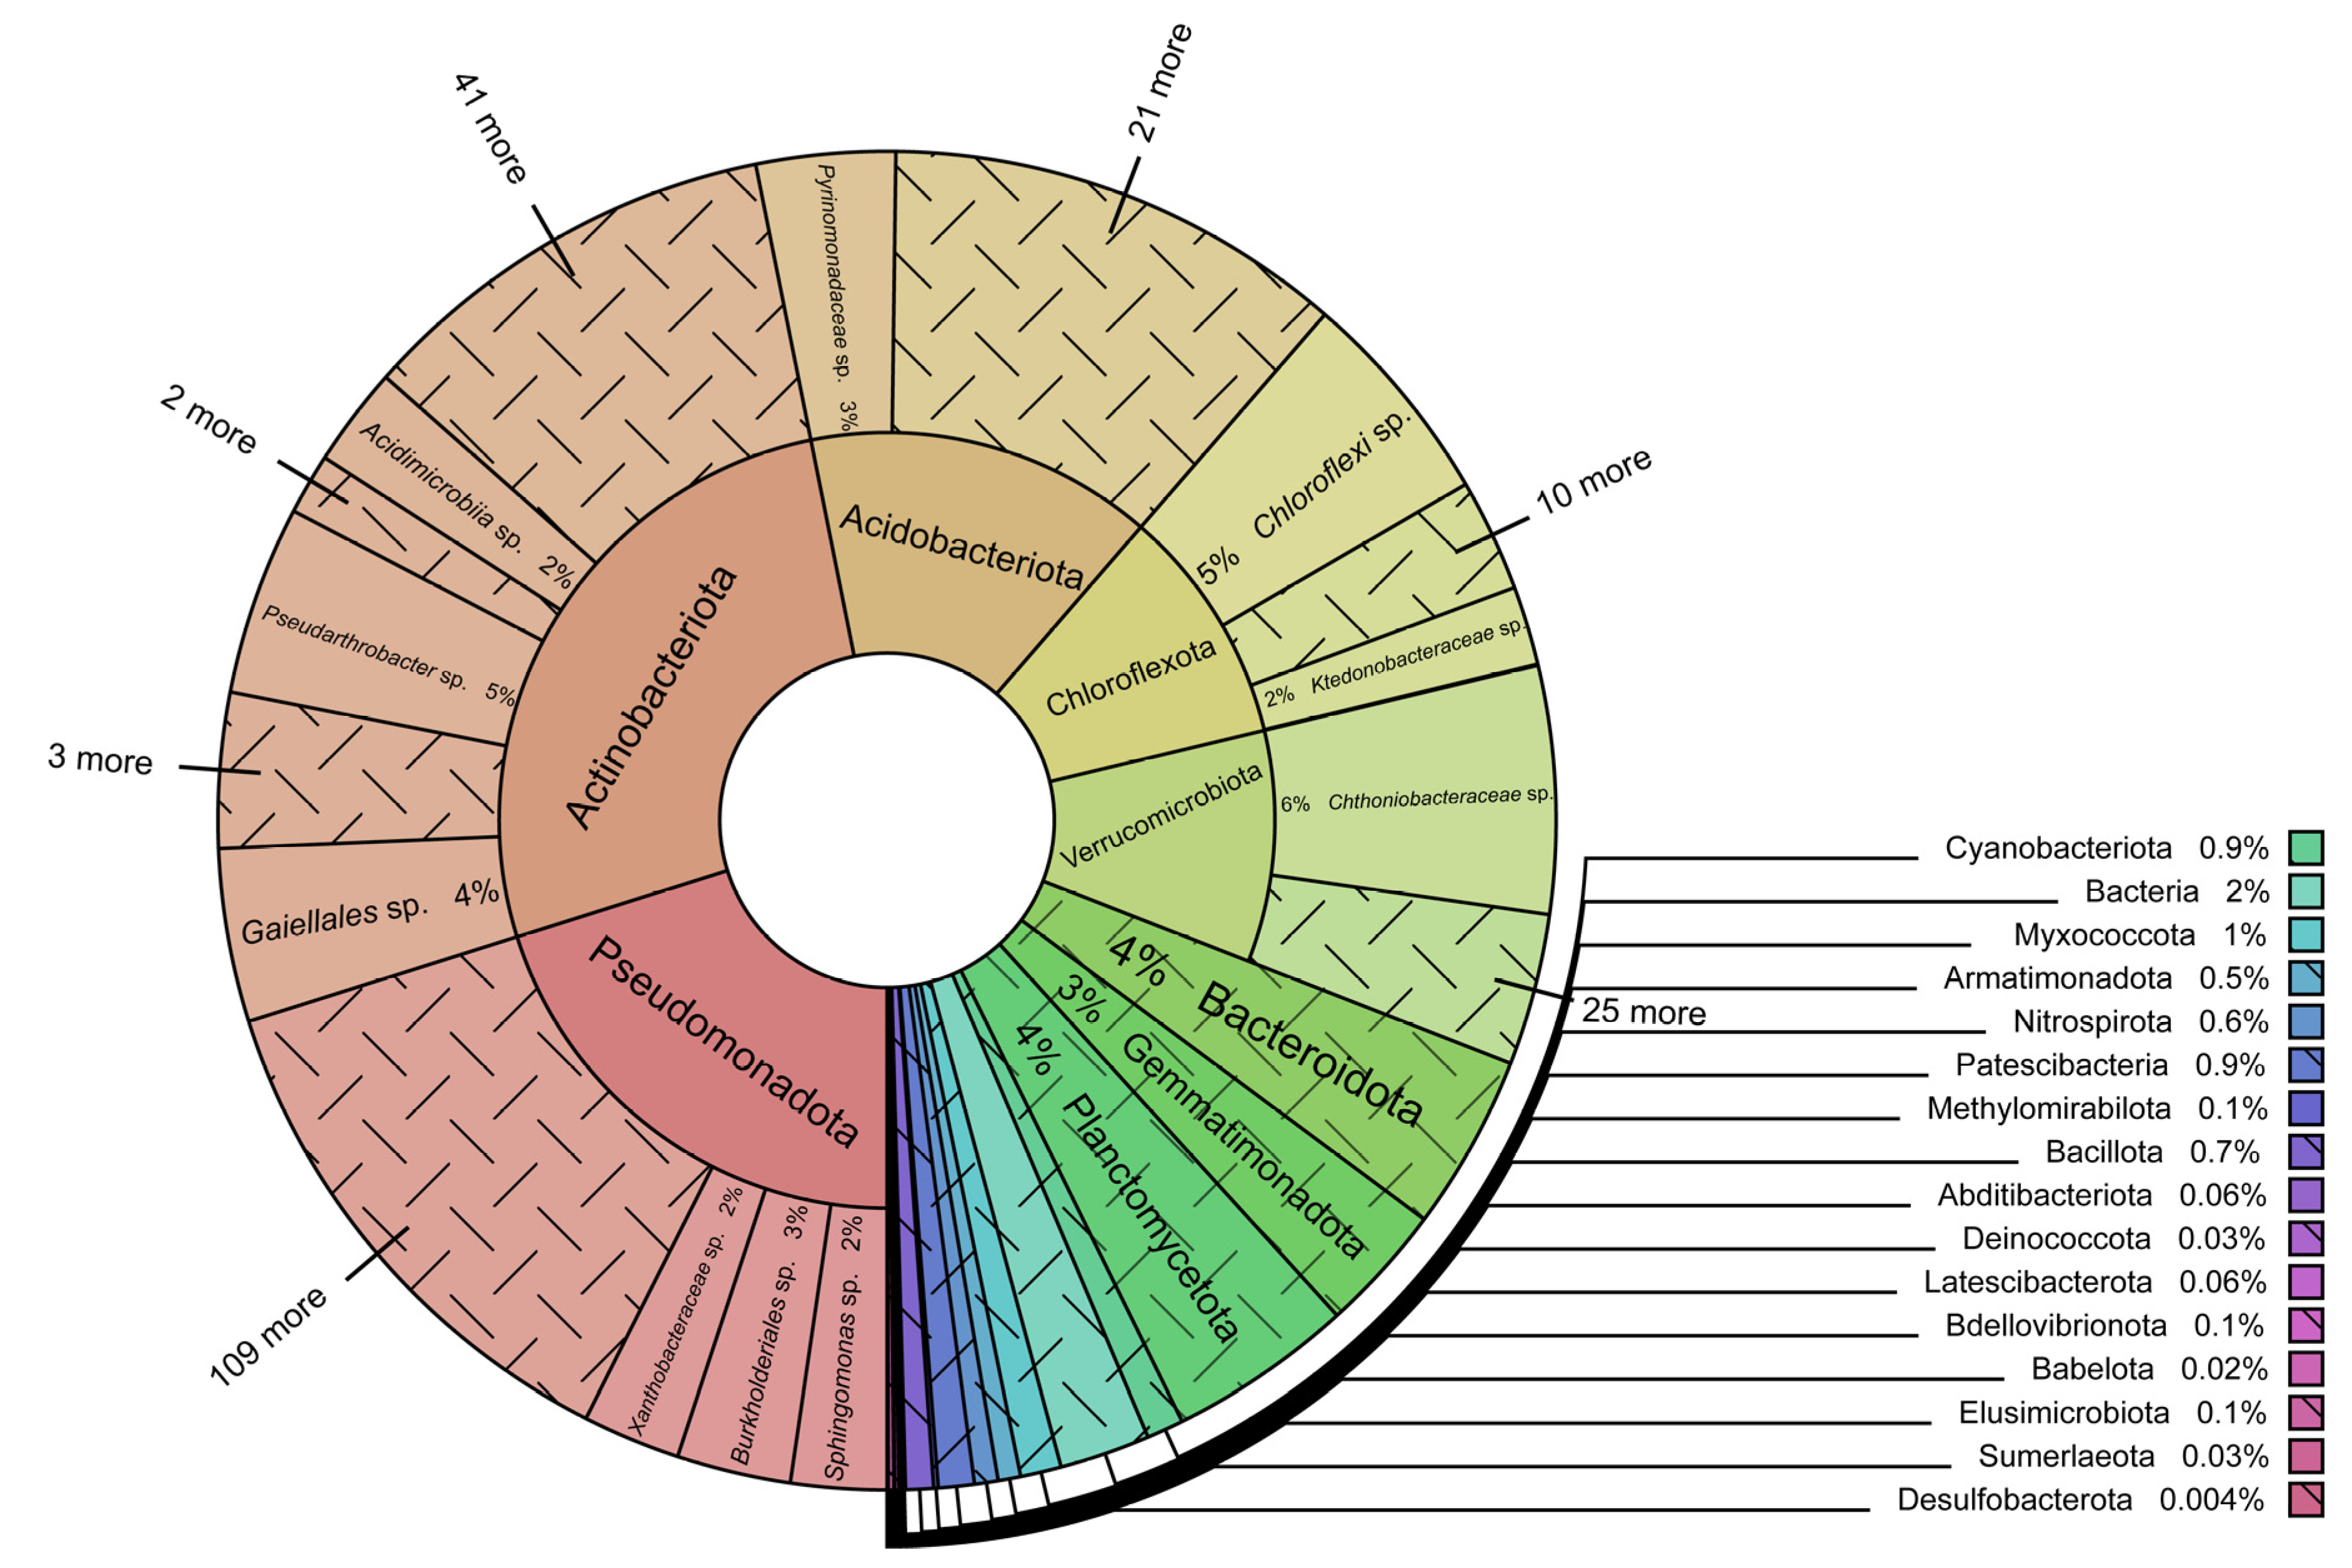
3.1. Prokaryotic Taxonomy and Abundance

For bacteria, a total of 1,389,942 DNA reads were obtained from all soil samples, which were assigned to 381 ASVs (Supplementary Table S1). In terms of relative abundance (RA), the most abundant bacterial phylum was Actinobacteriota, followed in rank order by Acidobacteriota, Pseudomonadota, Chloroflexota, and Verrucomicrobiota (Figure 2), with this pattern being the same in both vegetated and non-vegetated soils. Additionally, Bacteroidota, Cyanobacteriota, Bdellovibrionota, Deinococcota, Babelota, Desulfobacterota, Elusimicrobiota, Bacillota, Gemmatimonadota, Latescibacterota, Methylomirabilota, Myxococcota, Nitrospirota, Patescibacteria, Planctomycetota, and Sumerlaeota were detected in low abundance. The dominant bacterial taxa (RA > 1%) were Chthoniobacteraceae sp., Gaiellales sp., Chloroflexi sp., Pseudarthrobacter sp., Pyrinomonadaceae sp., Xanthobacteraceae sp., Burkholderiales sp., Acidimicrobiia sp., Ktedonobacteraceae sp., Bacteria sp., and Sphingomonas sp. All dominant bacterial taxa displayed a higher RA in the non-vegetated soil samples (Supplementary Figure S1).

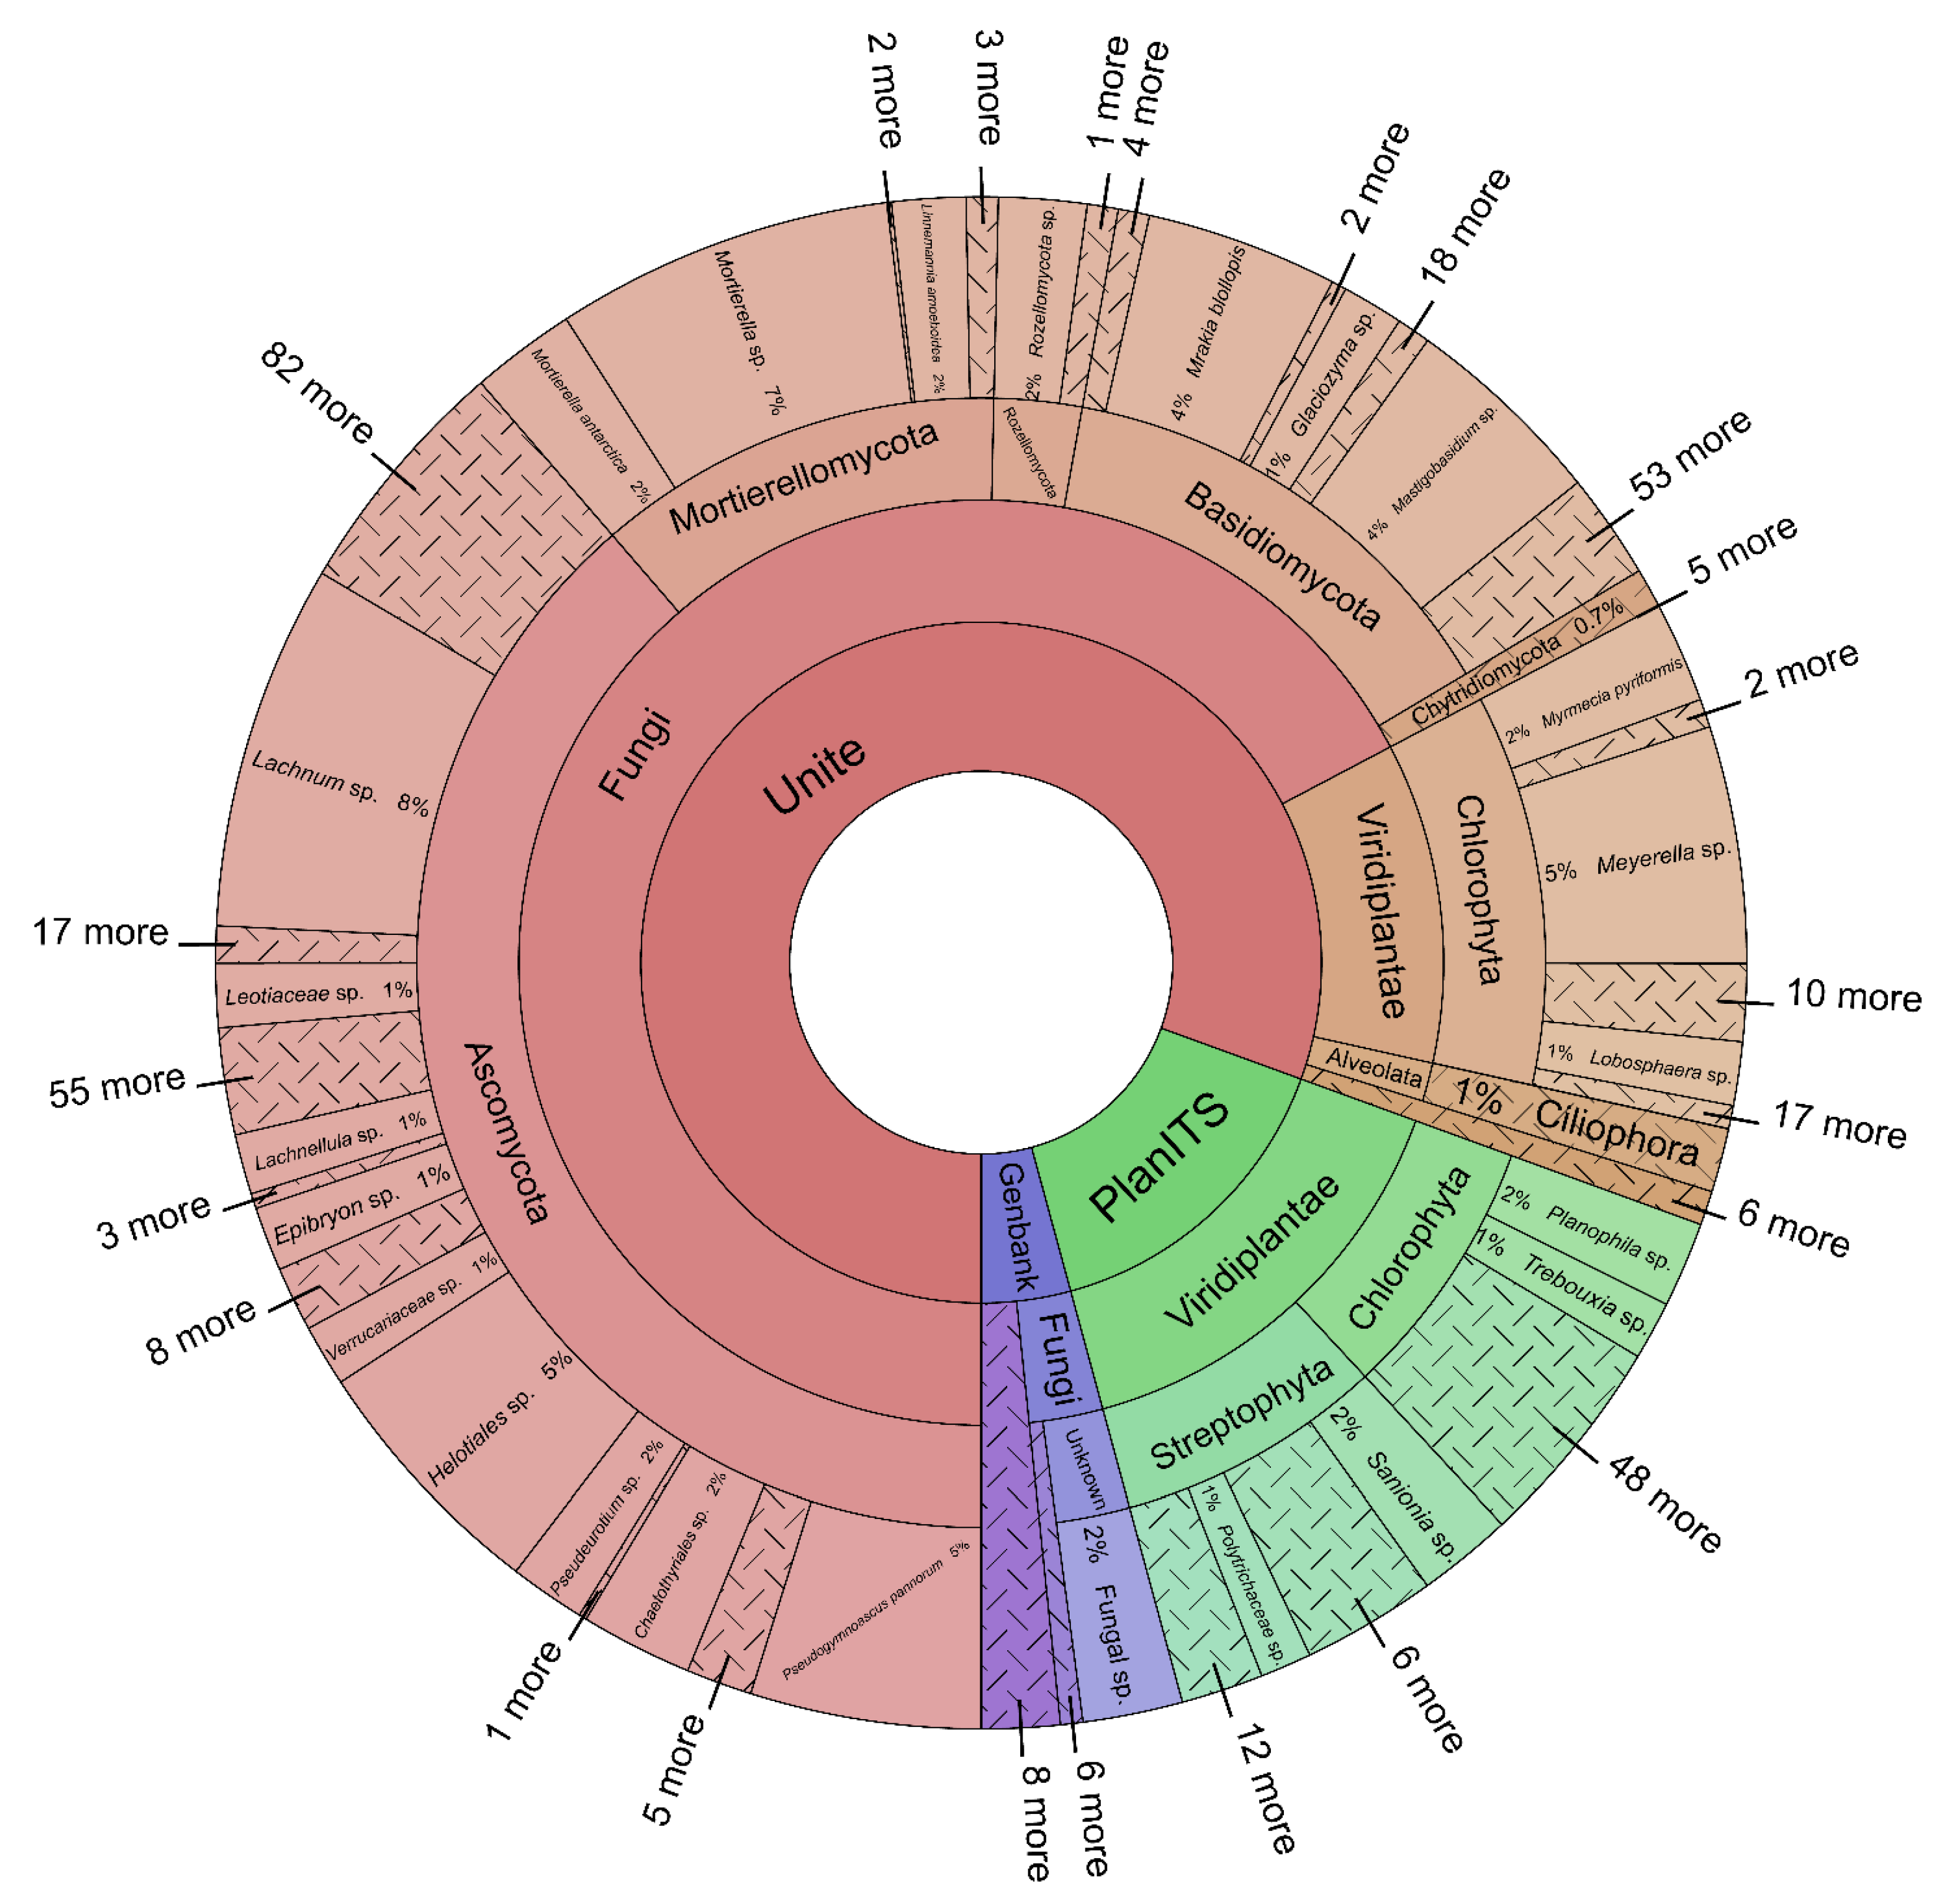
3.2. Eukaryotic Taxonomy and Abundance

A total of 1,804,201 eukaryotic DNA reads were detected across all seven sampling sites (Figure 3), which were assigned to 432 ASVs and included representatives of seven Kingdoms and 21 phyla (Supplementary Table S2; Supplementary Figure S2). Fungi dominated the ASVs, followed by Viridiplantae. The ranking of the dominant eukaryotic higher taxa of Ascomycota, Basidiomycota, Mortierellomycota, Rozellomycota (Fungi), Chlorophyta, and Streptophyta (Viridiplantae) differed between the non-vegetated and vegetated soils (Supplementary Figure S2). Most of the assemblages comprised rare taxa (RA < 1%).

3.3. Fungi

A total of 1,259,272 fungal DNA reads were detected across the seven sampling sites, representing 291 ASVs (Supplementary Table S2). Across all sites, the most abundant phyla detected were Ascomycota and Basidiomycota, followed in rank order by Mortierellomycota, Chytridiomycota, Rozellomycota, Zoopagomycota, Monoblepharomycota, Aphelidiomycota, Calcarisporiellomycota, and Blastocladiomycota. However, the RAs of the different phyla varied between the seven sites. Eighteen taxa were classified as dominant (RA > 1%), with Lachnum sp., Mortierella sp., Helotiales sp., Pseudogymnoascus pannorum, Mastigobasidium sp., and Mrakia blollopis displaying the highest RAs (>6%). Among the dominant fungal taxa, P. pannorum, Pseudeurotium sp., Verrucariaceae sp., Glaciozyma sp., Mortierella antarctica, Linnemannia amoeboidea, and Rozellomycota sp. had higher RA in the non-vegetated soils, while Lachnum sp., Helotiales sp., Chaetothyriales sp., Epibryon sp., Leotiaceae sp., Mastigobasidium sp., Mrakia blollopis, and Mortierella sp. had higher RA in the vegetated soils.

3.4. Viridiplantae

A total of 500,494 DNA reads were assigned to Viridiplantae, representing 97 ASVs and five phyla—Bryophyta, Chlorophyta, Magnoliophyta, Marchantiophyta, and Streptophyta (Supplementary Table S3). Chlorophyta was the most diverse and abundant group, with Meyerella sp. displaying the highest RA. Amongst the assigned Bryophyta, Sanionia sp. was the most abundant ASV, followed by Polytrichaceae. Assignments to Mnium sp. and Syntrichia ruraliformis were to taxa not recorded from Antarctica, likely illustrating limitations of the available databases. Several species of Syntrichium, or close relatives, are present in the Maritime Antarctic, including on the South Shetland Islands.

3.5. Stramenopila, Chromista, Protozoa, Holozoa, and Metazoa

Supplementary Table S4 shows the ASV assignments to Stramenopila, Chromista, Protozoa, Holozoa, and the Kingdom Metazoa, which, in total, generated 44,435 DNA reads representing 44 ASVs. Among the invertebrates, 11 ASVs representing three phyla were found, including seven Arthropoda, three Nematoda, and one Tardigrada. Seven ASVs were assigned to Protozoa, representing four phyla—Apuzozoa, Cercozoa, Evosea, and Heterolobosea. The majority of these groups were only identified at a higher rank level (class and order). Amongst the Chromista, 22 ASVs were assigned representing two phyla—Bacillariophyta and Ciliophora. Phaeodactylum tricornutum is a globally widespread and commonly found diatom that has not yet been reported in Antarctica. The majority of ASVs were again only assigned to a higher taxonomic level (class and order), although representatives of these taxa are generally common and widespread in Antarctica. The most abundant ASVs were Urostylida sp. and Ciliophora sp. (Chromista), followed by Cercozoa sp. (Protozoa).

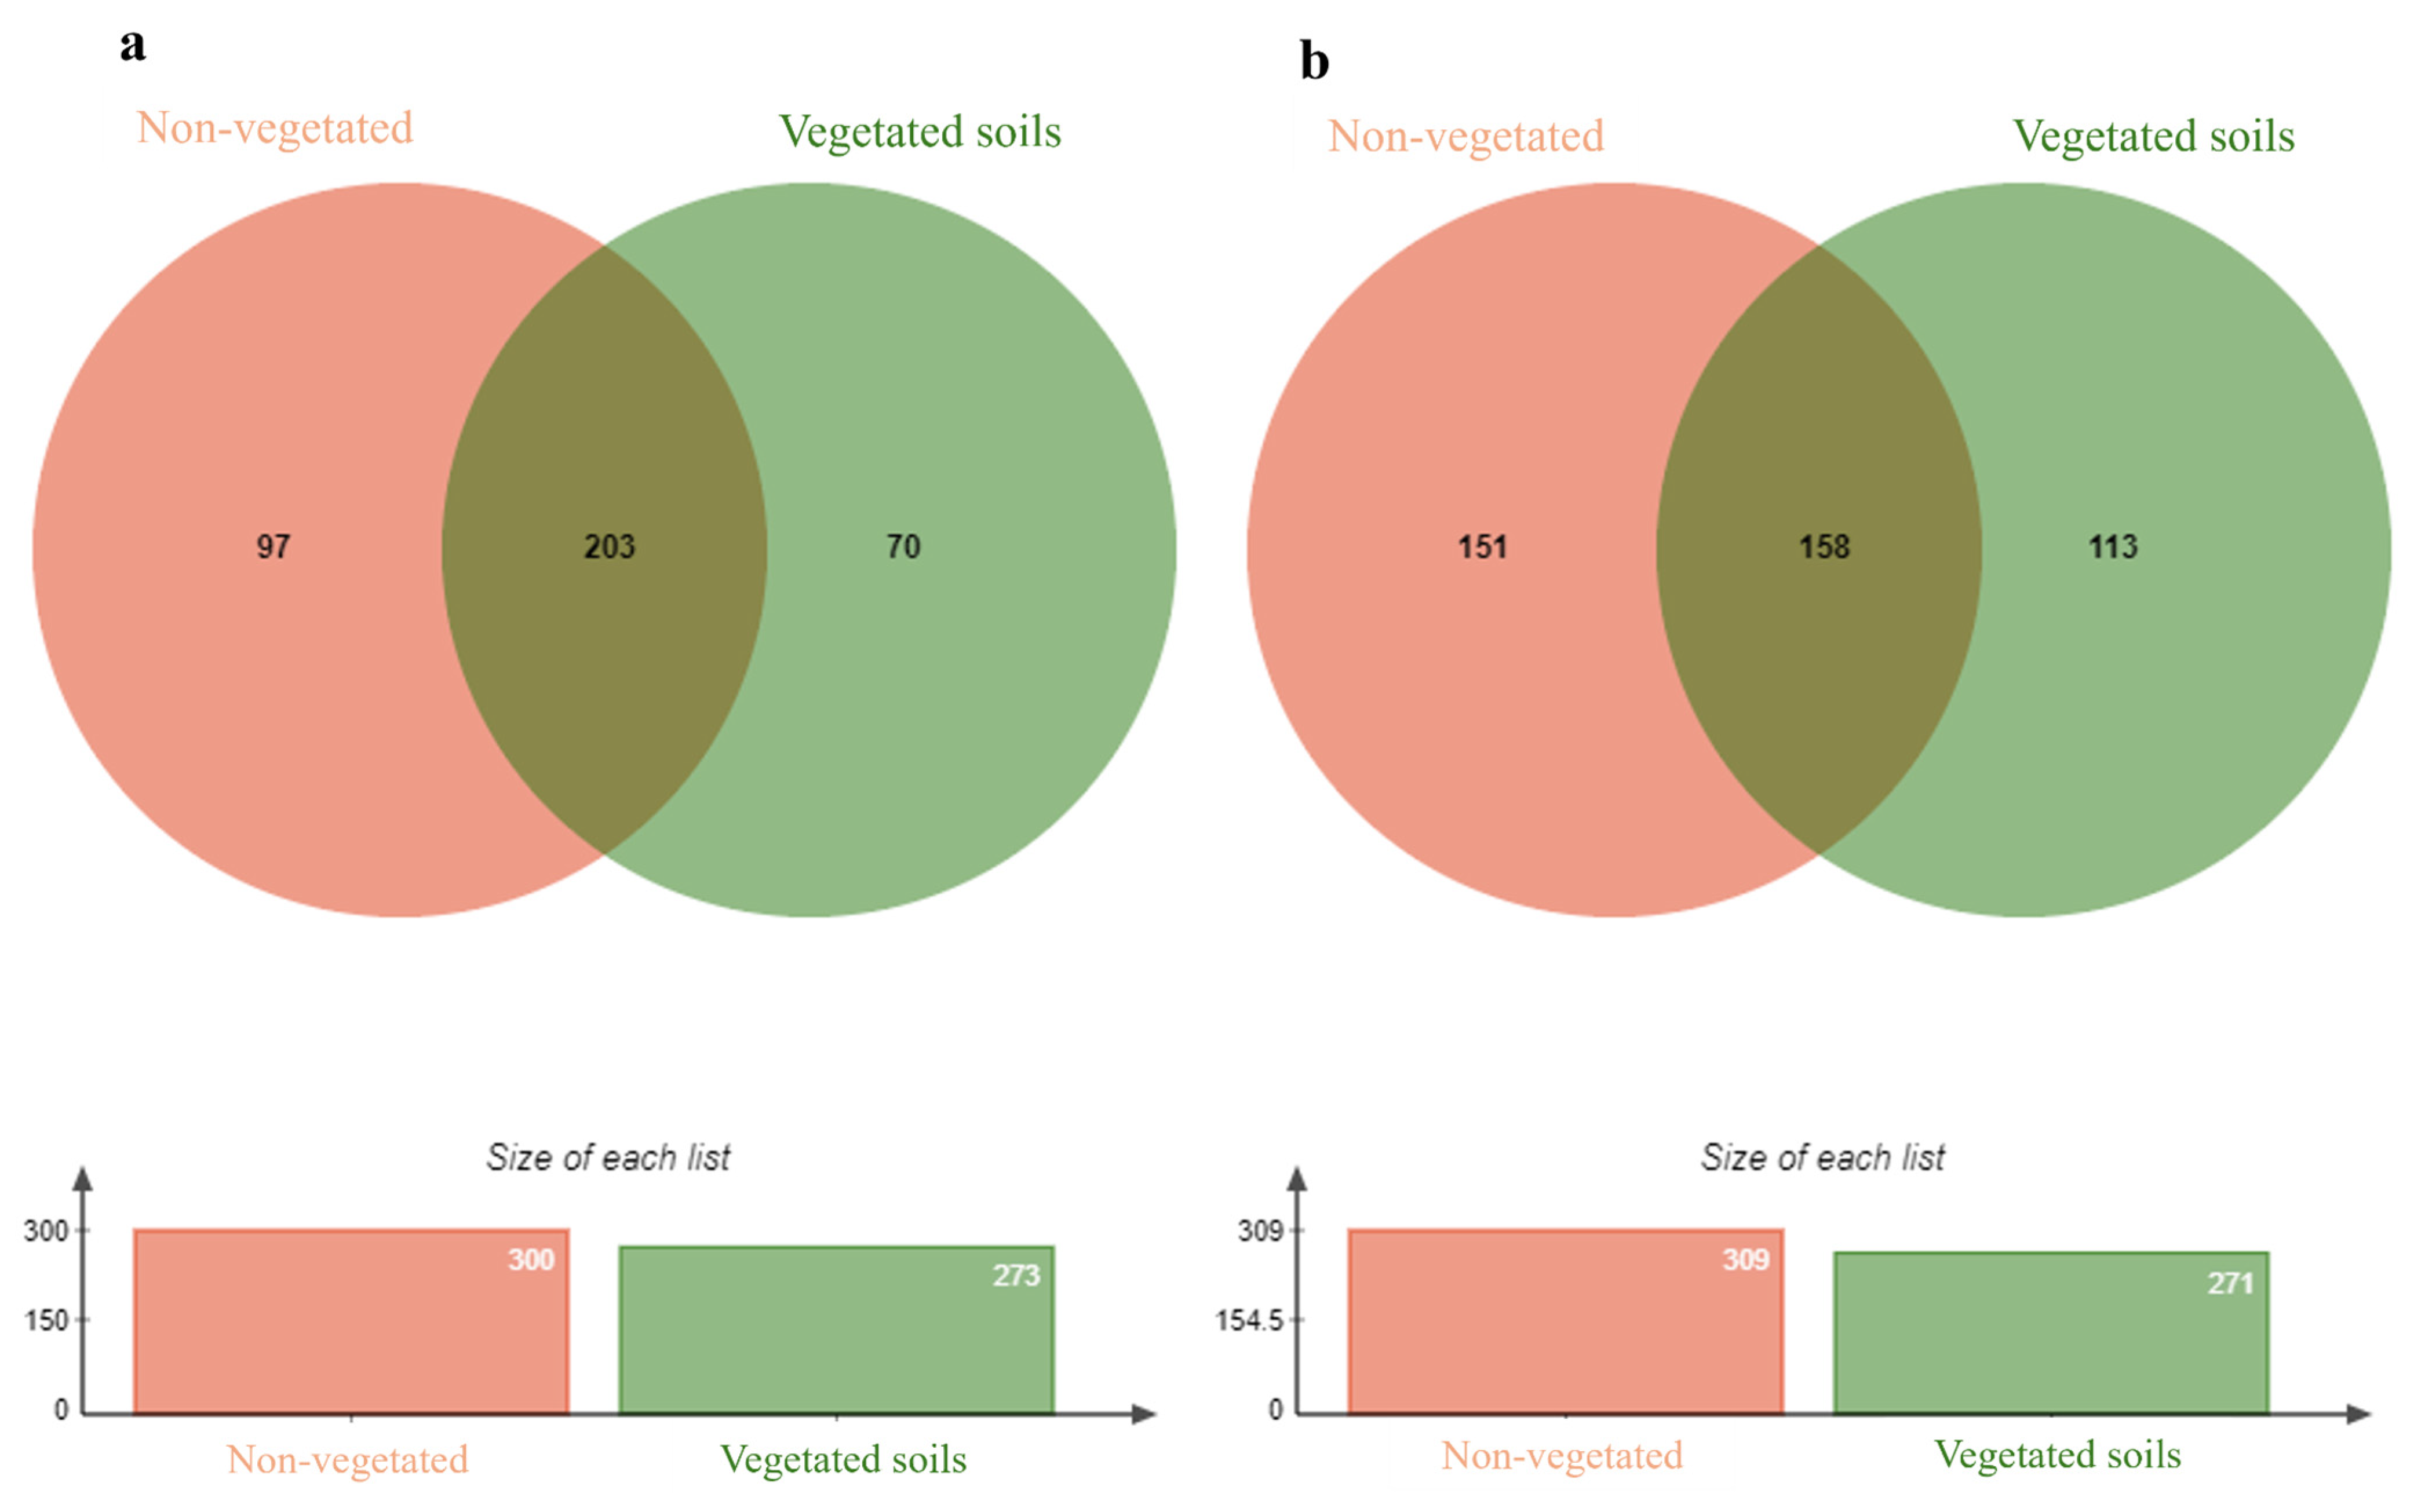
3.6. Prokaryotic and Eukaryotic Diversity and Distribution

The Mao Tao rarefaction curves of the prokaryotic and eukaryotic assemblages detected in all seven sampling sites reached asymptote, suggesting that the DNA reads gave an accurate representation of the local diversity in each sample (Supplementary Figure S3). The prokaryotic and eukaryotic diversity indices across the samples are given in Table 1. Non-vegetated soil 1 displayed the highest diversity (Fisher α), richness (Margalef), and dominance (Simpson), while vegetated soil 5 showed the lowest indices. The non-vegetated soils generally showed higher diversity indices than the vegetated soils, although the total numbers of DNA reads were greater in the vegetated soils (Table 2).
The prokaryotic and eukaryotic communities detected in the non-vegetated and vegetated soils were compared using a Venn diagram (Figure 4). Of the 381 prokaryotic ASVs detected, 203 (53.28%) were present in both the non-vegetated and vegetated soils, while, of the total of 432 eukaryotic ASVs, a somewhat lower proportion of 158 (36.57%) were shared. The dominant prokaryotic taxa differed between the non-vegetated and vegetated soils. Pyrinomonadaceae sp. (Acidobacteriota) was dominant in the former, and Pseudarthrobacter sp. (Actinobacteria) in the latter. Among the dominant eukaryotic taxa, M. antarctica (Mortierellomycota, Fungi) and Meyerella sp. (Chlorophyta, Viridiplantae) dominated the non-vegetated soils, while Lachnum sp. (Ascomycota, Fungi) and Polytrichaceae sp. (Streptophyta, Viridiplantae) dominated the vegetated soils.

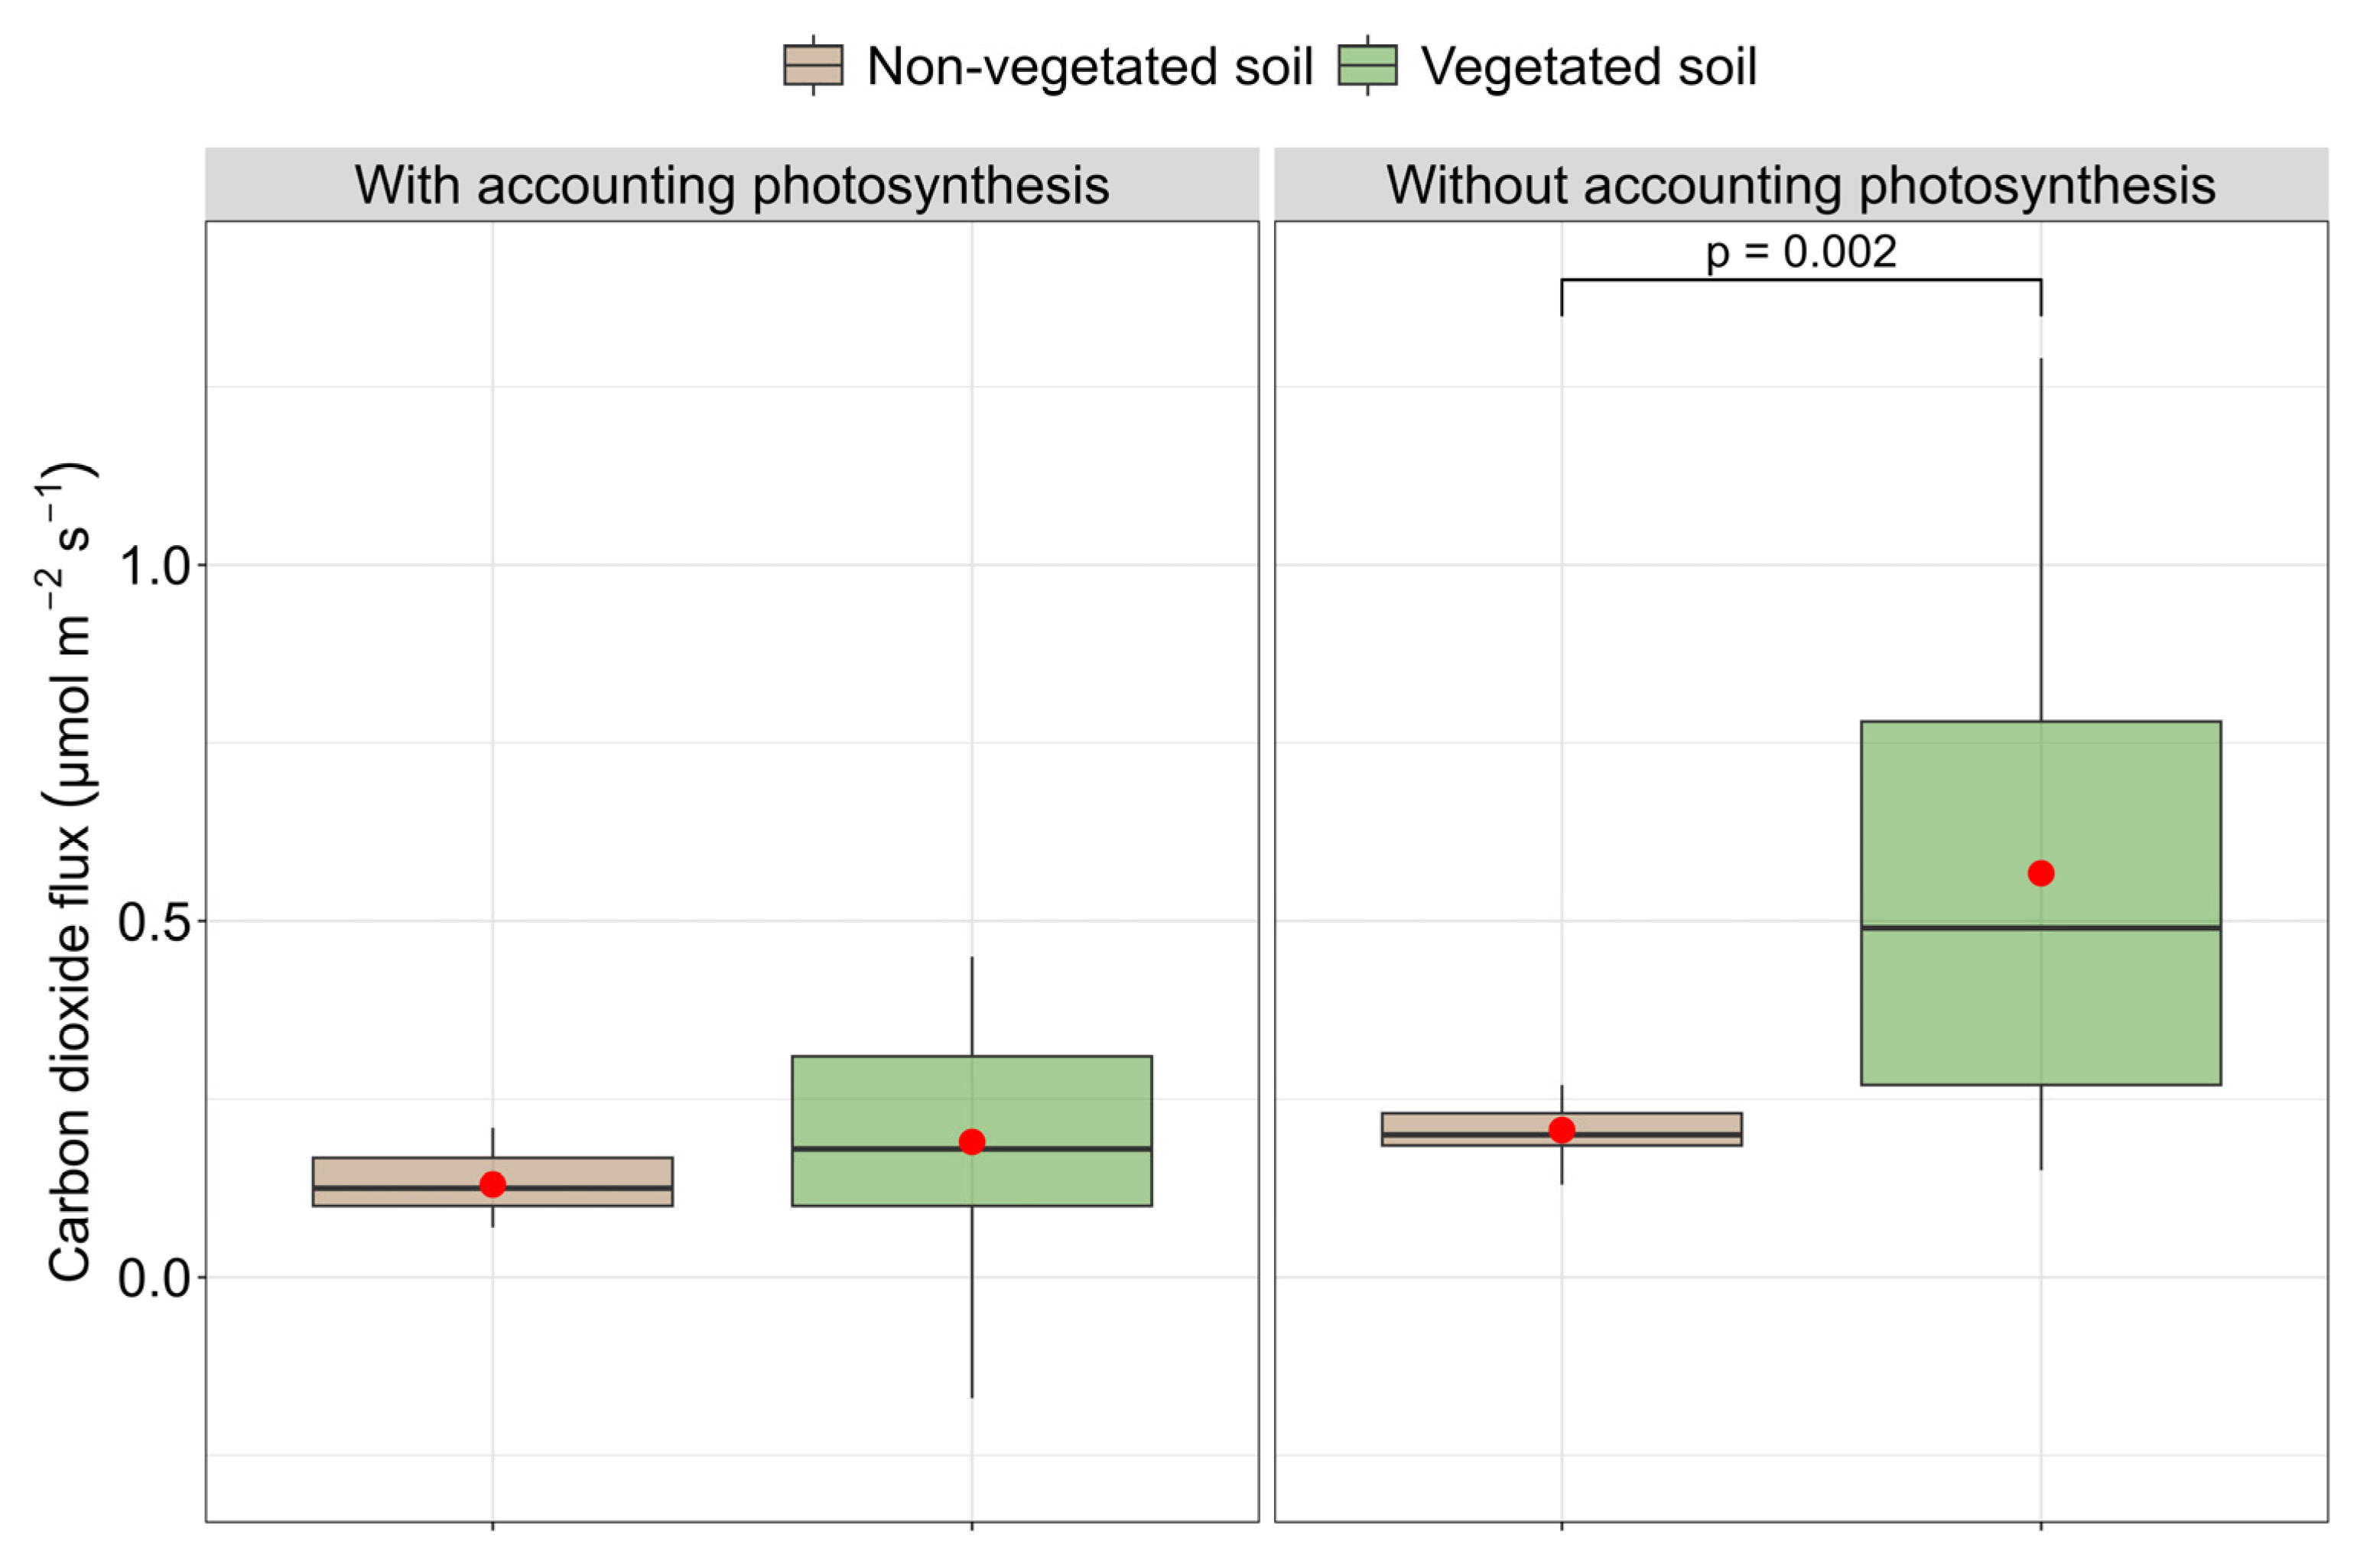
3.7. CO2 Flux and Prokaryotic and Eukaryotic Diversity

The measured values of CO2 fluxes ranged between −0.26 and +1.29 μmol CO2 m−2 s−1. The NEE values for non-vegetated soil and vegetated soil did not show a statistically significant difference, while the ER values differed significantly, with vegetated soils having a higher ER (Figure 5). While prokaryotic and eukaryotic diversity was greater specifically in the non-vegetated soils, this difference in ER likely reflects the considerable biomass of macroscopic photosynthetic vegetation present on the vegetated soils (Table 2).
Based on the average NEE and ER values obtained during the daytime period, the net CO2 exchange in the ecosystem indicates an emission of 8.208 mg C m⁻2 h⁻1 in the vegetated area and 5.616 mg C m⁻2 h⁻1 in the non-vegetated area. When considering only ecosystem respiration (ER), the potential carbon emission was significantly higher, reaching 24.4944 mg C m⁻2 h⁻1 in the vegetated area and 8.8992 mg C m⁻2 h⁻1 in the non-vegetated area.

4. Discussion

4.1. Prokaryotic Taxonomy

The bacterial communities present in Antarctic soils are generally dominated by Acidobacteriota, Actinobacteriota, Bacteroidota, Bacillota, Gemmatimonadota, and Pseudomonadota [40,41,42,43,44]. Our data are consistent with these findings, with the dominant prokaryotic phyla in both vegetated and non-vegetated soils of the Keller Peninsula being Actinobacteria, followed by Acidobacteriota, Pseudomonadota, Chloroflexota, and Verrucomicrobiota. Bacterial diversity in Antarctic soils can be influenced by soil physicochemical characteristics [45], local microclimate [46], vegetation cover, and cryoturbation processes (bulk density and soil temperature) [47].
The dominant prokaryotic ASV in non-vegetated soils was an unassigned Pyrinomonadaceae sp. (Acidobacteriota), while Pseudarthrobacter sp. (Actinobacteriota) dominated in the vegetated soils. The family Pyrinomonadaceae includes diverse aerobic and chemoheterotrophic mesophilic or thermophilic bacteria that are also able to grow in mildly acidophilic environments [48], with representatives being reported from a range of extreme environments such as semi-arid savannah and volcanic soils [49]. Representatives of Pyrinomonadaceae have been reported in environmental DNA (eDNA) studies of diesel-contaminated Antarctic soil on King George Island [50], as well as being abundant in Antarctic marine sediments [51]. Pseudarthrobacter species are common in Antarctic soils [52]. Naloka et al. [53] reported a Pseudarthrobacter sp. strain as being dominant in an Antarctic soil study, which displayed the ability to degrade phenanthrene at low temperatures, suggesting the possession of a complex metabolism to enable survival in the extreme Antarctic environment.

4.2. Eukaryotic Taxonomy

Representatives of 12 eukaryotic kingdoms and 24 phyla were assigned in this study, with the soil communities dominated by Fungi followed by Viridiplantae. Fungi are generally the most diverse eukaryotic group present in various Antarctic ecosystems [7,54,55], followed by Viridiplantae, is the latter primarily represented by bryophytes (mosses and liverworts) and, to a lesser extent, flowering plants (of which there are only two native species) [56]. Among the Fungi, Ascomycota, Basidiomycota, Mortierellomycota, and Rozellomycota dominated the Keller Peninsula soils sampled. Members of the first three of these phyla have generally been reported as common in many different Antarctic substrates/habitats in studies using either culture-based or metagenomic methodologies [7]. However, more cryptic phyla such as Rozellomycota have been detected primarily in eDNA studies using metabarcoding approaches [55].
Among Viridiplantae, Chlorophyta and Bryophyta were the dominant groups. Amongst the top five most abundant chlorophytes assigned, Meyerella is a small freshwater genus with only three known species from Europe, Asia, and North America. Such findings remain common in Antarctic eDNA studies [57]; however, while they could represent new continental records or as yet undescribed species, they are more likely illustrations of the limitations of sequence assignment methodologies or of the completeness of the currently available sequence databases. Myrmecia pyriformis provides a similar example at the species level, being recorded from Atlantic islands, Asia, and Europe, although an assigned representative of the genus has been reported from Antarctica in an eDNA study [57]. Lobosphaera is a freshwater genus that includes three described species, of which Lobosphaera incisa has been reported from Antarctica [58]. Finally, Planophila is a marine genus commonly reported from Antarctica [57], and Trebouxia is a widespread terrestrial and freshwater genus also commonly reported from Antarctica and which is also a photobiont in multiple lichen species.
Comparing the dominant assigned sequences in non-vegetated and vegetated soils, M. antarctica (Mortierellomycota, Fungi) and Meyerella sp. (Chlorophyta, Viridiplantae) dominated the former, while Lachnum sp. (Ascomycota, Fungi) and Polytrichaceae sp. (Streptophyta, Viridiplantae) dominated the latter. Lachnum (order Helotiales, Fungi) is a genus with representatives present in many parts of the world, commonly occurring in association with plants [59]. Bruyant et al. [60] considered that Helotiales is a diverse and understudied fungal order, which is emerging as a key lineage in fungus-mediated nutrient acquisition by plants, with the ability to form ericoid mycorrhizae or ectomycorrhizae, which is capable of transferring nutrients to their hosts without forming differentiated cellular structures inside plant roots and, as yet, without proven nutritional reciprocity from the plant. Separately, Helotiales taxa display high levels of dominance in Antarctic moss carpets showing symptoms of ‘fairy ring’ infection [18]. The genus Mortierella includes species known as “snow moulds”, which are often recovered from cold environment soils where they are considered saprophytes [61]. They include many Antarctic representatives that have been isolated from different terrestrial sources, including mosses, lichens, and soil [7]. Rosa et al. [55] considered that the abundance of Mortierella representatives in fairy rings on Antarctic mosses suggests that they may be opportunistic secondary invaders degrading already dead moss. Many of the dominant taxa reported here in vegetated soils are also common in eDNA studies of Antarctic moss carpets [18,62].
Meyerella sp. (Chlorophyta, Viridiplantae) was the dominant algae in the non-vegetated soils. Polytrichaceae sp. (Streptophyta, Viridiplantae), a group including several common and widespread Antarctic moss species, dominated the vegetated soils and was not detected in the non-vegetated soils. Similarly, sequences assigned to the moss genus Dicranum, another widespread Antarctic moss, were only detected in the vegetated soil. Amongst the other assigned moss sequences, Conostomum pentastichum is a rare species in Admiralty Bay [63]. Conversely, while Brachytheciaceae includes common moss species in Maritime Antarctica (particularly in the South Shetland Islands), it was not assigned in the vegetated soil samples. Antarctic members of the genus Sanionia include S. uncinata, one of the most common and abundant mosses in Maritime Antarctica (and the Keller Peninsula specifically), which often forms large monoclonal carpets [57], consistent with the abundance of its assigned sequences in both non-vegetated and vegetated soils. Amongst the Chlorophyta, Meyerella dominated the non-vegetated soils and was almost absent from vegetated soil, a pattern also shown by Myrmecia, Lobosphaeria, and many other algal taxa. It is likely that the dense overlying moss carpet at the vegetated study site may have restricted the ability of microalgae to develop in the soil. Finally, little inference could be made about the distribution of the remaining groups of Protozoa and Chromista, as they showed only limited diversity and were assigned mostly to higher taxonomic levels.

4.3. Prokaryotic and Eukaryotic Diversity and CO2 Flux

The highest CO2 fluxes we observed in net ecosystem exchange (NEE) and ecosystem respiration (ER) in vegetated soils reinforce the essential role of vegetation in carbon dynamics. Root respiration can account for up to 50% of total emissions in areas vegetated by higher plants [64], highlighting its contribution to the carbon cycle. Additionally, photosynthetic activity contributes to the accumulation of organic carbon in plant biomass and alters the composition and activity of soil microbial communities, intensifying CO2 fluxes [65].
Vegetation facilitates the release of exudates and the accumulation of organic matter, stimulating microbial activity and increasing heterotrophic respiration [66]. In this study, ER measured in vegetated soil was more than twice as high as that in non-vegetated soils, but the relative contributions of the soil microbial community and the overlying vegetation could not be separated in our analysis. The presence of the overlying dense moss carpets may have reduced the associated soil microbial diversity by promoting the dominance of species better adapted to this environment [67]. However, the increase in CO2 emissions through ER in vegetated sites was offset by the greater carbon sequestration potential provided through plant photosynthesis. Although non-vegetated soils in this study exhibited higher prokaryotic and eukaryotic diversity, their CO2 fluxes remained lower, indicating that despite greater biodiversity, they show reduced functional activity related to carbon mineralization [68]. Studies in polar desert ecosystems have shown that soil moisture, often regulated by vegetation cover, also influences CO2 fluxes. Specifically, increased moisture enhanced microbial biomass and organic carbon availability, leading to higher CO2 emissions, whereas drier conditions restricted microbial activity and reduced CO2 fluxes [69].

5. Conclusions

Our eDNA metabarcoding data revealed the presence of rich and complex communities of prokaryotic and eukaryotic organisms in both non-vegetated and vegetated soils of the Keller Peninsula on King George Island, including autotrophic and heterotrophic groups, which are likely display diverse ecological roles. The non-vegetated soils demonstrated the highest levels of assigned diversity and had a lower ER compared to vegetated soils. The high respiration value measured over vegetated soils is likely due to the significant biomass of photosynthetically active plants (mainly dense moss carpets) and their resident organisms. The greater diversity detected in exposed soils may influence future changes in CO2 flux in the region studied, for which studies comparing non-vegetated and vegetated soils with different microbial diversities will be necessary. This reinforces the requirement for future studies to monitor the impact of resident biota on CO2 fluxes in different areas of Maritime Antarctica and related to different soil types and differing influences of vegetation.

Supplementary Materials

The following supporting information can be downloaded at: https://www.mdpi.com/article/10.3390/dna5010015/s1, Table S1: Prokaryotic taxa detected along the seven soil samples obtained in Keller Peninsula, King George Island, Maritime Antarctica. Table S2: Relative abundances of the fungal amplicon sequence variants (ASVs) detected along the seven soil samples obtained in Keller Peninsula, King George Island, Maritime Antarctica. Table S3: Relative abundances of the Viridiplantae amplicon sequence variants (ASVs) detected along the seven soil samples obtained in Keller Peninsula, King George Island, Maritime Antarctica. Table S4: Relative abundances of the Stramenopila, Chromista, Protozoa, Holozoa, and Metazoa amplicon sequence variants (ASVs) detected along the seven soil samples obtained in Keller Peninsula, King George Island, Maritime Antarctica. Figure S1: Krona chart illustrating the prokaryote ASV assemblages assigned in each of the seven soil samples obtained on Keller Peninsula, King George Island. (a) exposed soil 1, (b) exposed soil 2, (c) exposed soil 3, (d) vegetated soil 4, (e) vegetated soil 5, (f) vegetated soil 6, (g) vegetated soil 7. Figure S2: Krona chart illustrating eukaryote ASVs assigned from each of the seven sampling sites on Keller Peninsula, King George Island. (a) exposed soil 1, (b) exposed soil 2, (c) exposed soil 3, (d) vegetated soil 4, (e) vegetated soil 5, (f) vegetated soil 6, (g) vegetated soil 7. Figure S3: Rarefaction curves, with 95% confidence limits, of prokaryotic (a) and eukaryotic (b) amplicon sequence variants (ASVs) obtained from the seven soils sampled on Keller Peninsula, King George Island.

Author Contributions

L.H.R., M.R.F. and P.E.A.S.C. conceived the study. L.H.R., V.N.G. and D.L.C.B. performed DNA extraction from soil samples. F.A.C.L. and K.C.R.S. performed the metabarcoding analysis. M.R.F., C.G.O.B. and D.C.M. collected soil and gas samples. L.H.R., V.N.G., D.L.C.B., M.R.F., C.G.O.B., D.C.M., K.C.R.S., F.A.C.L., M.C.-S., P.C. and P.E.A.S.C. analyzed the results and wrote the manuscript. All authors have read and agreed to the published version of the manuscript.

Funding

This research was funded by Conselho Nacional de Desenvolvimento Científico e Tecnológico (CNPq) grant number 440218/2023-3.

Institutional Review Board Statement

The collections and studies performed in Antarctica were authorized by PROANTAR.

Data Availability Statement

Sequences have been submitted to GenBank under the accession numbers SAMN44524491-SAMN44524508.

Acknowledgments

This study received financial support from CNPq, CAPES, FNDCT, INCT Criosfera, and PROANTAR. PC is supported by NERC core funding to the British Antarctic Survey’s ‘Biodiversity, Evolution and Adaptation’ Team.

Conflicts of Interest

The authors declare that they have no conflicts of interest.

References

  1. Godinho, V.M.; Gonçalves, V.N.; Santiago, I.F.; Figueredo, H.M.; Vitoreli, G.A.; Schaefer, C.E.G.R.; Barbosa, E.C.; Oliveira, J.G.; Alves, T.M.A.; Zani, C.L.; et al. Diversity and bioprospection of fungal community present in oligotrophic soil of continental Antarctica. Extremophiles 2015, 19, 585–596. [Google Scholar] [CrossRef]
  2. Bokhorst, S.; Convey, P.; Aerts, R. Nitrogen inputs by marine vertebrates drive abundance and richness in Antarctic terrestrial ecosystems. Curr. Biol. 2019, 29, 1721–1727. [Google Scholar] [CrossRef] [PubMed]
  3. Fell, J.W.; Scorzetti, G.; Connell, L.; Craig, S. Biodiversity of microeukaryotes in Antarctic Dry Valley soils with >5% soil moisture. Soil Biol. Biochem. 2006, 38, 3107–3119. [Google Scholar] [CrossRef]
  4. Ruisi, S.; Barreca, D.; Selbmann, L.; Zucconi, L.; Onofri, S. Fungi in Antarctica. Rev. Environ. Sci. Biotechnol. 2007, 6, 127–141. [Google Scholar] [CrossRef]
  5. Cowan, D.A.; Chown, S.L.; Convey, P.; Tuffin, M.; Hughes, K.; Pointing, S.; Vincent, W.F. Non-indigenous microorganisms in the Antarctic: Assessing the risks. Trends Microbiol. 2011, 19, 540–548. [Google Scholar] [CrossRef]
  6. Cavicchioli, R. Microbial ecology of Antarctic aquatic systems. Nat. Rev. Microbiol. 2015, 13, 691–706. [Google Scholar] [CrossRef] [PubMed]
  7. Rosa, L.H.; Zani, C.L.; Cantrell, C.L.; Duke, S.O.; Dijck, P.V.; Desideri, A.; Rosa, C.A. Fungi in Antarctica: Diversity, ecology, effects of climate change, and bioprospection for bioactive compounds. In Fungi of Antarctica: Diversity, Ecology and Biotechnological Applications; Springer: Cham, Switzerland, 2019; pp. 1–18. [Google Scholar] [CrossRef]
  8. Lopes, D.V.; Schaefer, C.E.G.R.; Souza, J.J.L.; de Oliveira, F.S.; Simas, F.N.B.; Daher, M.; Gjorup, D.F. Concretionary horizons, unusual pedogenetic processes and features of sulfate affected soils from Antarctica. Geoderma 2019, 347, 13–24. [Google Scholar] [CrossRef]
  9. Porto, B.A.; da Silva, T.H.; Machado, M.R.; de Oliveira, F.S.; Rosa, C.A.; Rosa, L.H. Diversity and distribution of cultivable fungi present in acid sulphate soils in chronosequence under para-periglacial conditions in King George Island, Antarctica. Extremophiles 2020, 24, 797–807. [Google Scholar] [CrossRef]
  10. Simas, F.N.B.; Schaefer, C.G.R.; Filho, M.R.A.; Francelino, M.R.; Fernandes Filho, E.I.; da Costa, L.M. Genesis, properties and classification of Cryosols from Admiralty Bay, Maritime Antarctica. Geoderma 2008, 144, 116–122. [Google Scholar] [CrossRef]
  11. Cao, J.J.; Li, Y.K.; Jiang, T.; Hu, G. Sulphur-containing particles emitted by concealed sulfide ore deposits: An unknown source of sulphur-containing particles in the atmosphere. Atmos. Chem. Phys. 2015, 12, 6959–6969. [Google Scholar] [CrossRef]
  12. Raich, J.W.; Schlesinger, W.H. The global carbon-dioxide flux in soil respiration and its relationship to vegetation and climate. Tellus Ser. B 1992, 44, 81–99. [Google Scholar] [CrossRef]
  13. La Scala, N.; de Sá Mendonça, E.; de Souza, J.V.; Panosso, A.R.; Simas, F.N.; Schaefer, C.E. Spatial and temporal variability in soil CO2-C emissions and relation to soil temperature at King George Island, Maritime Antarctica. Polar Sci. 2010, 4, 479–487. [Google Scholar] [CrossRef]
  14. Reichstein, M.; Rey, A.; Freibauer, A.; Tenhunen, J.; Valentini, R.; Banza, J.; Casals, P.; Cheng, Y.; Grunzweig, J.M.; Irvine, J.; et al. Modeling temporal and large-scale spatial variability of soil respiration from soil water availability, temperature and vegetation productivity indices. Glob. Biogeochem. Cycles 2003, 17, 1104. [Google Scholar] [CrossRef]
  15. Convey, P.; Peck, L.S. Antarctic environmental change and biological responses. Sci. Adv. 2019, 5, eaaZ0888. [Google Scholar] [CrossRef] [PubMed]
  16. Siegert, M.; Atkinson, A.; Banwell, A.; Brandon, M.; Convey, P.; Davies, B.; Downie, R.; Edwards, T.; Hubbard, B.; Marshall, G.; et al. The Antarctic Peninsula under a 1.5 °C global warming scenario. Front. Environ. Sci. 2019, 7, 102. [Google Scholar] [CrossRef]
  17. Shanhun, F.L.; Almond, P.C.; Clough, T.J.; Smith, C.M.S. Abiotic processes dominate CO2 fluxes in Antarctic soils. Soil Biol. Biochem. 2012, 53, 99–111. [Google Scholar] [CrossRef]
  18. Rosa, L.H.; da Costa Coelho, L.; Pinto, O.H.B.; Carvalho-Silva, M.; Convey, P.; Rosa, C.A.; Câmara, P.E.A.S. Ecological succession of fungal and bacterial communities in Antarctic mosses affected by a fairy ring disease. Extremophiles 2021, 25, 471–481. [Google Scholar] [CrossRef]
  19. Newsham, K.K.; Davey, M.L.; Hopkins, D.W.; Dennis, P.G. Regional diversity of Maritime Antarctic soil fungi and predicted responses of guilds and growth forms to climate change. Front. Microbiol. 2021, 11, 615659. [Google Scholar] [CrossRef]
  20. Chen, S.; Yao, H.; Han, J.; Liu, C.; Song, J.; Shi, L.; Zhu, Y.; Ma, X.; Gao, T.; Pang, X.; et al. Validation of the ITS2 region as a novel DNA barcode for identifying medicinal plant species. PLoS ONE 2010, 5, e8613. [Google Scholar] [CrossRef]
  21. Richardson, R.T.; Lin, C.H.; Sponsler, D.B.; Quijia, J.O.; Goodell, K.; Johnson, R.M. Application of ITS2 metabarcoding to determine the provenance of pollen collected by honeybees in an agroecosystem. Appl. Plant Sci. 2015, 3, 1400066. [Google Scholar] [CrossRef]
  22. White, T.J.; Bruns, T.; Lee, S.J.W.T.; Taylor, J. Amplification and direct sequencing of fungal ribosomal RNA genes for phylogenetics. In PCR Protocols: A Guide to Methods and Applications; Academic Press: New York, NY, USA, 1990; pp. 315–322. [Google Scholar]
  23. Herlemann, D.; Labrenz, M.; Jürgens, K.; Bertilsson, S.; Waniek, J.J.; Andersson, A.F. Transitions in bacterial communities along the 2000 km salinity gradient of the Baltic Sea. ISME J. 2011, 5, 1571–1579. [Google Scholar] [CrossRef]
  24. Klindworth, A.; Pruesse, E.; Schweer, T.; Peplies, J.; Quast, C.; Horn, M.; Glöckner, F.O. Evaluation of general 16S ribosomal RNA gene PCR primers for classical and next-generation sequencing-based diversity studies. Nucleic Acids Res. 2013, 41, e1. [Google Scholar] [CrossRef] [PubMed]
  25. Bushnell, B. BBMap: A Fast, Accurate, Splice-Aware Aligner; Lawrence Berkeley National Laboratory: Berkeley, CA, USA, 2014; Available online: https://sourceforge.net/projects/bbmap (accessed on 20 July 2024).
  26. Bolyen, E.; Rideout, J.R.; Dillon, M.R.; Bokulich, N.A.; Abnet, C.C.; Al-Ghalith, G.A.; Alexander, H.; Alm, E.J.; Arumugam, M.; Asnicar, F.; et al. Reproducible, interactive, scalable and extensible microbiome data science using QIIME 2. Nat. Biotechnol. 2019, 37, 852–857. [Google Scholar] [CrossRef]
  27. Callahan, B.J.; McMurdie, P.J.; Rosen, M.J.; Han, A.W.; Johnson, A.J.A.; Holmes, S.P. DADA2: High-resolution sample inference from Illumina amplicon data. Nat. Methods 2016, 13, 581–583. [Google Scholar] [CrossRef]
  28. Bokulich, N.A.; Kaehler, B.D.; Rideout, J.R.; Dillon, M.; Bolyen, E.; Knight, R.; Huttley, G.A.; Gregory Caporaso, J. Optimizing taxonomic classification of marker-gene amplicon sequences with QIIME 2’s q2-feature-classifier plugin. Microbiome 2018, 6, 90. [Google Scholar] [CrossRef]
  29. Abarenkov, K.; Allan, Z.; Timo, P.; Raivo, P.; Filipp, I.; Nilsson, H.R.; Urmas, K. UNITE QIIME Release for Eukaryotes; UNITE Community: London, UK, 2020. [Google Scholar] [CrossRef]
  30. Banchi, E.; Ametrano, C.G.; Greco, S.; Stanković, D.; Muggia, L.; Pallavicini, A. PLANITS: A curated sequence reference dataset for plant ITS DNA metabarcoding. Database 2020, 2020, baz155. [Google Scholar] [CrossRef]
  31. Ondov, B.D.; Bergman, N.H.; Phillippy, A.M. Interactive metagenomic visualization in a web browser. BMC Bioinform. 2011, 12, 385. [Google Scholar] [CrossRef] [PubMed]
  32. Medinger, R.; Nolte, V.; Pandey, R.V.; Jost, S.; Ottenwälder, B.; Schlötterer, C.; Boenigk, J. Diversity in a hidden world: Potential and limitation of next-generation sequencing for surveys of molecular diversity of eukaryotic microorganisms. Mol. Ecol. 2010, 19, 32–40. [Google Scholar] [CrossRef] [PubMed]
  33. Weber, A.A.; Pawlowski, J. Can abundance of protists be inferred from sequence data: A case study of Foraminifera. PLoS ONE 2013, 8, e56739. [Google Scholar] [CrossRef]
  34. Giner, C.R.; Forn, I.; Romac, S.; Logares, R.; de Vargas, C.; Massana, R. Environmental sequencing provides reasonable estimates of the relative abundance of specific picoeukaryotes. Appl. Environ. Microbiol. 2016, 82, 4757–4766. [Google Scholar] [CrossRef]
  35. Deiner, K.; Bik, H.M.; Mächler, E.; Seymour, M.; Lacoursière-Roussel, A.; Altermatt, F.; Creer, S.; Bista, I.; Lodge, D.M.; de Vere, N.; et al. Environmental DNA metabarcoding: Transforming how we survey animal and plant communities. Mol. Ecol. 2017, 26, 5872–5895. [Google Scholar] [CrossRef] [PubMed]
  36. Hering, D.; Borja, Á.; Jones, J.I.; Pont, D.; Boets, P.; Bouchez, A.; Bruce, K.; Drakare, S.; Hänfling, B.; Kahlert, M.; et al. Implementation options for DNA-based identification into ecological status assessment under the European Water Framework Directive. Water Res. 2018, 138, 192–205. [Google Scholar] [CrossRef] [PubMed]
  37. Rosa, L.H.; Pinto, O.H.B.; Peter, C.; Carvalho-Silva, M.; Rosa, C.A.; Câmara, P.E.A.S. DNA metabarcoding to assess the diversity of airborne fungi present over Keller Peninsula, King George Island, Antarctica. Microb. Ecol. 2021, 82, 165–172. [Google Scholar] [CrossRef] [PubMed]
  38. Hammer, Ø.; Harper, D.A.T.; Ryan, P.D. PAST: Paleontological statistics software package for education and data analysis. Palaeontol. Electron. 2001, 4, 9. [Google Scholar] [CrossRef]
  39. Bardou, P.; Mariette, J.; Escudié, F.; Djemiel, C.; Klopp, C. Jvenn: An interactive Venn diagram viewer. BMC Bioinform. 2014, 15, 293. [Google Scholar] [CrossRef]
  40. Chapin, F.S.; Woodwell, G.M.; Randerson, J.T.; Rastetter, E.B.; Lovett, G.M.; Baldocchi, D.D.; Clark, D.A.; Harmon, M.E.; Schimel, D.S.; Valentini, R.; et al. Reconciling carbon-cycle concepts, terminology, and methods. Ecosystems 2006, 9, 1041–1050. [Google Scholar] [CrossRef]
  41. R Core Team. R: A Language and Environment for Statistical Computing; R Foundation for Statistical Computing: Vienna, Austria, 2024; Available online: https://www.r-project.org/ (accessed on 20 January 2024).
  42. Bajerski, F.; Wagner, D. Bacterial succession in Antarctic soils of two glacier forefields on Larsemann Hills, East Antarctica. FEMS Microbiol. Ecol. 2013, 85, 128–142. [Google Scholar] [CrossRef]
  43. Chong, C.W.; Pearce, D.A.; Convey, P.; Yew, W.C.; Tan, I.K.P. Patterns in the distribution of soil bacterial 16S rRNA gene sequences from different regions of Antarctica. Geoderma 2012, 181–182, 45–55. [Google Scholar] [CrossRef]
  44. Doytchinov, V.V.; Dimov, S.G. Microbial community composition of the Antarctic ecosystems: Review of the Bacteria, Fungi, and Archaea identified through an NGS-based metagenomics approach. Life 2022, 12, 916. [Google Scholar] [CrossRef]
  45. Varliero, G.; Lebre, P.H.; Adams, B.; Chown, S.L.; Convey, P.; Dennis, P.G.; Fan, D.; Ferrari, B.; Frey, B.; Hogg, I.D.; et al. Biogeographic survey of soil bacterial communities across Antarctica. Microbiome 2024, 12, 9. [Google Scholar] [CrossRef]
  46. Krauze, P.; Wagner, D.; Yang, S.; Spinola, D.; Kühn, P. Influence of prokaryotic microorganisms on initial soil formation along a glacier forefield on King George Island, Maritime Antarctica. Sci. Rep. 2021, 11, 13135. [Google Scholar] [CrossRef]
  47. Cannone, N.; Wagner, D.; Hubberten, H.W.; Guglielmin, M. Biotic and abiotic factors influencing soil properties across a latitudinal gradient in Victoria Land, Antarctica. Geoderma 2008, 144, 50–65. [Google Scholar] [CrossRef]
  48. Almeida, I.C.; Schaefer, C.E.G.; Fernandes, R.B.; Pereira, T.T.; Nieuwendam, A.; Pereira, A.B. Active layer thermal regime at different vegetation covers at Lions Rump, King George Island, Maritime Antarctica. Geomorphology 2014, 225, 36–46. [Google Scholar] [CrossRef]
  49. Dedysh, S.N.; Damsté, J.S.S. Acidobacteria. In Bergey’s Manual of Systematics of Archaea and Bacteria; ELS: Boralesgamuwa, Sri Lanka, 2018. [Google Scholar] [CrossRef]
  50. Pascual, J.; Huber, K.J.; Overmann, J. Pyrinomonadaceae. In Bergey’s Manual of Systematics of Archaea and Bacteria 2018; John Wiley & Sons, Inc.: Hoboken, NJ, USA, 2018. [Google Scholar] [CrossRef]
  51. Gran-Scheuch, A.; Ramos-Zuñiga, J.; Fuentes, E.; Bravo, D.; Pérez-Donoso, J.M. Effect of co-contamination by PAHs and heavy metals on bacterial communities of diesel contaminated soils of South Shetland Islands, Antarctica. Microorganisms 2020, 8, 1749. [Google Scholar] [CrossRef]
  52. Bendia, A.G.; Moreira, J.C.F.; Ferreira, J.C.N.; Romano, R.G.; Ferreira, I.G.C.; Franco, D.C.; Evangelista, H.; Montone, R.C.; Pellizari, V.H. Insights into Antarctic microbiomes: Diversity patterns for terrestrial and marine habitats. An. Acad. Bras. Cienc. 2023, 95 (Suppl. S3), e20211442. [Google Scholar] [CrossRef]
  53. Han, J.; Jung, J.; Hyun, S.; Park, H.; Park, W. Effects of nutritional input and diesel contamination on soil enzyme activities and microbial communities in Antarctic soils. J. Microbiol. 2012, 50, 916–924. [Google Scholar] [CrossRef] [PubMed]
  54. Naloka, K.; Kuntaveesuk, A.; Muangchinda, C.; Kuntaveesuk, A.; Muangchinda, C.; Chavanich, S.; Viyakarn, V.; Chen, B.; Pinyakong, O. Pseudomonas and Pseudarthrobacter are the key players in synergistic phenanthrene biodegradation at low temperatures. Sci. Rep. 2024, 14, 11976. [Google Scholar] [CrossRef]
  55. Bridge, P.D.; Spooner, B.M.; Roberts, P.J. List of Non-Lichenised Fungi from the Antarctic Region; British Antarctic Survey: Cambridgeshire, UK, 2008; Available online: https://legacy.bas.ac.uk/bas_research/data/access/fungi/ (accessed on 17 September 2024).
  56. Rosa, L.H.; da Silva, T.H.; Ogaki, M.B.; Pinto, O.H.B.; Stech, M.; Convey, P.; Carvalho-Silva, M.; Rosa, C.A.; Câmara, P. DNA metabarcoding uncovers fungal diversity in soils of protected and non-protected areas on Deception Island, Antarctica. Sci. Rep. 2020, 10, 21986. [Google Scholar] [CrossRef]
  57. Câmara, P.E.A.S.; Carvalho-Silva, M. 180 years of botanical investigations in Antarctica and the role of Brazil. Acta Bot. Bras. 2020, 34, 430–436. [Google Scholar] [CrossRef]
  58. Câmara, P.E.A.S.; Carvalho-Silva, M.; Pinto, O.H.; Amorim, E.T.; Henriques, D.K.; da Silva, T.H.; Pellizzari, F.; Convey, P.; Rosa, L.H. Diversity and ecology of Chlorophyta (Viridiplantae) assemblages in protected and non-protected sites in Deception Island (Antarctica, South Shetland Islands) assessed using an NGS approach. Microbial Ecol. 2021, 81, 323–334. [Google Scholar] [CrossRef]
  59. Andreeva, V.M.; Kurbatova, L.E. Terrestrial and aerophilic nonmotile green microalgae (Chlorophyta) from regions of investigation of Russian Antarctic expedition. Nov. Sist. Nizsh. Rast. 2014, 46, 12–26. [Google Scholar] [CrossRef]
  60. Ye, M.; Cao, S.Q.; Jiang, S.T.; Pan, L.J.; Luo, S.Z.; Li, X.J. Species diversity of Lachnum (Helotiales, Hyaloscyphaceae) from temperate China. J. Zhejiang Univ. Sci. B 2006, 7, 20–27. [Google Scholar] [CrossRef]
  61. Bruyant, P.; Moënne-Loccoz, Y.; Almario, J. Root-associated Helotiales fungi: Overlooked players in plant nutrition. Soil Biol. Biochem. 2024, 191, 109363. [Google Scholar] [CrossRef]
  62. Kirk, P.M.; Cannon, P.F.; Minter, D.W.; Stalpers, J.A. Dictionary of the Fungi, 10th ed.; CAB International: Wallingford, UK, 2011. [Google Scholar]
  63. Rosa, L.H.; de Sousa, J.R.P.; de Menezes, G.C.A.; da Costa Coelho, L.; Carvalho-Silva, M.; Convey, P.; Câmara, P.E.A.S. Opportunistic fungi found in fairy rings are present on different moss species in the Antarctic Peninsula. Polar Biol. 2020, 43, 587–596. [Google Scholar] [CrossRef]
  64. Borden, K.A.; Mafa-Attoye, T.G.; Dunfield, K.E.; Thevathasan, N.V.; Gordon, A.M.; Isaac, M.E. Root Functional Trait and Soil Microbial Coordination: Implications for Soil Respiration in Riparian Agroecosystems. Front. Plant Sci. 2021, 12, 681113. [Google Scholar] [CrossRef]
  65. Darcy, J.L.; Schmidt, S.K. Nutrient limitation of microbial phototrophs on a debris-covered glacier. Soil Biol. Biochem. 2016, 95, 156–163. [Google Scholar] [CrossRef]
  66. Sun, L.; Ataka, M.; Han, M.; Han, Y.; Gan, D.; Xu, T.; Guo, Y.; Zhu, B. Root exudation as a major competitive fine-root functional trait of 18 coexisting species in a subtropical forest. New Phytol. 2020, 229, 259–271. [Google Scholar] [CrossRef]
  67. Yergeau, É.; Newsham, K.K.; Pearce, D.A.; Kowalchuk, G.A. Patterns of bacterial diversity across a range of Antarctic terrestrial habitats. Environ. Microbiol. 2007, 9, 2670–2682. [Google Scholar] [CrossRef] [PubMed]
  68. Wild, B.; Alves, R.E.; Bárta, J.; Čapek, P.; Gentsch, N.; Guggenberger, G.; Hugelius, G.; Knoltsch, A.; Kuhry, P.; Lashchinskiy, N.; et al. Amino acid production exceeds plant nitrogen demand in Siberian tundra. Environ. Res. Lett. 2018, 13, 034002. [Google Scholar] [CrossRef]
  69. Namsaraev, Z.; Bobrik, A.; Kozlova, A.; Krylova, A.; Rudenko, A.; Mitina, A.; Saburov, A.; Patrushev, M.; Karnachuk, O.; Toshchakov, S. Carbon emission and biodiversity of Arctic soil microbial communities of the Novaya Zemlya and Franz Josef Land archipelagos. Microorganisms 2023, 11, 482. [Google Scholar] [CrossRef]
Figure 1. Soil sample collection locations on the Keller Peninsula, King George Island. (a) The South Shetland Islands, Maritime Antarctic; (b) King George Island; (c) Keller Peninsula in Admiralty Bay; (d) oblique aerial photograph of Keller Peninsula; (e) paraglacial region (red rectangle) at Keller Peninsula where the samples were obtained (62°5′23.695″ S; 58°24′24.162″ W); (f) vegetated soil; and (g) non-vegetated soil. Photo d by L. H. Rosa; photos e and g M.R. Francelino.
Dna 05 00015 g001
Figure 2. Krona chart illustrating the prokaryotic ASVs detected across all seven soil samples obtained on Keller Peninsula, King George Island.
Dna 05 00015 g002
Figure 3. Krona chart illustrating the eukaryotic taxa assigned across the seven sampling sites on Keller Peninsula, King George Island.
Dna 05 00015 g003
Figure 4. Venn diagrams showing the distribution of (a) prokaryotic and (b) eukaryotic assemblages across the non-vegetated and vegetated soil samples obtained on Keller Peninsula, King George Island.
Dna 05 00015 g004
Figure 5. Measured values of carbon dioxide fluxes for non-vegetated soil and vegetated soil.
Dna 05 00015 g005
Table 1. Diversity indices of prokaryotic (Prok) and eukaryotic (Euk) assigned amplicon sequence variant (ASV) assemblages detected in the seven soil samples obtained on Keller Peninsula, King George Island, assessed using metabarcoding.
Non-Vegetated SoilsVegetated Soils
Diversity IndicesSite 1Site 2Site 3Site 4Site 5Site 6Site 7
ProkEukProkEukProkEukProkEukProkEukProkEukProkEuk
Number of DNA reads244,718370,446195,018408,136216,630427,360173,407306,00762,644162,660263,922690,288233,629700,190
Number of ASVs239214198211178175176201170124198134214171
Fisher’s-α (diversity)26.1421.9921.7621.4119.0617.319.3420.9621.2813.1620.9712.2523.2216
Margalef (richness)19.1816.6116.1716.2514.4113.4214.5115.8315.310.2515.789.917.2312.63
Simpson’s (dominance)0.970.910.970.840.970.830.960.790.970.820.970.720.970.75
Table 2. General prokaryotic and eukaryotic diversity detected in the non-vegetated and vegetated soil samples obtained on Keller Peninsula, King George Island, and the measured carbon dioxide fluxes.
Soil Samples
Non-Vegetated SoilVegetated Soil
Diversity IndicesProkEukProkEuk
Number of DNA reads656,3661,205,942733,6021,859,145
Number of ASVs307316279279
Fisher’s-α (diversity)30.829.7927.3624.86
Margalef (richness)22.8522.520.5819.26
Simpson’s (dominance)0.970.880.970.76
µmol CO2 m−2 s−1
NEE 0.13 ± 0.0430.19 ± 0.297
ER0.206 ± 0.0600.567 ± 0.346
Prok = prokaryote; Euk = eukaryote; CO2 = carbon dioxide flux; ASVs = amplicon sequence variants; NEE = net ecosystem exchange; and ER = ecosystem respiration (ER).
Disclaimer/Publisher’s Note: The statements, opinions and data contained in all publications are solely those of the individual author(s) and contributor(s) and not of MDPI and/or the editor(s). MDPI and/or the editor(s) disclaim responsibility for any injury to people or property resulting from any ideas, methods, instructions or products referred to in the content.

