Article

Investigating the Physicochemical Property Changes of Plastic Packaging Exposed to UV Irradiation and Different Aqueous Environments

1
Department of Process Engineering, Stellenbosch University, Private Bag X1, Matieland 7602, South Africa
2
SINTEF Ocean, 7465 Trondheim, Norway
*
Author to whom correspondence should be addressed.
Microplastics 2022, 1(3), 456-476; https://doi.org/10.3390/microplastics1030033
Submission received: 20 June 2022 / Revised: 27 July 2022 / Accepted: 15 August 2022 / Published: 17 August 2022
(This article belongs to the Collection Current Opinion in Microplastics)

Abstract

:
A wide range of weathering processes contributes to the degradation of plastic litter items which leads to the formation of microplastics that may be detrimental to marine ecosystems and the organisms inhabiting them. In this study, the impact of UV exposure on the degradation of clear polypropylene (CPP), black polypropylene (BPP), and polyethylene terephthalate (PET) packaging materials was investigated over a period of 6 weeks under dry air conditions representing the terrestrial environment. The exposure was conducted using differently sized and shaped samples at irradiation intensities of 65 W/m2 and 130 W/m2. Results indicated that UV irradiation led to changes in the properties of PET, BPP, and CPP that were proportional to the intensity delivered, leading to a higher level of mass loss, carbonyl indices, crystallinities, and microhardness in all polymer types at 130 W/m2 relative to 65 W/m2. However, material shape and size did not have a significant influence on any property for any of the test materials. Increased mass loss over time was accompanied by considerable increases in carbonyl index (CI) for both PPs. Clear PP (CPP) underwent the most severe degradation, resulting in the highest mass loss, increase in crystallinity, and CI. BPP was less degraded and modified by the UV irradiation than the CPP, indicating that the colorant, carbon black, provided some degree of protection to the bulk polymer material. PET was the least degraded of the three materials, suggesting this polymer type is more resistant to UV degradation. The differences in the degradation behaviours of the three test materials under dry environmental conditions indicate that the UV exposure history of plastic litter might play an important role in its potential for further degradation once it reaches the marine environment. Furthermore, analysis of samples exposed to UV in aqueous media reveals a more irregular set of trends for most material properties measured. Overall, the degree of degradation resulting from UV irradiation in dry environments was more pronounced than in aqueous environments, although the most significant property changes were observed for materials without previous UV exposure histories. Samples with previous UV histories showed higher resistance to further crystallinity changes, which appeared to be due to crosslinking in the pretreatment exposures inhibiting chain alignment into crystalline structures. The effect of solution medium was insignificant, although the presence of water allowed hydrolytic degradation to proceed simultaneously with UV degradation for PET. The reduction of CI in pretreated materials in the aqueous exposures, combined with the mass loss, suggest that the degraded surface layer erodes or products dissolve into surrounding solution medium, leaving a fresh surface of plastic exposed.

1. Introduction

The global production of plastic is increasing and had already reached 395 million tons in 2018 [1], with emissions leading to marine habitats being exposed to massive pressure by plastic materials, including discarded or entangled fishing nets, plastic bottles, lids, straws, and bags, among others [2]. Although plastic is often considered to be a persistent form of pollution, a wide range of degradation mechanisms, including UV irradiation, mechanical/physical stress, and microbial degradation, begin to act upon the material once plastic material enters the marine environment [3,4,5]. These degradation processes drive fragmentation of plastic debris into smaller and smaller items, including microplastics (MP) and nanoplastics (NP). Fragmentation is facilitated by a combination of changes in physicochemical properties that weaken the bulk polymer material. UV-induced oxidation is considered to be the most effective degradation mechanism for many plastic materials following their release into the natural environment [3,6].
Exposure of plastic materials to sunlight can cause UV-induced oxidation to occur, which alters the surface chemistry, resulting in the formation of hydroxy, carbonyl, and carboxy groups on the particle surface, as well as cracking and fragmentation that leads to embrittlement of the polymer material [3,5,7,8,9,10]. In combination with mechanical forces occurring in the natural environment (e.g., wind, waves, etc.), UV degradation drives fragmentation, increasing the available surface area, and generates MP and NP particles, as well as molecular fragments [11]. The resulting particulate and molecular degradation products can ultimately undergo mineralization by microbes to CO2 [11]. The order and rate at which these degradation mechanisms act upon the material are strongly influenced by the polymer composition. For example, abiotic degradation precedes biodegradation in polymers containing a purely carbon-based backbone, while those containing heteroatoms can undergo hydrolysis, photooxidation, and biodegradation simultaneously [3]. Although UV degradation has been demonstrated separately under atmospheric and aquatic exposure conditions, to our knowledge, few data exist concerning the environmental degradation of plastic exposed sequentially to different environmental matrices.
Chemical additives are incorporated into the polymer matrix specifically to impart physical, chemical, and even biological changes that have a positive impact performance and functionality [12]. One common class of plastic chemical additives is UV stabilizers, which serve to protect polymer materials from UV-induced degradation and include compounds such as benzophenones [13]. The presence of such chemicals can therefore have a significant impact on the susceptibility of a material to UV degradation and their presence is likely to increase their persistence in the environment [14,15,16]. While additive chemicals can leach from pristine plastic materials into the aquatic environment [17], the UV degradation process has also been shown to promote the release of chemical additives incorporated into the initial polymer products [16,18]. Furthermore, these microplastics may act as transport vehicles for persistent organic pollutants (POPs) to vulnerable ecosystems [8,19], although the impacts of degradative processes on this mechanism do not appear to have been previously studied.
Many marine species are unable to distinguish between plastic material and the natural food items that comprise their everyday diets, with plastic particles being ingested either indirectly or directly [20,21,22,23]. While a range of toxic effects have been reported in aquatic organisms following the ingestion of plastic and microplastic, most studies have utilized pristine and spherical reference plastic particles rather than the partially degraded, irregular-shaped particles that dominate in the natural environment [20]. Studies that have investigated more environmentally relevant materials have demonstrated clear differences in toxicity and mechanisms of toxicity between spherical and irregular-shaped particles [24], but it remains unclear how changes in surface chemistry deriving from UV-induced degradation impact organisms. Furthermore, the physical and chemical changes resulting from UV-induced degradation may influence the behaviour of the articles in the natural environment and, subsequently, their exposure to organisms. As result, there is a lack of understanding regarding the physicochemical properties driving observed toxicological responses, as well as the mechanisms of toxicity.
To date, a majority of studies in the plastics pollution field have had a strong focus on quantification of environmental levels, including development of innovative sample collection techniques, extraction and isolation methods, clean up steps, and subsequent analysis, identification, and quantification [25]. Although these studies provide insights into location-specific concentration levels, they do not address the actual factors leading to the degradation and fragmentation of plastic pieces. An enhanced understanding of the degradation processes and the specific factors contributing to these processes is required. In order to appreciate the ways according to which plastics degrade, their properties have to be examined in detail. Plastic properties are known to markedly determine degradation rates, as well as influence the nature of their degradation [26].
The current study investigated the sequential UV degradation of two polymers widely used as packaging materials in consumer products, polypropylene (PP) and polyethylene terephthalate (PET). In the first step, degradation of differently shaped polymer materials was conducted in air under two different irradiance intensities (65 and 130 W/m2). The period was chosen to simulate the period of time items of plastic debris spend in the terrestrial environment prior to being transported into the marine environment. Following the initial degradation in dry environment (air), degraded and fresh (non-degraded) samples were then immersed in either seawater or demineralized water and again exposed to different levels of UV radiation for 6 weeks. Changes in the mass, crystallinity, microhardness, and chemical functional groups of the polymer materials were determined during both 6-week exposure periods.

2. Materials and Methods

2.1. Materials and Sample Preparation

The PET, black PP (BPP), and clear PP (CPP) test materials were obtained in the form of sheets from Zibo Containers (Pty) Ltd. as their products are representative of typical single-use packaging containers commonly found in consumer products. The PET was classified as amorphous while the PPs were unfilled homopolymers that were clarified during nucleation by the manufacturer. A thin layer of food-approved silicone was applied to the outside of the PET sheets during manufacturing. The thicknesses of the sheets were measured to be 0.32 mm for PET, 0.33 mm for BPP, and 0.50 mm for CPP. These sheets were used to prepare a series of test materials of different sizes and shapes, including small circular (Ø 6 mm), large circular (Ø 12 mm), small rectangular (8 × 4 mm), and large rectangular (40 × 10 mm). Circles and rectangles were selected in order to provide different edges to the samples, including corners in the case of the rectangles.

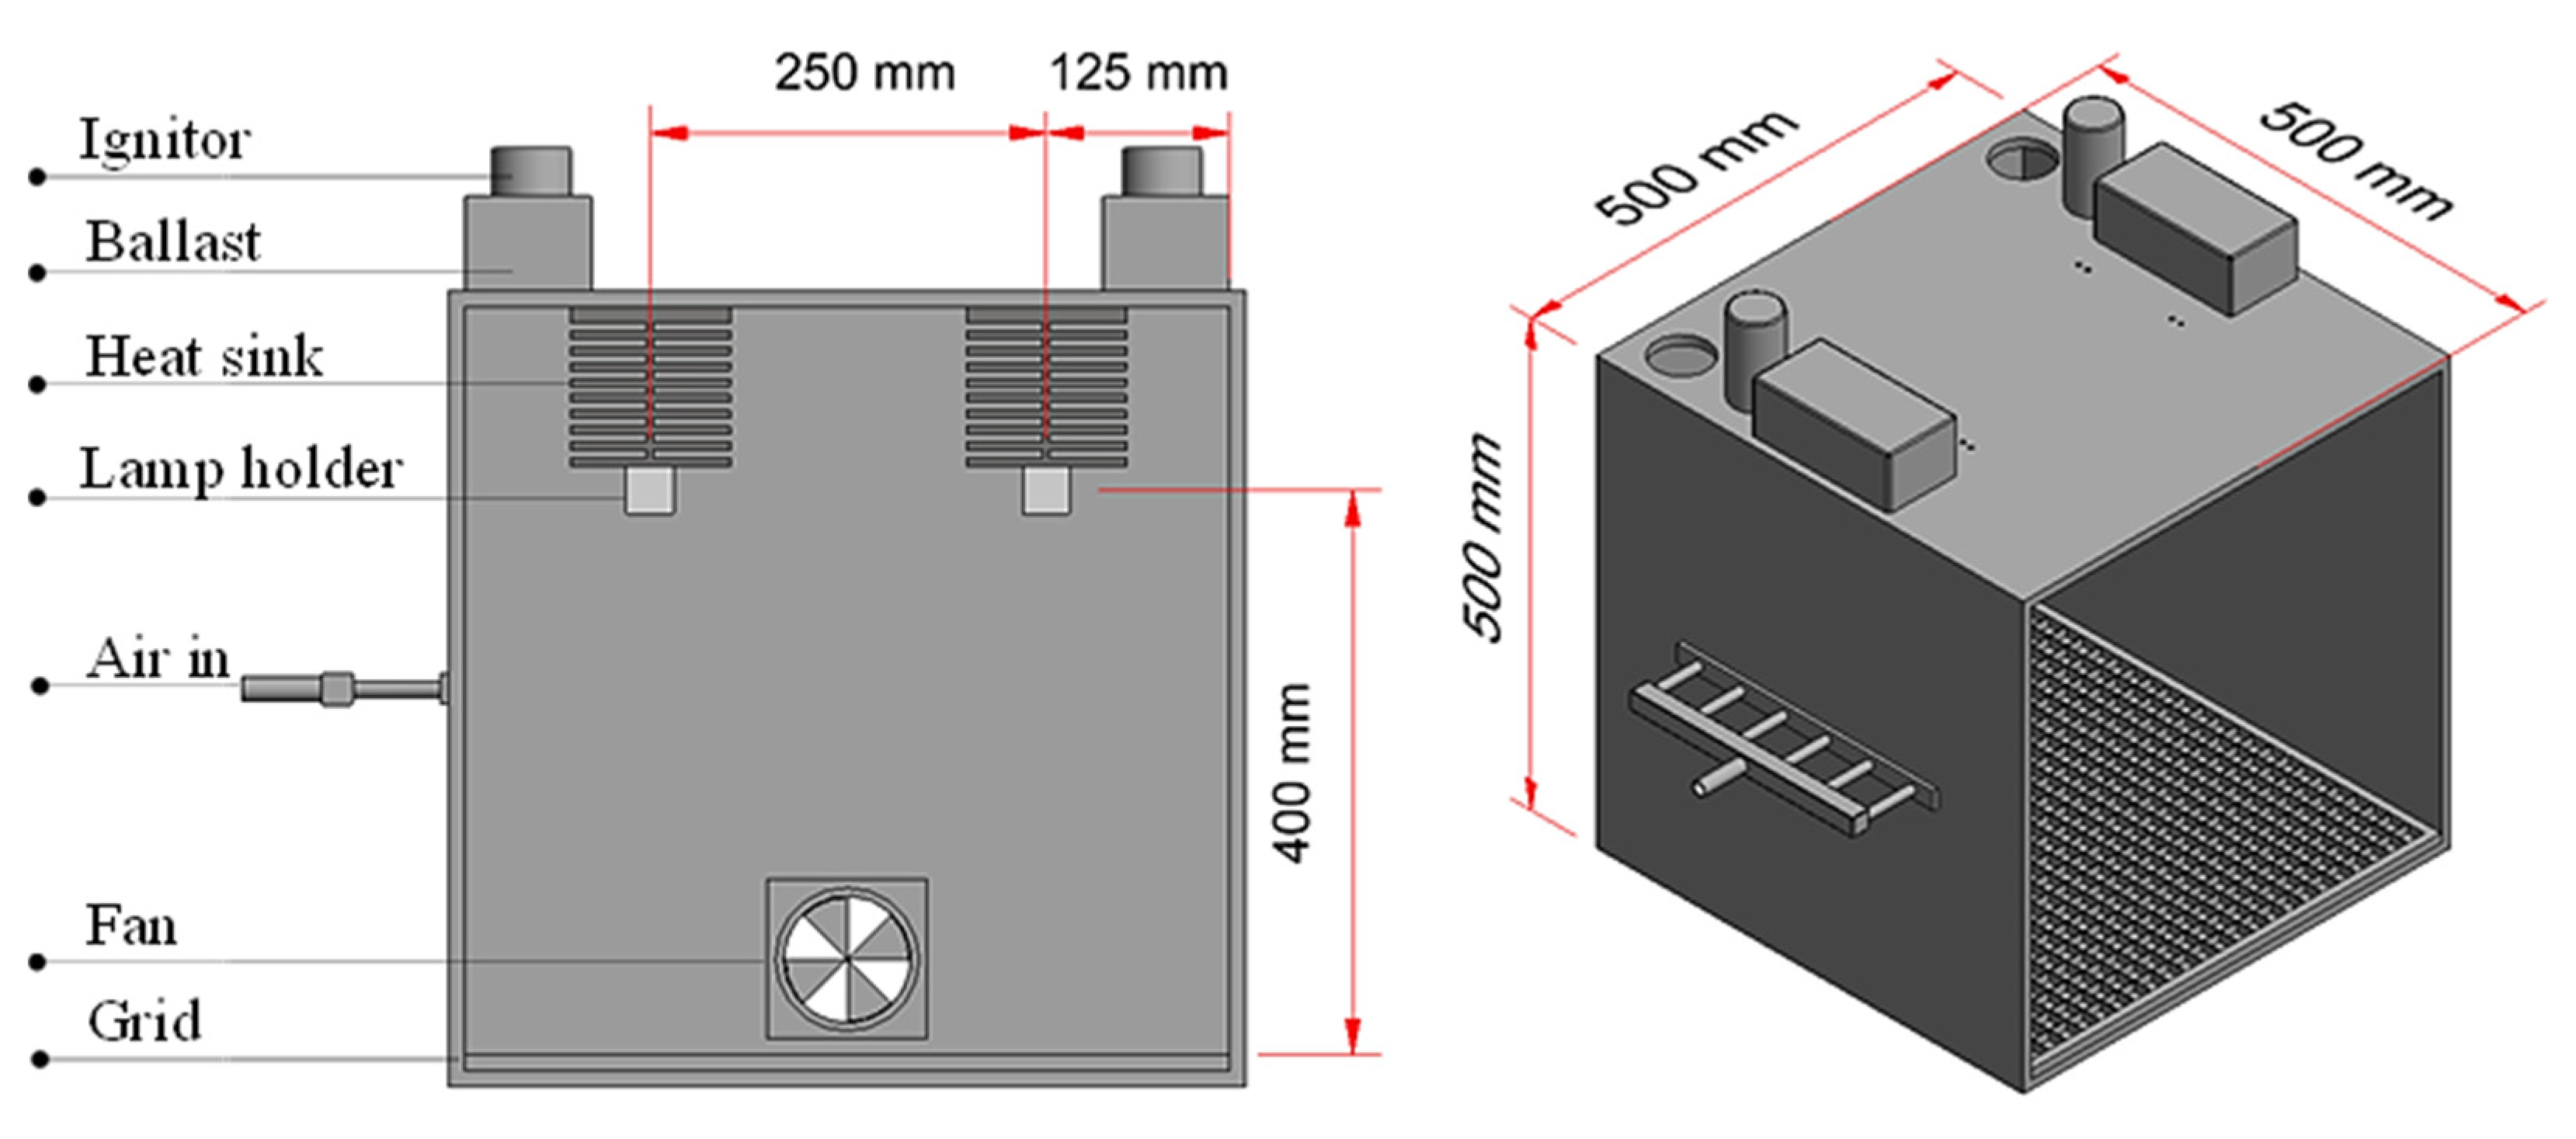
2.2. UV Exposure Chamber

The dry atmospheric UV degradation tests were conducted in an in-house-designed UV chamber composed of stainless steel (Figure 1). The cubic chamber had a total volume of 125 L and was equipped with two OSRAM Supratech HTC (400-221) UV lamps, each mounted onto its own heat sink. The spectral distribution of the lamps used in this study corresponded almost exactly with the reaction profiles of photosensitive plastics [27]. The lamps emit both UVA (315–380 nm) and UVB (280–315 nm) radiation, simulating the wavelengths found in natural sunlight. Importantly, the quartz bulb absorbs radiation below 250 nm, preventing ozone from being generated. The UV chamber was fitted with an adjustable steel grid that enabled distance control to and from the UV source. To ensure there was no heat build-up, compressed air was sparged at 5 L/min through the chamber. A small axial computer fan was installed at the bottom backside of the chamber and two vents were located at the top backside corners to facilitate air and heat exchange outside of the chamber.

2.3. UV Exposure in Air for Pretreatment

The PET and PP plastic film test materials were treated with UV radiation under dry conditions to simulate discarded plastic waste typically spending a period of time on land before being transported to the ocean via rivers and wastewater channels. The objectives of the treatment were to perform an accelerated partial degradation and to add a known degradation history to the material. Two irradiance levels (65 W/m2 and 130 W/m2) were utilized, where irradiance was varied by adjusting the number of lamps in use. Based on the continuous 24 h daily (12 h on/off cycle) dose employed, it was estimated that these levels were 3 and 6 times higher than the average daily irradiance from the sun in the Western Cape of South Africa. By increasing the distance of the samples from the UV source and ensuring adequate ventilation, the temperature at the sample surface was kept between 30 °C and 40 °C while the chamber was in operation.
After sorting the samples according to shape and type, they were placed in aluminium trays ready for exposure. Care was taken to ensure equal spacing between each sample and that there was no overlap between adjacent samples. Once a stable temperature had been achieved in the exposure chamber, the aluminium trays were placed inside (this corresponded to t = 0 weeks). On every second day, the trays were carefully rearranged to ensure equal light distribution and each individual sample was carefully turned over with metal tweezers. All exposures were conducted over a period of 6 weeks, with ten random samples of each plastic type, size, and shape collected fortnightly for analysis at every sampling interval. Samples were immediately weighed and stored at 4 °C prior to further analysis.

2.4. Aqueous UV Degradation Studies

The effect of UV radiation on the degradation of the pretreated (UV exposure in air) and pristine PP and PET plastic sheet materials was assessed in aqueous environments by conducting UV irradiation exposures in 375 mL glass beakers. The exposure conditions for the aqueous UV exposure tests were similar to the pretreatment, with the main difference being that the plastic samples were exposed inside glass beakers filled with either 200 mL of seawater or demineralized water. Seawater was obtained from the Gordon’s Bay area of Cape Town, South Africa. The pH was measured to be 8.07, which falls within the typical pH range of 7.9–8.2 [28]. Conductivity was measured to be 17.37 mS and the salinity and dissolved oxygen concentration of water from this location were recently reported to range between 35–35.2 PSU and 4.5–6 mg/L, respectively [29].
The pretreated samples were handled using metal tweezers and special care was taken not to damage any samples during transfer to the beakers. To reduce evaporation, the beakers were tightly sealed with quartz lids and placed into aluminium trays. Once the UV chamber temperature stabilized, the sample trays were placed inside, and the exposure period started (t = 0 weeks). The beakers were rearranged every second day and gently swirled when samples had adhered to the beaker walls. Exposures were again conducted over a duration of six weeks, with sampling was conducted fortnightly. At each sampling interval, ten random samples (of each plastic type, UV history, and from each solution medium) were taken for analysis. At each sampling interval the water was drained and replaced to retain salinity. The removed samples were gently rinsed with demineralized water before being dried ambiently over 24 h and thereafter weighed and stored at 4 °C prior to analysis. The remaining samples were immersed in replaced solutions and placed back into the UV chamber for further exposure.

2.5. Analyses and Data Interpretation

2.5.1. Mass Loss

Measuring mass is the simplest and most direct way to quantify the extent of degradation [30]. Since degradation predominantly takes place at the surface, the rate of mass loss is closely related to, and usually proportional to, the surface area of the plastic piece [31]. Reductions in mass are typically due to a combination of loss of fragments from the main sample item [6] or through the volatilization or solubilization of converted plastic material to small molecules, including CO2 and H2O. To determine percentage mass loss, the initial weights of dry samples were recorded using a Sartorius 4-decimal analytical balance. Twenty samples of each plastic type and shape were weighed, and the standard error of the mean (SEM) was determined by the population standard deviation divided by the square root of the sample size. The percentage mass loss was determined at each sampling interval according to Equation (1) below.
M a s s   l o s s   ( % ) = W i W f W i × 100
where W i and W f represent the average initial and final mass values, respectively.

2.5.2. Differential Scanning Calorimetry (DSC)

The DSC technique is based on the detection of enthalpy (or specific heat) changes of a sample with temperature. For this investigation, a Q200 DSC instrument (TA Instruments, New Castle, DE, USA) was used. Samples (5–10 mg) were weighed and then sealed in aluminium trays. The trays were then heated from ambient temperature at a rate of 10 °C min−1 to a ceiling temperature of 200 °C for PP and 300 °C for PET. An empty aluminium tray was used as a reference and the system was operated under a continuous nitrogen flow of 20 mL min−1. Parameters including temperature (onset and peak) as well as melting enthalpies were determined using the integration function of the TA Universal Analysis software. Depending on the individual baselines, integrations were either linear, sigmoidal–horizontal, or sigmoidal–tangential. Melting enthalpies were used to determine the percentage crystallinity using Equation (2) below.
C r y s t a l l i n i t y   ( % ) = Δ H m Δ H m r e f × 100
where Δ H m depicts the melting enthalpy per unit mass (J/g) of a sample and Δ H m r e f the theoretical value of the melting enthalpy per unit mass of a 100% crystalline polymer. For PP and PET, the reference enthalpies of 207 J/g and 140 J/g were used, respectively [32,33].

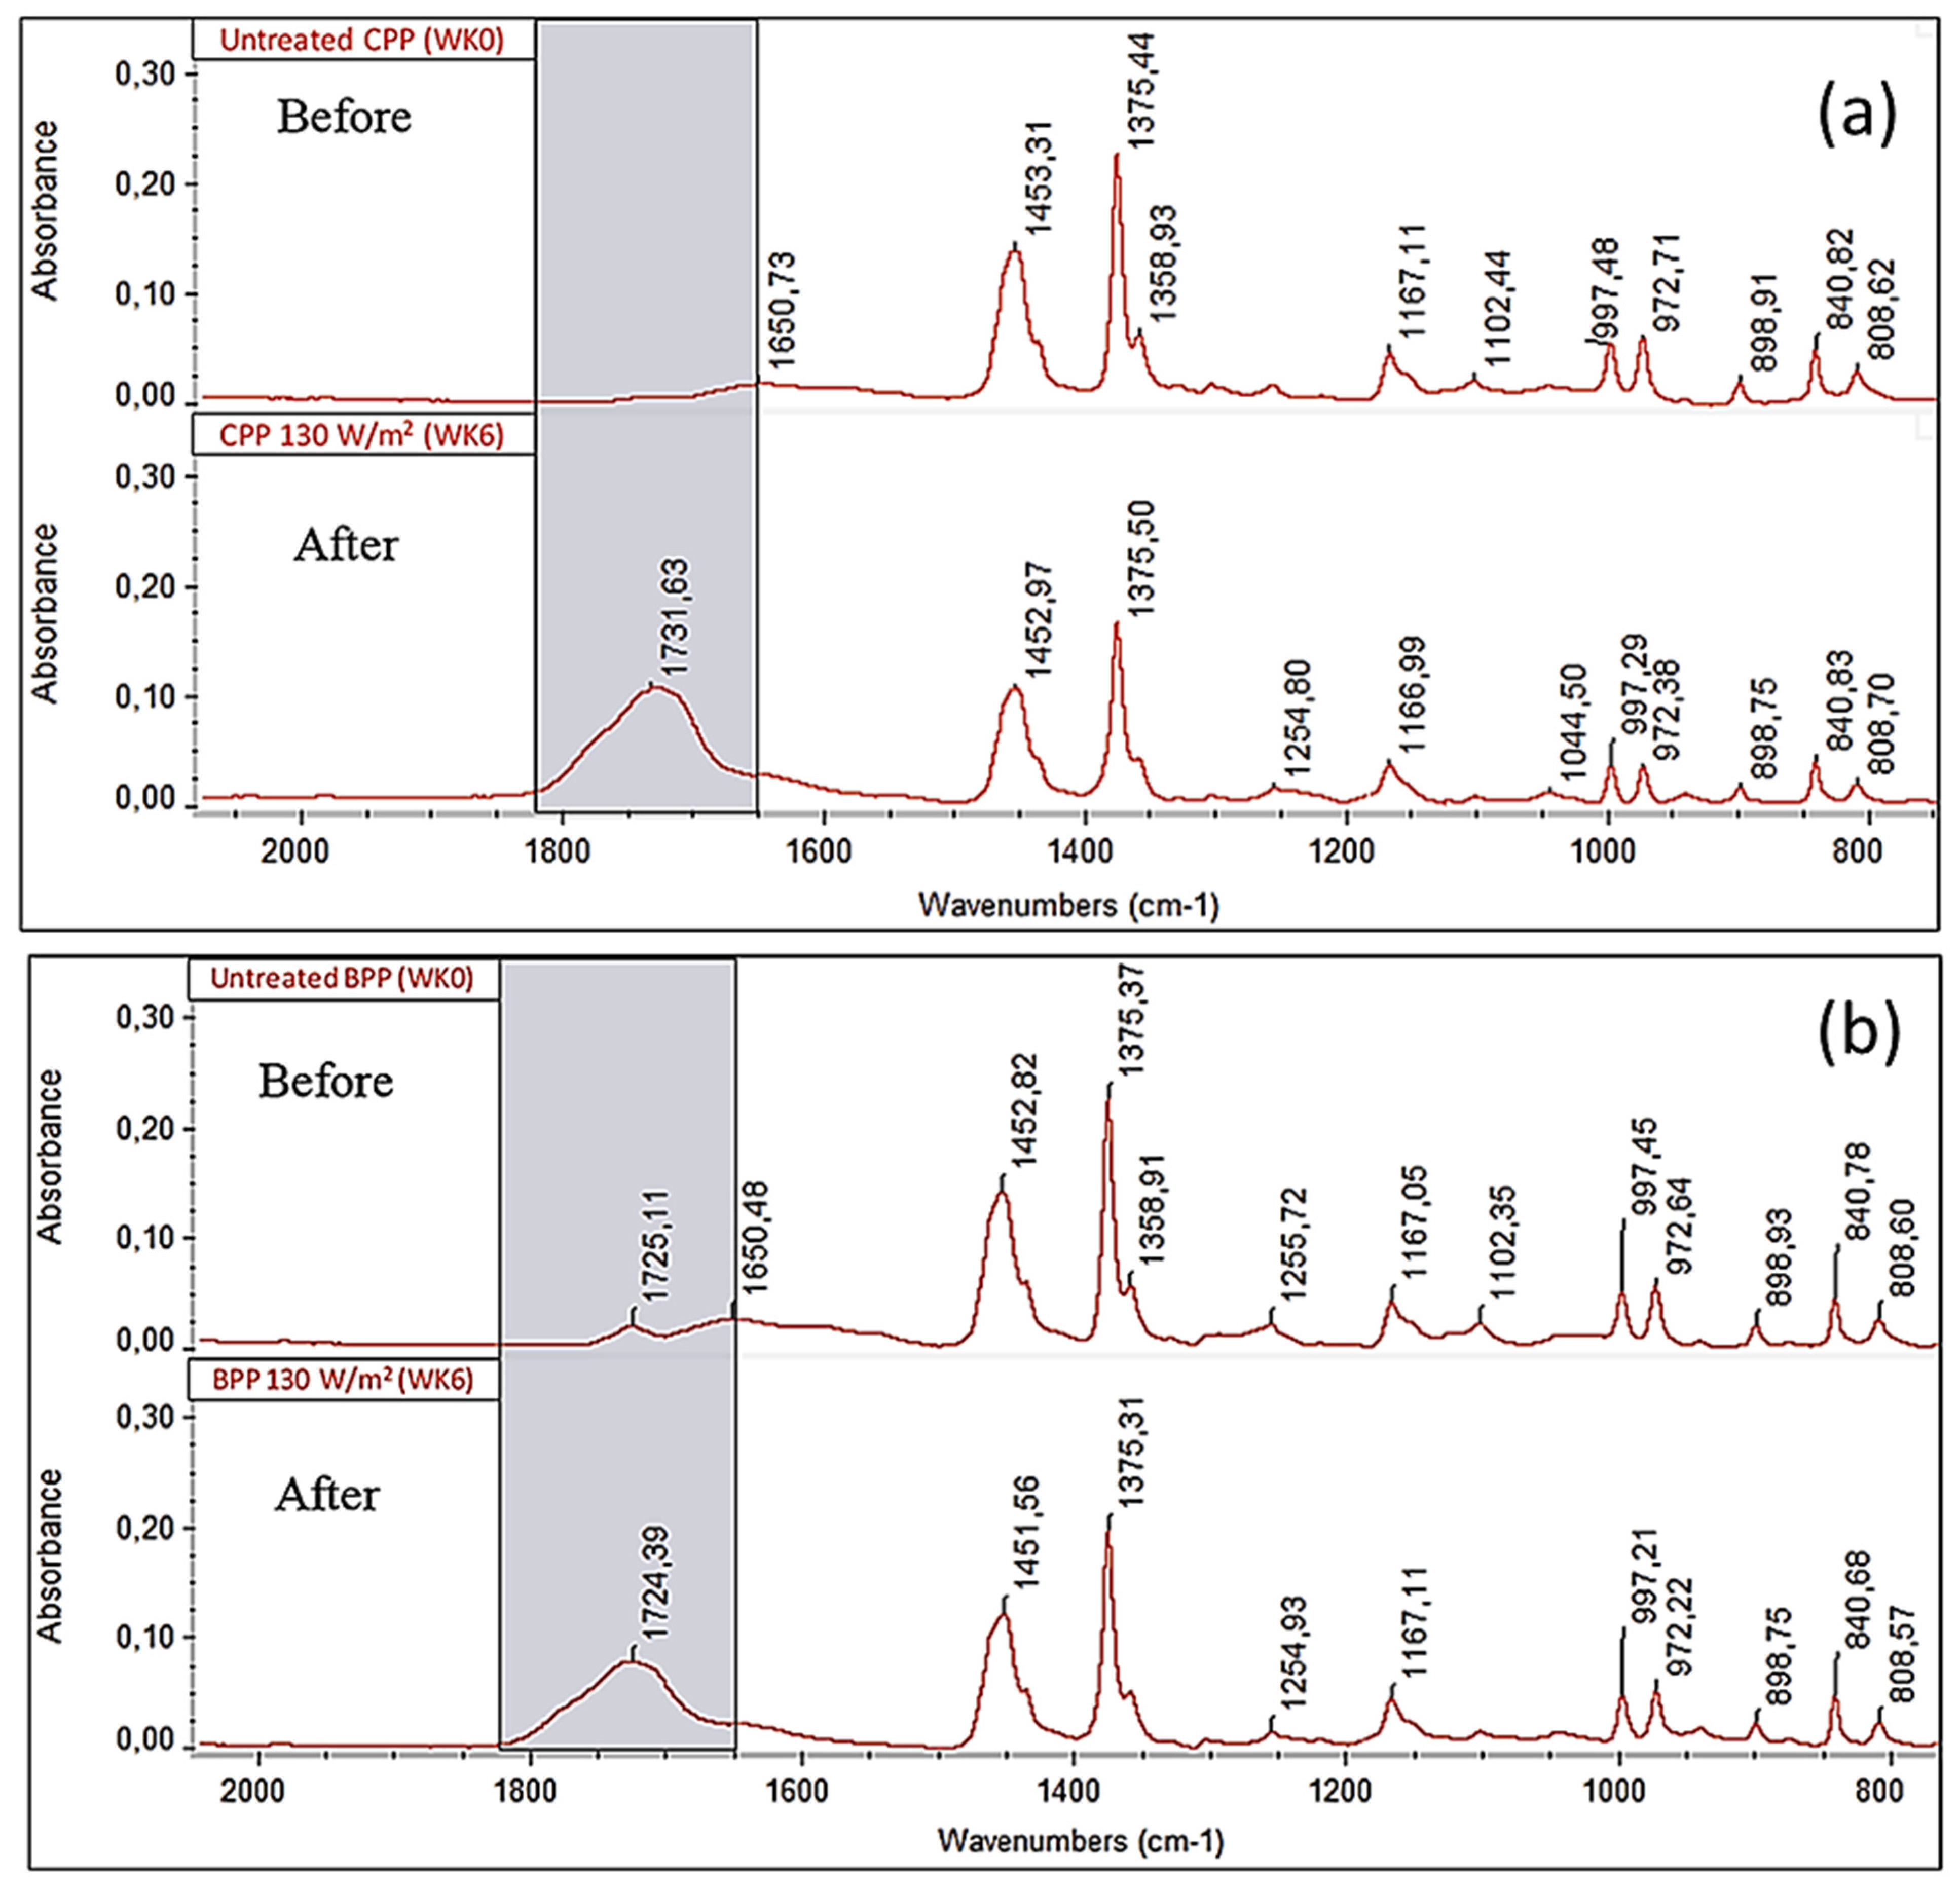
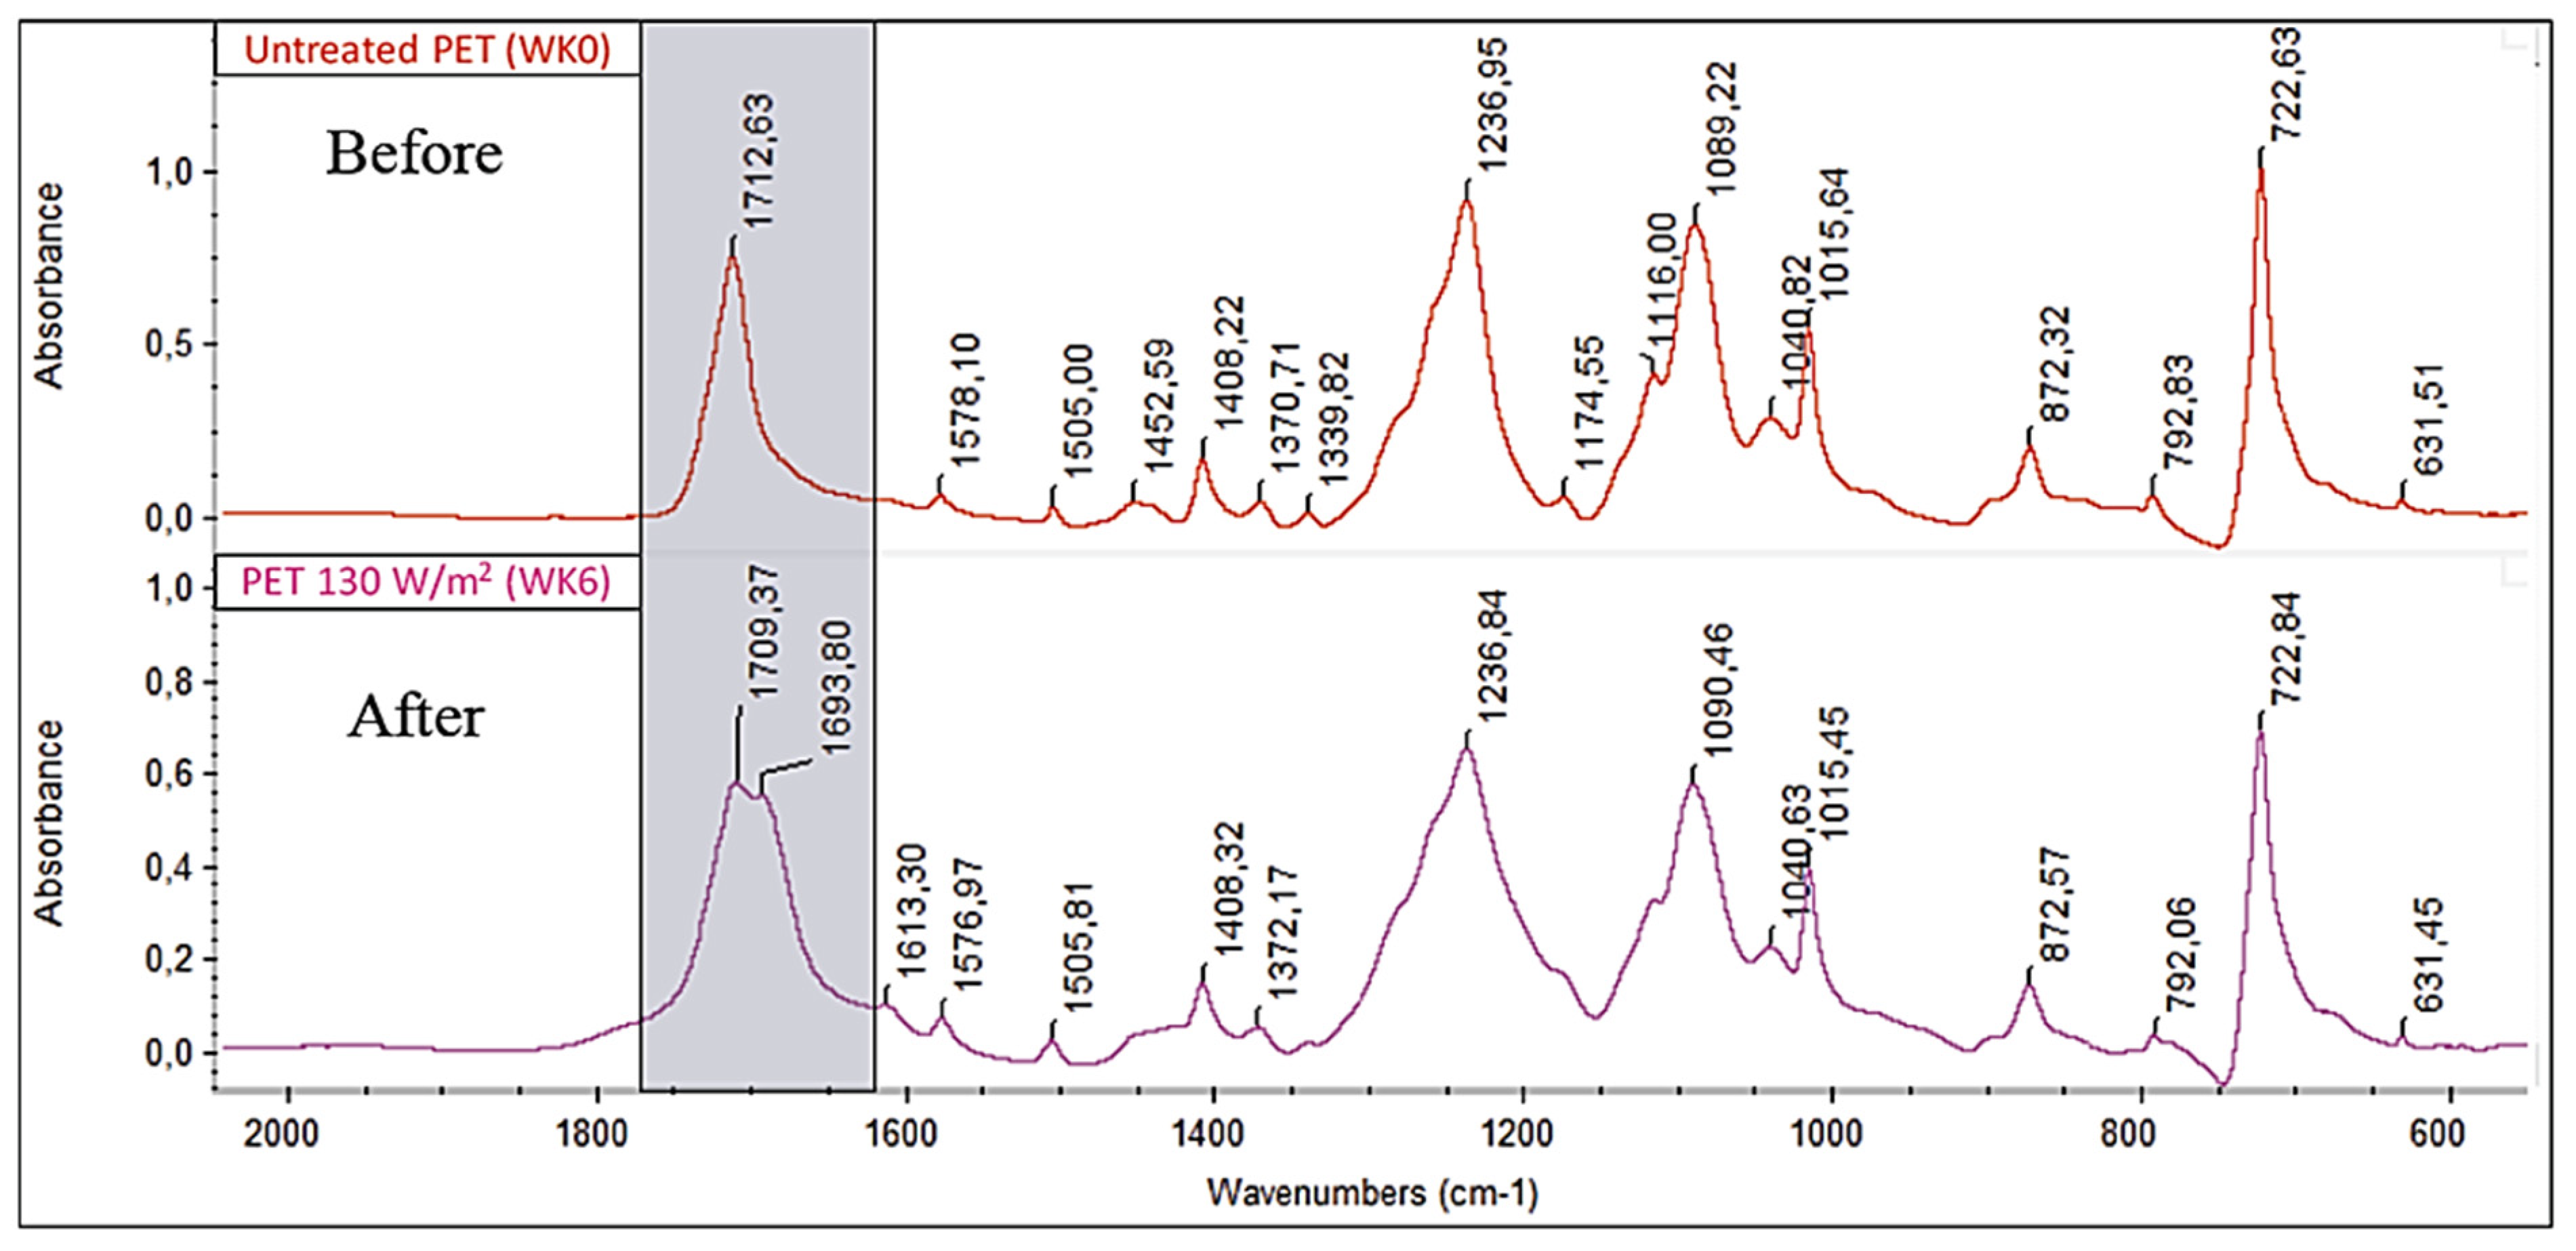
2.5.3. Fourier-Transform Infrared Spectroscopy (FTIR)

FTIR analyses were performed using a Thermo Nicolet iS10 spectrometer (Waltham, MA USA), which consisted of a Smart iTX ATR sampling attachment equipped with a diamond crystal. An incident angle of 45° was used for all measurements. Spectra were collected at a resolution of 4 cm−1 with 32 scans collected for each spectrum between a wavenumber range of 400–4000 cm−1. Thermo Scientific OMNIC software was used to analyse the resulting spectral data. To monitor chemical degradation changes, the carbonyl and hydroxyl regions were monitored for all plastic samples. The carbonyl index (CI) was used to quantify changes in the corresponding functional groups. The CI was calculated in two ways using Equation (3); first from areas under the absorbance curve within a specific wave number range, and second by carbonyl peak height.
C I = A b s ( C = O ) A b s ( r e f )
The overlapping of spectral IR peaks is a common problem that has been previously reported and which makes the interpretation only semiquantitative [34]. The carbonyl frequency range used in this study was between 1540 cm−1 and 1870 cm−1, with the peak centred at around 1725 cm−1 for the two PP materials and 1710 cm−1 for PET material.

2.5.4. Microhardness

Hardness is the measure of a material’s resistance to localized deformation [35]. Vickers microhardness tests were performed using a UHL VMHT-001 instrument (WALTER UHL, Aßlar, Germany). Triplicate samples of each plastic type were analysed in different locations on both sides of the material. The procedure involved a small diamond indenter with a pyramidal geometry that was forced into the surface of the sample. The resulting impression was then observed under a calibrated microscope and the diagonal distance across the indentation measured manually. The measurement is converted to a hardness value by Equation (4), where F depicts the applied load (kg-f) and d the average diagonal distance (mm) across the indentation [36].
H V = 1.8544 F d 2

2.5.5. Analysis of Variance (ANOVA)

In order to comment on the significance of a particular material property, one-way ANOVA was employed. All analyses were conducted via Minitab statistical software (Minitab® 19 Statistical Software, Minitab LLC, State College, PA, USA). These were used to determine whether there were statistically significant differences between the final mean values of different populations as main effect test. In the analysis of variance, main effect is the effect of an independent variable on a dependent variable averaged across the levels of any other independent variables. Main effect test looks at whether overall there is a particular factor that is responsible for the observed difference [37]. During these analyses, the null hypothesis was that all level means were equal. The alternative hypothesis was that one (or more) of the means differed from the other. By considering the determined p-values, it was possible to accept or reject the null hypothesis. For instances where the p-value was less than or equal to the selected α-value (0.05), it could be concluded that the specific property of interest resulted in a significant difference to UV exposure. Conversely, if the p-value was greater than the α-value, then the material property was found not to have resulted in significant differences at this level of confidence.

3. Results and Discussion

3.1. UV Pretreatment in Air
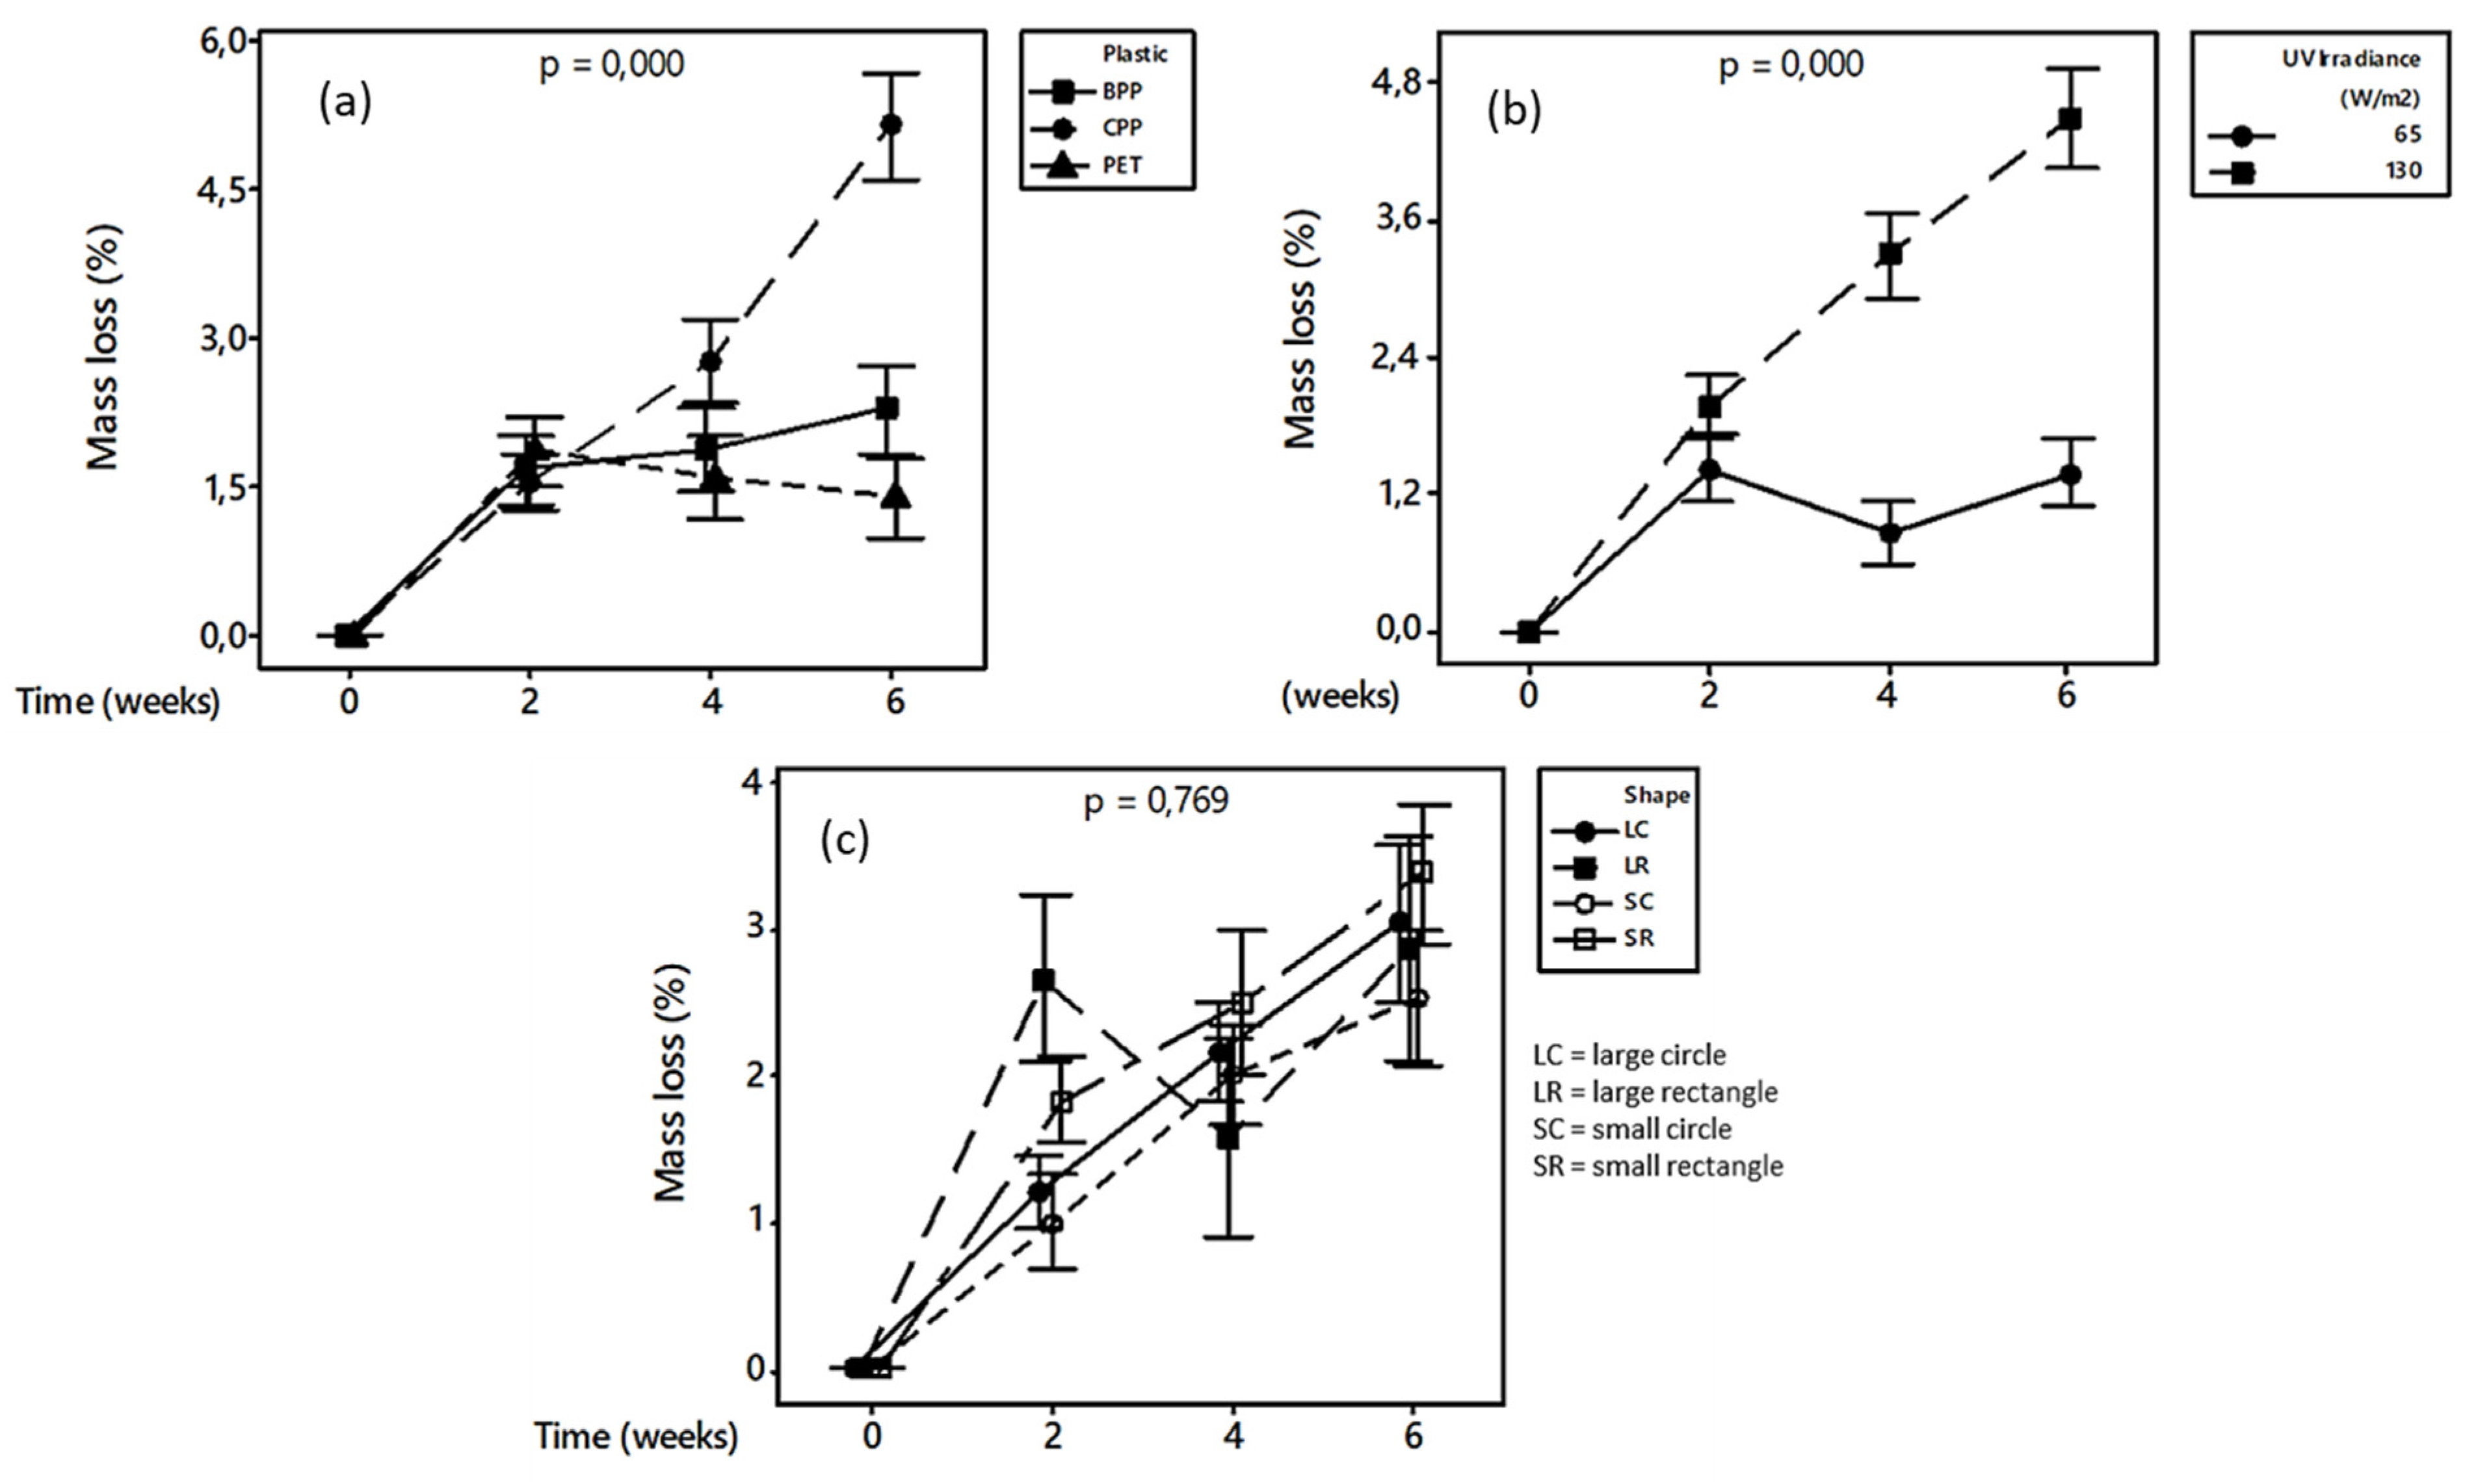
3.1.1. Mass Loss

During degradation, plastic material may exhibit mass loss that typically stems from volatile or soluble components being released from the plastic matrix or from a physical process where fragments break away from larger segments by means of erosion or surface ablation. Figure 2a demonstrates the differences in mass loss that arose from different plastic types as a main effect. For the first two weeks of UV exposure, the mass loss behaviour was quite similar for the BPP, CPP, and PET materials. Thereafter, the trends deviated, with CPP continuing to lose weight until the end of the exposure period (6 weeks). BPP also continued losing weight, albeit more moderately, while PET showed no further increase in mass loss. In fact, PET appeared to undergo a nonsignificant increase in mass between 2 weeks and 6 weeks, perhaps reflecting the addition of oxygen atoms to the surface of the material during the UV degradation process. Ultimately, CPP showed the highest mass loss of 5.1% after 6 weeks, followed by BPP at 2.3%, and PET at 1.4%. The results demonstrate that both polymer composition and colour have the potential to play an important role in influencing the degree and rate of degradation occurring from exposure to UV irradiation.
These differences could be described by considering compositional differences, specific wavelength sensitivities, and additives incorporated into the different plastics. PPs have carbon–carbon backbones, while PET contains heteroatoms (oxygen) in its main chain. Owing to the presence of its tertiary carbon atoms, PP is known to be highly susceptible to UV degradation. On the other hand, PET shows good UV resistance due to its stabilizing aromatic rings. Furthermore, the most damaging UV wavelength for a specific polymer type depends on the bonds present, and therefore maximum degradation occurs at different wavelengths for different plastic types, e.g., it is at approximately 300 nm for PET and 370 nm for PP [38]. The spectral radiation distribution of lamps used in this investigation showed a maximum peak intensity at 365 nm which corresponds well to the peak wavelength sensitivity of PP and supports the higher extent of degradation observed the PP materials compared to the PET.
When comparing the two differently coloured PP test materials (CPP and BPP), the presence of the carbon black colorant in BPP serves to protect the material from undergoing the same degree of degradation observed for the CPP. It is believed that carbon black was used as a pigment in BPP, but this is not confirmed. This additive protects the interior by acting as a physical screen, absorbing UV light and converting energy to heat. It may also act as a radical trap and a terminator of the free-radical chain reactions through which oxidative degradation is propagated [39]. Therefore, BPP did not show the same level of mass loss as observed for CPP. Figure 2b demonstrates the intensity of UV irradiance as a main effect, which has a significant impact on mass loss for CPP. The higher irradiance level of 130 W/m2 resulted in significantly increased rates and extents of mass loss than the lower irradiance level of 65 W/m2, with a 3.3 times greater mass loss at the higher intensity after 6 weeks. This is readily explained by the increased amount of electromagnetic energy reaching the polymer surface, enabling more UV to be absorbed, creating higher excitation states, and increasing the level of radical formation that initiates degradation reactions. These reactions lead to chain scission or direct cleavage of bonds holding the polymer and its additives together, resulting in fragmentation of the polymer that drives the observed mass loss.
Figure 2c shows the influence of plastic shape and size as a main effect on mass loss during the UV treatment. It was found that neither size nor shape resulted in significant differences in the final mass loss values (as a percentage) after exposure at 130 W/m2, as evidenced by the p-value of 0.769. Minor differences in mass loss for the different shapes might have been due to (i) heterogeneity, as degradation is expected to preferentially take place in the amorphous regions, with these regions unequally distributed, or (ii) the rectangular pieces of plastic might be potentially more susceptible than the rounded edges of the circles due to localization of higher stress concentrations at the sharp edges.

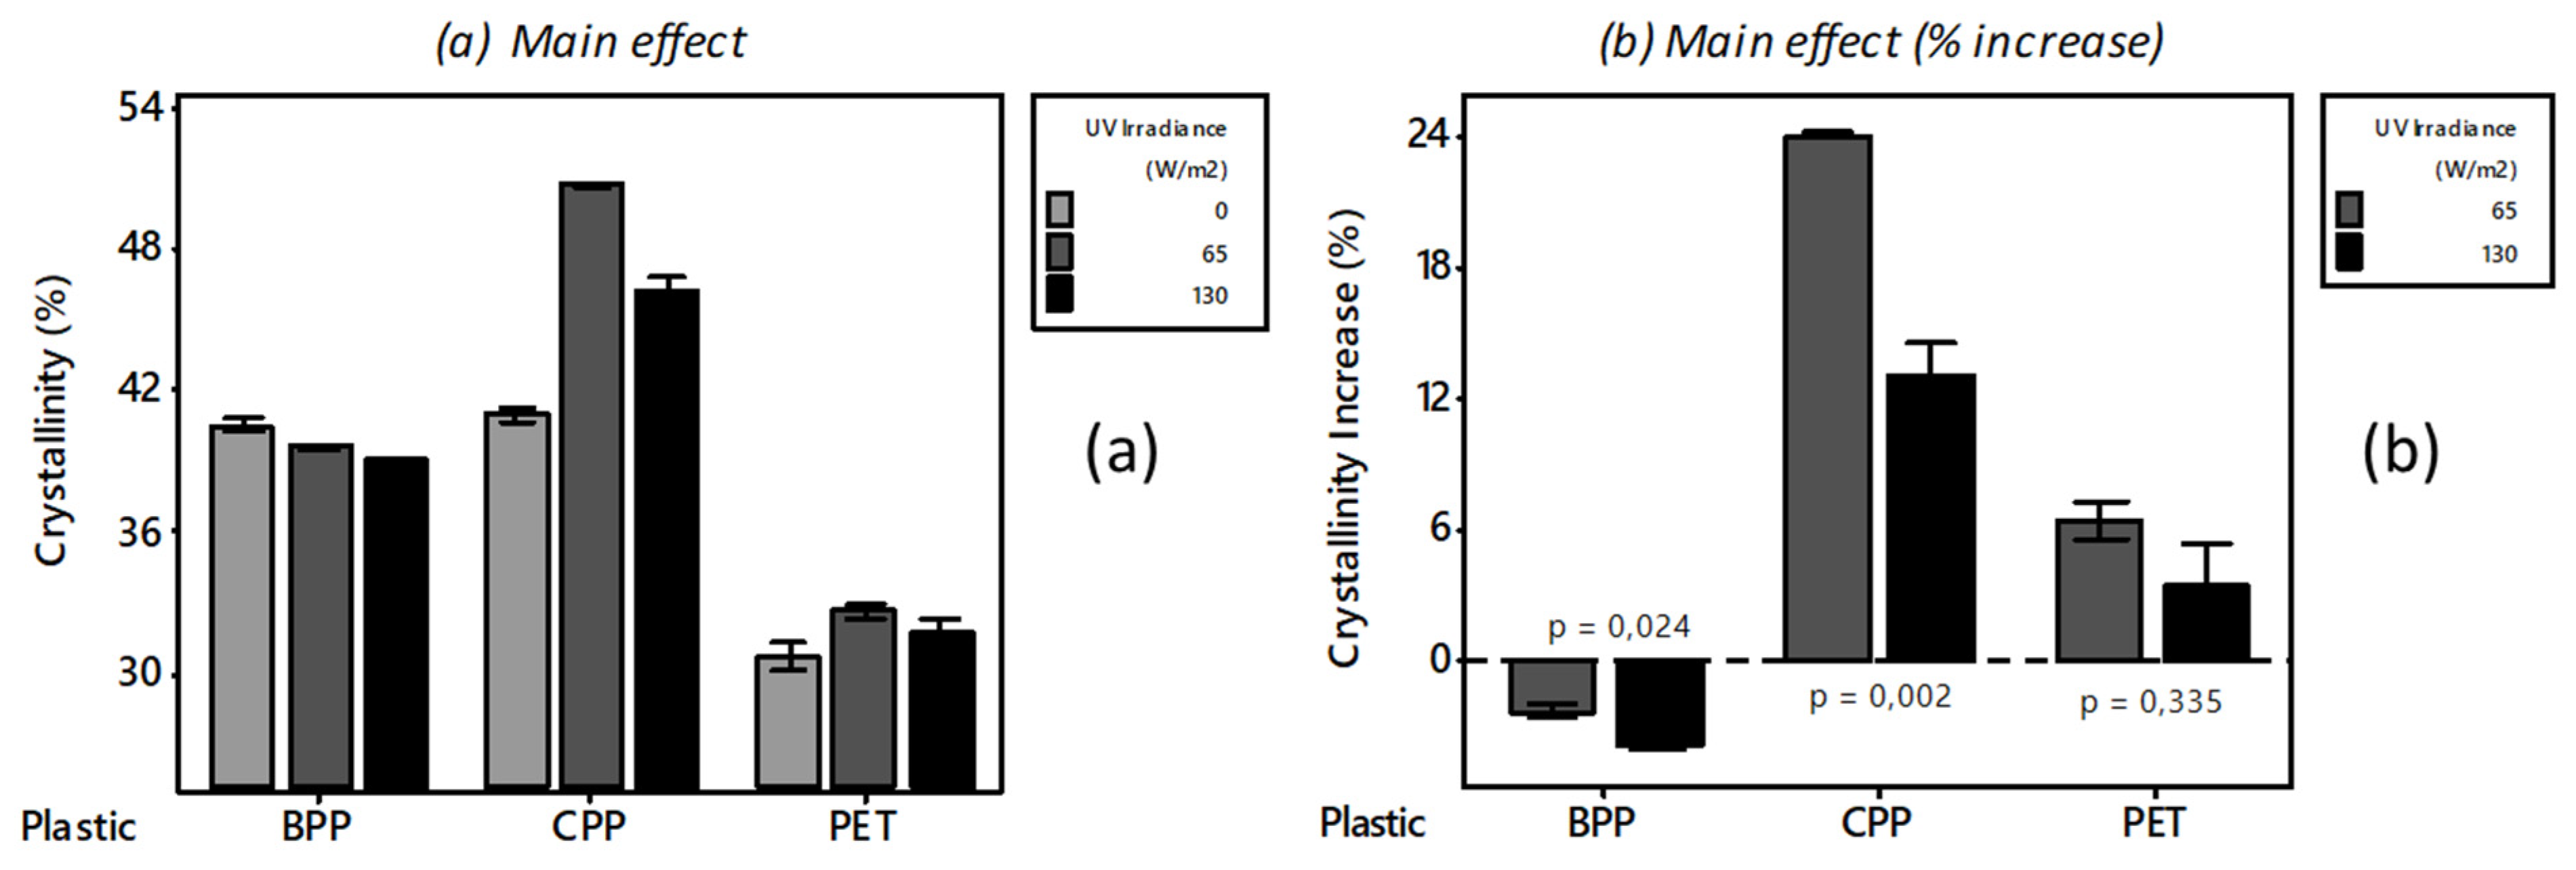
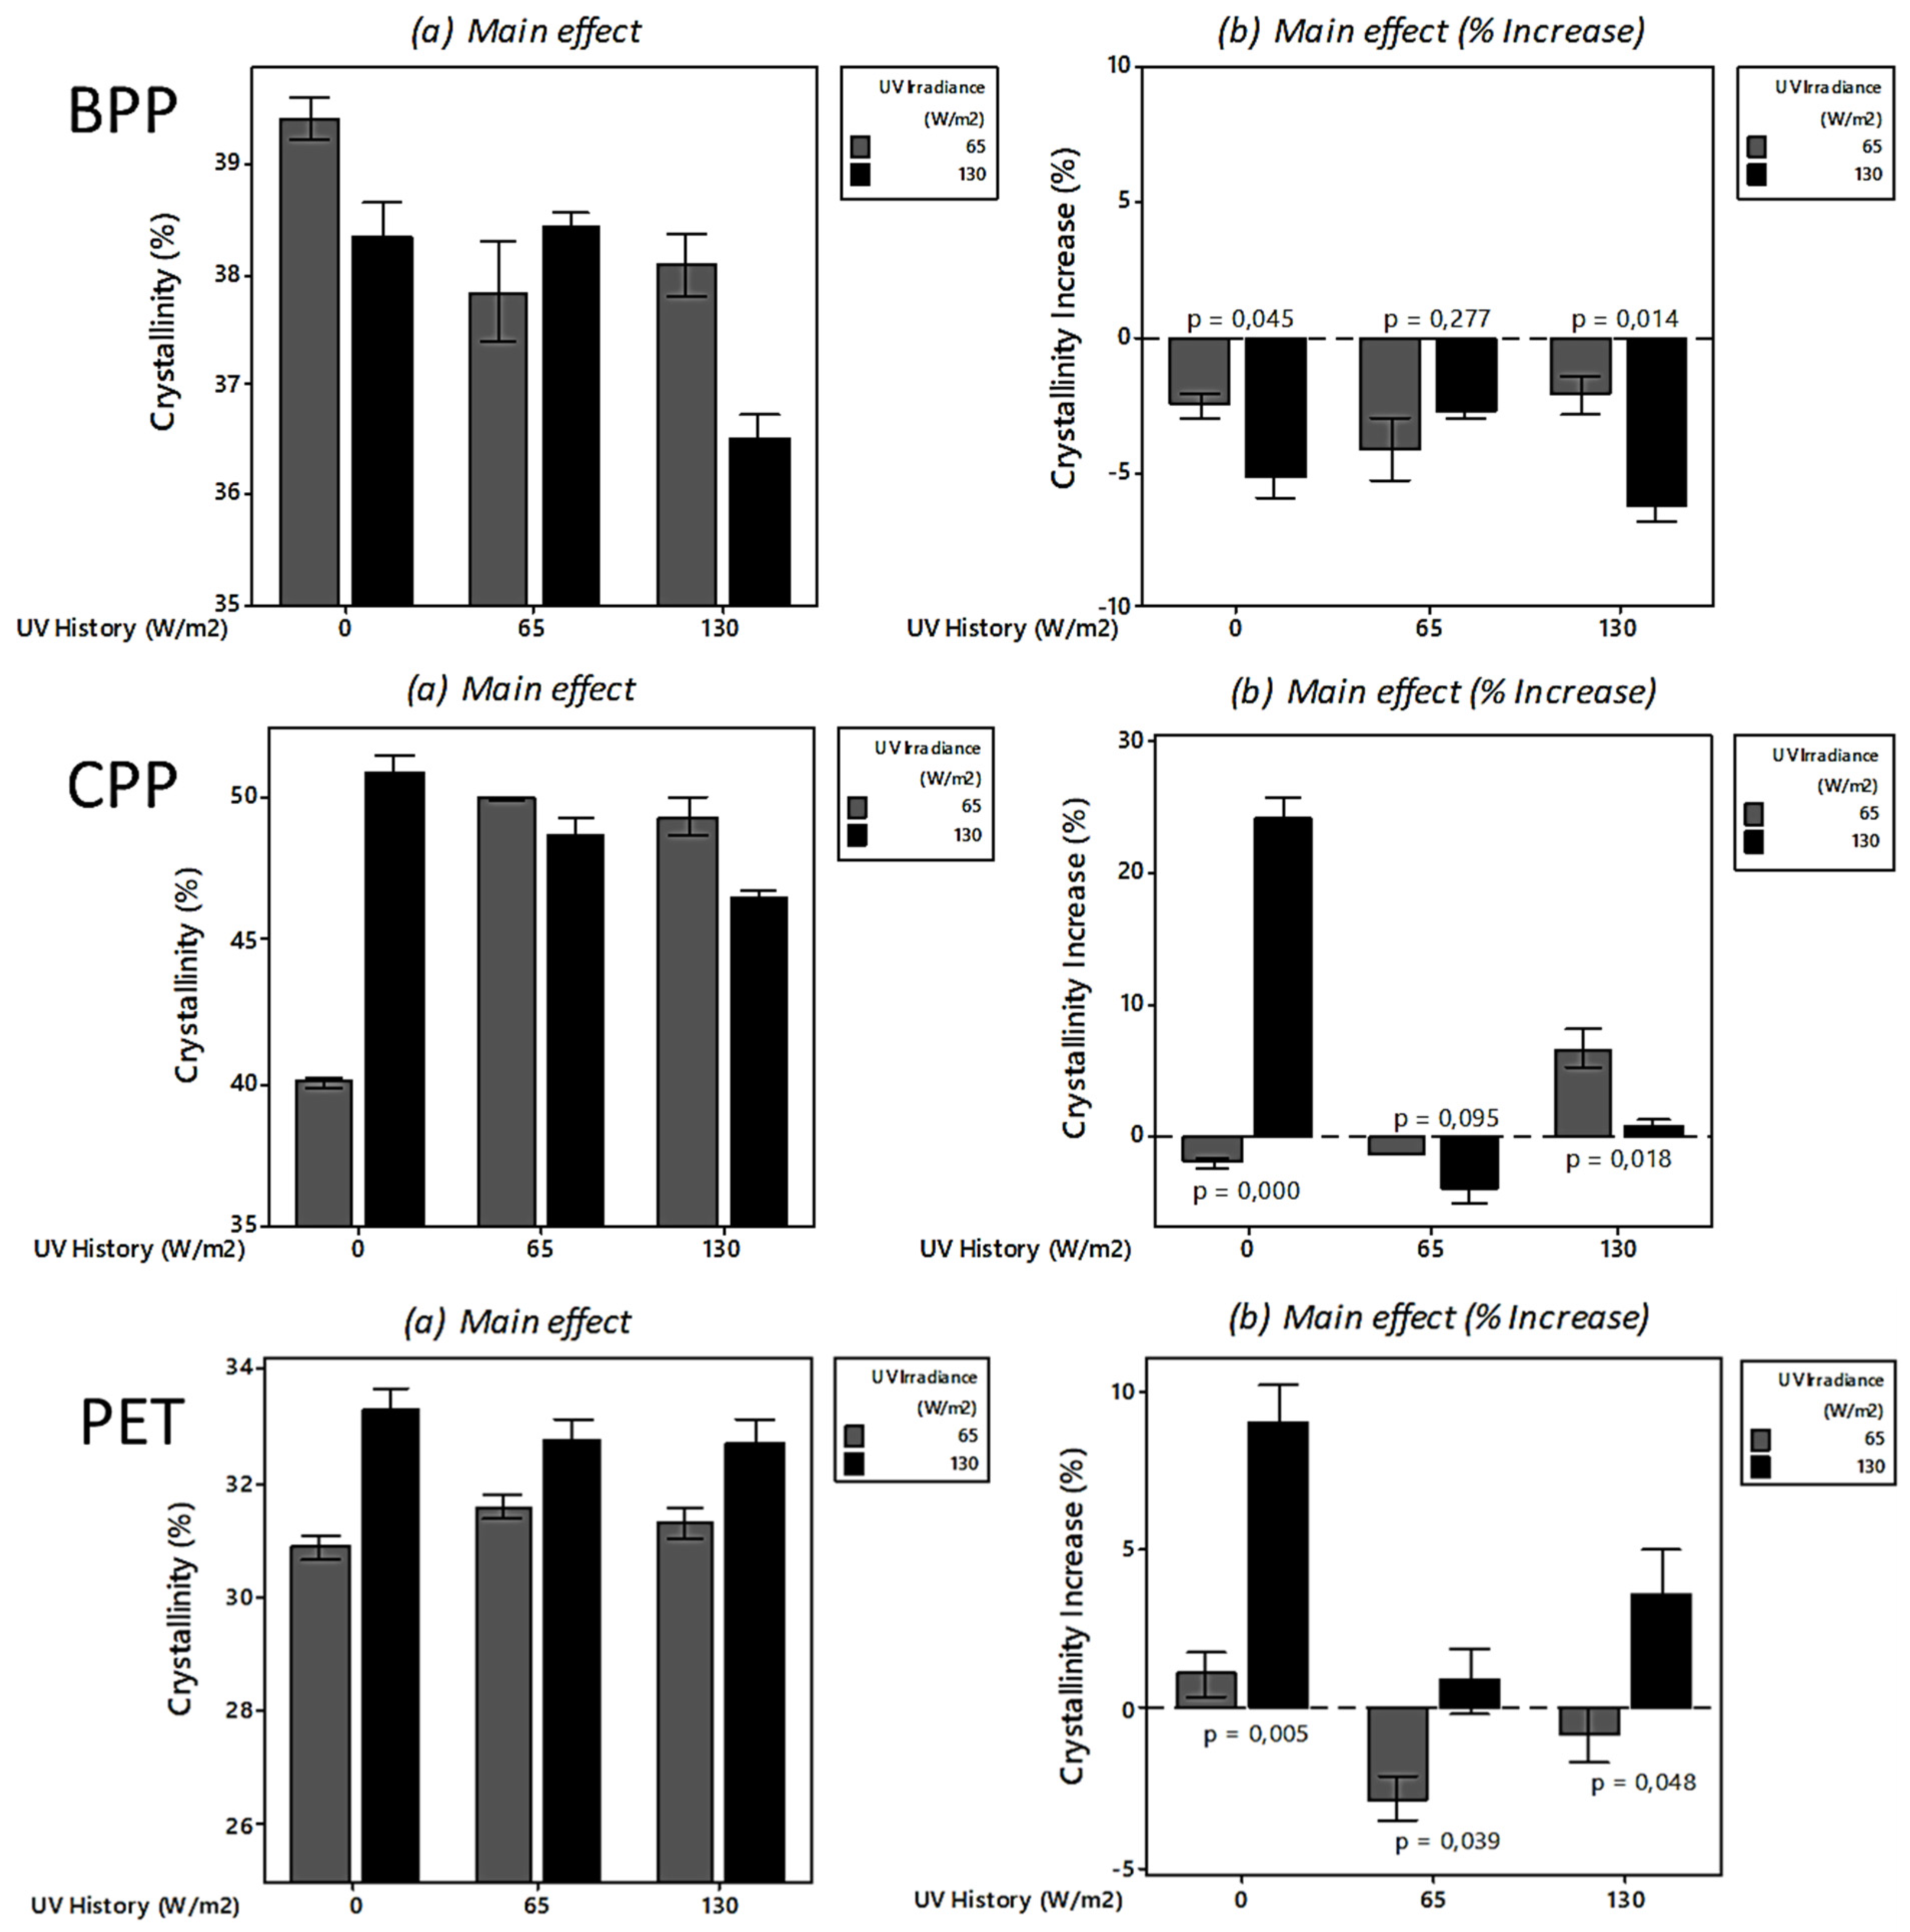
3.1.2. Crystallinity

Crystallinity affects several plastic properties, including hardness, tensile strength, density, and oxygen permeability. Increased degrees of crystallinity in a polymeric material usually make it tougher, but high levels of crystallinity may render it brittle. Figure 3 shows that an increase in the level of irradiance resulted in a decrease in the crystallinity of the BPP, where exposure to 65 W/m2 decreased crystallinity by 2.3% and exposure to 130 W/m2 caused a decrease of 3.8% relative to controls. The difference between these two results was statistically significant (p-value of 0.024). CPP and PET exhibited a similar trend to each other, but different from that observed for the BPP. For these two materials, exposure to both of the irradiance levels increased the crystallinity relative to untreated material, where the lower irradiance (65 W/m2) resulted in higher crystallinities than the higher irradiance (130 W/m2). At the lower irradiance level, CPP exhibited a 24% increase in crystallinity and PET an increase of 6.4%. The higher irradiance, however, resulted in lower increases of 13% and 3% for CPP and PET, respectively. From the p-values, the difference for CPP was significant while that of PET was not.
The observed results for the different polymer types might be due to the occurrence of competing crosslinking and chain scission processes, with the former taking place more rapidly at higher irradiance levels. By considering shifts in the glass transition temperature (Tg) for PET, it was found that crosslinking prevailed at higher irradiance levels. The lower irradiance resulted in a 2.21% increase in (Tg) while the higher irradiance in an increase of 10.8%. Edge et al. [40] also reported initial crosslinking of PET during degradation below 90 °C. Nagai et al. [41] found crosslinking of PET to be more pronounced in accelerated weathering than during outdoor weathering experiments. In terms of plastic type, it was suggested that the polymer chains of CPP had the highest relative mobility, and consequently the highest ability to align in a crystalline structure as exposure time progressed. Moreover, whether or not polymers can crystallize depends on their molecular structure, where the presence of straight chains with regularly spaced side groups facilitates crystallization. It has been reported that crystallization occurs much more readily in isotactic (most packaging) semicrystalline PP than in the atactic PP form, which has almost zero crystallinity [42].

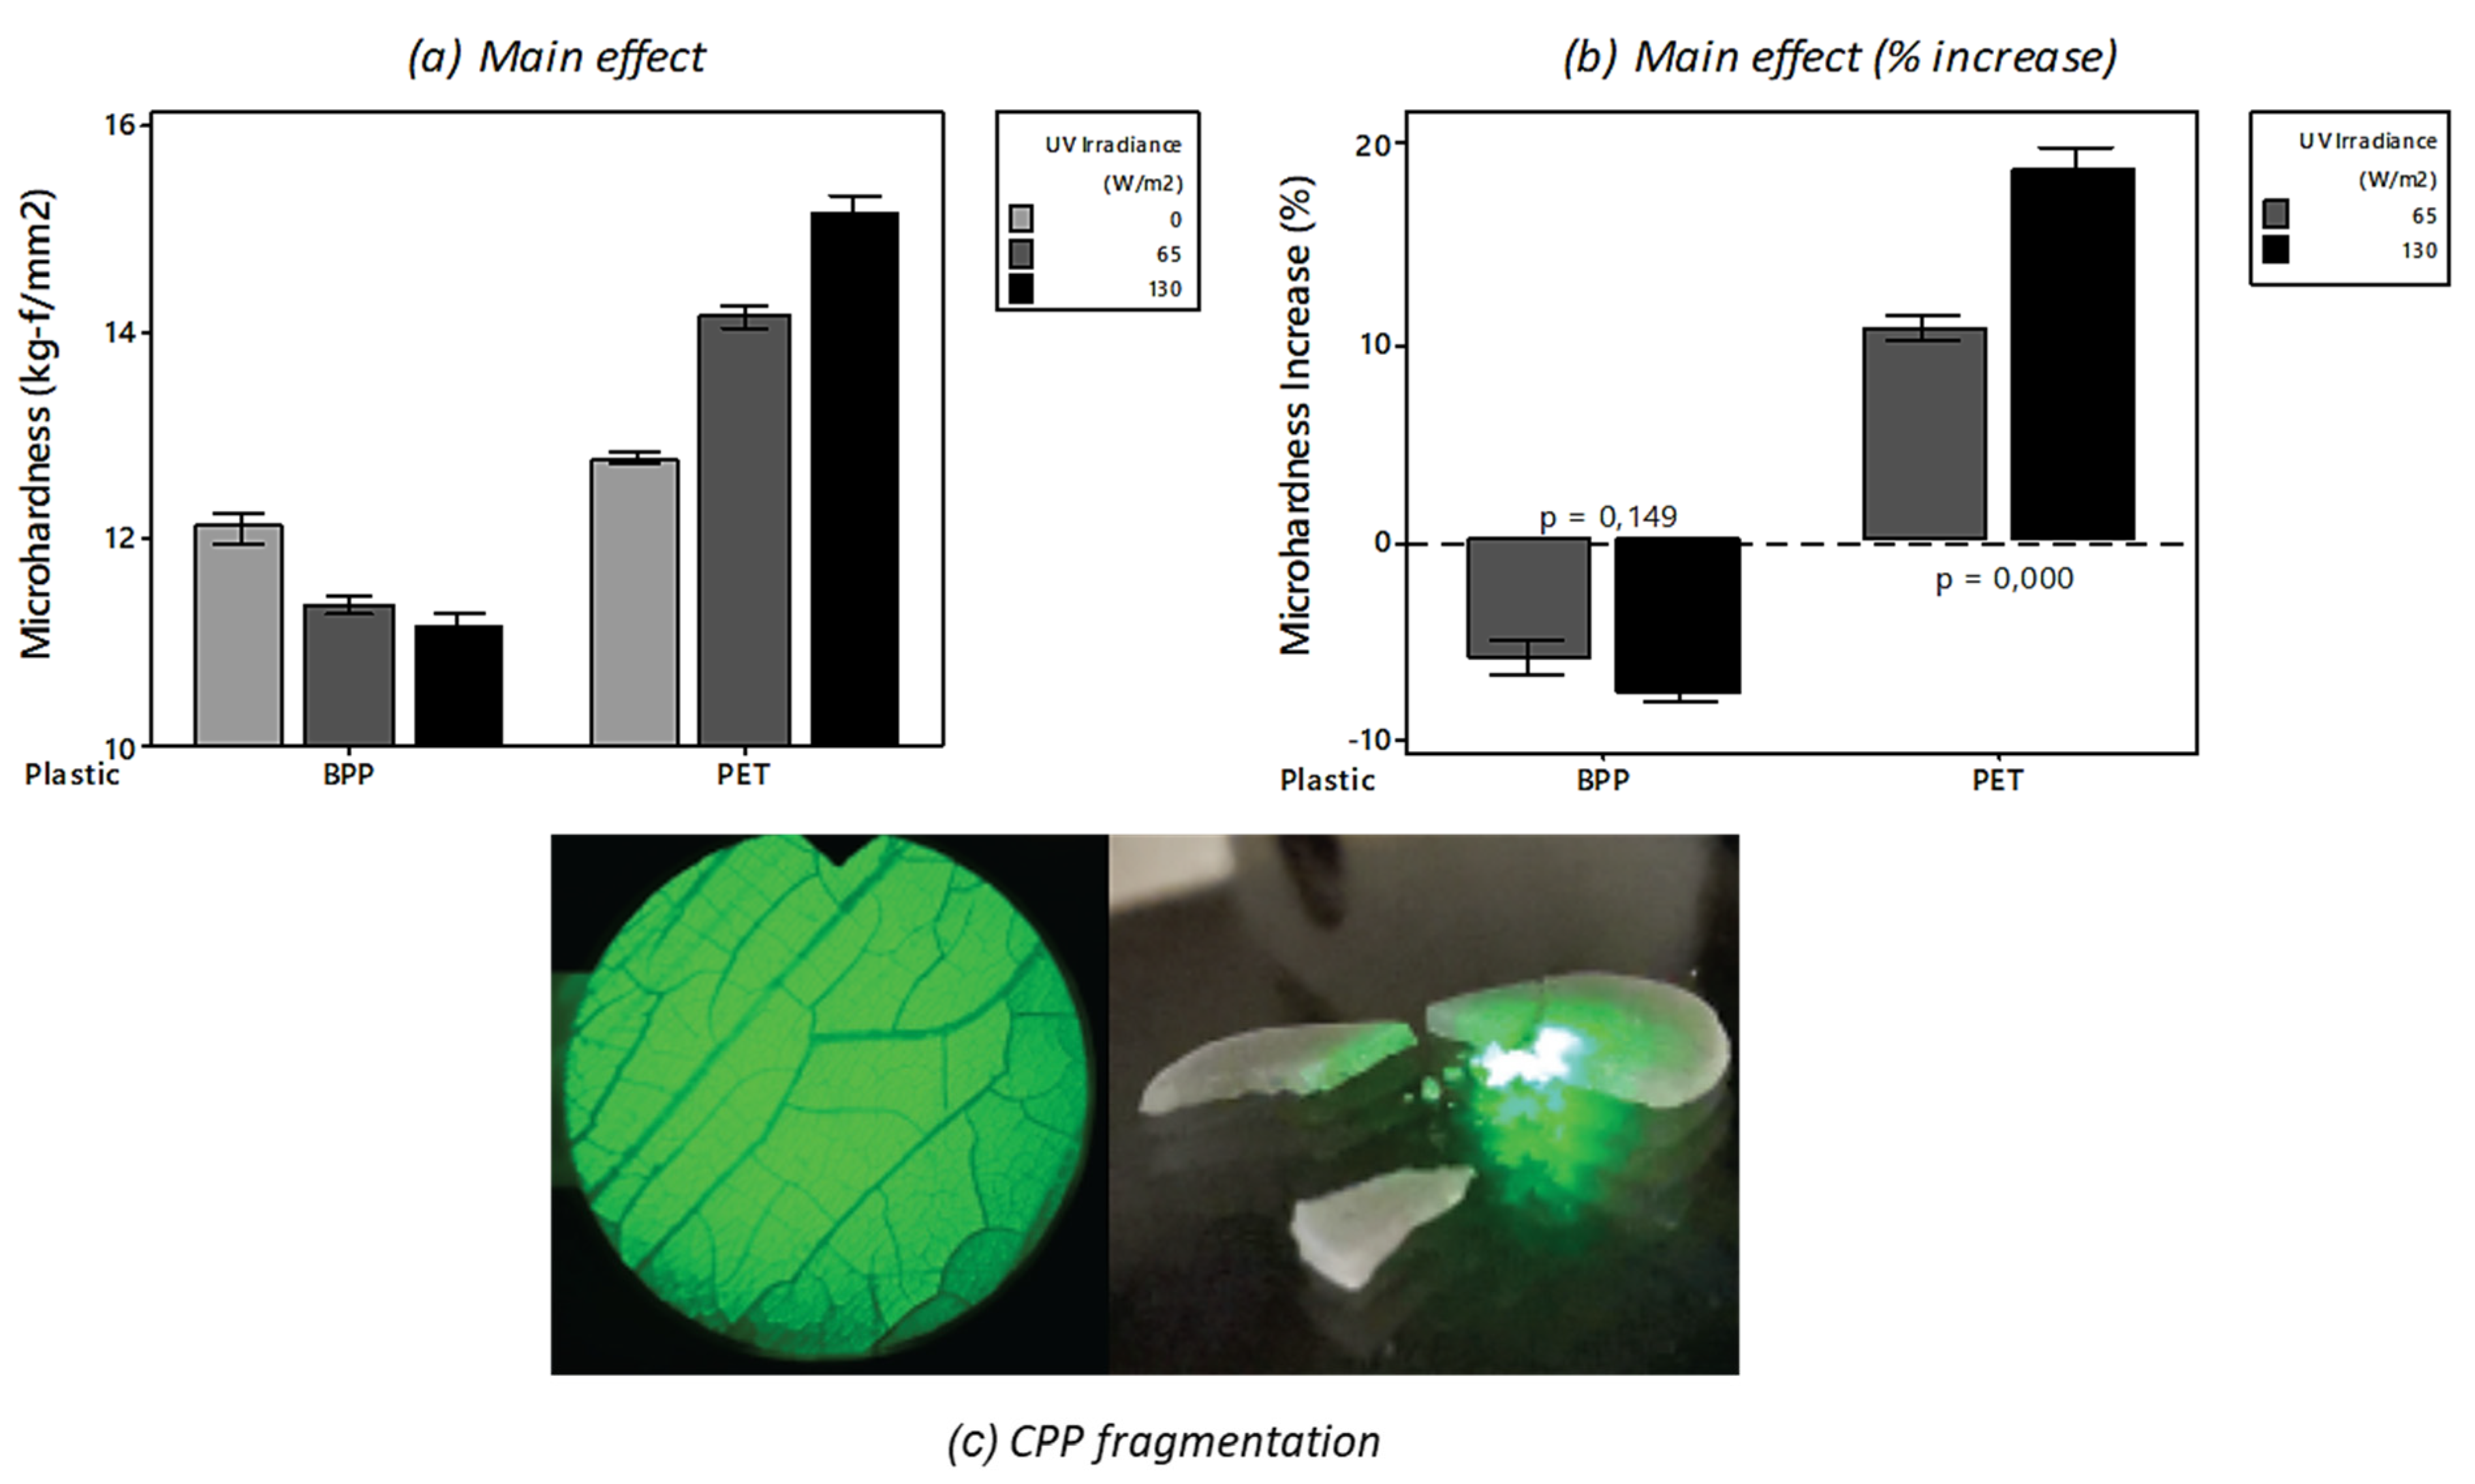
3.1.3. Microhardness

Microhardness describes a material’s resistance to localized deformation and enables estimations of other mechanical properties, such as tensile strength, to be made. In general, polymers with increased crystallinities have more densely packed structures, as well as a higher ratio of crystalline to amorphous domains, which is reflected by increased microhardness. The UV exposure caused the CPP samples to crack extensively. As a result, the microhardness could not be determined for this polymer type as they had become extremely brittle and fractured into multiple pieces when the indenter made contact with the plastic surface, as shown in the SEM photomicrograph in Figure 4.
Figure 5 summarizes the average microhardness values of the pristine BPP and PET materials, as well as the final values following the UV exposure. The results show clearly that the microhardness decreased for BPP and increased for PET. The percentage increase reported in Figure 3b is relative to the values determined for the pristine, untreated BPP and PET materials. This corresponds well to the trends observed for crystallinity for these two materials (Figure 3). BPP showed a decrease of 5.9% for the 65 W/m2 irradiance and a decrease of 7.7% for the 130 W/m2 irradiance. Conversely, PET showed an increase of 10.9% for the 65 W/m2 irradiance and an increase of 18.7% for the 130 W/m2 irradiance. These results confirm the relationship between microhardness and crystallinity for the PET and PP materials in the current study.

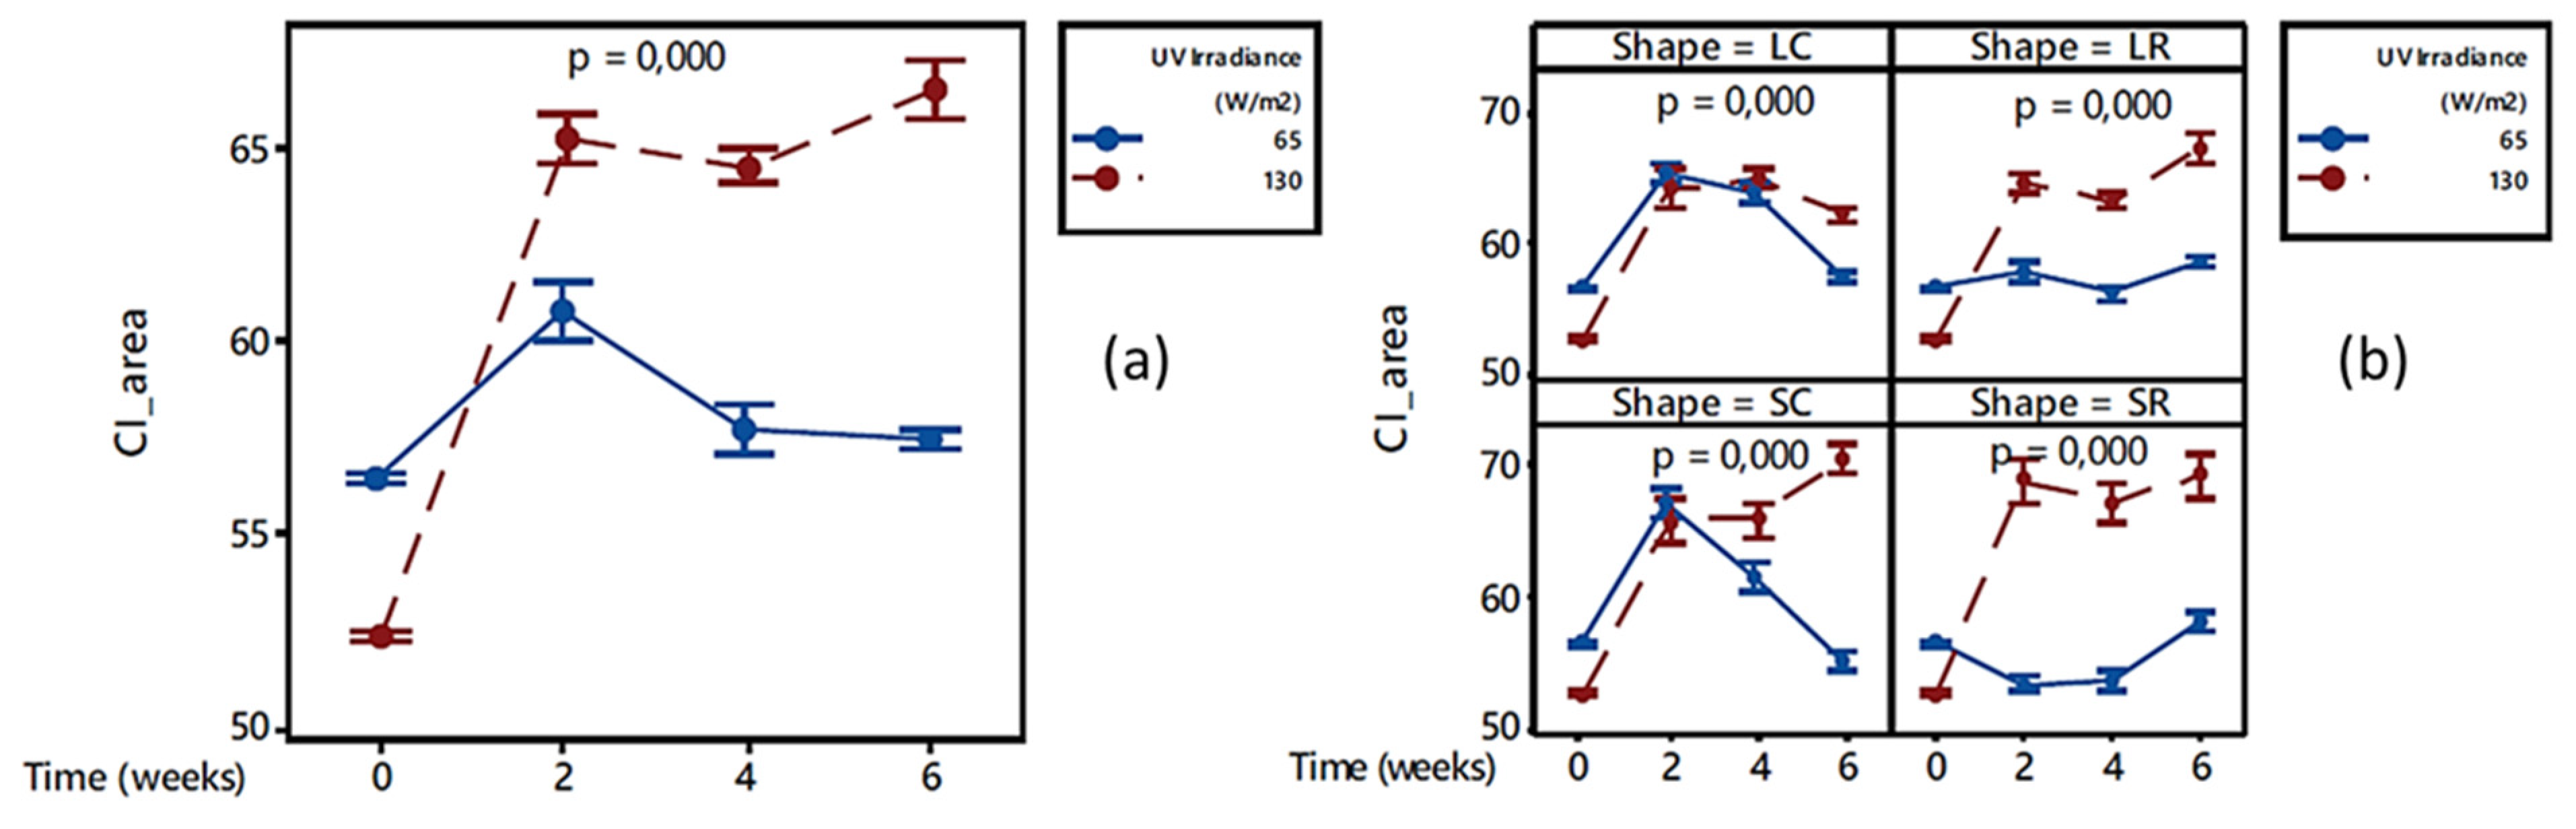
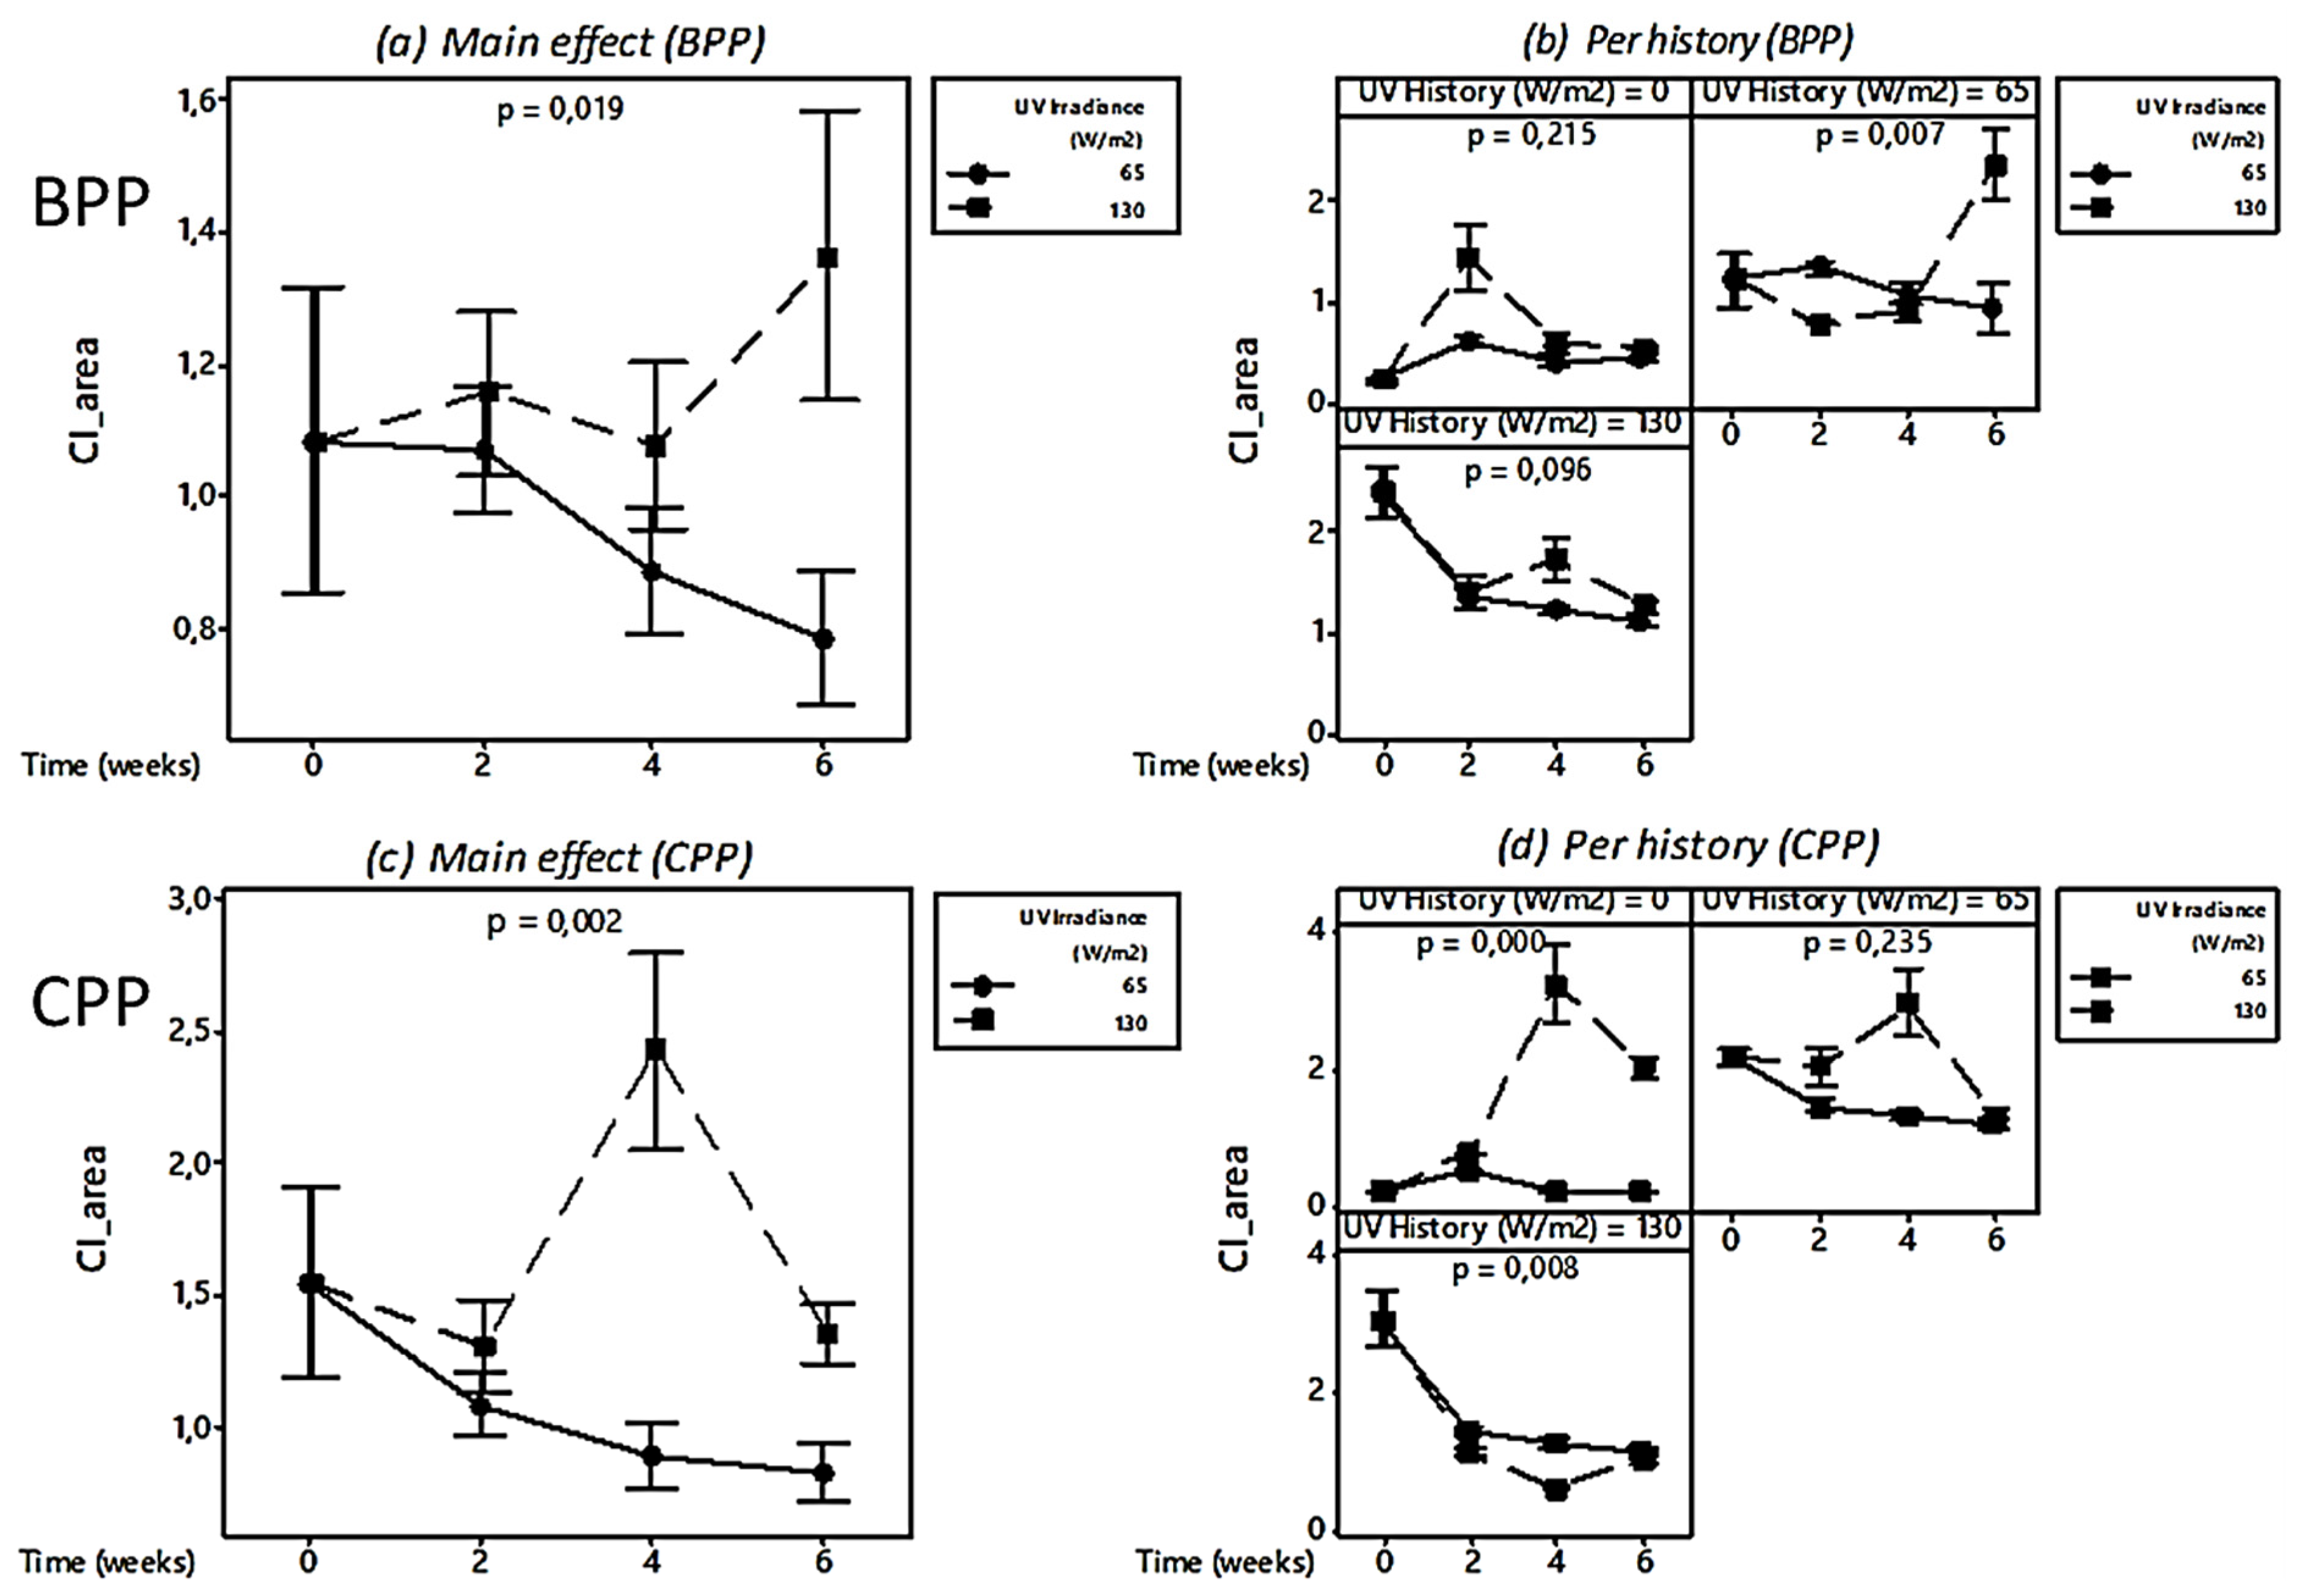
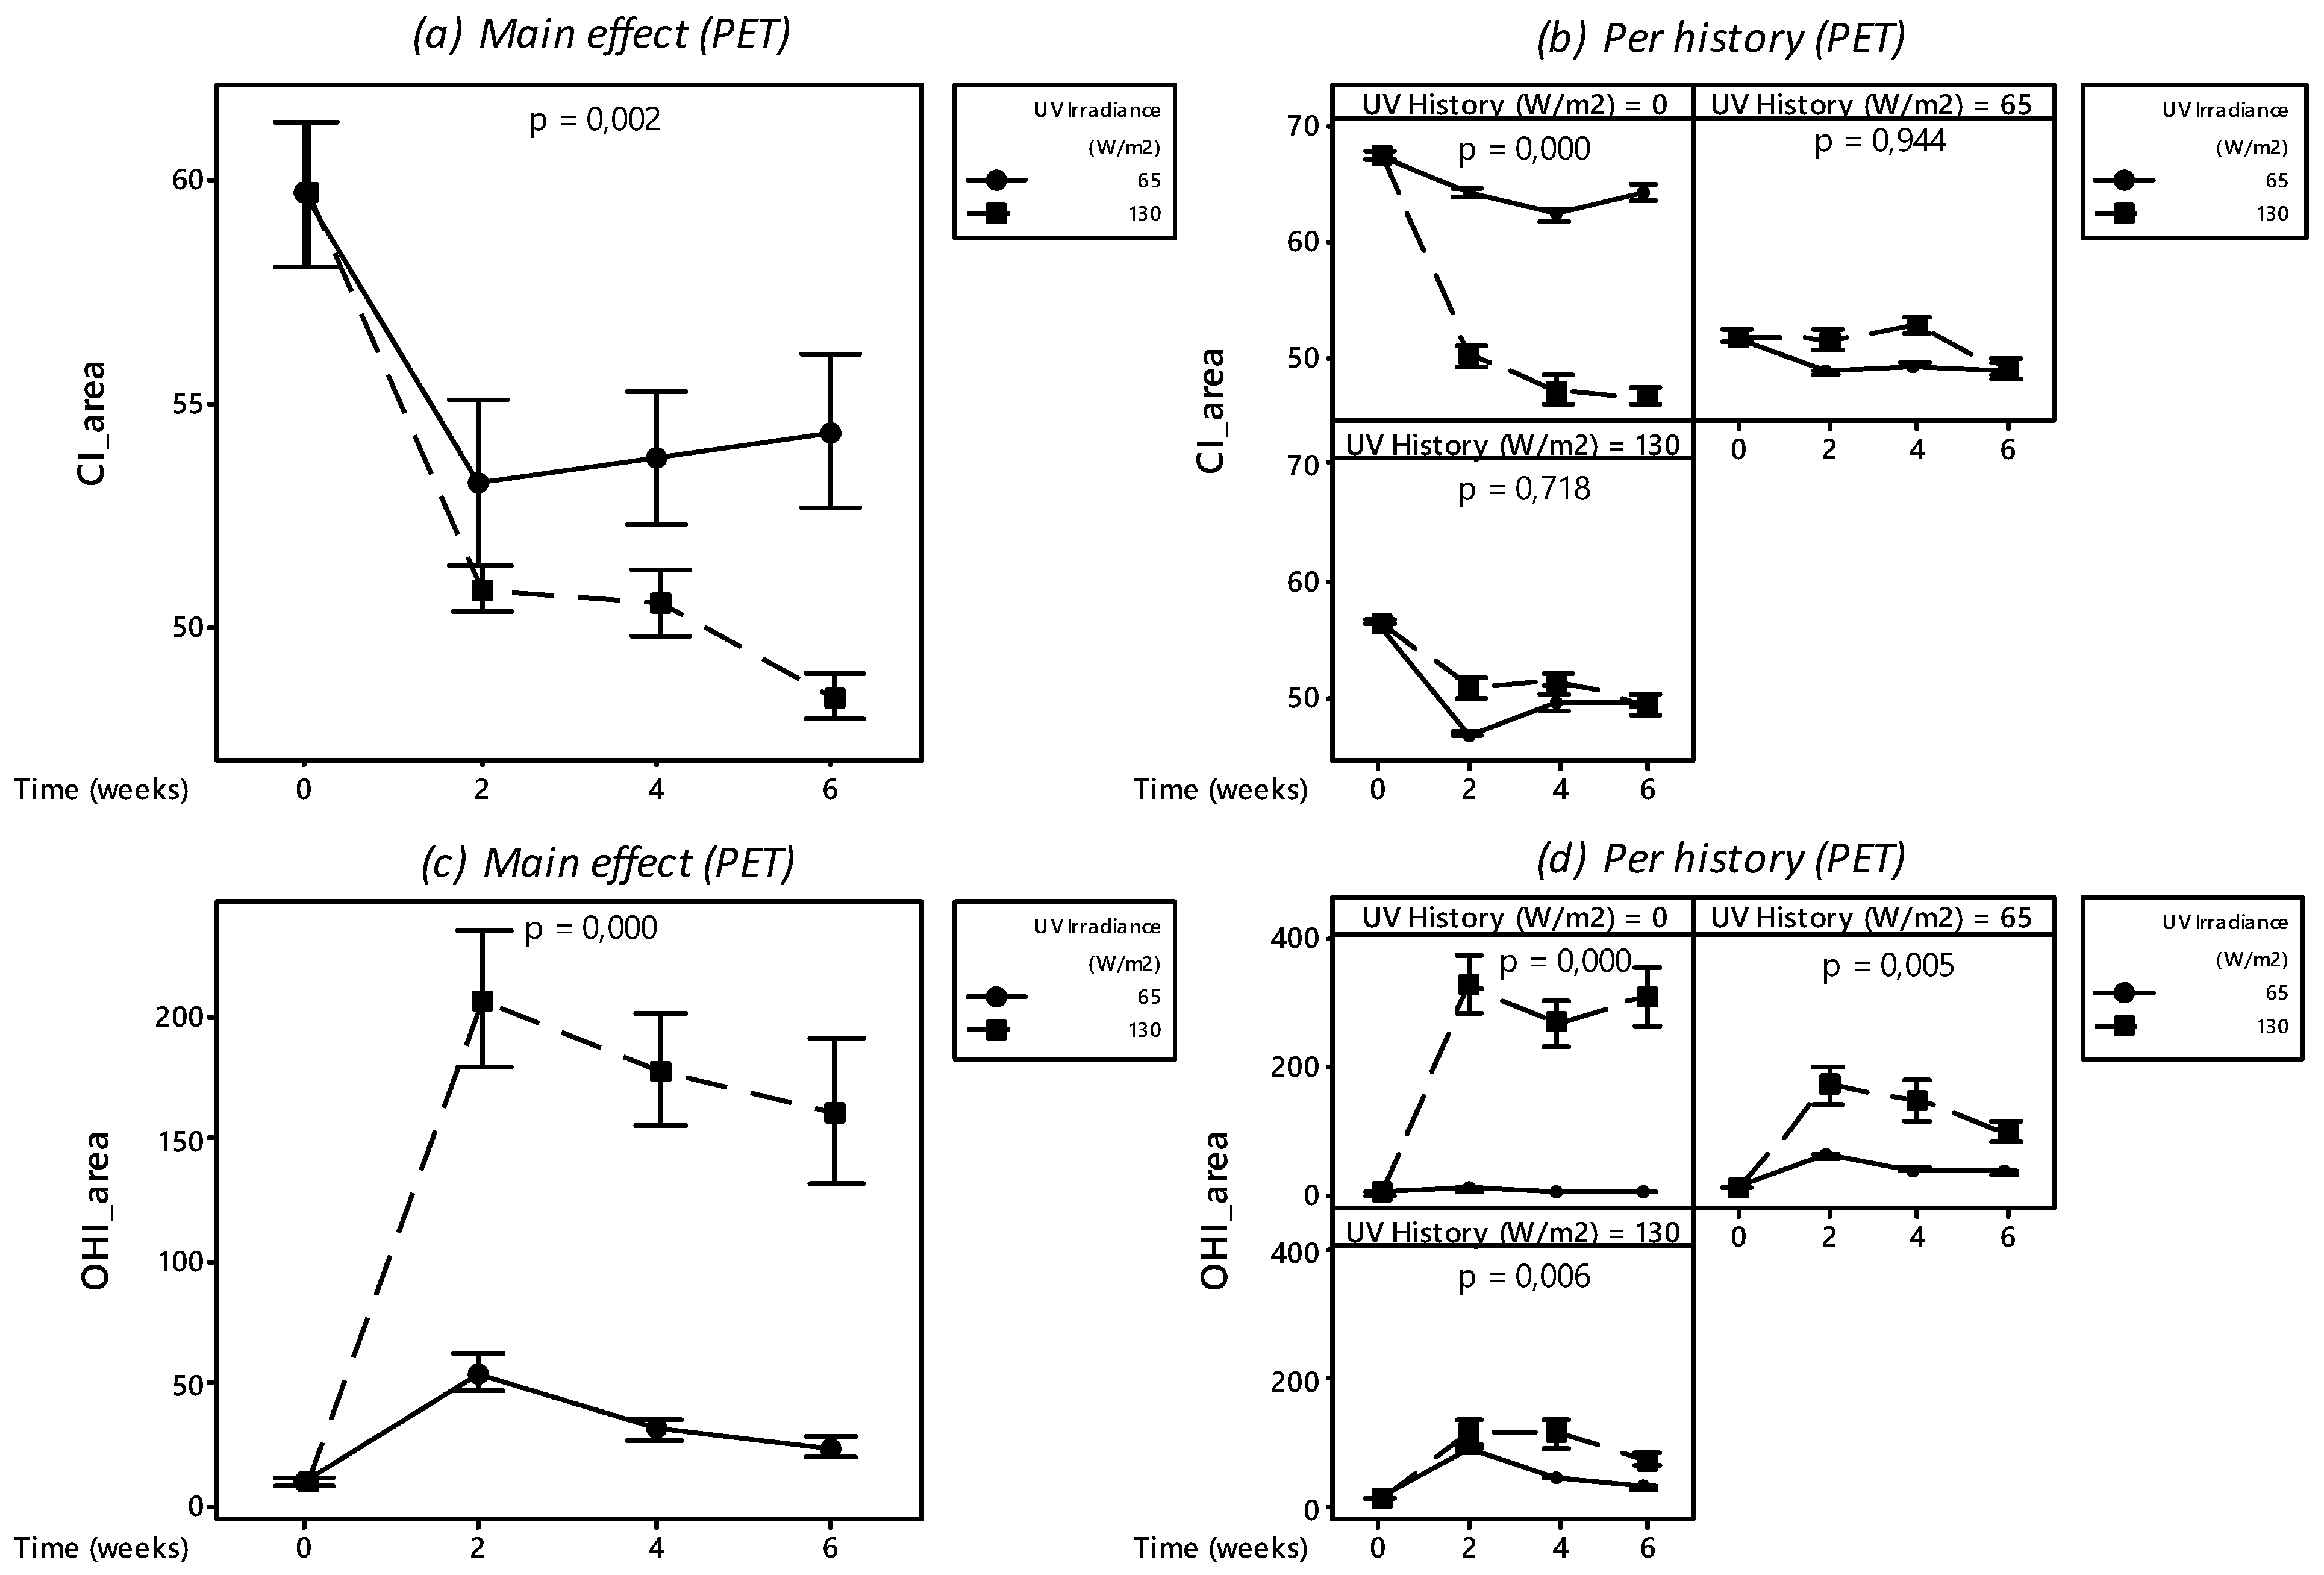
3.1.4. Carbonyl Indices

FTIR spectroscopy was used to identify and track changes in the carbonyl (1870–1540 cm−1) region in the molecular structures of the investigated plastics. The CIs for CPP and BPP were determined in the same way, meaning that the values for these two materials could be compared directly. PET, however, had a much sharper and more intense carbonyl peak due to the ester linkages in its backbone. As the CI values for the pristine versions of the PP and PET materials are very different, the results for BPP and CPP are presented and discussed separately to those of PET.
Polypropylenes (BPP and CPP)
Figure 6a depicts the pronounced effect of UV irradiance on the CI results for both BPP and CPP. Increased irradiance resulted in significantly increased rates and extents of carbonyl-containing product formation. Overall, the higher UV irradiance (130 W/m2) resulted in higher CI values relative to the lower irradiance (65 W/m2). At the higher irradiance level, the maximum rate at which the carbonyl groups were developed was within the first two weeks of degradation. At the lower irradiance level, a more gradual increase was observed within the first four weeks, before the rate slightly plateaued. Figure 6b shows the CI values for BPP in different shapes and sizes, while Figure 6c shows the data for CPP. Although all shapes and sizes of BPP and CPP exhibited increases in their carbonyl content, there were no significant differences in CI values between any of the sample types.
There was only a difference between the two types of PP, with CPP showing significantly higher rates and extents of carbonyl formation than BPP. At the end of the 6-week exposure period, the final CI value for CPP was 60% higher relative to its BPP counterpart (Figure 6a). Although both plastics were PP, the results suggest that CPP was more susceptible to oxidation than BPP. This finding supports the earlier results from the mass loss analyses which indicated that the carbon black colorant in the BPP acts as a UV absorber or radical scavenger, making the BPP less susceptible to photooxidative degradation compared to the CPP without any carbon black. Figure 7a,b show FTIR spectra depicting the development and formation of carbonyl peaks in the CPP and BPP materials following 6 weeks of exposure to UV irradiance at an intensity of 130 W/m2. The spectra shown in Figure 7a,b are the average spectra of the different shapes investigated in the study.
Poly(ethylene terephthalate) (PET)
Figure 8a shows the CIs for PET and indicates again that the UV irradiance intensity has a significant impact on the degree of carbonyl group formation, especially within the first two weeks of exposure. Overall, the higher UV irradiance (130 W/m2) resulted in higher CI values in the PET relative to the lower irradiance (65 W/m2). After the first 2 weeks, the rate of carbonyl group formation plateaued until the end of the exposure period, and the rate slightly plateaued. As observed for BPP and CPP, the effect of material size and shape had no observable influence on the CI values for PET, although higher UV irradiance intensities resulted in higher CI values in all cases (Figure 8b). Following 6 weeks of exposure to UV irradiance at an intensity of 130 W/m2, the FTIR spectra of the PET materials revealed the formation of a new peak that overlapped with the existing carbonyl peaks (Figure 9). This suggests that the new peak represents the conversion of carboxyl radicals into carboxylic acids and/or aliphatic aldehydes.
Overall, UV irradiation led to changes in the properties of PET, BPP, and CPP that were proportional to the intensity delivered, leading to a higher level of mass loss, carbonyl indices, crystallinities, and microhardness in all polymer types at 130 W/m2 relative to 65 W/m2. Material shape did not significantly influence degradation for any of the polymer types, suggesting that UV degradation is likely to proceed for all items of plastic debris composed of PET or PP, irrespective of the size or shape. However, there were differences in the degree of degradation related to the polymer type and formulation, with CPP showing the most rapid degradation due to factors including chemical composition, specific wavelength sensitivities, and the presence/absence of stabilizing additives contributing to these results. Furthermore, crystallinity values for the different polymer materials did not always change proportionally with UV irradiation intensity, but instead reflected multiple processes acting simultaneously, including crosslinking appearing to occur in CPP at the highest irradiance intensity. While both PP materials exhibited significant increases in carbonyl content with increasing irradiance intensity, PET appeared to undergo a reduction in carbonyl groups due to the formation of carboxylic acid groups evidenced by peak broadening. Under certain exposure conditions, there was evidence that fragmentation and release of molecular products occurred following degradation of the surface layer, which produced a fresh surface more characteristic of the pristine material. In such circumstances, trends that seemed to emerge regarding chemical property changes started to exhibit variation over longer exposure times, especially in the case of CI values.

3.2. UV Tests in Aqueous Environment
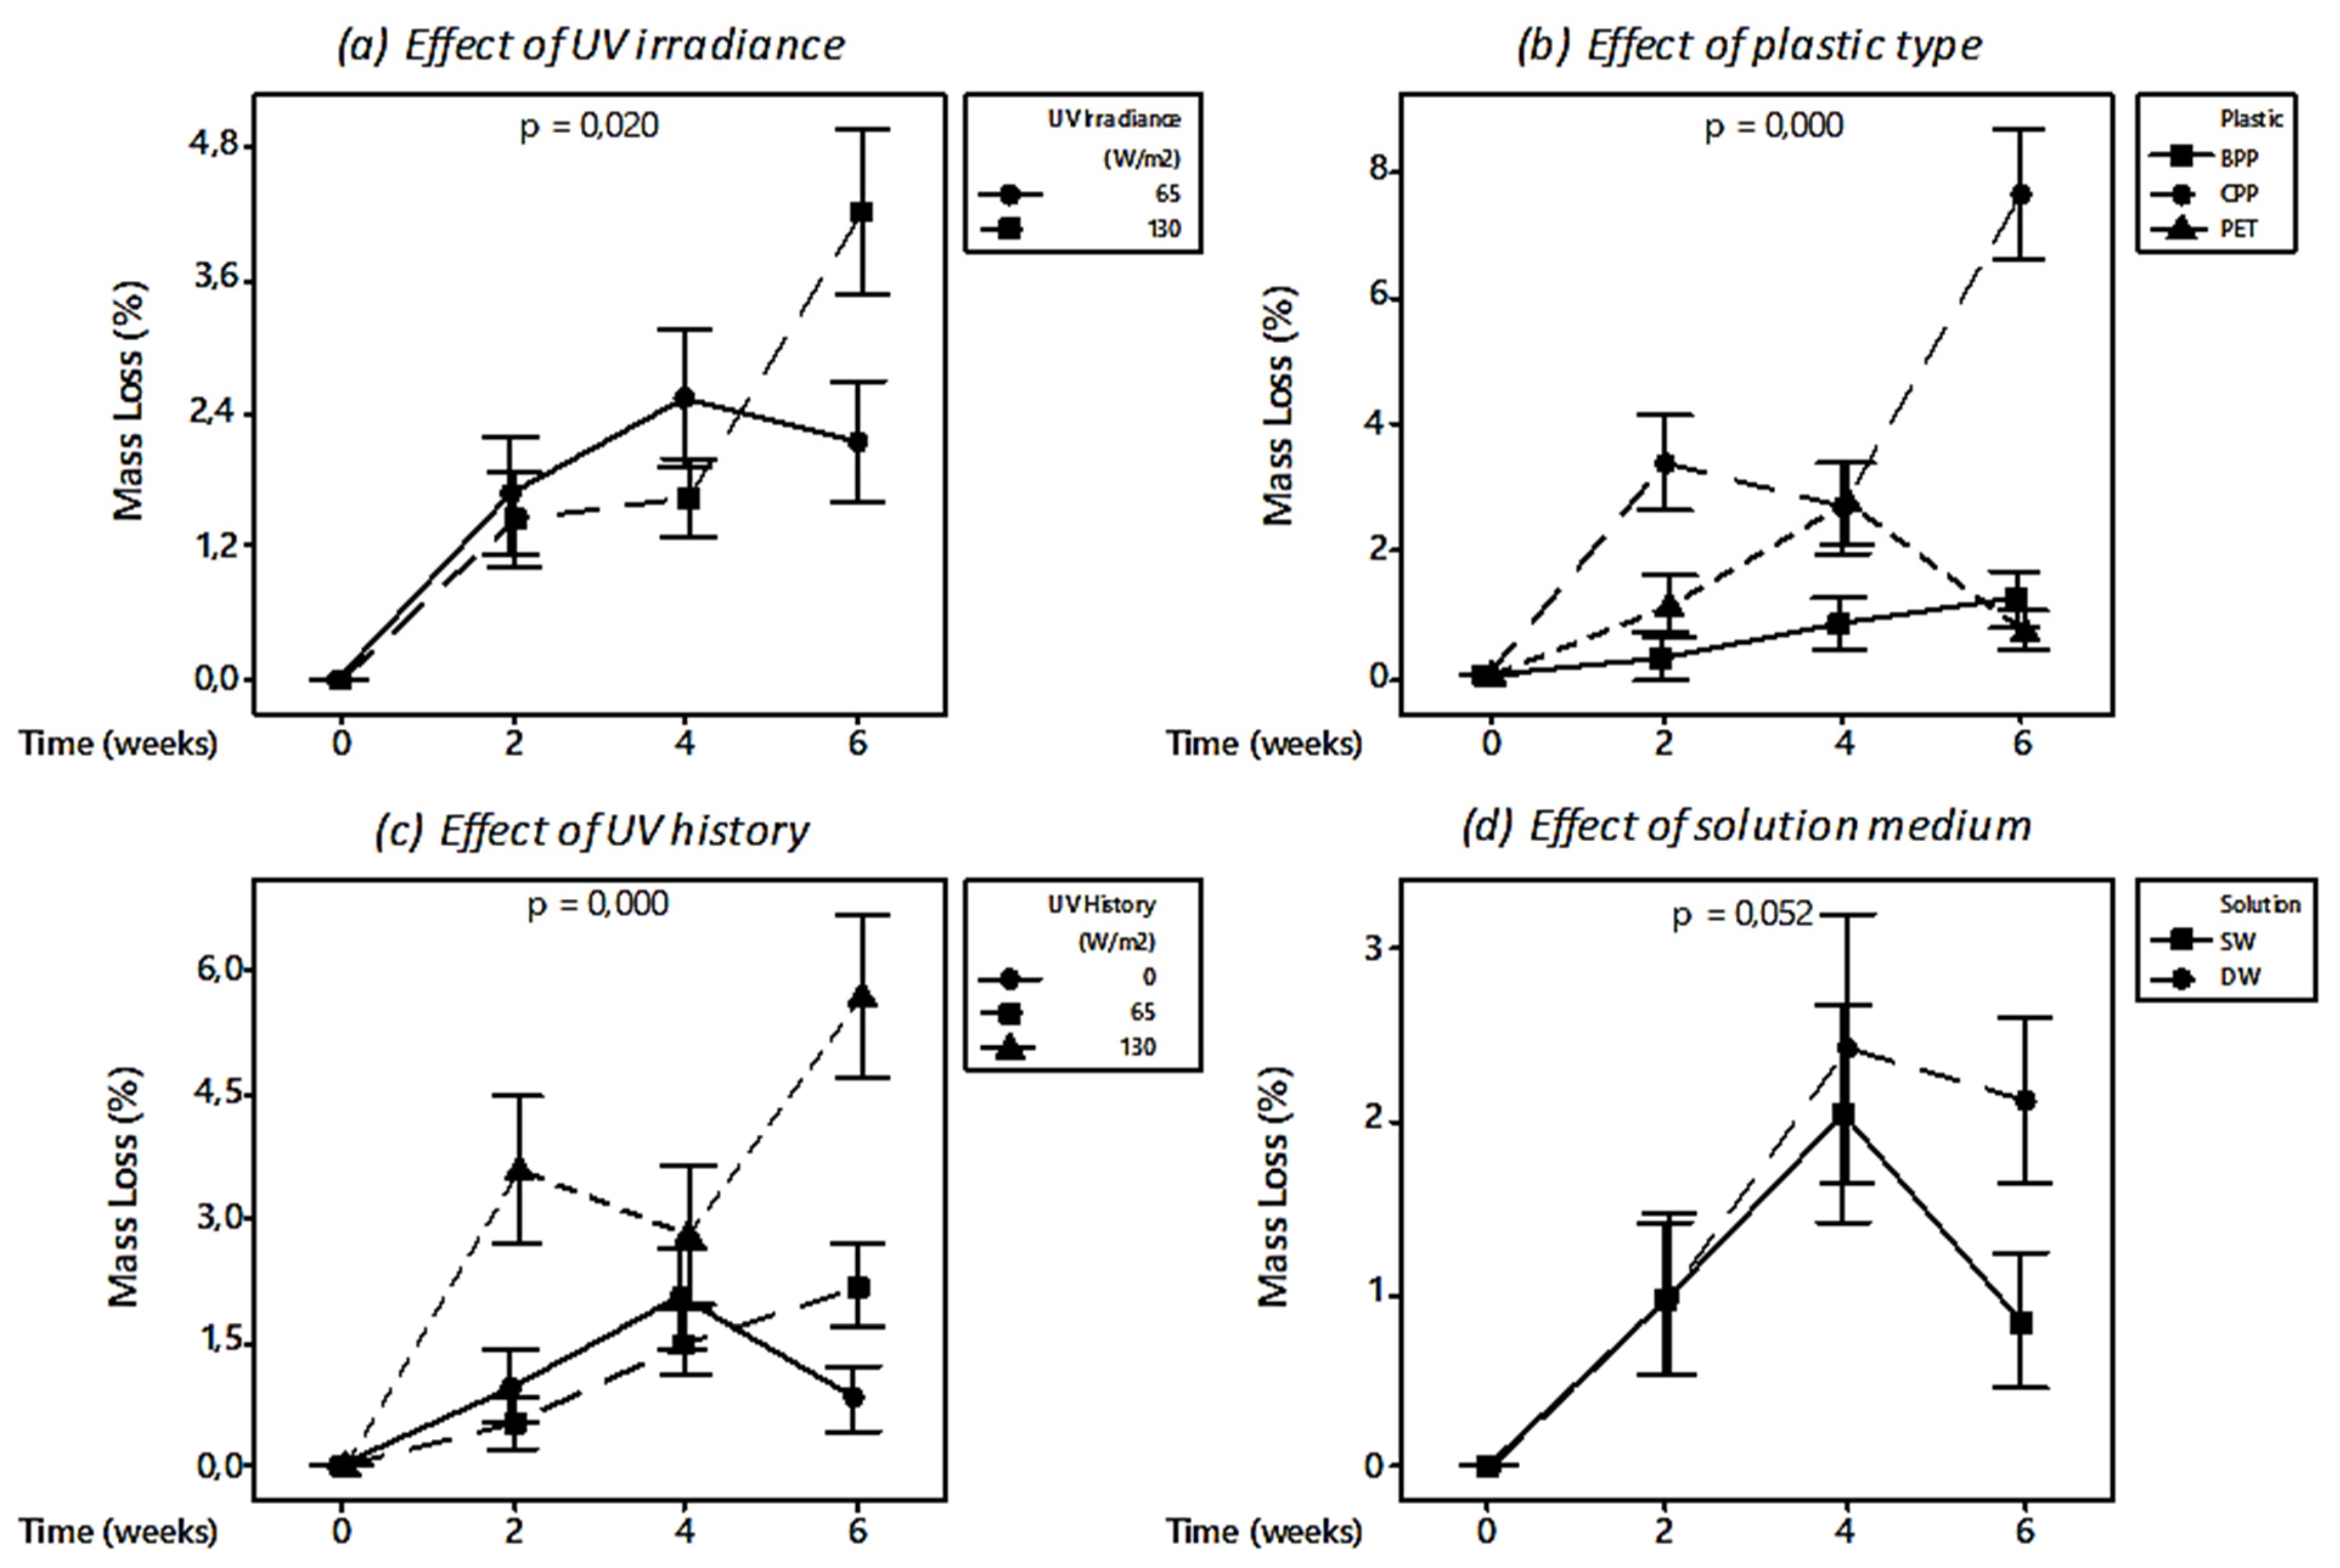
3.2.1. Mass Loss

The aqueous (beaker) tests formed the second stage of the sequential experiments. These tests represented the period where material entered the marine environment after spending time on land. The same analyses as for the pretreatment were performed with some minor adjustments in experimental procedures. Two additional variables were introduced: the sample’s previous UV history (from the pretreatment) and aqueous media (seawater or demineralised water).
Figure 10 shows a summary of the overall main effects of UV irradiance, plastic type, UV history, and solution medium on mass loss for the aqueous UV exposure tests. From (a) it is evident that the higher irradiance ultimately resulted in double the mass loss obtained from the lower irradiance. This proportional effect corresponds to that of the pretreatment. In (b), the effect of plastic type is shown. It was noted that PET lost more mass during the aqueous UV exposure tests than during the pretreatment. This was likely due to hydrolytic degradation. Ultimately, CPP resulted in a significant 7.7% mass loss, while the values for BPP and PET were 1.2% and 0.7%, respectively. In terms of UV history, it was found that samples with previous degradation histories resulted in higher mass losses (Figure 10c). Previous degradation appears to weaken the material surfaces sufficiently to lose weight more readily under aqueous UV exposure conditions. The effect of solution medium (Figure 10d) indicates that demineralised water resulted in higher mass loss than seawater. It is suggested that the presence of dissolved solids (salts and organics) in seawater absorbs UV light more rapidly, preventing radiation from reaching the polymer surfaces and thereby reducing degradation effects. In addition, the reduced dissolved oxygen concentrations in seawater also likely reduced the oxidation effects. The difference in final mass loss due to the different solutions, however, was not statistically significant. It is suggested that the presence of dissolved solids (salts and organics) compete with the plastic material for the available UV, preventing the same level of irradiation reaching the polymer surfaces than occurs in demineralized water. One possible mechanism is related to the refractive index of water [43] which increases significantly in seawater relative to demineralized water and may therefore reduce the UV utilization rate of plastic in seawater environments. In addition, the reduced dissolved oxygen concentrations in seawater relative to the demineralized water may also reduce the degree and type of oxidation occurring on the plastic surface (Cai et al., 2018). The results are consistent with a previous study that demonstrated that plastic materials exposed to UV irradiation in seawater only formed additional carbonyl groups, whereas those exposed in ultrapure water developed both hydroxyl and carbonyl groups [10].
Although this study indicates that plastic litter may undergo a faster rate and more extensive degree of UV degradation in freshwater environments relative to marine environments, the presence of natural organic matter (NOM) in freshwater environments was not assessed herein. It is suggested that NOM present in freshwaters may reduce the degradation rate by adsorbing some of the available UV irradiation and by coating the surface of the plastic material, although more knowledge is needed to understand these possible processes [44,45].

3.2.2. Crystallinity

Figure 11 summarizes the crystallinity changes of the different plastics following the UV beaker tests in seawater. For all (b) figures, the percentage change is relative to crystallinities shown in Figure 3. For BPP it is evident that an irradiance increase resulted in a crystallinity decrease. This corresponded to the crystallinity results for BPP during the pretreatment stage and was especially the case for fresh samples and those with a previous UV history of 130 W/m2. When comparing the crystallinity change in (b), it was found that for the higher irradiance, crystallinities decreased by 5.5% and 6.6% for the 0 W/m2 and 130 W/m2 UV histories, respectively. An increase in UV history resulted in a decrease in crystallinity for BPP. It was believed that previous exposure resulted in increased crosslinking which decreased the polymers ability to realign in an ordered structure. Moreover, reductions in crystallinity could be due to increased structural defects and other chemical irregularities such as carbonyl and hydroperoxide groups [46]. For CPP, the trends changed irregularly, but it was clear that fresh samples with no previous histories showed a significant increase in crystallinity at the higher irradiance while samples with previous histories differed in response. It is suggested that excessive degradation of CPP weakened the polymer surfaces and that they might have been eroded and broken down into the solution medium, exposing a fresher, less crystallized layer that was analysed. This is corroborated by the mass loss observed for CPP during these experiments. The same “reverse degradation” effect was also described in [47]. PET behaved fairly similarly to CPP, where initially an increase in irradiance resulted in a significant increase in crystallinity. Thereafter, when considering samples with previous histories, the trend changed.

3.2.3. FTIR Indices

Figure 12 depicts the effect of UV intensity on BPP and CPP in seawater conditions on samples with and without UV history. From Figure 12a, it is evident that for BPP, increased irradiance resulted in higher carbonyl indices. This trend corresponds to results from the pretreatment for BPP shown in Figure 6. When considering Figure 12b, untreated plastics with no previous UV history and those with a UV history of 65 W/m2 showed an increase in CI, whilst material with the most severe history of 130 W/m2 showed a decrease. This indicates that prolonged UV exposure might have resulted in initial carbonyl products degrading further and peaks fading away. In addition, the liberation of smaller molecules containing these carbonyl species may also have occurred. Canopoli et al. [48] described advanced degradation to result in carbonyl group depletion and consequent reduction in the determined indices. Overall, for CPP in Figure 12c, it was found that both irradiance settings ultimately resulted in a decrease in CI. This seems surprising, but again, when considering Figure 12d, evidence indicates that untreated CPP, with no previous UV exposure, resulted in a steep increase in CI while samples with previous degradation histories resulted in a decrease. For CPP specifically, the degraded and embrittled surface layer appears to have fragmented into the solution medium, leaving a fresher, undegraded surface layer to be analysed. This could explain why the final CI of CPP exposed previously to an irradiance of 130 W/m2 was relatively closer to the initial index (week 0) of fresh CPP with no previous UV exposure.
Figure 13 depicts the effect of UV intensity on PET in seawater conditions on samples with and without UV history. In Figure 13a, the main effect of UV radiation on CIs for PET is shown. Both irradiances resulted in decreased CIs, with the higher irradiance in a steeper decrease. Gok [49] attributed the loss of carbonyl groups in PET to chain scission, whereas the broadening is due to carboxylic acid generation, as seen for the pretreatment in Figure 8 and Figure 9. In Figure 13b, it is evident that PET with no previous UV history resulted in the most significant change in carbonyl indices, while smaller changes were observed for material with previous exposure. Figure 13c shows the OHIs calculated for PET from the aqueous UV degradation experiment, where exposure to the higher irradiance intensity (130 W/m2) resulted in a significant increase in the OHI. The formation of these hydroxyl peaks was not observed during the pretreatment study, and it is suggested that the presence of the aqueous media facilitated hydrolytic degradation in addition to photooxidative degradation. Hydrolytic degradation of PET is already known to produce products with carboxylic acid and/or hydroxyl-ester groups [50].
As observed for the CI, PET with no previous UV history exhibited the most significant changes in surface chemistry (Figure 13d), with a strong OHI increase observed for PET exposed to 130 W/m2 irradiation. Similarly, pretreated PET showed a much smaller increase in OHI values, although the increase was greater for PET pretreated at 65 W/m2 compared to PET pretreated at 130 W/m2. It appears that the generation of hydroxyl groups is less extensive for pretreated PET compared to PET without any previous UV exposure. This indicates that UV degradation under dry conditions leads to surface chemistry changes (e.g., formation of carbonyl groups) that limits the extent of hydroxyl group formation when the material subsequently enters an aquatic environment. After 6 weeks of aqueous UV exposure, the OHI values for each sample type appeared to have stabilized, suggesting that a maximum level of surface degradation had been achieved and that further oxidation is unlikely to occur without fragmentation processes exposing “fresh” PET surfaces (Figure 13d). The results suggest that the environmental conditions (dry vs. seawater) under which UV exposure occurs, the order in which PET is exposed to UV under different environmental conditions (e.g., dry then aqueous), and the intensity of the UV irradiation in either environmental matrix can have a significant impact on the degradation mechanisms and the changes in the surface chemistry of PET.
UV exposure under aqueous conditions typically led to degradation occurring at a slower rate relative to the dry pretreatment conditions, although CPP remained the material most susceptible to UV degradation. The proportional effect of UV irradiance intensity on mass loss, crystallinity, microhardness, and CI/OHI continued with the pretreated materials under aqueous conditions, However, the greatest changes were observed for pristine materials with no prior UV exposure. It is postulated that the pretreatment introduced structural defects, crosslinking, and chemical irregularities that inhibited chain realignment into a compact crystalline structure, leading to a reduction in crystallinity for most pretreated materials under aqueous exposure conditions. Similarly, reductions in CIs observed for some materials under aqueous conditions were ascribed to degradation products on the material surface undergoing further degradation. Again, interpreting trends was challenging in some instances and this is primarily attributed to mass loss via fragmentation exposing fresh polymer material. This appears to be an important cycle for larger plastic items in the natural environment, indicating good potential for such items to be fully broken down over long timescales. In contrast to the PPs, PET exhibited an increased OHI under aqueous UV exposure and therefore appears to undergo UV and hydrolytic degradation simultaneously. Importantly, there was no evidence that the solution media used in these studies impacted the extent of degradation, indicating that similar degradation processes and rates are likely in freshwater and marine environments.

4. Conclusions

The current study attempted to investigate the impact of sequential exposure of PP and PET materials to UV irradiation under dry terrestrial conditions (pretreatment in air) and under aqueous conditions on their degradation and material property changes. The results from the pretreatment and aqueous degradation studies highlight that UV degradation of plastic materials in natural environments is a complex process that can be influenced by multiple intrinsic and extrinsic factors. The clear differences in the degradation behaviours of the three test materials under the dry and aqueous environmental conditions indicate that the UV exposure history of plastic litter might play an important role in its potential for further degradation once it has reached the marine environment. Furthermore, the differences in material behaviour between CPP and BPP, which are composed of the same bulk polymer, highlight the potentially significant impact that certain plastic additive chemicals can have on reducing the degree of UV degradation. It also appears evident that the degradation of larger plastic items most likely proceeds via a cycle where surface degradation caused by UV exposure eventually results in the fragmentation and loss of the surface layer, which exposes a fresh polymer material at the surface that is susceptible to UV degradation. More extensive studies conducted over longer UV exposure times would provide a clearer picture of the potential for UV degradation to occur in different environmental compartments. Furthermore, utilization of high-resolution analytical chemical techniques and advanced particle characterization instrumentation would allow a more detailed understanding of the degradation mechanisms and of the chemical and particulate degradation products formed.

Author Contributions

Conceptualization, G.A., A.M.B., L.S. and C.D.; investigation and methodology, W.C., G.A., C.D., A.M.B., L.S. and A.C.; project administration, L.S., A.M.B., G.A. and C.D.; writing—original draft, W.C.; writing—review and editing, A.M.B., G.A. and L.S. All authors have read and agreed to the published version of the manuscript.

Funding

This research was funded by SANOCEAN, through the South African National Research Foundation (NRF) (Grant number 118760) and the Research Council of Norway (Grant number 287939).

Institutional Review Board Statement

Not applicable.

Informed Consent Statement

Not applicable.

Data Availability Statement

Not applicable.

Acknowledgments

This work is based on research supported by the SA/Norway Joint Research Programme on Ocean Research (SANOCEAN) and the authors are highly grateful for this support.

Conflicts of Interest

The authors declare no conflict of interest.

References

  1. Plastics Europe, Plastics—The Facts 2019: An Analysis of European Plastics Production, Demand and Waste Data. 2019. Available online: https://www.plasticseurope.org/en/resources/market-data (accessed on 18 May 2022).
  2. Kershaw, P. Sources, Fate and Effects of Microplastics in the Marine Environment: Part Two of a Global Assessment; IMO/FAO/UNESCO IOC/UNIDO/WMO/IAEA/UN/UNEP/UNDP Joint Group of Experts on the Scientific Aspects of Marine Environmental Protection; International Maritime Organization: London, UK, 2016; Volume 93, p. 220. [Google Scholar]
  3. Gewert, B.; Plassmann, M.M.; MacLeod, M. Pathways for degradation of plastic polymers floating in the marine environment. Environ. Sci. Processes Impacts 2015, 17, 1513–1521. [Google Scholar] [CrossRef]
  4. Zambrano, M.C.; Pawlak, J.J.; Daystar, J.; Ankeny, M.; Cheng, J.J.; Venditti, R.A. Microfibers generated from the laundering of cotton, rayon and polyester based fabrics and their aquatic biodegradation. Mar. Pollut. Bull. 2019, 142, 394–407. [Google Scholar] [CrossRef]
  5. Da Costa, J.P.; Nunes, A.R.; Santos, P.S.M.; Girao, A.V.; Duarte, A.C.; Rocha-Santos, T. Degradation of polyethylene microplastics in seawater: Insights into the environmental degradation of polymers. J. Environ. Sci. Health Part A Tox. Hazard. Subst. Environ. Eng. 2018, 53, 866–875. [Google Scholar] [CrossRef]
  6. Andrady, A.L. Microplastics in the marine environment. Mar. Pollut. Bull. 2011, 62, 1596–1605. [Google Scholar] [CrossRef]
  7. Sait, S.T.L.; Sørensen, L.; Kubowicz, S.; Vike-Jonas, K.; Gonzalez, S.V.; Asimakopoulos, A.G.; Booth, A.M. Microplastic fibres from synthetic textiles: Environmental degradation and additive chemical content. Environ. Pollut. 2021, 268, 115745. [Google Scholar] [CrossRef]
  8. Sørensen, L.; Groven, A.S.; Hovsbakken, I.A.; Del Puerto, O.; Krause, D.F.; Sarno, A.; Booth, A.M. UV degradation of natural and synthetic microfibers causes fragmentation and release of polymer degradation products and chemical additives. Sci. Total Environ. 2021, 755, 143170. [Google Scholar] [CrossRef]
  9. Ter Halle, A.; Ladirat, L.; Martignac, M.; Mingotaud, A.F.; Boyron, O.; Perez, E. To what extent are microplastics from the open ocean weathered? Environ. Pollut. 2017, 227, 167–174. [Google Scholar] [CrossRef]
  10. Cai, L.; Wang, J.; Peng, J.; Wu, Z.; Tan, X. Observation of the degradation of three types of plastic pellets exposed to UV irradiation in three different environments. Sci. Total Environ. 2018, 628−629, 740–747. [Google Scholar] [CrossRef]
  11. Kumar, A.; Ganesh Anjana, K.; Hinduja, M.; Sujitha, K.; Dharani, G. Review on Plastic Wastes in Marine Environment–Biodegradation and Biotechnological Solutions. Mar. Pollut. Bulletin. 2019, 150, 110733. [Google Scholar]
  12. Carneiro, P.A.; Nogueira, R.F.P.; Zanoni, M.V.B. Homogeneous photodegradation of C.I. Reactive Blue 4 using a photo-Fenton process under artificial and solar irradiation. Dye. Pigment. 2007, 74, 127–132. [Google Scholar] [CrossRef]
  13. Asimakopoulos, A.G.; Thomaidis, N.S.; Kannan, K. Widespread occurrence of bisphenol A diglycidyl ethers, p-hydroxybenzoic acid esters (parabens), benzophenone type-UV filters, triclosan, and triclocarban in human urine from Athens, Greece. Sci. Total Environ. 2014, 470–471, 1243–1249. [Google Scholar] [CrossRef]
  14. Organisation for Economic Co-operation and Development (OECD). Emission Scenario Document on Plastic Additives; Series on Emission Scenario; Documents No. 3; OECD: Paris, France, 2009. [Google Scholar]
  15. Organisation for Economic Co-operation and Development (OECD). Complementing Document to the Emission Scenario; Document on Plastic Additives: Plastic Additives during the Use of End Products; OECD: Paris, France, 2019. [Google Scholar]
  16. Andrade, H.; Glüge, J.; Herzke, D.; Ashta, N.M.; Nayagar, S.M.; Scheringer, M. Oceanic long-range transport of organic additives present in plastic products: An overview. Environ. Sci. Eur. 2021, 85, 33. [Google Scholar] [CrossRef]
  17. Hermabessiere, L.; Dehaut, A.; Paul-Pont, I.; Lacroix, C.; Jezequel, R.; Soudant, P.; Duflos, G. Occurrence and effects of plastic additives on marine environments and organisms: A review. Chemosphere 2017, 182, 781–793. [Google Scholar] [CrossRef]
  18. Wang, Z.; Chen, M.; Zhang, L.; Wang, K.; Yu, X.; Zheng, Z.; Zheng, R. Sorption behaviors of phenanthrene on the microplastics identified in a mariculture farm in Xiangshan Bay, southeastern China. Sci. Total Environ. 2018, 628, 1617–1626. [Google Scholar] [CrossRef]
  19. Ziccardi, L.M.; Edgington, A.; Hentz, K.; Kulacki, K.J.; Kane Driscoll, S. Microplastics as vectors for bioaccumulation of hydrophobic organic chemicals in the marine environment: A state-of-the-science review. Environ. Toxicol. Chem. 2016, 35, 1667–1676. [Google Scholar] [CrossRef]
  20. Sørensen, L.; Rogers, E.; Altin, D.; Salaberria, I.; Booth, A.M. Sorption of PAHs to microplastic and their bioavailability and toxicity to marine copepods under co-exposure conditions. Environ. Pollut. 2020, 258, 113844. [Google Scholar] [CrossRef]
  21. Halsband, C.; Booth, A.M. Ecological Impacts of Particulate Plastics in Marine Ecosystems. In Particulate Plastics in Terrestrial and Aquatic Environments; Bolan, N.S., Kirkham, M.B., Halsband, C., Nugegoda, D., Ok, Y.S., Eds.; Taylor & Francis Group: Abingdon-on-Thames, UK, 2020; pp. 233–248. [Google Scholar]
  22. Booth, A.M.; Sørensen, L. Microplastic Fate and Impacts in the Environment. In Handbook of Microplastics in the Environment; Rocha-Santos, T., Costa, M., Mouneyrac, C., Eds.; Springer: Cham, Switzerland, 2020; pp. 1–24. [Google Scholar]
  23. Vroom, R.J.E.; Koelmans, A.A.; Besseling, E.; Halsband, C. Aging of microplastics promotes their ingestion by marine zooplankton. Environ. Pollut. 2017, 231, 987–996. [Google Scholar] [CrossRef]
  24. Xia, B.; Sui, Q.; Du, Y.; Wang, L.; Jing, J.; Zhu, L.; Zhao, X.; Sun, X.; Booth, A.M.; Chen, B.; et al. Secondary PVC microplastics are more toxic than primary PVC microplastics to Oryzias melastigma embryos. J. Hazard. Mater. 2022, 424, 127421. [Google Scholar] [CrossRef]
  25. Primpke, S.; Gerdts, G.; Strand, J.; Scholz-Böttcher, B.; Aliani, S.; Patankar, S.; Lusher, A.; Booth, A.M.; Gomiero, A.; Kögel, T.; et al. Monitoring of microplastic pollution in the Arctic: Recent developments in polymer identification, quality assurance and control (QA/QC), and data reporting. Arct. Sci. 2022, in press. [CrossRef]
  26. Allen, N.S.; Edge, M.; Mohammadian, M. Hydrolytic degradation of Poly(ethylene terephthalate): Importance of chain scission versus crystallinity. Eur. Polym. J. 1991, 27, 1373–1378. [Google Scholar] [CrossRef]
  27. Osram GmbH. More Than Just Light—Solutions in Ultraviolet Light; Osram GmbH: Munich, Germany, 2013; Available online: https://docs.rs-online.com/45d7/0900766b81506d14.pdf (accessed on 20 August 2019).
  28. Riley, J.; Skirrow, G. Chemical Oceanography, 2nd ed.; Academic Press: London, UK, 1975; Volume 2. [Google Scholar]
  29. Laird, M.; Write, A.; Massie, V.; Clark, B. Marine Environmental Impact Assessment for the Proposed Desalination Plants around the Cape Peninsula, South Africa; Anchor Environmental Consultants Report No. 1768/322; WorleyParsons Group: Cape Town, South Africa, 2017; Available online: https://sahris.sahra.org.za/sites/default/files/heritagereports/Marine%20Environmental%20Impact%20Assessment%20-%20CoCT%20Desalination%20Plants%20-%20Draft%203%20copy.pdf (accessed on 18 May 2022).
  30. Chamas, A.; Moon, H.; Zheng, J.; Qiu, Y.; Tabassum, T.; Jang, J.H.; Abu-Omar, M.; Scott, S.L.; Suh, S. Degradation Rates of Plastics in the Environment. ACS Sustain. Chem. Eng. 2020, 8, 3494–3511. [Google Scholar] [CrossRef]
  31. Moore, G.F.; Saunders, S.M. Advances in Biodegradable Polymers, 1st ed.; CRC Press: Boca Raton, FL, USA, 1998. [Google Scholar]
  32. Karger-Kocsis, J. Structure and morphology. In Polypropylene: Structure, Blends and Composites; Chapman & Hall: London, UK, 1995. [Google Scholar]
  33. Wunderlich, B. Macromolecular Physics V1, 1st ed.; Elsevier Inc.: New York, NY, USA, 1973. [Google Scholar]
  34. Francois-Heude, A.; Richaud, E.; Desnoux, E.; Colin, X. A general kinetic model for the photothermal oxidation of polypropylene. J. Photochem. Photobiol. A Chem. 2015, 296, 48–65. [Google Scholar] [CrossRef]
  35. Callister, W.D.; Rethwisch, D.G. Materials Science and Engineering, 9th ed.; John Wiley & Sons, Inc.: Hoboken, NJ, USA, 2015. [Google Scholar]
  36. Pilař, J.; Michálková, D.; Šlouf, M.; Vacková, T. Long-term accelerated weathering of HAS stabilized PE and PP plaques: Compliance of ESRI, IR, and microhardness data characterizing heterogeneity of photooxidation. Polym. Degrad. Stab. 2015, 120, 114–121. [Google Scholar] [CrossRef]
  37. Montgomery, D.C. Design and Analysis of Experiments; Wiley: New York, NY, USA, 1976; ISBN 9780471614210. [Google Scholar]
  38. Singh, B.; Sharma, N. Mechanistic implications of plastic degradation. Polym. Degrad. Stab. 2008, 93, 561–584. [Google Scholar] [CrossRef]
  39. McKeen, L.W. The Effect of UV Light and Weather on Plastics and Elastomers, 3rd ed.; Elsevier: Waltham, MA, USA, 2013. [Google Scholar]
  40. Edge, M.; Hayes, M.; Mohammadian, M.; Allen, N.S.; Jewitt, T.S.; Brems, K.; Jones, K. Aspects of poly(ethylene terephthalate) degradation for archival life and environmental degradation. Polym. Degrad. Stab. 1991, 32, 131–153. [Google Scholar] [CrossRef]
  41. Nagai, Y.; Ogawa, T.; Zhen, L.Y.; Nishimoto, Y.; Ohishi, F. Analysis of weathering of thermoplastic polyester elastomers—I. Polyether-polyester elastomers. Polym. Degrad. Stab. 1997, 56, 115–121. [Google Scholar] [CrossRef]
  42. Ehrenstein, G.W.; Richard, P. Theriault. Polymeric Materials: Structure, Properties, Applications; Hanser Verlag: Munich, Germany, 2001; pp. 67–78. [Google Scholar]
  43. Quan, X.; Fry, E.S. Empirical equation for the index of refraction of seawater. Appl. Opt. 1995, 34, 3477–3480. [Google Scholar] [CrossRef]
  44. Alimi, O.S.; Claveau-Mallet, D.; Kurusu, R.S.; Lapointe, M.; Bayen, S.; Tufenkji, N. Weathering pathways and protocols for environmentally relevant microplastics and nanoplastics: What are we missing? J. Hazard. Mater. 2022, 423, 126955. [Google Scholar] [CrossRef]
  45. Lee, Y.K.; Murphy, K.R.; Hur, J. Fluorescence Signatures of Dissolved Organic Matter Leached from Microplastics: Polymers and Additives. Environ. Sci. Technol. 2020, 54, 11905–11914. [Google Scholar] [CrossRef]
  46. Rabello, M.S.; White, J.R. Photodegradation of polypropylene containing a nucleating agent. Appl. Polym. Sci. 1966, 64, 2505–2517. [Google Scholar] [CrossRef]
  47. Brandon, J.; Goldstein, M.; Ohman, M.D. Long-term aging and degradation of microplastic particles: Comparing in situ oceanic and experimental weathering patterns. Mar. Pollut. Bull. 2016, 110, 299–308. [Google Scholar] [CrossRef] [PubMed]
  48. Canopoli, L.; Coulon, F.; Wagland, S.T. Degradation of excavated polyethylene and polypropylene waste from landfill. Sci. Total Environ. 2020, 2020, 698. [Google Scholar] [CrossRef] [PubMed]
  49. Gok, A. Degradation Pathway Models of Poly(Ethylene-Terephthalate) under Accelerated Weathering Exposures. Ph.D. Thesis, Case Western Reserve University, Cleveland, OH, USA, 2016. [Google Scholar]
  50. Awaja, F.; Pavel, D. Recycling of PET. Eur. Polym. J. 2005, 41, 1453–1477. [Google Scholar] [CrossRef]
Figure 1. Schematic of the UV chamber used in this investigation.
Microplastics 01 00033 g001
Figure 2. Main effects of (a) plastic type, (b) UV irradiance intensity, and (c) plastic shape and size on mass loss over time (up to 6 weeks) for the UV exposure studies.
Microplastics 01 00033 g002
Figure 3. (a) Degree of crystallinity for the BPP, CPP, and PET under 65 W/m2 and 130 W/m2 UV irradiances, and (b) percentage change in crystallinity after 6 weeks of exposure to UV.
Microplastics 01 00033 g003
Figure 4. SEM image of UV-treated PP at 130 W/m2.
Microplastics 01 00033 g004
Figure 5. (a) Microhardness (kg-f/mm2) results for BPP and PET plastics exposed to different UV irradiances. (b) Percentage increase in microhardness (from week 0). Data for CPP could not be generated due to these samples fragmenting during analysis of microhardness (c).
Microplastics 01 00033 g005
Figure 6. Summary of carbonyl index results for CPP and BPP. (a) Carbonyl index over time per plastic. (b) Carbonyl index over time for BPP per shape. (c) Carbonyl index over time for CPP per shape.
Microplastics 01 00033 g006
Figure 7. FTIR spectra of (a) CPP and (b) BPP showing the development of the carbonyl peak in both materials following six weeks of exposure to UV irradiance at an intensity of 130 W/m2.
Microplastics 01 00033 g007
Figure 8. Effect of UV irradiance intensity and shape on the carbonyl index of PET.
Microplastics 01 00033 g008
Figure 9. FTIR spectra of PET indicating the broadening of the carbonyl peak and formation of acids following six weeks of exposure at a UV irradiance of 130 W/m2.
Microplastics 01 00033 g009
Figure 10. Effect of (a) UV irradiance (W/m2), (b) plastic type, (c) UV history (W/m2), and (d) solution medium on mass loss (%) over time (weeks) for the UV beaker tests.
Microplastics 01 00033 g010
Figure 11. Percentage crystallinity of the BPP, CPP, and PET materials generated in the pretreatment dry UV exposures following subsequent UV exposure under aqueous (seawater) conditions. The percentage change in crystallinities relative to the values calculated for the pretreatment study are also presented for BPP (b), CPP (b), and PET (b).
Microplastics 01 00033 g011
Figure 12. Effect of UV intensity on BPP and CPP in seawater conditions: (a) Main effect of UV irradiance on CI over time (weeks) for BPP; (b) CI over time (weeks) for BPP with different UV histories; (c) main effect of UV irradiance on CI over time (weeks) for CPP; (d) CI over time (weeks) for CPP with different UV histories.
Microplastics 01 00033 g012
Figure 13. Effect of UV intensity on PET in seawater conditions: (a) Main effect of UV irradiance on CI over time (weeks) for PET; (b) CI over time (weeks) for PET with different UV histories; (c) main effect of UV irradiance on OHI over time (weeks) for PET; (d) OHI over time (weeks) for PET with different UV histories.
Microplastics 01 00033 g013
Publisher’s Note: MDPI stays neutral with regard to jurisdictional claims in published maps and institutional affiliations.

