Article

Short-Term Microplastics Exposure to the Common Mysid Shrimp, Americamysis bahia: Effects on Mortality and DNA Methylation

by
Jack H. Prior
1,
Justine M. Whitaker
2 and
Alexis M. Janosik
1,*
1
Department of Biology, University of West Florida, Pensacola, FL 32514, USA
2
Department of Biological Sciences, Nicholls State University, Thibodaux, LA 70301, USA
*
Author to whom correspondence should be addressed.
Microplastics 2024, 3(2), 234-249; https://doi.org/10.3390/microplastics3020014
Submission received: 1 February 2024 / Revised: 23 February 2024 / Accepted: 19 March 2024 / Published: 8 April 2024

Abstract

:
Primary consumers of microplastics are often zooplankton species such as the mysid shrimp, Americamysis bahia. Ingesting and interacting with these plastics can cause stress and lead to death. In the presence of some environmental stressors, gene expression may be altered without changing DNA sequences via the epigenetic methylation of the DNA. Mysid shrimp were exposed to 5-micrometer fluorescent polystyrene microbeads at different concentrations and different lengths of time. No significant effects were observed on mortality within 72 h, but mortality increased significantly thereafter. Microplastics were consumed by mysids and adhered to the mysid carapace and appendages. An ELISA-like (Enzyme-Linked Imuunosorbent Assay) colorimetric assay was employed to assess mysid DNA for differences in global percent methylation. No significant difference in the average percent methylated DNA nor difference in the number of methylation detections between treatments was found. This is one of few studies that has investigated DNA methylation effects due to microplastics-induced stress and the first study to detect DNA methylation in any member of the order Mysida.

1. Introduction

In marine ecosystems, plastic waste has become increasingly widespread. Plastics, such as polystyrene, continue fragmenting further into microplastics (0.1 to 5000 μm) and nanoplastics (0.001 to 0.1 μm). Microplastics often resemble natural food items in both size and shape [1]. Microplastic consumption leads to effects on the planktonic food web and the further breakdown of plastics into smaller particles [2]. Marine zooplankton are known to consume microplastic particles in laboratory and natural settings [3,4,5]. When particles are ingested, microplastics can cause mortality and many types of biological stress. For example, five-micrometer polystyrene beads have been shown to decrease growth and fecundity in mysid shrimp [6]. Copepods showed decreases in reproductive activity and functionality after consuming microplastics [7,8,9]. The transfer of plastic material also occurs in Daphnia from adults to embryos via the penetration of brood pouch tissues after polystyrene nanoplastics are ingested by adults [10]. Microplastics and nanoplastics affect fish larvae [11] and can affect development when exposed to the eggs [12]. Furthermore, secondary exposure effects have been observed in fish that consumed zooplankton that had already ingested polystyrene microplastics [13]. Many questions regarding stress linked to microplastic exposure are now being investigated, including at the molecular and genetic levels.
After exposure to toxic chemicals, a phenotype may take multiple forms in different individuals without any change in the genotype [14,15]. Put differently, if an organism is exposed to an environmental stressor such as polystyrene microplastics then effects such as higher percentages of gene inhibition may occur, even though the actual genetic sequence of DNA remains the same (i.e., epigenetics). Mechanisms for these effects can be short-term, reversible, and/or rapid responses to brief environmental stressors [16,17]; however, epigenetic modifications, notably DNA methylation, may become persistent, potentially heritable, and can sometimes endure throughout different generations. This was shown in the progeny of Daphnia, even when the source of environmental stress had been removed from later generations [14,18]. Furthermore, microplastics have been specifically shown to cause transgenerational epigenetic effects in Caenorhabditis elegans [19].
Among Arthropoda, several crustaceans exhibit natural amounts of DNA methylation, including penaeid shrimp, crabs [20], isopods [21], and branchiopods [22]. High methylation levels on specific genes (known as housekeeping genes) are linked to conserved protein-coding sequences, which are important for cell function and aging throughout diverse families of invertebrates, including arthropoda, anthozoa, and tunicata [23]. To our knowledge, no study has shown DNA methylation occurring in a member of the crustacean order mysida. As such, the objective of this study was to investigate the mortality response and epigenetic effects caused by exposure and consumption of microplastics on the common mysid shrimp, Americamysis bahia. Specifically, this study explored the impact of polystyrene microplastics on mysid epigenetics by comparing levels of global DNA methylation.
Americamysis bahia is a model organism for this investigation because the order Myside includes planktonic species that, like microplastics, exist from pole-to-pole across the Atlantic or Pacific Oceans and can also inhabit large freshwater lakes, such as in the Great Lakes of the United States [24,25]. The surface concentration of microplastics over the northern Gulf of Mexico (part of the natural habitat of Americamysis bahia) is similar to zooplankton abundance [26]. Most species of mysids are relatively short-lived, have a short reproductive cycle (days to weeks), and are observably sensitive to changes in water quality. Several mysid species are used for commercial fish food in both the aquaculture and aquarium industries. The anatomical structure of mysids and other shrimp-like crustaceans is particularly vulnerable to microplastic-based stress. For example, crustaceans often have complex mouths, made of many movable parts. Even though many shrimp-like crustaceans have a simple digestive tract, microplastics can clog orifices and digestive pathways or embed themselves into internal tissues [27]. Many zooplankton crustaceans have small hair-like setae all over their bodies, which increases the surface area to which microplastics can adhere [28]. Plastic particles also have the potential to penetrate between the plates of mysid bodies and into the gill cavity beneath the carapace.
The characteristics of microplastics, including size, shape, chemical composition, and the propensity to bind to other chemicals like BPA, collectively provide the potential to cause physical, nutritional, or toxic stress in the animals that ingest the particles. Few studies have linked microplastic exposure to epigenetic effects in other species [29,30]. If DNA methylation is linked to microplastic exposure in the common mysid, it could help to understand the radiating effects of microplastics on zooplankton species that impact the ecological balance of the planktonic food web. The trophic bioaccumulation of plastics ultimately leads to human consumption, and the resulting epigenetic effects are beginning to be considered for public health reasons [31].

2. Materials and Methods

2.1. Experimental Conditions and Quality Control

Approximately 700 adult Americamysis bahia individuals were obtained via overnight shipping from Sachs Systems Aquaculture ©, St. Augustine, FL, USA. Shipping water was recorded as 25 ppt salinity at 76 °F. Following a 20 min temperature acclimation and 1 h water drip acclimation, all individuals were transferred to a holding tank by use of a 150 µm metal mesh coffee filter and a 5 mL glass serological pipette. The holding tank was set to ideal conditions for A. bahia as set by Lussier [32]. Following the procedures of Wang [6], a 24 h depuration period with no feeding and oxygenation via aquatic bubble stones was applied to the organisms. Mortality of less than 7% was recorded following the acclimation and depuration period. An initial group of 12 mysid shrimp was pulled from the holding tank and preserved in 95% ethanol as a reference for the experimental treatments in order to compare DNA methylation levels before any treatments. Mysid shrimp were then individually placed in randomly selected experimental flasks using a metal filter, metal spatulas, metal spoons, glass dishes, and glass serological pipettes. During experiments, mysids were fed twice a day with one-day-old brine shrimp larvae cultures.
Outside sources of plastics were minimized as much as possible during this study. All glass equipment was rinsed several times with milliQ filtered water (ELGA Labwater PureLab Classic, Woodridge, IL, USA) prior to use, and no plastic instruments were used in the experimental setup. A single large batch of water was mixed to 25.0 salinity (1.0188 specific gravity), using milliQ filtered water and InstantOcean™ (Blacksburg, VA, USA), eight days prior to the experiments. The batch was used to distribute 2000 mL of water to 20 experimental glass flasks and to fill a glass tank to initially hold the mysids prior to random distribution to the flasks. Extra water for rinsing equipment and culturing brine shrimp larvae was kept in closed glass containers. It should be noted that microplastic particles have been recovered from the commercial aquarium sea salts in previous studies [33]; thus, the InstantOcean used in this study likely introduced some amount of plastic contamination. Contamination was not quantified but was not observed with the treatment plastics in the microscopic imagery. Five µm microbeads (Spherotech®, Lake Forest, IL, USA, Catalogue # FP-6052-2) were placed into the artificial seawater one week before the organisms to emulate short-term aging to represent a more realistic interaction between plastics and zooplankton in the water column [34]. The chosen microbeads included yellow fluorescent coloring (maximum emission occurring at a wavelength of 488–498 nm) to allow for microscopic visualization. The total number of microbeads was provided with the product, allowing for accurate dilutions to be made for distribution to the experimental flasks. These dilution methods were validated by testing ten 5 mL water samples with a FlowCam FOV80 image lens (Fluid Imaging, Scarborough, ME, USA) with the capability of calculating particles per mL.
Two experiments were employed simultaneously to assess the acute stress response in mysids as a result of exposure to microplastics. The number of dead individuals from each experiment and any observed plastic interactions (S18) were used to quantify and qualify the stress response. Plastic interactions were categorized by the part of mysid anatomy that beads were observed touching. Living individuals from the experiments were preserved for DNA extraction using the DNeasy Blood and Tissue Extraction Kit (Qiagen®, Hilden, Germany). Mysids from experiment I, described below, were analyzed for global DNA methylation using MethylFlash™ (EpiGentek ©, Farmingdale, NY, USA) [35].

2.2. Experiment I Design

Experiment I was a period of 72 h, in which mysids were exposed to environments with concentrations of zero plastics (n = 4 flasks), low concentrations of plastics (2 microplastics per mL; mp/mL, n = 4 flasks), and high concentrations of plastics (15 mp/mL, n = 4 flasks) (Supplementary Figures S1 and S2). The “low” concentrations represent some current levels of pollution, and “high” concentrations emulate conditions in the accumulations of ocean gyres, urbanized nearshore areas, or future conditions following increased trends of microplastic pollution. The control group, with no dosed plastics, represents conditions that are essentially no longer present or extremely rare in nature. Mysids (n = 300) were randomly distributed from the holding tank to the 12 flasks until there were 25 individuals in each container. After the 72 h experiment, mysids were preserved in 95% ethanol for DNA extractions. For experiment I, a one-factor, completely randomized, one-way analysis of variance (ANOVA) was used to compare mortality percentages between experimental flasks of different treatment groups. All data were shown to be normally distributed (Shapiro–Wilk) with homogeneity of variance.

2.3. Experiment II Design

Experiment II involved dosing mysids with short-term increases in microplastic concentrations to emulate conditions of an organism passing through a gradient of microplastic pollution, such as facing increasing microplastic pollution in a developing area. Experimental flasks were either dosed with increasing amounts of microplastic beads (n = 4 flasks) or had no plastics added (n = 4 flasks) (Figures S3 and S4). In the four dosed flasks, concentrations of plastic were increased by 4 mp/mL every 48 h for a full treatment time of 144 h. Mysids (n = 200) were randomly distributed among the eight flasks until there were 25 individuals in each container. After each incremental dosing, the same number of mysids was collected from each flask and preserved in 95% ethanol for DNA extraction. Specifically, after the first interval of treatments at 4 mp/mL, six individuals were preserved from both treatment and control flasks. After the second treatment at 8 mp/mL, five individuals were preserved. After the final treatment of 12 mp/mL, all remaining living individuals were preserved. Non-parametric comparisons were made for mortality comparisons in experiment II, as a Kruskal–Wallis rank-transform was performed prior to ANOVA to correct issues of homogeneity of variance and non-normal distributions. ANOVA calculation was performed by means of the IBM Statistical Product and Service Solutions Software (SPSS, version 25). All ANOVAs for mortality of both experiments I and II were performed at a 95% confidence interval.

2.4. DNA Extraction and Methylation Detection Spectrophotometry

DNA was extracted from experiment I mysid shrimp using the Qiagen DNeasy Blood and Tissue Kit® per the manufacturer’s instructions. Global DNA methylation was estimated for individuals from experiment I (n = 222) using the MethylFlash™ colorimetric microplate read at 450 nm. A response factor approach was used to calculate the amount of methylated DNA (ng) in experimental mysid samples with respect to optical density as opposed to standard linear regression [36]. In no case was the amount of methylated DNA extrapolated beyond the standard curve because all sample well OD values were less than that of the highest positive control standards used to calculate the regression. The percent of global methylation in the sample was calculated by dividing the amount of methylated DNA by the total amount of input DNA and multiplying by 100. Input DNA for all mysid sample wells on each microplate was 100 ng. Thus, the calculated amount of methylated DNA in ng is equal to global DNA percent methylation.
Twelve mysids were sampled from the holding tank before any treatments (referred to as the shipment group). At the end of experiment I, 70 individuals were collected from control flasks, 71 individuals were collected from low-concentration flasks, and 69 individuals were collected from high-concentration flasks. Each mysid DNA extraction concentration was quantified using a Qubit™ 2.0 Fluorometer and Qubit™ dsDNA HS assay (Invitrogen®, Carlsbad, CA, USA). Figure S5 shows an example of the MethylFlash™ 48-well half-plate assay results and the associated PerkinElmer OD. For each sample, 100 ng of DNA was used for each duplicate well of the MethylFlash™ assay. For the standard control, 1.0 µL of each diluted methylation standard, at concentrations of 0, 0.5, 1.0, 2.0, 5.0, and 10.0 ng/µL polynucleotides containing 50% 5-methylcytosine, were arranged in duplicate columns on each microplate (Figure S6). For six individuals, the methylation assay was repeated on separate plates to test the repeatability (Figure S7). The colorimetric testing took place in a Perkin-Elmer Model 2030-0030 (Waltham, MA, USA) microplate spectrophotometer, which took one-second optical density readings in 450 nm wavelength light. Each whole microplate reading was performed in triplicate to ensure the precision of the assay.
The levels of DNA methylation in the collected mysids were determined by the given Epigentek© formulas and procedures. Some standard curves were not linear and required the use of a response factor in order to more accurately calculate the amount of methylated DNA in each sample. Differences in average percent methylation of individuals from each experiment I flask were compared via a Kruskal–Wallis rank transformation and completely randomized, non-parametric ANOVA using SPSS (version 25, IBM© SPSS, Chicago, IL, USA). The frequency of methylation detections per experimental flask was compared via randomized one-way ANOVA using SPSS (version 25). Detections were calculated to a limit of 0.05 ng of methylated DNA (0.05% global DNA methylation of a sample).

2.5. Fluorescent Microscopy

Throughout the treatment, deceased mysids from both experiments were removed from flasks, and individuals were preserved in 95% ethanol until they could be examined beneath a microscope for observations of microplastic interactions. Ninety-six adult mysids were selected for imaging. Twenty-five adults were imaged from experiment I, and seventy-one adults were imaged from experiment II. The same procedure was used for 91 opportunistically sampled juvenile mysids. Seventy-five juveniles were imaged from experiment I, and sixteen juveniles were imaged from experiment II. Particulate matter from each flask was also imaged using the same scope.
The number of plastic interactions with the mysid bodies was compared between the low-concentration and high-concentration groups of experiment I. The average number of interactions on mysids in each flask was compared via completely randomized one-way ANOVA on SPSS (version 25). Comparisons of the average number of plastic interactions per experimental flasks were made with images of only adult mysids, only juvenile mysids, and both adults and juveniles combined. Imaged mysids that included observed microplastics (n = 103) were used to compare the anatomical structures that were being affected by the microbeads.

3. Results

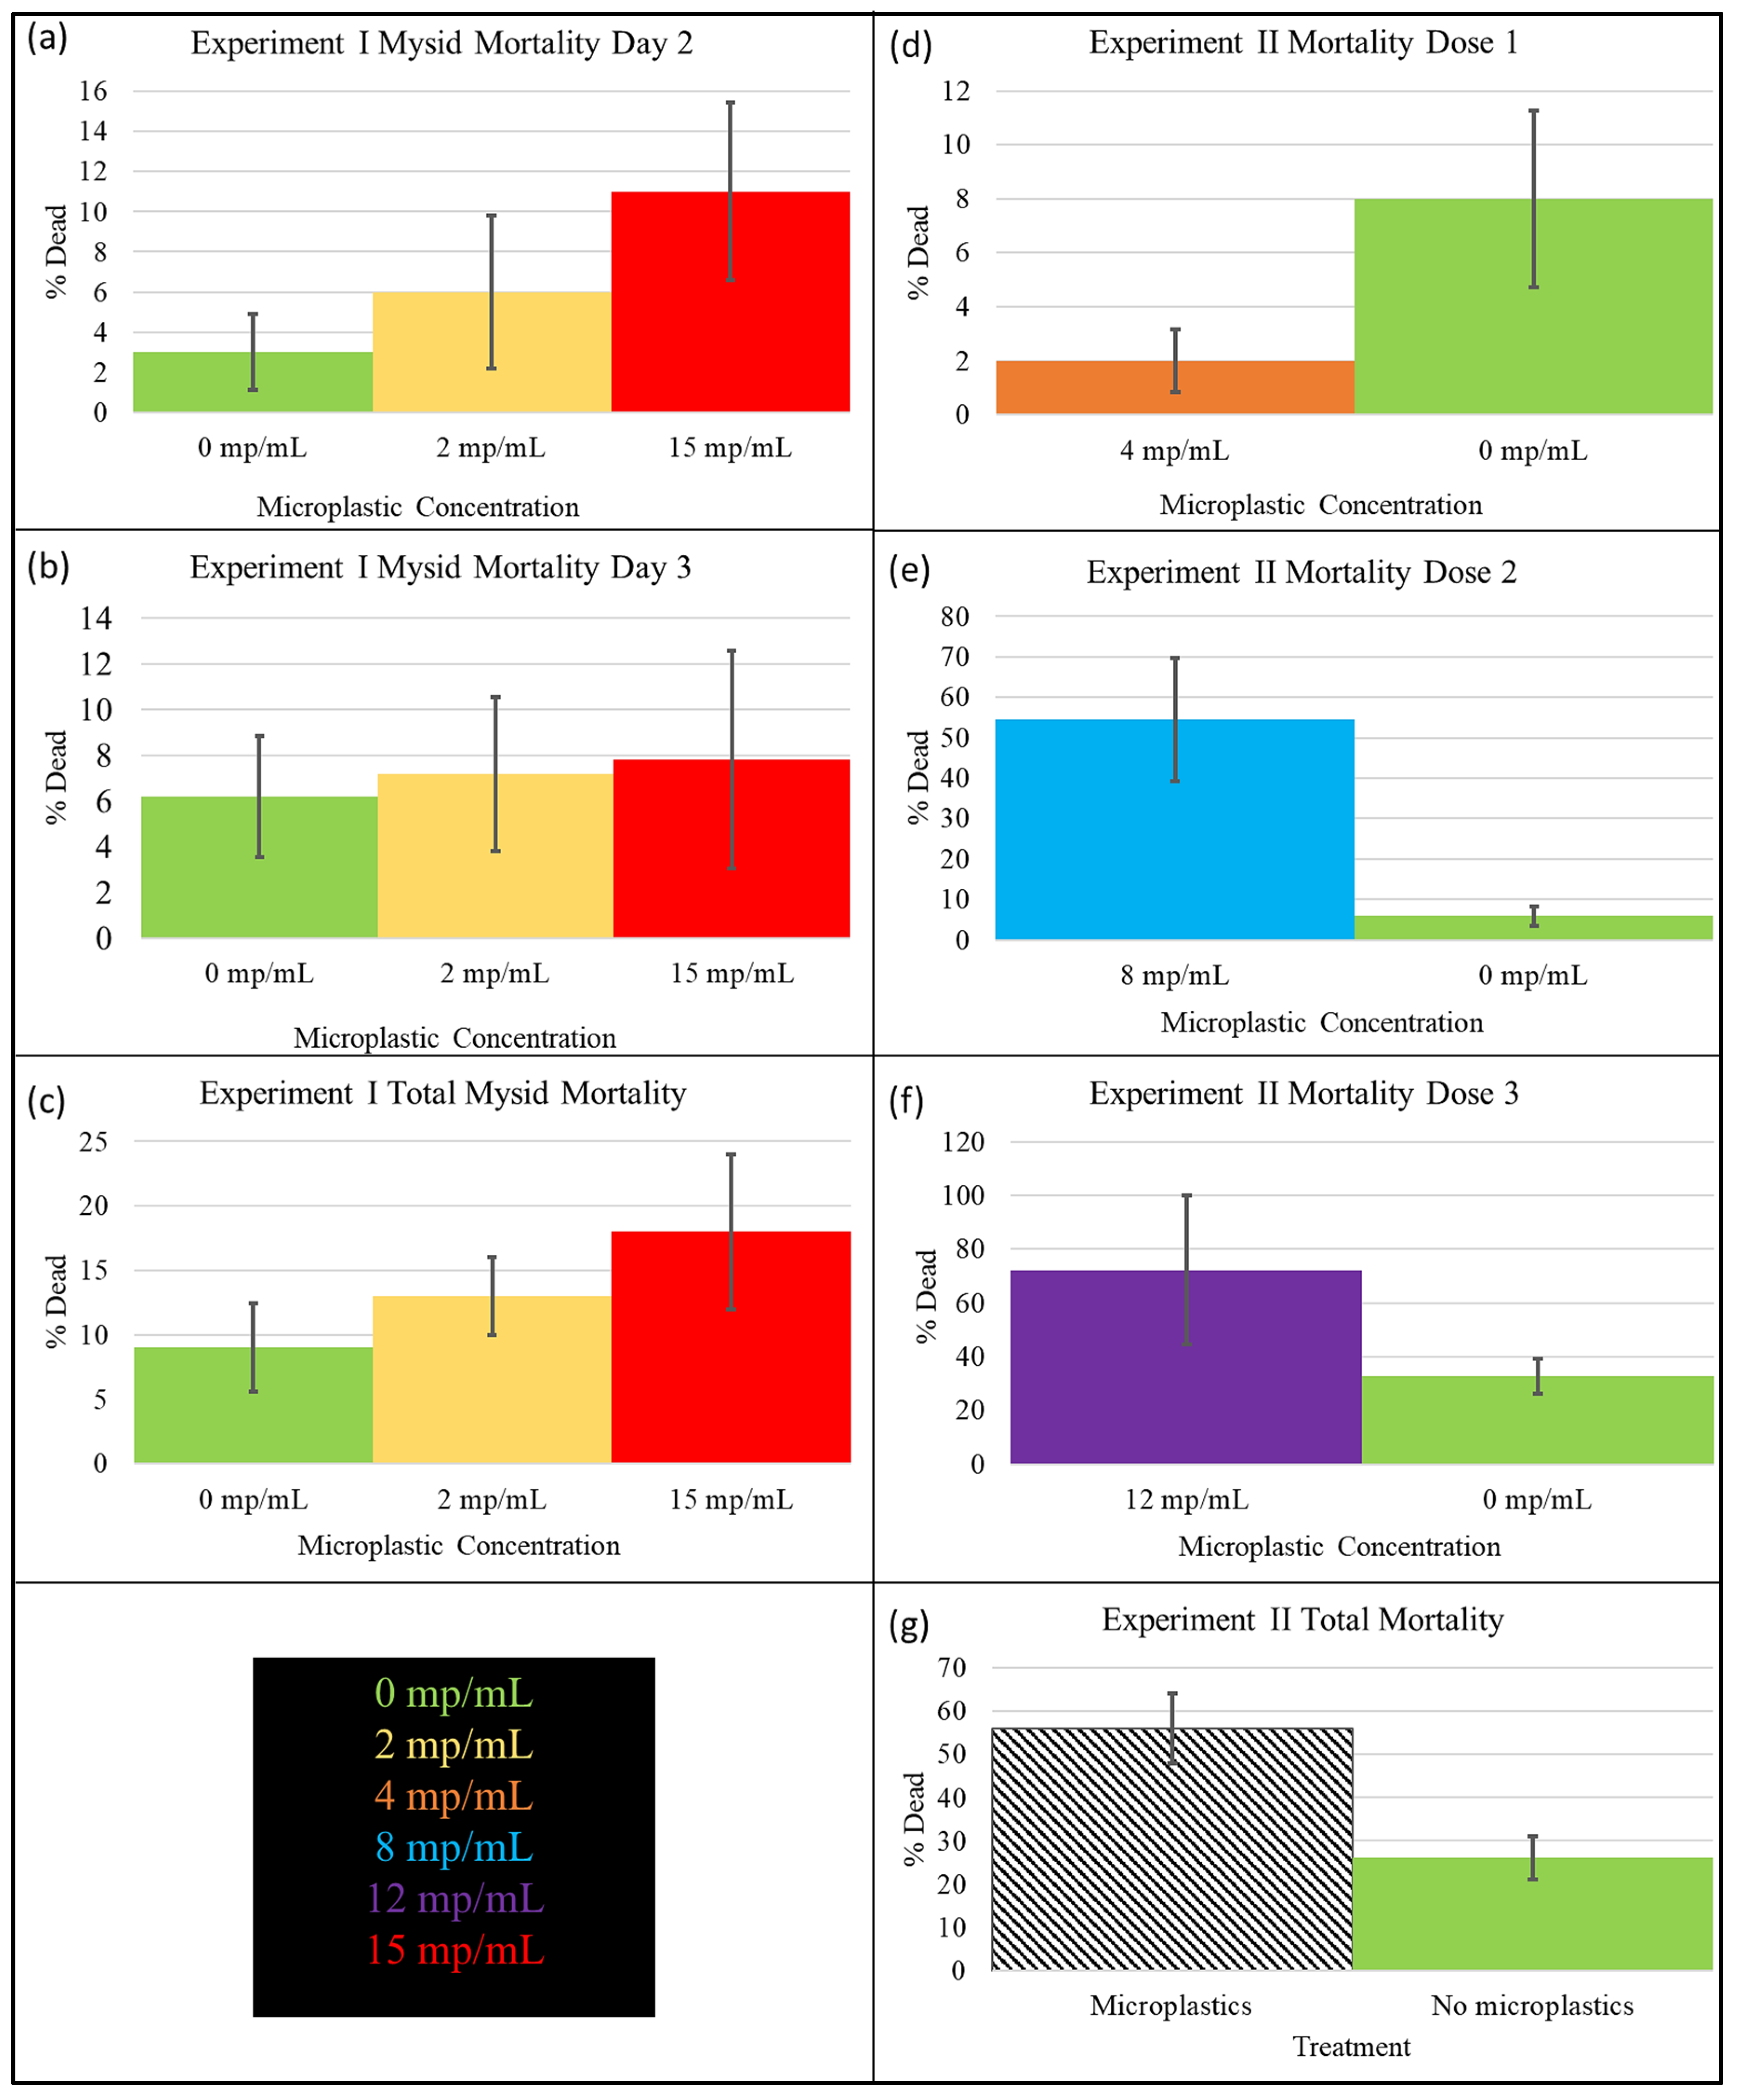
3.1. Experiment I Mortality

In experiment I, despite more recorded mortality in groups treated with microplastics, there was no significant indication of increased mysid mortality with increased concentrations of plastics (Table S1). All mysids from all flasks survived the first day of treatments. Over the full experimental period, the highest number of deaths occurred from the 15 mp/mL treatment, and the lowest number of deaths occurred from the control. The greatest number of deaths (6) in one day, in one flask, occurred in a high-concentration flask on the second day. The greatest number of deaths (11) in one day for any treatment group occurred in the 15 mp/mL flasks on the second day.
The mean percent mortality of treatment day two was 3% per flask for the control group (SE 1.91), 6% per flask for the low-concentration treatment group (SE 3.83), and 11% per flask for the high-concentration treatment group (SE 4.43). Percent dead after day two revealed no significant difference between all treatment groups (p-value 0.322, 2 df, F-value 1.289; Figure 1 and Figure S8). Mean percent mortality after day 3 was 6.2% per flask for the control group (SE 2.66), 7.2% per flask for the low-concentration treatment group (SE 3.36), and 7.825% per flask for the high-concentration treatment group (SE 4.77). Percent dead after day three revealed no significant difference between percent mortality among treatment groups (p-value 0.952, 2 df, F-value 0.049; Figure 1 and Figure S9).
In total, 9 deaths from control flasks, 11 deaths from flasks with low microplastic concentrations, and 20 deaths from flasks with high microplastic concentrations yielded a total of 40 deaths at the end of the 72 h of treatment. The two flasks with the highest mortality rates (28%) were found among the 15 mp/mL treatment groups, while one flask from the control groups had 100% survivorship. Mean percent mortality after day 3 was 9% per flask for the control group (SE 3.42), 13% per flask for the low-concentration treatment group (SE 3.00), and 18% per flask for the high-concentration treatment group (SE 6.00). The percent dead after the completed trial showed no significant difference between treatment groups (p-value 0.381, 2 df, 1.076; Figure 1 and Figure S10). When comparing control group mortality to both 2 and 15 mp/mL treatment group mortality combined, there was still no significant difference between total mortality rates (p-value of 0.242, 1 df, F-value 1.543).

3.2. Experiment II Mortality

In experiment II, there was a significant increase in mysid mortality associated with prolonged exposure to microplastics (Table S2). Similar to experiment I, all individuals survived the first day of treatment. Both dosed and control groups experienced mortality of mysids during the second day of treatments. Mean percent mortality for the first 48 h was 8% per flask for the control group (SE 3.27) and 2% per flask for groups treated with microplastics (SE 1.15). There was no significant difference in deaths related to microplastics at this point (p-value 0.143, 1 df, F-value 2.830; Figure 1 and Figure S11).
Within the second dosage interval of 8 mp/mL, the mean percent mortality was 5.95% per flask for the control group (SE 2.43) and 54.45% per flask for groups treated with microplastics (SE 15.22). Forty-four total deaths occurred in this period, and there was a significant difference between the control and treatment groups (p-value 0.005, 1 df, F-value 19.200; Figure 1 and Figure S12). All mysids in treatment flask 1 were deceased by the end of the 8 mp/mL dosage.
In the final dosage interval, 14 deaths occurred in control tanks, and 14 deaths occurred in treatment tanks. The mean percent mortality of dose interval three was 32.78% per flask for the control group (SE 6.55) and 72.23% per flask for groups treated with microplastics (SE 27.77), but within the final dosage period, there was no significant difference between the control and treatment groups (p-value 0.327, 1 df, F-value 1.180; Figure 1 and Figure S13).
When comparing the mortality over the entire 144 h of treatments, there were more deaths in the dosed groups than in the control groups. A total of 56 individuals died in the treatment flasks, while 34 died in the control flasks. All living mysids in treatment flasks 2 and 3 were deceased by the end of the 12 mp/mL dosage. The four microplastic-dosed flasks show the four highest mortality percentages, ranging from 36% to 76% mortality. The highest number of deaths was 3 for any control group flask on any day of experiment II. The four control flasks had the four lowest percentages and ranged from 12% to 36% mortality. Mean percent mortality for the total duration of the experiment was 26% per flask for the control group (SE 5.03), and 56% per flask for groups treated with microplastics (SE 8.16). The mean percent in total deaths was significantly different between treatments, with a p-value of 0.010, 1 df, and an F-value of 13.636 (Figure 1 and Figure S14).

3.3. Experiment I and II Control Group Comparison

ANOVA comparison of the control group from experiment I and the control group of experiment II shows no difference in percent mortality between experiments after two days; therefore, untreated flasks demonstrate consistent control environments (p-value 0.235, 1 df, F-value 1.744) or three days (p-value 0.289, 1 df, F-value 1.355).

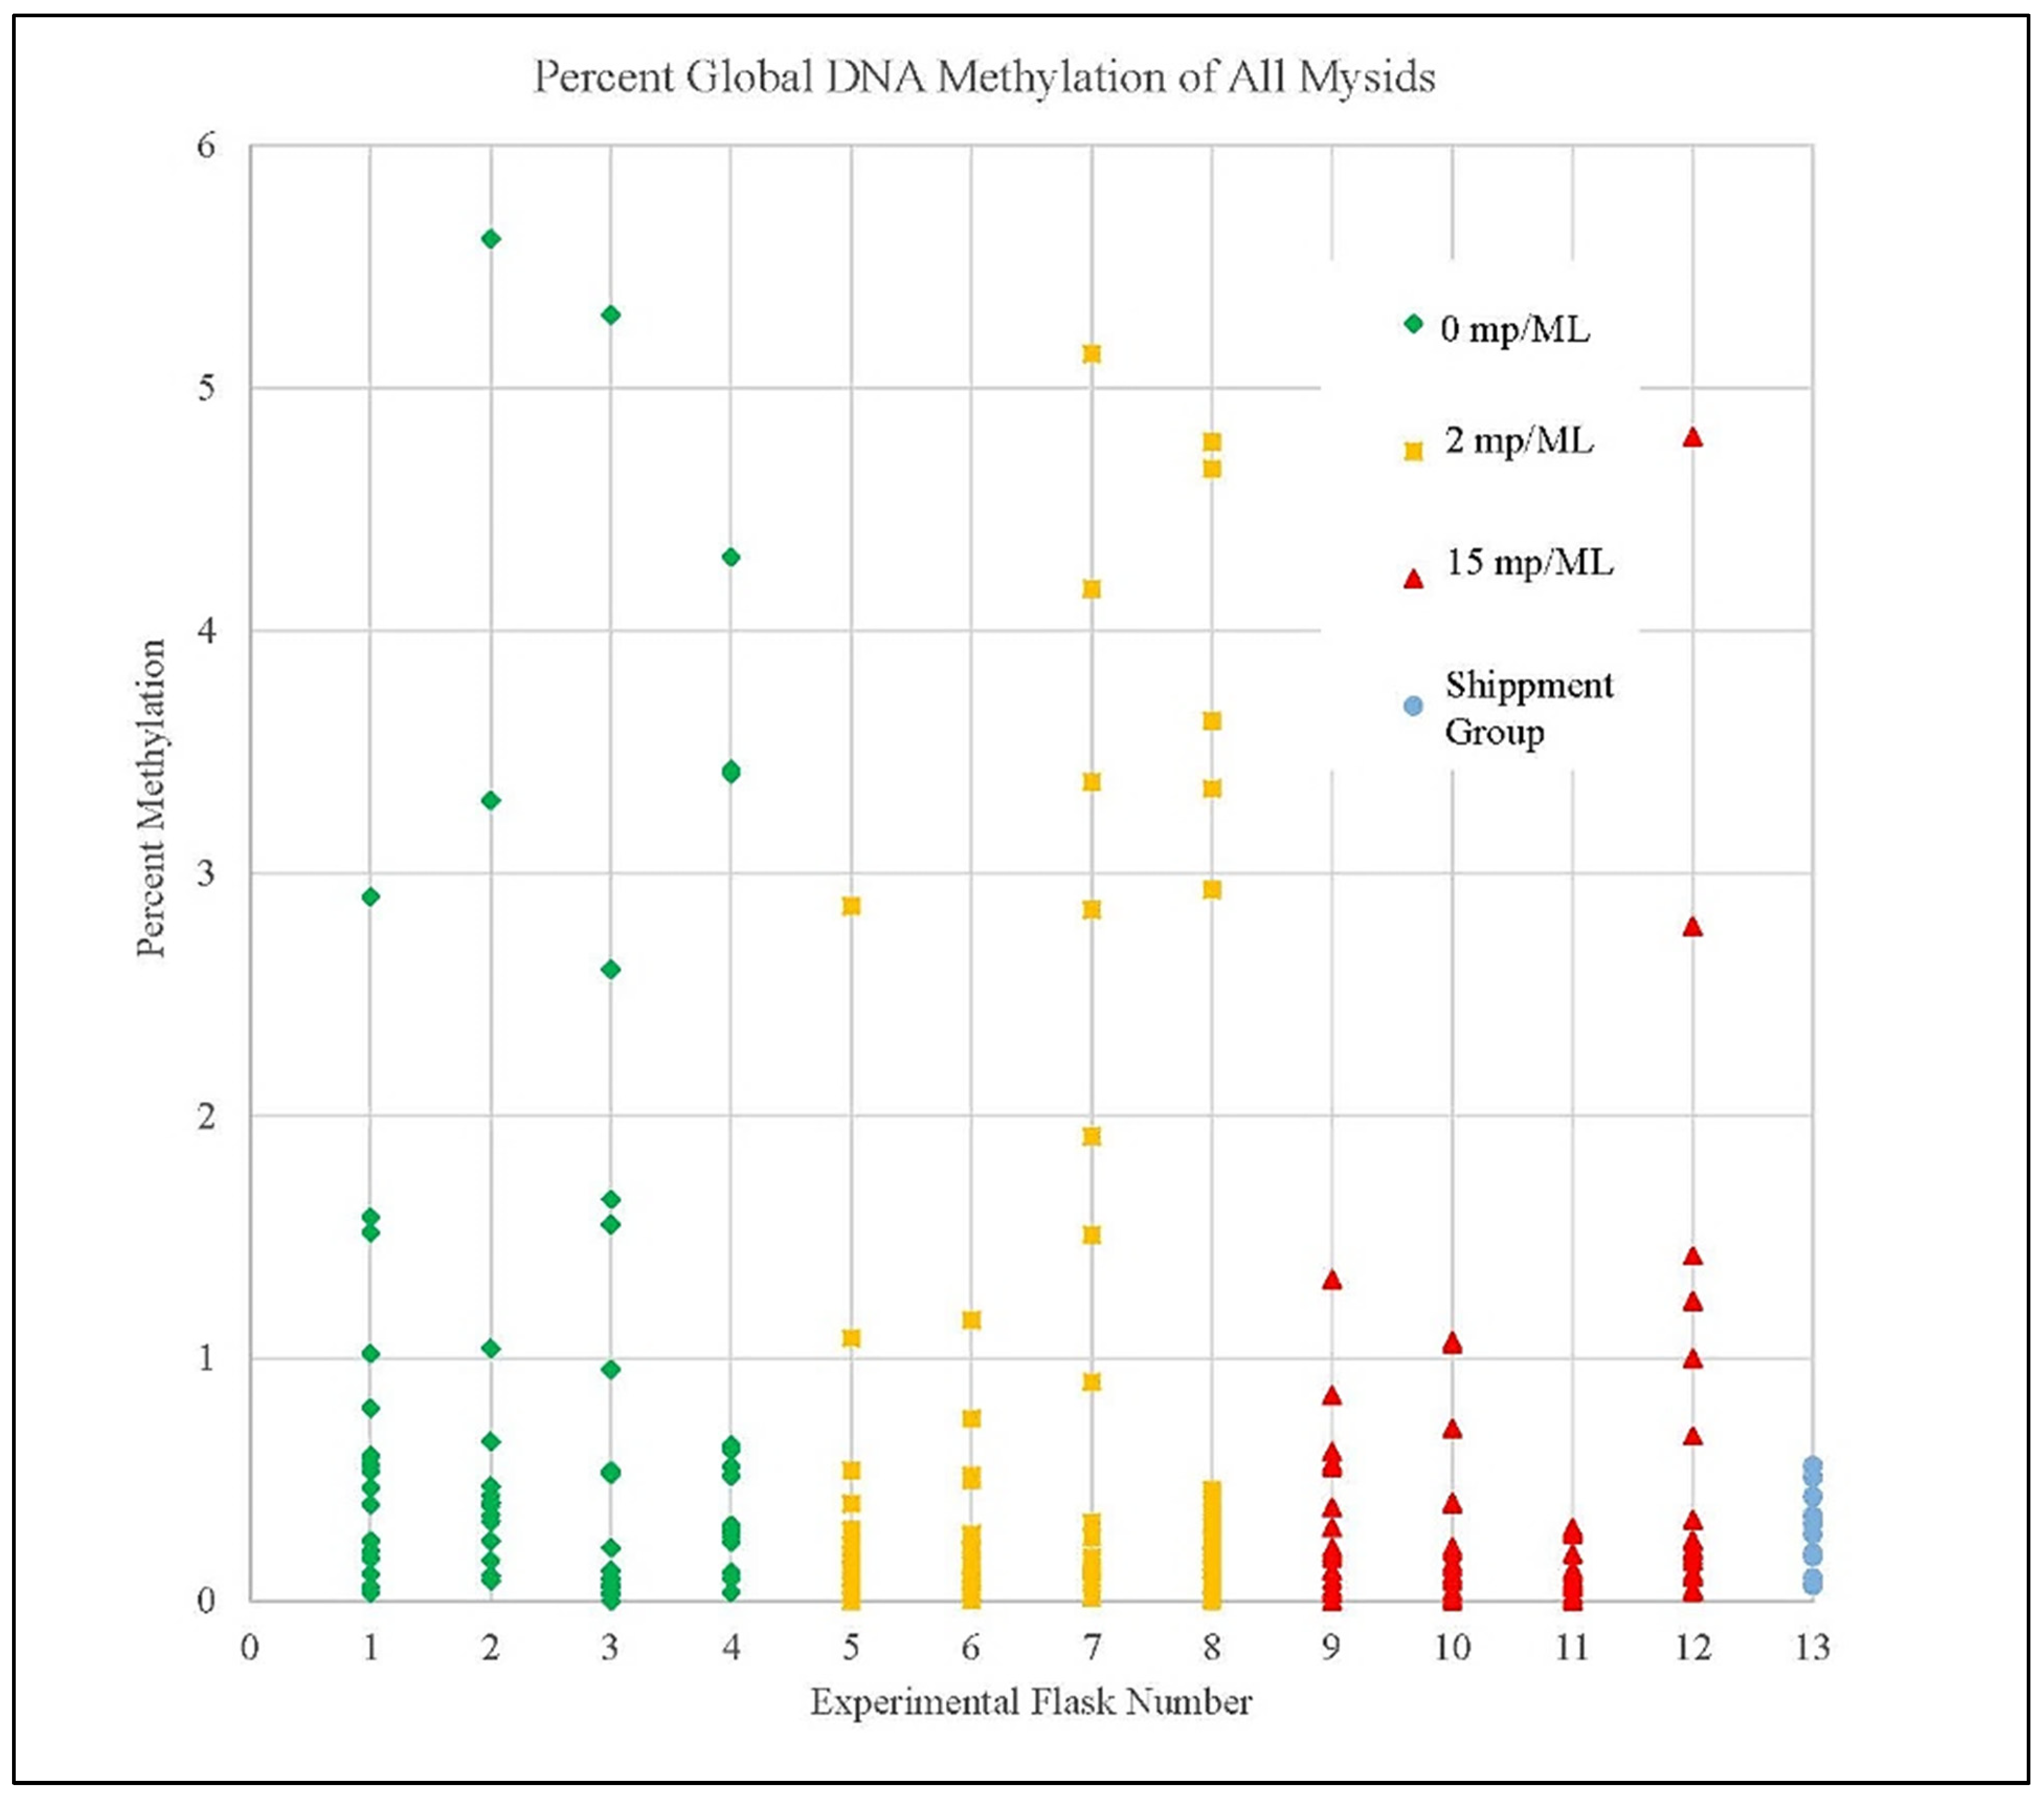
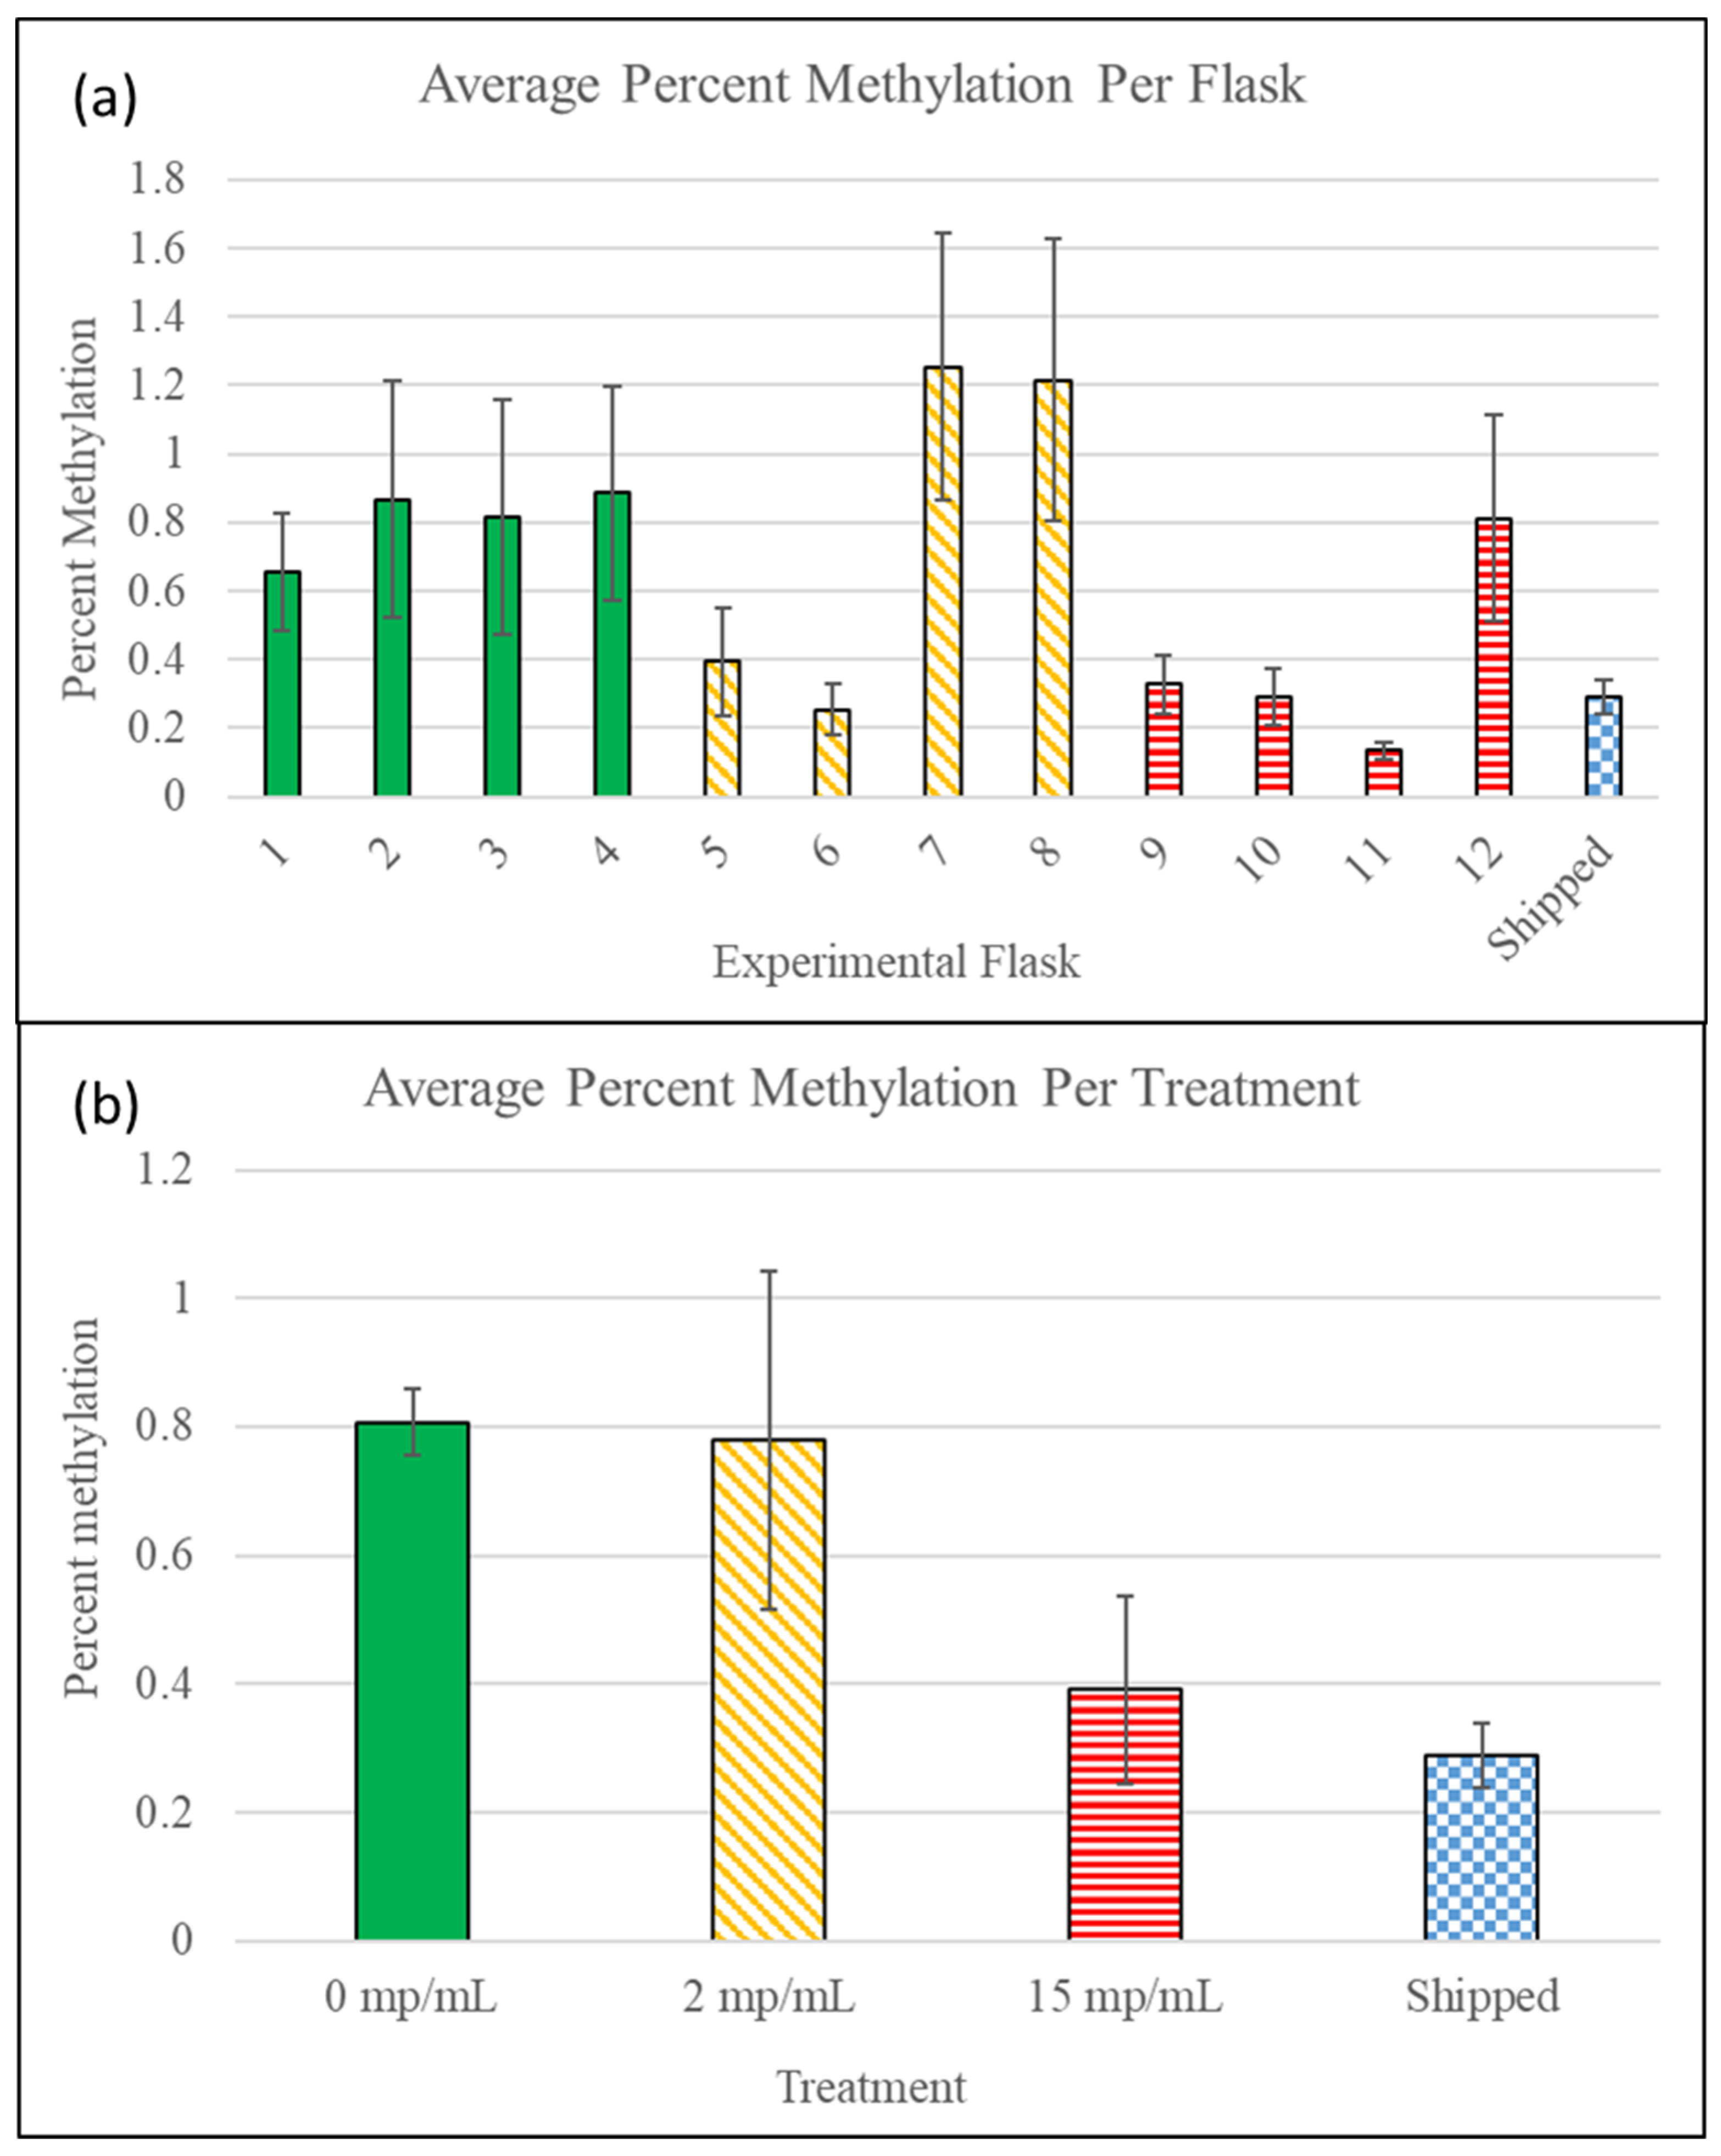
3.4. Methylation Detection Spectrophotometry of Experiment I Mysids

DNA methylation was detected for the first time in Americamysis bahia. Percent methylation between all individuals did not follow a normal distribution and did not express homogeneity of variance. Mysids showed a range of global methylation from 0% to a maximum value of approximately 5.6% (Figure 2). There were a number of mysids with no detectable methylation observed in eleven of the twelve experimental flasks. The two individuals with the highest percent methylation were from the control group. All individuals from the shipment group showed detections of methylation.
The average percent methylation per experimental flask (Figure 3) did not follow a normal distribution and did not express homogeneity of variance. The lowest average percent methylation was observed in flask 11 of experiment I within the 15 mp/mL treatment group. The two highest average percent methylation values were found in the 2 mp/mL treatment group. The highest average percent methylation was observed in flask 7 of experiment I. The least amount of variation in methylation was shown between the non-dosed flasks. The mean of the average percent methylation values per flask was 0.81% (SE 0.052) for non-dosed flasks, 0.78% (SE 0.264) for flasks dosed with 2 mp/mL, 0.39% (SE 0.15) for flasks dosed with 15 mp/mL, and 0.29% (SE 0.05) for the shipped group. Kruskal–Wallis rank transformation of average percent per flask and non-parametric ANOVA comparison showed no significant difference between treatment groups (p-value 0.179, 2 df, F-value 2.168).
Individual global DNA methylation greater than 0.05% was considered a detection. The number of detections was divided by the number of individuals per flask to provide a frequency of methylation detections per flask (Table S3). The average frequency of detection was highest in the non-dosed flasks and lowest in the flasks dosed with high concentrations of plastics; however, there was no difference in the frequency of detections between treatment groups for either detection (p-value 0.117, 2 df, F-value 2.754).

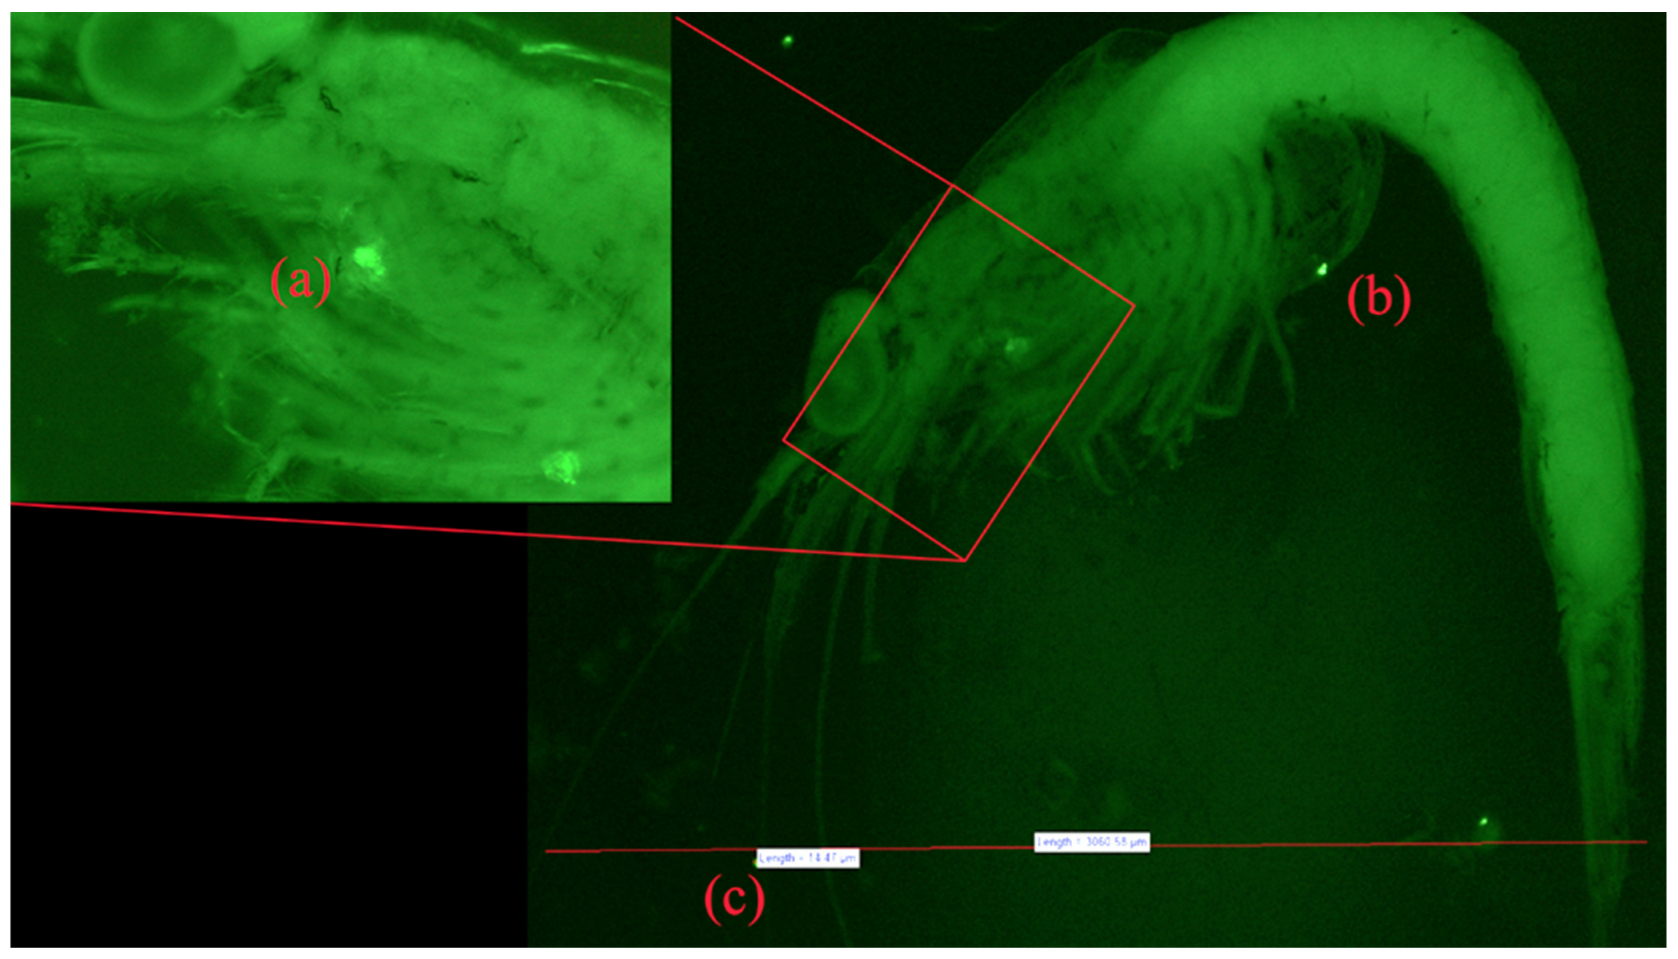
3.5. Fluorescent Microscopy

Physical and potentially harmful interactions between microplastics and mysids were evident via fluorescent imaging. At least one deceased adult mysid was imaged from each experimental flask—except for control flask 1, which exhibited 100% survivorship. Figure 4 displays an example of these images. The supplementary information includes further photographs of individual mysids, including representations of adult mysids from control flasks (Figure S15), adult individuals from flasks treated with microplastics (Figure S16), and juveniles from flasks treated with microplastics (Figure S17). Some mysid individuals were partly fragmented upon collection or slightly degraded by the time of imaging.
No microplastics were seen on images of adult mysids from any control flask. Microplastics were found interacting with mysids from both the low-concentration and high-concentration microplastic treatment flasks. No microplastic particles were identified besides the fluorescent Spherotech® microbeads. Microplastic particles were found on adult mysids in many, but not all, experiment I dosage flasks. Microplastics were found on at least one juvenile from each experiment I dosage flasks. The highest number of interactions (15) was observed on an adult mysid in the high-concentration group. The highest number of microplastic interactions (9) with any juvenile was also found in the 15 mp/mL treatment group. Supplementary Tables S4–S6 show a summary of the microplastic interactions for adults, juveniles, and all mysids combined. The average number of microplastic interactions per treatment increased with microplastic concentration for both adults and juveniles. A randomized ANOVA was used to compare the average number of microplastic interactions per experimental flask between the groups treated at low concentrations and high concentrations of microbeads. No significant difference was found between the average number of microplastic interactions for adult mysids (p-value 0.304, 1 df, F-value 1.264; Figure S18). A significant difference was found between the average number of microplastic interactions for juvenile mysids (p-value 0.012, 1 df, F-value 12.437; Figure S19). A significant difference was found for the average number of interactions of adults and juveniles combined (p-value 0.010, 1 df, F-value 14.049; Figure S20). Figure S21 includes a breakdown of interactions across mysid anatomy, and Figures S22 and S23 include examples of imaged mysids. No microplastics were identified among detritus or unhatched brine shrimp cysts sampled from control flasks (Figure S24).

4. Discussion

In this study, mysids appeared to be sensitive to microplastics, based on increased mortality rates with long-term exposure (>72 h), despite small sample sizes. Although not significant, a trend in increased mortality of A. bahia with increased concentrations of microplastics was evident from the mean mortality exhibited per treatment. The lack of statistical differences found throughout the study is most likely the result of the small sample sizes. In most cases, variance in mortality between flasks was greater among groups treated with microplastics versus control groups, possibly due to variability between microplastic interactions per individual. Interactions were not assessed to such a resolution in this study, and in a future study, constant monitoring via video would be beneficial for tracking interactions and assessing changes in mysid behavior. It is possible that microplastics were rinsed or detached when dead mysids were removed from experiment containers, thus possibly reducing the number of interactions.
Increases in microplastic-related mortality over longer exposure durations have been exhibited in previous studies. Tigriopus japonicus experienced increased mortality after microplastic exposure for 96 h [7], and other Copepods exhibited increased mortality after four days of microplastic exposure [8]. Five µm microplastics had a similar short-term effect on mortality in both A. bahia and Neomysis japonica; however, there were examples of higher mortality in A. bahia. Wang [6] also reported no difference in mortality between mysid control groups and mysids treated with up to 50 mp/mL for 72 h. At concentrations greater than 50 mp/mL, Wang [6] reported an average of 30% mortality in N. japonica. Similarly, in this study, two flasks from experiment I in the 15 mp/mL groups had 28% mortality (7 deaths out of 25 total mysids). Flask 1 from experiment II showed 40% mortality (10 deaths out of 25 total mysids) by the end of 72 h. Microplastic concentrations in this study were still much lower than the 50 mp/mL used by Wang [6]. Neomysis japonica is slightly larger in size than A. bahia, which might cause microplastic interactions with N. japonica to be less stressful or less lethal. The higher mortality rate of A. bahia than N. japonica at lower concentrations of microplastics suggests that A. bahia could be more sensitive to microplastic pollution in aquatic systems than N. japonica. Therefore, A. bahia may be a good indicator species for assessing levels of microplastic pollution. Since A. bahia is naturally found across a great expanse of habitats from the east coasts of North America to the east coasts of South America, local populations could be an indicator of levels of microplastic pollution. Barring other factors, areas with large concentrations of microplastics may be more likely to have lower relative abundances of A. bahia. The non-weathered and small spherical nature of the experimental microbeads likely allows for relatively easy transport through the digestive tract. If similar microplastic ingestion and particle interaction rates are assumed in natural ecosystems, where microfibers and jagged fragments are also present [37], it is likely that there would be higher mortality rates on A. bahia than those reported in this study.
The number of microplastic interactions for all mysids of experiment I increased with concentrations of particles; however, there was no significant difference in mortality. Flask 1 of the non-dosed group showed 100% survival of mysids, and no observations of cannibalism were made over the course of the experiments in any flask, suggesting that competition for food and mysid density were likely not influential factors on mortality or stress [32,38]. A lack of significant differences in mortality may also be attributed to the size of the microbeads. For instance, 5 µm experimental microspheres could be small enough that they do not immediately cause internal clogging, do not become completely embedded in tissues, or can easily rinse off mysid anatomical structures. Additionally, certain sizes and textures of microplastics may be easily handled by the digestive tracts of some crustaceans due to their ability to handle naturally indigestible materials such as small rocks or sand grains [39]. In one example, after short-term exposure to 10 µm microbeads, the copepod Tigriopus japonicum exhibited no significant change in mortality [40]. Another study showed beads less than 50 µm in diameter (even at concentrations of 50 mp/mL) were not acutely toxic to Daggerblade Grass Shrimp (Palaemonetes pugio), but larger beads, fragments, and fibers did cause higher rates of mortality [41]. Mortality and stress responses are likely species-specific and plastic-specific, but the mysids may be more sensitive to microplastic pollution than Daggerblade Grass Shrimp due to the larger size of the latter. The fraction of surface area that is affected in the grass shrimp would simply be less per particle, and thus, it would take a greater number of microparticles to clog the larger internal cavities or mouth parts of the grass shrimp than those of a mysid.
Based on the microscope snapshots of mysids sampled at the end of experiments, microplastics expectedly interacted with mysids more in flasks with higher particle concentrations. The observation of microplastics sticking to eyes, antennae, legs, and body plates on the mysids was less expected and worth further consideration. Additional research is needed to conclude which mysid anatomy–plastic interactions result in the most stress for the organisms and to better understand sub-lethal effects on growth and fecundity. For example, it is likely that a piece of plastic stuck to a body plate on the dorsal side of a mysid is less stressful than a particle stuck to an eye or ingested. Observations of microplastics stuck on all parts of the mysid anatomy are circumstantial evidence that zooplankton do not only bioaccumulate plastic particles by consuming them but that microplastics can easily aggregate on the outside of their bodies as well. These microplastic interactions can lead to decreased motility and mechanoreception in zooplankton [42]. Decreased motility of zooplankton could cause easier predation by higher organisms, such as larger zooplankton, fish, waterfowl, aquatic mammals, etc., therefore driving microplastic bioaccumulation up the food chain. Further, if plastics adhere to dead planktonic organisms as they sink, these organisms may be vectors that distribute the particles to depths and benthic habitats.
The hypothesis that mysids have reduced amounts of global methylation in comparison to plants and mammals is generally supported by the average percent methylation exhibited in this study. Mysids showed similar DNA methylation percentages compared to other crustaceans. Control groups showed an average of approximately 0.8% global DNA methylation, which is comparable to an approximate mean global DNA methylation of 0.75% for Chinese Mitten Crab and Eriocheir sinensis [43]. Mysids may have higher levels of global methylation than Daphnia magna, which varies between 0.22 and 0.35% under natural conditions [44]. The base level of methylation found in all mysid groups may be representative of the methylation associated with housekeeping genes, as methylation of these genes is conserved in many groups of invertebrates [23]. However, across treatments, a small number of mysids exhibited methylation greater than 2%, which overlaps the range of methylation for most mammals [45]. These elevated methylation percentages could be evidence that DNA methylation plays a greater role in A. bahia and in other invertebrates than previously suggested in the literature [20,46]. Global methylation of about 5.6%, which was calculated in two mysids, is higher than methylation exhibited in most taxa [20,46]. Use of the MethylFlash™ assay in another study showed that amplified mitochondrial DNA of developing crab testes exhibited approximately 7% cytosine methylation, with a range of 0–2% global cytosine methylation [43].
No significant difference was shown between methylation levels of any treatment group; however, the groups of mysids treated at 15 mp/mL had lower average percent methylation than mysids treated at 2 mp/mL and non-dosed mysids, which may be indicative of a role for DNA methylation as a stress response. The lack of statistical difference could also be due to small sample sizes, especially for the number of individuals preserved from the initial shipment. The lowest amount of intra-treatment variability occurred in the groups that were not dosed with plastics, suggesting that the introduction of the particles could cause instability in the system of DNA methylation for the mysids. Although the mechanisms for balancing methylation and demethylation in an organism are not well characterized, if stressful environments persist, the stability of the epigenetic systems may be compromised. Overproduction of demethylase enzymes may start to affect the regulation of housekeeping genes, leading to stress and potentially increased mortality [47]. DNA methylation has also been shown to down-regulate apoptosis, so decreased methylation could potentially induce cell death and organ failure and ultimately be linked to death [48]. Certain proteins and genes are affected by microplastic exposure in zebrafish and other organisms [49]. For these organisms with known responses to microplastics, it could be considered if changes in DNA methylation are occurring simultaneously in a linked or related fashion. Further investigations into other acute stress responses, with larger sample sizes, are necessary to understand the links between microplastic exposure and DNA methylation. Methods that provide greater resolution for methylation quantification, such as bisulfite sequencing, are more expensive but would likely result in less variability than global DNA quantification with ELISA-like assays. If different DNA methylation levels are indications of plastic-caused stress, we might be able to witness effects from natural populations by sampling areas that are heavily polluted and comparing them to areas that are minimally polluted. It would also be beneficial to know if these are heritable epigenetic responses that could carry on to progeny even if they are no longer exposed to the same levels of pollution. If so, it could create lasting effects on fitness even if we are able to reduce the amount of plastic waste in the environment.

5. Conclusions

Mysid–microplastic interactions increased as the plastic concentration increased. Mortality rates suggest effects due to long-term exposure (>72 h), although an increased sample size is necessary to validate the trend of increased mortality with increased concentrations. The bioaccumulation of microplastics was shown to be possible on mysids both internally by ingestion and externally when particles adhered to anatomical structures or were embedded within them. Differential methylation was not detected between treatments, but the study does provide the foundation for future work with methylation in mysids. This study provides a novel detection of global DNA methylation in mysids, and the percentage of methylation was higher than expected. Mysids may be valuable for studying the relationship between methylation levels and environmental contaminants or stressors. With greater methylation sequencing resolution, plastic interactions could be linked to specific effects on genes or anatomy. Further investigation using larger sample sizes and methylation-sensitive sequencing techniques (e.g., bisulfite sequencing) is needed to understand how microplastic-induced stress in mysids could be linked to microplastic-induced stress in other organisms and if microplastic exposure can lead to heritable changes in epigenetics that have extending effects via the food chain.

Supplementary Materials

The following supporting information can be downloaded at https://www.mdpi.com/article/10.3390/microplastics3020014/s1. Figure S1: Experiment I mysid flasks. Figure S2: Experiment I design. Figure S3: Experiment II mysid flasks. Figure S4: Experiment II design. Figure S5: Example of MethylFlashTM microplate and PerkinElmer © readout. Figure S6: Methylation standard curves. Figure S7: Percent methylation of individuals repeated on separate microplates. Figure S8: Experiment I Mysid Mortality Day 2. Figure S9: Experiment I Mysid Mortality Day 3. Figure S10: Experiment I Total Mortality. Figure S11: Experiment II Mortality Dose 1. Figure S12: Experiment II Mortality Dose 2. Figure S13: Experiment II Mortality Dose 3. Figure S14: Experiment II Total Mortality. Figure S15: Example microscope images of control group adult. Figure 16: Example microscope images of dosed group adult mysids. Figure S17: Example microscope images of dosed group juvenile mysids. Figure S18: Experiment I microplastic interactions with adult mysids. Figure S19: Experiment I microplastic interactions with juvenile mysids. Figure S20: Experiment I microplastic interactions with all mysids. Figure S21: Locations of Plastic Interactions on 103 Mysids. Figure S22: Examples of microbead interactions on a juvenile from flask 10 of experiment I. Figure S23: Examples of microbead interactions on a mysid from experiment I. Figure S24: Images of microplastics among particulate matter. Table S1: Mortality Results – Experiment I. Table S2: Mortality Results – Experiment II. Table S4: Frequency of Methylation Detections. Table S4: Number of Microplastic Interactions with Adult Mysids. Table S5: Number of Microplastic Interactions with Juvenile Mysids. Table S6: Number of Microplastic Interactions with All Mysids.

Author Contributions

Conceptualization, J.H.P. and A.M.J.; methodology, J.H.P., A.M.J. and J.M.W.; software, J.H.P.; validation, J.H.P. and A.M.J.; formal analysis, J.H.P., A.M.J. and J.M.W.; investigation, J.H.P.; resources, A.M.J.; data curation, J.H.P. and A.M.J.; writing—original draft preparation, J.H.P. and A.M.J.; writing—review and editing, J.H.P., A.M.J. and J.M.W.; visualization, J.H.P.; supervision, A.M.J.; project administration, A.M.J.; funding acquisition, J.H.P. and A.M.J. The first author, J.H.P., hereby claims that he performed literature reviews, carried out the methods of this experiment, analyzed the results, and drew conclusions based on previous research and empirical data. All authors have read and agreed to the published version of the manuscript.

Funding

This research was funded by the University of West Florida Hal Marcus College of Science and Engineering Graduate Grant, University of West Florida Biology Department.

Institutional Review Board Statement

All research was conducted in accordance with the University of West Florida code of ethics.

Informed Consent Statement

Not applicable.

Data Availability Statement

Any raw data or access to materials used in this research are available for review.

Acknowledgments

Thank you to thesis committee members. Thank you to Janosik lab cohorts for assisting in the experimental setup and support. Thank you to the University of West Florida Biology Department for providing equipment and facilities.

Conflicts of Interest

The authors declare no conflicts of interest. The funders had no role in the design of the study; in the collection, analyses, or interpretation of data; in the writing of the manuscript; or in the decision to publish the results.

References

  1. Ory, N.C.; Sobral, P.; Ferreira, J.L.; Thiel, M. Short Communication: Amberstripe scad Decapterus muroadsi (Carangidae) fish ingest blue microplastics resembling their copepod prey along the coast of Rapu Nui (Easter Island) in the South Pacific subtropical gyre. Sci. Total Environ. 2017, 586, 430–437. [Google Scholar] [CrossRef]
  2. Dawson, A.L.; Kawaguhi, S.; King, C.K.; Townsend, K.A.; King, R.; Huston, W.M.; Bengston Nash, S.M. Turning microplastics into nanoplastics through digestive fragmentation by Antarctic krill. Nat. Commun. 2015, 9, 1001. [Google Scholar] [CrossRef] [PubMed]
  3. Cole, M.; Lindeque, P.K.; Filemann, E.; Halsband, C.; Goodhead, R.; Moger, J.; Galloway, T.S. Microplastic ingestion by zooplankton. Environ. Sci. Technol. 2013, 47, 6646–6655. [Google Scholar] [CrossRef] [PubMed]
  4. Panti, C.; Giannetti, M.; Baini, M.; Rubegni, F.; Minutoli, R.; Fossi, M.C. Occurrence, relative abundance and spatial distribution of microplastics and zooplankton NW of Sardinia in the Pelagos Sanctuary Protected Area, Mediterranean Sea. Environ. Chem. 2015, 12, 618–626. [Google Scholar] [CrossRef]
  5. Sun, X.; Li, Q.; Zhu, M.; Liang, J.; Zheng, S.; Zhao, Y. Ingestion of microplastics by natural zooplankton groups in the northern South China Sea. Mar. Pollut. Bull. 2017, 115, 217–224. [Google Scholar] [CrossRef]
  6. Wang, M.; Wang, X.; Luo, X.; Zheng, H. Short-term toxicity of polystyrene microplastics on mysid shrimps Neomysis japonica. IOP Conf. Ser. Earth. Environ. Sci. 2017, 61, 012136. [Google Scholar] [CrossRef]
  7. Lee, K.; Shim, W.J.; Kwon, O.Y.; Kang, J. Size-dependent effects of micro polystyrene particles in the marine copepod Tigriopus japonicas. Environ. Sci. Technol. 2013, 47, 11278–11283. [Google Scholar] [CrossRef] [PubMed]
  8. Cole, M.; Lindeque, P.K.; Fileman, E.; Halsband, C.; Galloway, T.S. The impact of polystyrene microplastics on feeding, function and fecundity in the marine copepod Calamus helgolandicus. Environ. Sci. Technol. 2015, 49, 1130–1137. [Google Scholar] [CrossRef] [PubMed]
  9. Rist, S.; Baun, A.; Hartmann, N.B. Ingestion of micro- and nanoplastics in Daphnia magna—Quantification of body burdens and assessment of feeding rates and reproduction. Environ. Pollut. 2017, 228, 398–407. [Google Scholar] [CrossRef]
  10. Brun, N.R.; Beenakker, M.M.T.; Hunting, E.R.; Ebert, D.; Vijver, M.G. Brood pouch-mediated polystyrene nanoparticle uptake during Daphnia magna embryogenesis. Nanotoxicology 2017, 11, 1059–1069. [Google Scholar] [CrossRef]
  11. Chen, Q.; Gundlach, M.; Yang, S.; Jiang, J.; Velki, M.; Yin, D.; Hollert, H. Quantitative investigation of the mechanisms of microplastics and nanoplastics toward zebrafish larvae locomotor activity. Sci Total Environ. 2017, 584, 1022–1031. [Google Scholar] [CrossRef] [PubMed]
  12. Contino, M.; Ferruggia, G.; Pecoraro, R.; Scalisi, E.M.; Cavallaro, G.; Bonaccorso, C.; Fortuna, C.G.; Salvaggio, A.; Capparucci, F.; Bottari, T.; et al. Uptake routes and biodistribution of polystyrene nanoplastics on zebrafish larvae and toxic effects on development. Fishes 2023, 8, 168. [Google Scholar] [CrossRef]
  13. Mattsson, K.; Johnson, E.V.; Malmendal, A.; Linse, S.; Hansson, L.; Cedervall, T. Brain damage and behavioural disorders in fish induced by plastic nanoparticles delivered through the food chain. Sci. Rep. 2017, 7, 11452. [Google Scholar] [CrossRef] [PubMed]
  14. Vandegehuchte, M.B.; Janssen, C.R. Epigenetics in an ecotoxicological context. Mutat. Res. Genet. Toxicol. Environ. Mutagen. 2014, 764–765, 36–45. [Google Scholar] [CrossRef]
  15. Gombeau, K.; Pereira, S.; Ravanat, J.; Camilleri, V.; Cavalie, I.; Bourdineaud, J.; Adam- Guillermin, C. Depleted uranium induces sex- and tissue-specific methylation patterns in adult zebrafish. J. Environ. Radioact. 2016, 154, 25–33. [Google Scholar] [CrossRef]
  16. Geng, Y.; Gao, L.; Yang, J. Epigenetic Flexibility Underlying Phenotypic Plasticity. In Progress in Botany; Lüttge, U., Beyschlag, W., Francis, D., Cushman, J., Eds.; Springer: Berlin/Heidelberg, Germany, 2013; Volume 74, pp. 153–163. [Google Scholar]
  17. Huang, X.; Li, S.; Ni, P.; Gao, Y.; Jiang, B.; Zhou, Z.; Zhan, A. Rapid response to changing environments during biological invasions: DNA methylation perspectives. Mol. Ecol. 2017, 26, 6621–6633. [Google Scholar] [CrossRef] [PubMed]
  18. Elmhiri, G.; Gloaguen, C.; Grison, S.; Kereselidze, D.; Elie, C.; Tack, K.; Benderitter, M.; Lestaevel, P.; Legendre, A.; Souidi, M. DNA methylation and potential multigenerational epigenetic effects linked to uranium chronic low-dose exposure in gonads of males and female rats. Toxicol. Lett. 2018, 282, 64–70. [Google Scholar] [CrossRef]
  19. Chen, H.; Hua, X.; Li, H.; Wang, C.; Dang, Y.; Ding, P.; Yu, Y. Transgenerational neurotoxicity of polystyrene microplastics induced by oxidative stress in Caenorhabditis elegans. Chemosphere 2021, 272, 129642. [Google Scholar] [CrossRef]
  20. Regev, A.; Lamb, M.J.; Jablonka, E. The role of DNA methylation in invertebrates: Developmental regulation or genome defense? Mol. Biol. Evol. 1998, 15, 880–891. [Google Scholar] [CrossRef]
  21. Barzotti, R.; Pelliccia, F.; Rocchi, A. DNA methylation, histone H3 methylation, and histone H4 acetylation in the genome of a crustacean. Genome 2006, 49, 87–90. [Google Scholar] [CrossRef]
  22. Norouzitallab, P.; Baruah, K.; Vandegehuchte, M.; Van Stappen, G.; Catania, F.; Vanden Bussche, J.; Vanhaecke, L.; Sorgeloos, P.; Bossier, P. Environmental heat stress induces epigenetic transgenerational inheritance of robustness in parthenogenetic Artemia model. FASEB J. 2014, 28, 3552–3563. [Google Scholar] [CrossRef] [PubMed]
  23. Sarda, S.; Zeng, J.; Hunt, B.G.; Yi, S.V. The evolution of invertebrate gene body methylation. Mol. Biol. Evol. 2012, 29, 1907–1916. [Google Scholar] [CrossRef]
  24. Wortham-Neal, J.; Price, W.W. Marsupial developmental stages in Americamysis bahia (Mysida: Mysidae). J. Crust. Biol. 2002, 22, 98–112. [Google Scholar] [CrossRef]
  25. Meland, K.; Mees, J.; Porter, M.; Wittmann, K.J. Taxonomic review of the orders Mysida and Stygiomysida (Crustacea, Peracarida). PLoS ONE 2015, 10, e0124656. [Google Scholar] [CrossRef]
  26. Di Mauro, R.; Kupchik, M.J.; Benfield, M.C. Abundant plankton-sized microplastic particles in shelf waters of the northern Gulf of Mexico. Environ. Pollut. 2017, 230, 798–809. [Google Scholar] [CrossRef] [PubMed]
  27. Cole, M.; Lindeque, P.K.; Filemann, E.; Clark, J.; Lewis, C.; Halsband, C.; Galloway, T.S. Microplastics alter the properties and sinking rates of zooplankton faecal pellets. Environ. Sci. Technol. 2016, 50, 3239–3246. [Google Scholar] [CrossRef]
  28. Desforges, J.P.W.; Galbraith, M.; Ross, P.S. Ingestion of microplastics by zooplankton in the northeast Pacific Ocean. Arch. Environ. Contam. Toxicol. 2015, 69, 320–330. [Google Scholar] [CrossRef] [PubMed]
  29. Im, J.; Eom, H.J.; Choi, J. Effect of Early-Life Exposure of Polystyrene Microplastics on Behavior and DNA Methylation in Later Life Stage of Zebrafish. Arch. Environ. Contam. Toxicol. 2022, 82, 558–568. [Google Scholar] [CrossRef]
  30. Park, K.; Kim, W.S.; Park, J.W.; Kim, T.H.; Kwak, I.S. Bioaccumulation, microbiome composition and immunity, and epigenetic signatures associated with exposure to spherical, fibrous, and fragmented microplastics in the mussel Mytilus galloprovincialis. J. Hazard. Mater. 2024, 462, 132691. [Google Scholar] [CrossRef]
  31. López de las Hazas, M.C.; Boughanem, H.; Dávalos, A. Untoward Effects of Micro- and Nanoplastics: An Expert Review of Their Biological Impact and Epigenetic Effects. Adv. Nutr. 2022, 13, 1310–1323. [Google Scholar] [CrossRef]
  32. Lussier, S.M.; Kuhn, A.; Chammas, M.J.; Sewall, J. Techniques for the laboratory culture of mysidopsis species (crustacea: Mysidacea). Environ. Toxicol. Chem. 1988, 7, 969–977. [Google Scholar] [CrossRef]
  33. Karami, A.; Golieskardi, A.; Choo, C.K.; Larat, V.; Galloway, T.S.; Salamatinia, B. The presence of microplastics in commercial salts from different countries. Sci. Rep. 2017, 7, 46173. [Google Scholar] [CrossRef] [PubMed]
  34. Vroom, R.J.E.; Koelmans, A.A.; Besseling, E.; Halsband, C. Aging of microplastics promotes their ingestion by marine zooplankton. Eviron. Pollut. 2017, 231, 987–996. [Google Scholar] [CrossRef] [PubMed]
  35. Epigentek © 2024. MethylFlash™ Methylated DNA Quantification Kit (Colorimetric) User Guide. Farmingdale, NY. P-1034, 1–11. Available online: https://www.epigentek.com/docs/P-1034.pdf (accessed on 1 February 2024).
  36. Eberlain, G.A. Quantitation of proteins using HPLC-detector response rather than standard curve comparison. J. Pharm. Biomed. 2003, 13, 1263–1271. [Google Scholar] [CrossRef] [PubMed]
  37. Taylor, M.L.; Gwinnett, C.; Robinson, L.F.; Woodall, L.C. Plastic microfibre ingestion by deep-sea organisms. Sci. Rep. 2016, 6, 33997. [Google Scholar] [CrossRef] [PubMed]
  38. Grear, J.S.; Horowitz, D.B.; Gutjahr-Gobell, R. Mysid population responses to resource limitation differ from those predicted by cohort studies. Mar. Ecol. Prog. Ser. 2011, 432, 115–123. [Google Scholar] [CrossRef]
  39. Martins, A.; Guilhermino, L. Transgenerational effects and recovery of microplastics exposure in model populations of the freshwater cladoceran Daphnia magna Straus. Sci. Total Environ. 2018, 631–632, 421–428. [Google Scholar] [CrossRef] [PubMed]
  40. Choi, J.S.; Hong, S.H.; Park, J. Evaluation of microplastic toxicity in accordance with different sizes and exposure times in the marine copepod Tigriopus japonicus. Mar. Environ. Res. 2020, 153, 104838. [Google Scholar] [CrossRef] [PubMed]
  41. Gray, A.D.; Weinstein, J.E. Size- and shape-dependent effects of microplastic particles on adult daggerblade grass shrimp (Palaemonetes pugio). Environ. Toxicol. Chem. 2017, 36, 3074–3080. [Google Scholar] [CrossRef]
  42. Botterell, Z.L.R.; Beaumont, N.; Dorrington, T.; Steinke, M.; Thompson, R.C.; Lindeque, P.K. Bioavailability and effects of microplastics on marine zooplankton: A review. Environ. Pollut. 2019, 245, 98–110. [Google Scholar] [CrossRef]
  43. Li, G.; Xu, Y.; Huang, X.; Xiao, J.; Nong, S.; Li, C. MeDIP-seq reveals the features of mitochondrial genomic methylation in immature testis of the Chinese mitten crab Eriocheir sinensis. Mitochondrial DNA A Mapp. Seq. Anal. 2018, 29, 969–977. [Google Scholar] [CrossRef] [PubMed]
  44. Vandegehuchte, M.B.; Lemière, F.; Janssen, C.R. Quantitative DNA-methylation in Daphnia magna and effects of multigeneration Zn exposure. Comp. Biochem. Phys. C 2009, 150, 343–348. [Google Scholar] [CrossRef] [PubMed]
  45. Jin, L.; Jiang, Z.; Xia, Y.; Lou, P.; Chen, L.; Wang, H.; Bai, L.; Xie, Y.; Liu, Y.; Li, W.; et al. Genome-wide DNA methylation changes in skeletal muscle between young and middle-aged pigs. BMC Genom. 2014, 15, 653. [Google Scholar] [CrossRef] [PubMed]
  46. Head, J.A. Patterns of DNA methylation in animals: An exotoxicological perspective. Integr. Comp. Biol. 2014, 54, 77–86. [Google Scholar] [CrossRef] [PubMed]
  47. Williams, B.P.; Pignatta, D.; Henikoff, S.; Gehring, M. Methylation-sensitive expression of a DNA demethylase gene serves as an epigenetic rheostat. PLoS Genet. 2015, 11, e1005142. [Google Scholar] [CrossRef] [PubMed]
  48. Gopisetty, G.; Ramachandran, K.; Singal, R. DNA methylation and apoptosis. Mol. Immunol. 2006, 43, 1729–1740. [Google Scholar] [CrossRef]
  49. Limonta, G.; Mancia, A.; Abelli, L.; Fossi, M.C.; Caliani, I.; Panti, C. Effects of microplastics on head kidney gene expression and enzymatic biomarkers in adult zebrafish. Comp. Biochem. Physiol. C. 2021, 245, 109037. [Google Scholar] [CrossRef]
Figure 1. Mean mysid mortality. X-axis represents microplastic concentration; Y-axis represents % dead. Experiment I daily and total mean mysid mortality per treatment +/− standard error (left column); ANOVA results for day two percent mortality of experiment I (a) show no significant difference between mysids treated at 0, 2, or 15 microplastics per milliliter (mp/mL); p-value 0.322, 2 df, F-value 1.289; ANOVA results for day three mortality of experiment I (b) show no significant difference between groups; p-value 0.952, 2 df, F-value 0.049; ANOVA results for total mortality of experiment I (c) show no significant difference groups; p-value 0.381, 2 df, F-value 1.076; experiment II mean mysid mortality per treatment +/− standard error (right column); Ranked ANOVA results for experiment II mortality during first dosage interval (d) show no significant difference between mysids treated with microplastics and mysids not treated with microplastics; p-value 0.143, 1 df, F-value 2.830; Ranked ANOVA results for experiment II mortality during second dosage interval (e) show significant differences between mysids treated with microplastics and mysids not treated with microplastics; p-value 0.005, 1 df, F-value 19.200; Ranked ANOVA results for experiment II mortality during third dosage interval (f) show no significant differences between mysids treated with microplastics and mysids not treated with microplastics; p-value 0.327, 1 df, F-value 1.180; Ranked ANOVA results for total experiment II mortality (g) reveal significant differences between mysids treated with microplastics and mysids not treated with microplastics; p-value 0.010, 1 df, F-value 13.636.
Microplastics 03 00014 g001
Figure 2. Percent global DNA methylation of experiment I mysids by individual; percent global DNA methylation of 210 Americamysis bahia individuals treated with microplastics at three concentration levels of 0 microplastics per mL (mp/mL), 2 mp/mL, or 15 mp/mL, and 12 individuals from the original shipment group (shipment group is presented as flask 13). (n1 = 18, n2 = 17, n3 = 17, n4 = 18, n5 = 18, n6 = 17, n7 = 18, n8 = 18, n9 = 17, n10 = 18, n11 = 17, n12 = 17, n13 = 12).
Microplastics 03 00014 g002
Figure 3. Average percent global DNA methylation of experiment I mysids. Average % global DNA methylation in Americamysis bahia individuals per flask +/− standard error between individuals (a) and the mean of the average % global DNA methylation per treatment +/− standard error between flasks (b). (n1 = 18, n2 = 17, n3 = 17, n4 = 18, n5 = 18, n6 = 17, n7 = 18, n8 = 18, n9 = 17, n10 = 18, n11 = 17, n12 = 17, nShipped = 12) Ranked ANOVA results show no significant difference between treatment groups (p-value 0.179, 2 df, F-value 2.168) for % methylation. Colors and designs of bars in (b) serve as a legend for (a) with experimental flasks 1–4 concentrations at 0 microplastics per mL (mp/ml), flasks 5–8 at 2 mp/mL, 9–12 at 15 mp/mL, and finally the shipped group.
Microplastics 03 00014 g003
Figure 4. Examples of microbead interactions on an adult mysid from experiment I. Microbeads are seen on (a) mouth parts, (b) the marsupium, and (c) toward the tip of the second antenna. Small print adjacent to (c) shows measurements of the microplastics on the antenna at 14.47 µm, suggesting a small clump of 3 or more microbeads). The red line at the base of the image measures about 3 mm from antennae tip to tail. (Nikon SMZ1270 microscope; Nikon DS-Fi3 camera, Melville, NY, USA).
Microplastics 03 00014 g004
Disclaimer/Publisher’s Note: The statements, opinions and data contained in all publications are solely those of the individual author(s) and contributor(s) and not of MDPI and/or the editor(s). MDPI and/or the editor(s) disclaim responsibility for any injury to people or property resulting from any ideas, methods, instructions or products referred to in the content.

