Article

Microplastic Migration from Food Packaging on Cheese

by
Klytaimnistra Katsara
1,2,
Zacharias Viskadourakis
2,
George Kenanakis
2 and
Vassilis M. Papadakis
2,3,4,*
1
Department of Agriculture, Hellenic Mediterranean University, Estavromenos, 71410 Heraklion, Greece
2
Institute of Electronic Structure and Laser, Foundation for Research and Technology, N. Plastira 100, 70013 Heraklion, Greece
3
Department of Industrial Design and Production Engineering, University of West Attica, 12244 Athens, Greece
4
Institute of Agri-Food and Life Sciences, Hellenic Mediterranean University Research Centre, 71410 Heraklion, Greece
*
Author to whom correspondence should be addressed.
Microplastics 2025, 4(2), 17; https://doi.org/10.3390/microplastics4020017
Submission received: 27 January 2025 / Revised: 4 April 2025 / Accepted: 5 April 2025 / Published: 7 April 2025

Abstract

:
Cretan Graviera cheese is one of Greece’s most prized cheeses and holds a Protected Designation of Origin (PDO) status. For years, food packaging migration has been a key concern in food and health sciences, with plastics like low-density polyethylene (LDPE) and polypropylene (PP) widely used for cheese preservation and convenient handling during transport and storage. This study focused on Cretan Graviera cheese, examining two different levels of maturity: 4 and 8 months. The cheese samples were analyzed using two complementary vibrational spectroscopic techniques, FTIR-ATR and Raman spectroscopy, to assess the migration of LDPE and PP from plastic packaging to the cheese’s surface. The experimental period was set at 21 days, corresponding to the degradation time of the selected cheese, which becomes apparent after three weeks under refrigerated conditions at 7 °C. The results indicate that, with Raman and FTIR-ATR spectroscopy, LDPE and PP migration can occur from the plastic packaging to the surface of Graviera samples with different maturities. Microbial growth was observed sooner in the 4-month-old samples and 8-month-old samples. The migration of food packaging materials was confirmed using both Raman and FTIR spectroscopy, highlighting that Cretan Graviera cheese should be stored in appropriate packaging under refrigerated conditions at 7 °C.

1. Introduction

For several years, the migration of substances from food packaging into food has been a significant concern in the fields of food and health sciences. Generally, migration refers to the movement of substances from an area of higher concentration (the packaging) to an area of lower concentration (the food). Substances that may migrate from plastics include monomers, catalysts, solvents, antioxidants, plasticizers, and dyes. This interaction between packaging and food can lead to altered odor flavors and harmful compounds, which could potentially result in regulatory issues [1].
Plastics such as polyethylene and polypropylene are commonly used in food packaging to aid in preservation and facilitate handling during transport and storage. For decades, polymer and plastic packaging has been closely associated with food preservation and transportation, ensuring its taste, nutritional value, and appearance, while extending its shelf life [2]. Additionally, considerable research has been devoted to developing innovative packaging technologies and solutions, such as smart, recyclable, user-friendly, and antibacterial packaging [3], many of which are polymer-based and commonly known as plastics [2,4,5,6,7]. As mentioned in previous works, numerous different types of plastic packaging are used in the food industry, with a special preference for low-density polyethylene (LDPE), polyvinyl chloride (PVC), polypropylene (PP), and polyethylene terephthalate (PET) [2,5,8,9]. In dairy products such as cheese, polyolefins [1], LDPE, and PP [10] are used as food packaging materials, mostly in conjunction with vacuum [11], due to their durability, strength, stability, and good barrier properties against moisture and oxygen [2,4,10]. Specifically, LDPE has excellent oil and moisture resistance and PP has adequate chemical resistance and poses a good water vapor barrier [1]. However, substances from the plastic packaging transfer to the surface area of the food that is in contact with the packaging, and these substances are referred to as microplastics (MPs) [5,9]; this is called “Contact Migration” [1].
MPs are synthetic polymers composed of plastic monomers and additives, typically ranging from 0.1 to 5000 μm in size. They exhibit a variety of shapes, including fragments, fibers, spheres, granules, pellets, flakes, and beads. MPs are classified by origin as either primary or secondary. Primary MPs are specifically manufactured in defined sizes for applications in textiles, pharmaceuticals, sandblasting, and personal care products, like exfoliants. Secondary MPs arise from the degradation of larger plastics and are more common in the environment. Nanoscale particles, known as nanoplastics (NPs), are defined by dimensions in the 0.001 to 0.1 μm range and typically form through the further breakdown of MPs by biotic and abiotic processes [12]. However, the official definition has also been in convention within the environmental microplastic community, such as that there are no lower limits for MPs, but the lower size limit of MPs is set to 1 µm while plastic particles smaller than 1 µm are usually considered nanoplastics [13]. In this study, the polymer migration to the food samples can be categorized into two types, based on their sizes: microplastics and nanoplastics. The reason why the polymer migration of smaller particle sizes (<1 μm) is referred to as plastic traces migration is due to the ambiguous definition and their sizes, which are not visible with a Raman microscope (<1 μm). Normally, these are referred to as nanoplastics [14].
There have been several studies on the migration of MPs from plastic packaging on the surface of different cheese types [5,15,16], but there is no reference focused on microplastic migration versus different cheese maturation. Since cheese is more sensitive than other consumables to humidity and temperature due to microorganism growth, storage is a very important factor for its preservation. This is why the storage of dairy products in plastic packages is enforced. It is well-established that hydrophobic interactions exist between MPs and oily food products, which enhances the migration of MPs [17]. This is why Cretan Graviera, a fatty cheese, was chosen for plastic migration experiments.
Greek Graviera is a yellow, hard cheese with a high fat content (30–33%, w/w) and a relatively low salt content (2–2.5% w/w) [18,19]. It is a popular cheese, and a rich source of essential nutrients, making it an excellent choice for a balanced diet. The cheese is particularly valued for its protein content and calcium, supporting bone health [20]. It is typically sold in transparent pouches or tubs made out of plastic. It has a relatively short shelf life of about 2–3 weeks when refrigerated, depending on its salt content and maturity [21,22]. During the ripening process, microbiological and biochemical changes occur, leading to the development of the flavor and texture unique to each variety. The biochemical changes in cheese during ripening can be categorized into primary events (mainly lipolysis and proteolysis) and secondary events (the metabolism of fatty acids and amino acids) [23]. More specifically, during Graviera’s ripening, pH and moisture content are decreased, while fat and protein content (concentration) are increased [24]. This is the reason why longer-aged Graviera is harder than shorter-aged Graviera. It is worth mentioning that Graviera is usually processed when sold in retail, usually grated or sliced and stored in transparent plastic packaging; this processing significantly increases the surface area of the cheese that comes in contact with plastic, making it more susceptible to adverse effects of light and oxygen. [22].
In this work, Cretan Graviera of two different maturity levels (matured for 4 and 8 months) were tested for the possible contact migration of LDPE and PP from plastic packaging, using two different vibrational spectroscopic methods, FTIR-ATR and Raman. For the first time, MP migration from its storage packaging was studied against cheese maturity and two different plastic packaging materials. We present evidence that LDPE and PP plastic packaging migrates in the Graviera cheese, even when refrigerated (~7 °C). Particularly, in the Graviera aged for 8 months LDPE is indeed migrating from the food packaging to the Graviera samples, while in the Graviera aged for 4 months both LDPE and PP are migrating from the food packaging to the Graviera samples. The identified migration is detectable by Raman and FTIR-ATR spectroscopy starting from Day 3.

2. Materials and Methods

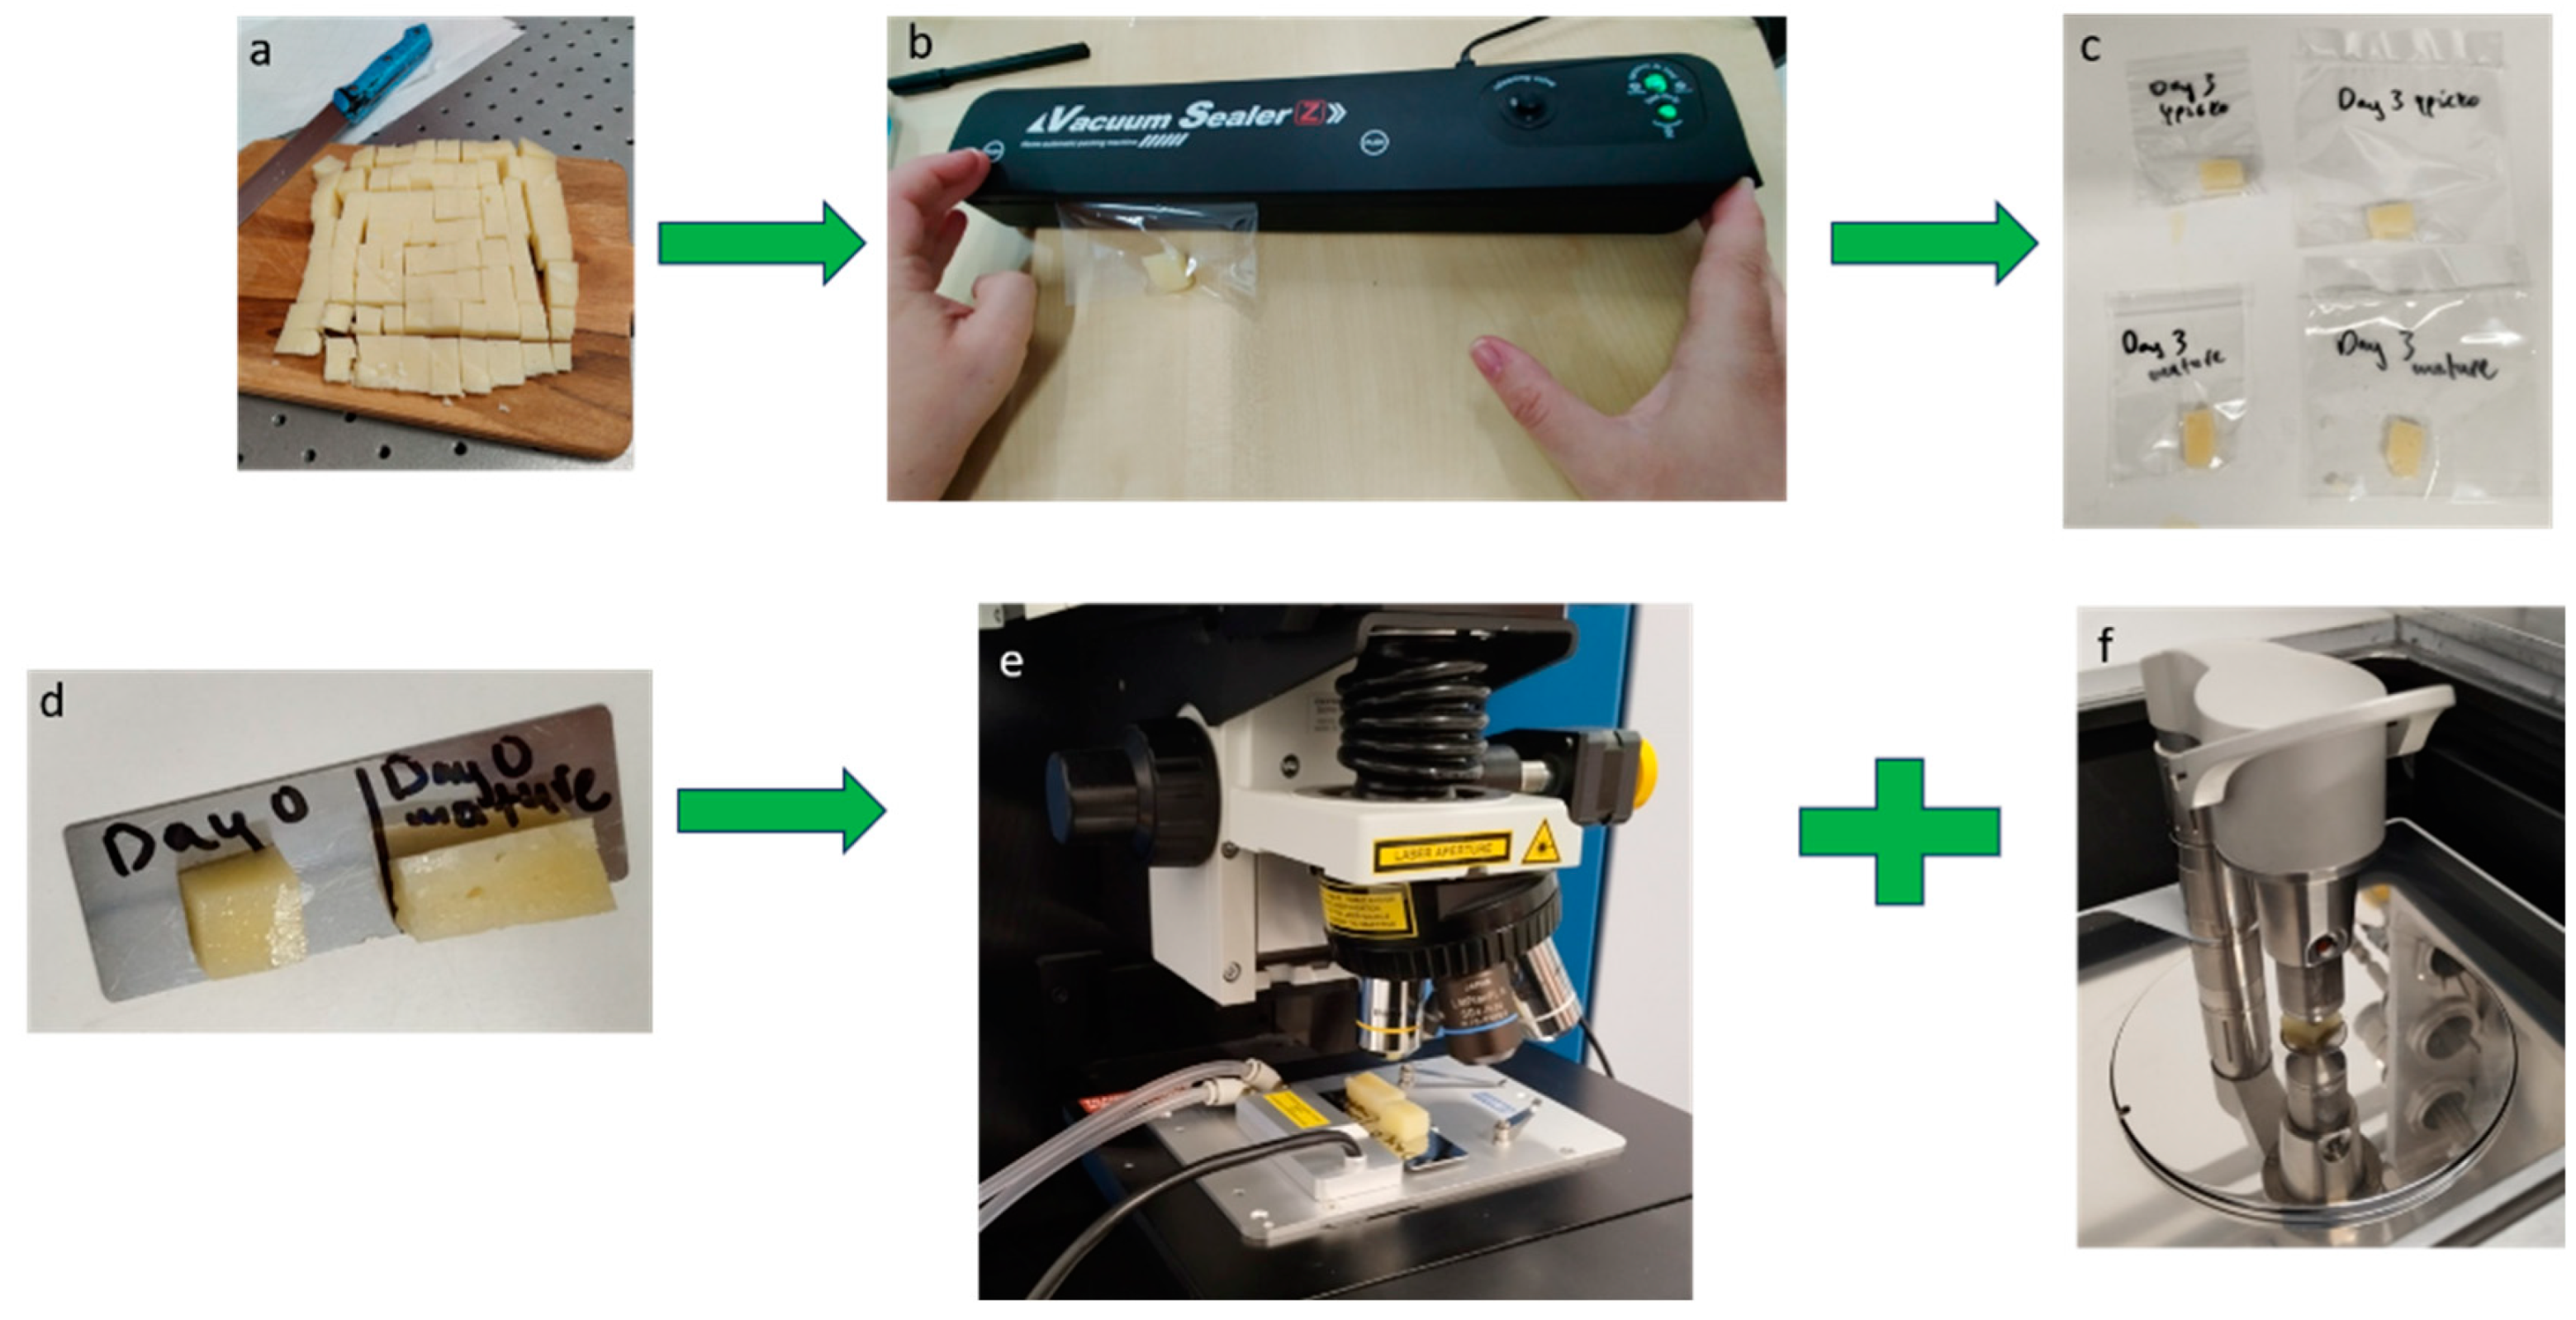
2.1. Samples and Experiment Preparation

In this project, we simulated the real conditions of how cheese is managed and stored in real commercial conditions, in Greece, before and after it is purchased by consumers. We assume and have considered the following cheese products’ managing parameters:
  • Cheese is cut into large slices from the “cheese head” when a specific weight is requested by the consumer, or for pre-cut slices to the shelf.
  • The cheese slice is placed inside plastic containers, either LDPE or PP bags or boxes.
  • For longer storage times, vacuum sealing is used, where the air is removed between the interface of the cheese surface and the packaging surface. This brings the two surfaces in strong contact.
  • The packaged cheese slices are then stored in refrigerated conditions for longer preservation (2–3 weeks).
The experimental design was based on the selected cheese degradation time, which is clearly visible after 2–3 weeks of storage in refrigerated conditions at 7 °C [5,21,22,25]. For this reason, the experimental duration was set to 21 days, conducting Raman and FTIR-ATR measurements every 3 days, from Day 0 to Day 21, to collect comparative data. This approach resulted in 8 time points for every cheese: Day 0, Day 3, Day 6, Day 9, Day 12, Day 15, Day 18, and Day 21.
Sixteen vacuum-sealed LDPE and sixteen PP pouches, commercially available in Greek stores as packaging pouches, were prepared and pre-marked with the assigned measurement day and maturity type. Two different Graviera cheeses of different maturity durations (4 and 8 months), from the same cheesemaker, were prepared for this experiment. Following the aforementioned real commercial management parameters, a clean bulk of cheese (pure cheese) was cut into small square pieces and then placed into the pre-marked LDPE and PP pouches, as shown in Figure 1. A vacuum sealer was used to remove the air and seal the plastic packages, ensuring direct contact between the cheese and the packaging surfaces. The samples’ dimensions were approximately 10 mm × 10 mm × 8 mm, which was more than sufficient to simulate the real conditions and for our microscopic measurements.
To avoid any possibility of polymer migration on Day 0, the first sample from each cheese type was measured right after the cut. For reference purposes, the cheese surface spectral information was acquired on Day 0, where the cheese surface was intact, particularly without touching the LDPE and the PP pouches similar to previous work [5]. The samples were stored in the refrigerator at 7 °C and each sample was studied on the corresponding measurement day, as pre-marked on its LDPE and PP pouches. As was previously referred, samples were placed on a SiO2 microscope slide using forceps, maintaining their original orientation from the LDPE and PP pouches. All the samples were analyzed in situ, on each measurement day. There were extra samples for each day, for risk assessment in case one of the samples was spoiled (bag tearing, for example, and loss of vacuum). In each cheese sample, at least 12 measurement points all over the cheese surface area were taken.
The protocol in this study provides information on the maximum potential transfer of microplastics, due to the strong contact between the cheese surface area and the packaging material under vacuum sealing. The different experimental days studied here were designed to simulate the short-term (Day 1) effects versus the long-term (Day 21) effects of the interaction between the cheese and packaging surfaces.

2.2. Data Acquisition

Data acquisition was performed with two state-of-the-art instruments located on our premises. In particular, we used a modified Raman microscope (LabRAM HR; HORIBA FRANCE SAS, Longjumeau, France) and an FTIR-ATR/spectrometer (Vertex 70v; Bruker Optik GmbH, Rosenheim, Germany), coupled with a Bruker A225/Q Platinum ATR unit (Bruker Optik GmbH, Rosenheim, Germany) with a single reflection diamond crystal.

2.2.1. Optical Microscopy and Raman Spectroscopy

Raman scattering measurements were carried out using a LabRAM HR Evolution Confocal Raman Microscope (LabRAM HR; HORIBA FRANCE SAS, Lille, France). A 532 nm laser line was used for Raman excitation, with the laser output power set to approximately 100 mW. The instrument’s spectral resolution, achieved through 600 grooves/mm grating, was around 2 cm−1. An Olympus 50× objective lens with a numerical aperture (NA) of 0.5 and a working distance of 10.6 mm (LMPlanFLN 50X/0.5, Olympus, Tokyo, Japan) was utilized. Under these conditions, the maximum laser power on the sample was measured at 34 mW, with a laser spot size of approximately 1.3 μm. The Raman signal was detected using a Syncerity CCD Deep Cooled Camera by Horiba, operating at −50 °C. Temperature control and sample stability were ensured by a temperature-controlled stage (PE120-XY, Linkam Scientific Instruments Ltd., Surrey, UK) coupled to the microscope stage. Instrument calibration was performed before each experiment, using a silicon reference sample with a single peak at 520.7 cm−1. Raman spectra were collected in the range of 100 to 3150 cm−1, with the 532 nm excitation laser operating at full intensity (100%), yielding 34 mW on the sample. Each point was measured with an acquisition time of 10 s and 3 spectral accumulations, resulting in a total acquisition time of approximately 30 s. All measurements were conducted at a constant temperature of 18 °C using the Linkam PE120 thermoelectrically cooled stage. During measurements, samples were placed on a SiO2 microscope slide using forceps, maintaining their original orientation from the LDPE and PP pouches. From each sample, more than 10 measurements were acquired at different spots on the cheese’s surface to ensure consistency in the Raman signal.

2.2.2. FTIR-ATR Experiments

FTIR-ATR (absorbance) experiments were conducted using a Bruker Vertex 70v FT-IR vacuum spectrometer, fitted with an A225/Q Platinum ATR unit featuring a single reflection diamond crystal, with a measurement surface area of 2 mm2. This setup enabled infrared analysis of unevenly shaped solid samples via total reflection measurements across a spectral range of 7500 to 350 cm−1. A broadband KBr beamsplitter and a room-temperature broadband triglycine sulfate (DTGS) detector were utilized. Interferograms were collected at a resolution of 4 cm−1 (8 scans), apodized using a Blackman–Harris function, and Fourier transformed with two levels of zero filling, producing spectra encoded at 2 cm−1 intervals. Before scanning, a background measurement of the diamond crystal was taken, and the sample spectra were automatically corrected by subtracting the background. During each measurement, the samples were carefully positioned under the ATR press, maintaining their orientation as they were in the pouches. After every measurement, the sample area and the tip of the A225/Q ATR unit were cleaned using pure ethanol (Et-OH; Sigma-Aldrich, Munich, Germany).

2.3. Spectral Processing and Analysis

Raman spectra were acquired, processed, analyzed, and visualized by LabSpec 6 Raman software, made by Horiba (HORIBA FRANCE SAS, Longjumeau, France). The following processing steps were applied to each Raman spectrum: (a) cosmic rays were removed; (b) spectral smoothing using a Gaussian filter with a five-point kernel (denoised at 5); (c) background was removed using a sixth-order polynomial baseline function; (d) spectral normalization based on the unit vector. For each cheese sample on each measurement day, an average spectrum was calculated from twelve measurement points. Finally, the original average Day 0 Raman spectra were subtracted from the average Day × spectra (Day × minus Day 0), to highlight Raman spectral changes throughout the experiment.
FTIR-ATR spectra were acquired, processed, analyzed, and visualized by Opus 7.2 software, made by Bruker (Bruker Optik GmbH, Rosenheim, Germany). For each FTIR-ATR spectrum, the following processing methodology was used: After performing each cheese measurement, as described in Section 2.2.2, all the original Day 0 FTIR-ATR spectra were subtracted from the Day × FTIR-ATR spectra (Day × minus Day 0), to observe only the FTIR-ATR spectral changes throughout the experiment

2.4. Spectral Reference Data and Analysis

All the Raman and FTIR-ATR spectral references occurred from measurements that were performed by measuring the LDPE and PP plastic packages used for the migration experiments.

2.4.1. Raman Spectral References

The Raman spectrum of LDPE and PP is presented in the following Figure 2. The major Raman peaks used for the analysis are presented in red-dashed vertical lines, indicating the important Raman peaks on the same graph.
In Tables S1 and S2 in the Supplementary Section, the identified Raman peaks of LDPE and PP are presented respectively, according to the KnowItAll Informatics System by Bio-Rad Laboratories database. A literature study was performed to identify the related assignments of the LDPE and PP Raman peaks found in existing cheese studies. LDPE assignments are presented in Table S1, along with the associated references [26,27,28,29,30,31], and PP assignments are presented in Table S2, along with the associated references [26,27,29,32,33,34,35,36,37,38,39].

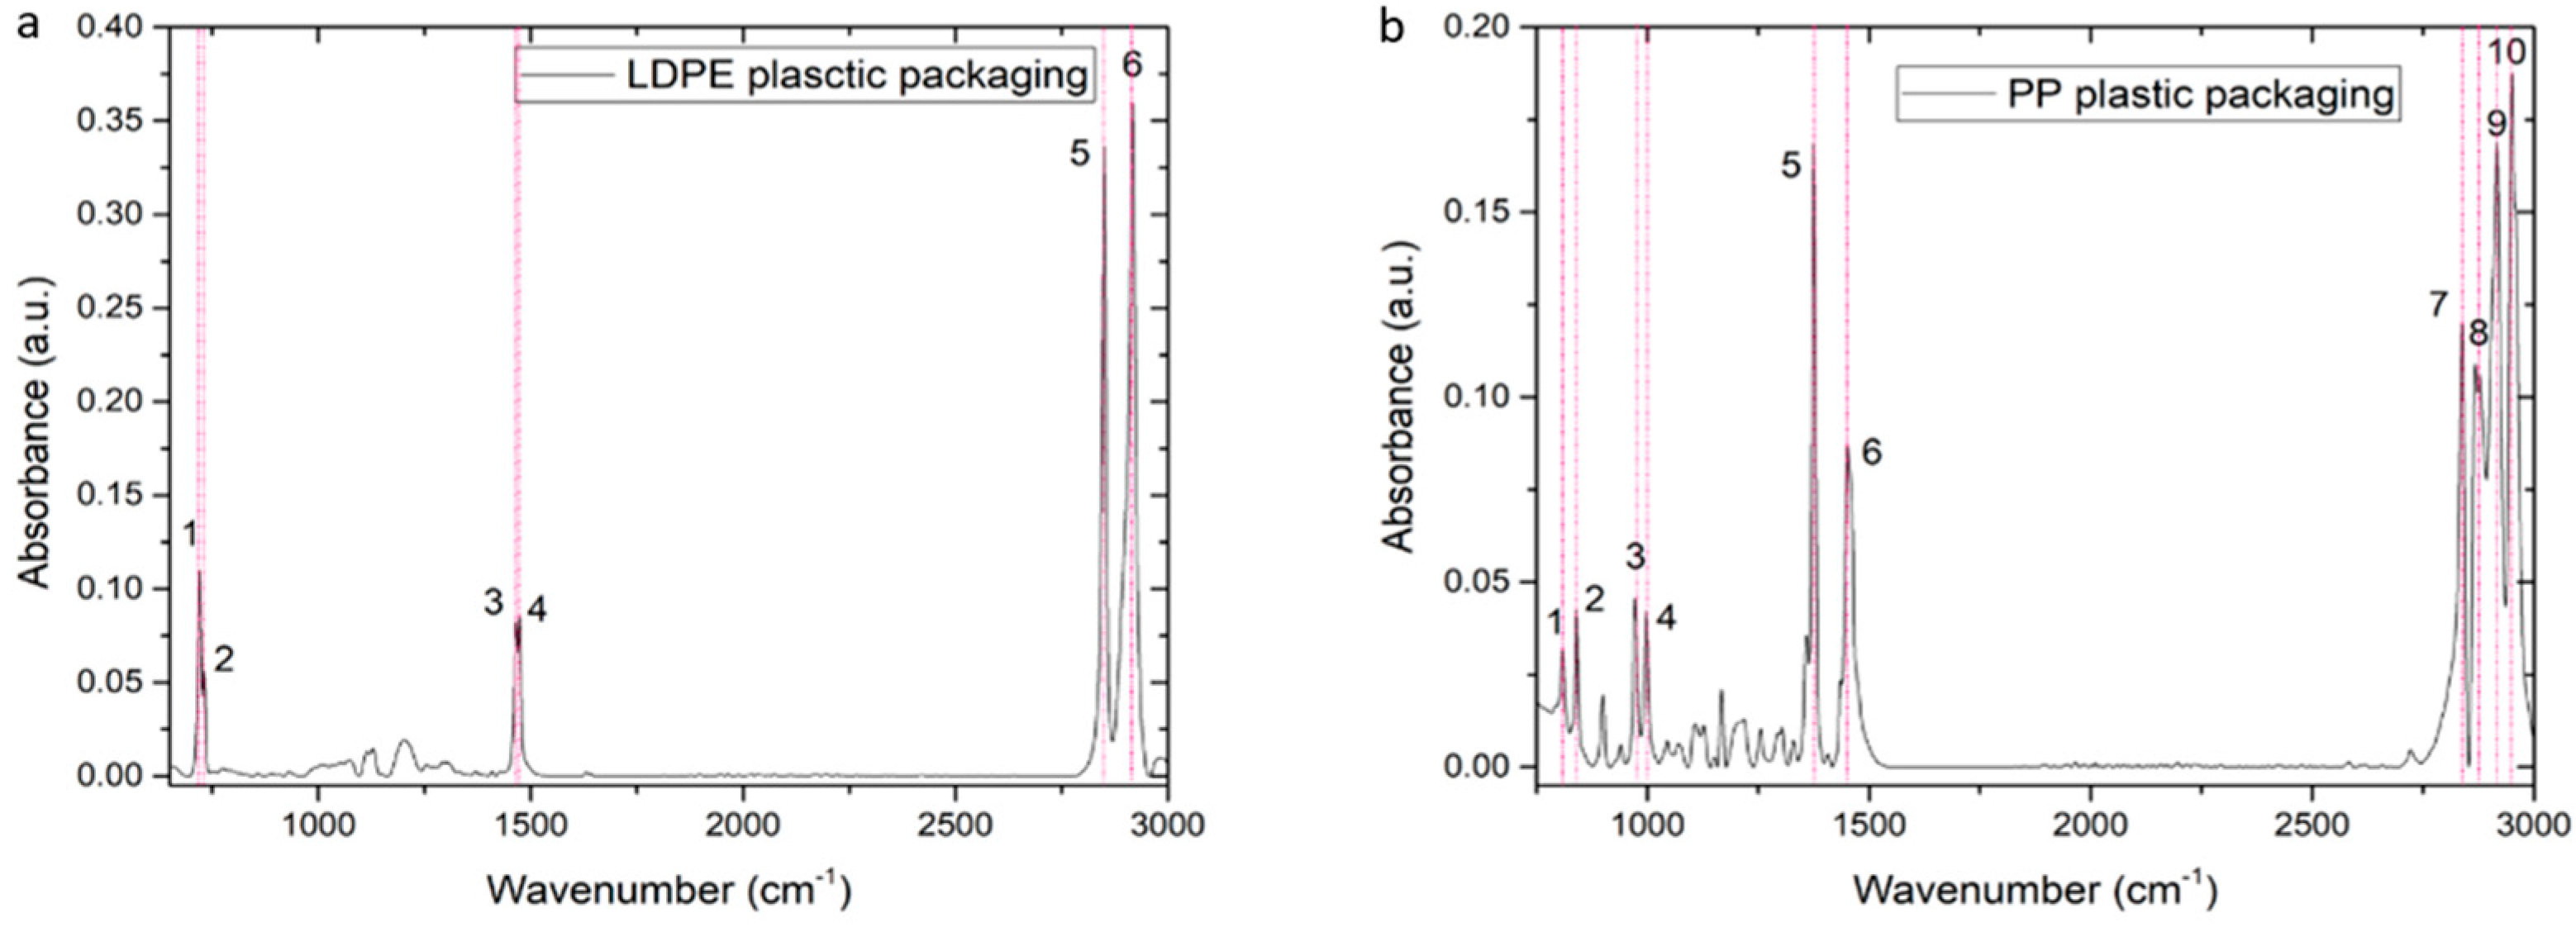
2.4.2. FTIR-ATR Spectral References

The FTIR-ATR spectrum of LDPE and PP is displayed in Figure 3 below, with the main peaks highlighted by red-dashed vertical lines on the same graph.
In Tables S3 and S4 in the Supplementary Section, the identified FTIR-ATR peaks of LDPE and PP are presented, as outlined in the S.T. Japan-Europe GmbH FT-IR database. A literature review was conducted to determine the corresponding assignments of these peaks found in previous cheese studies, and the results are provided alongside the relevant references [40,41,42,43,44] for LDPE and relevant references [41,43,44,45,46,47,48,49] for PP.

3. Results and Discussion

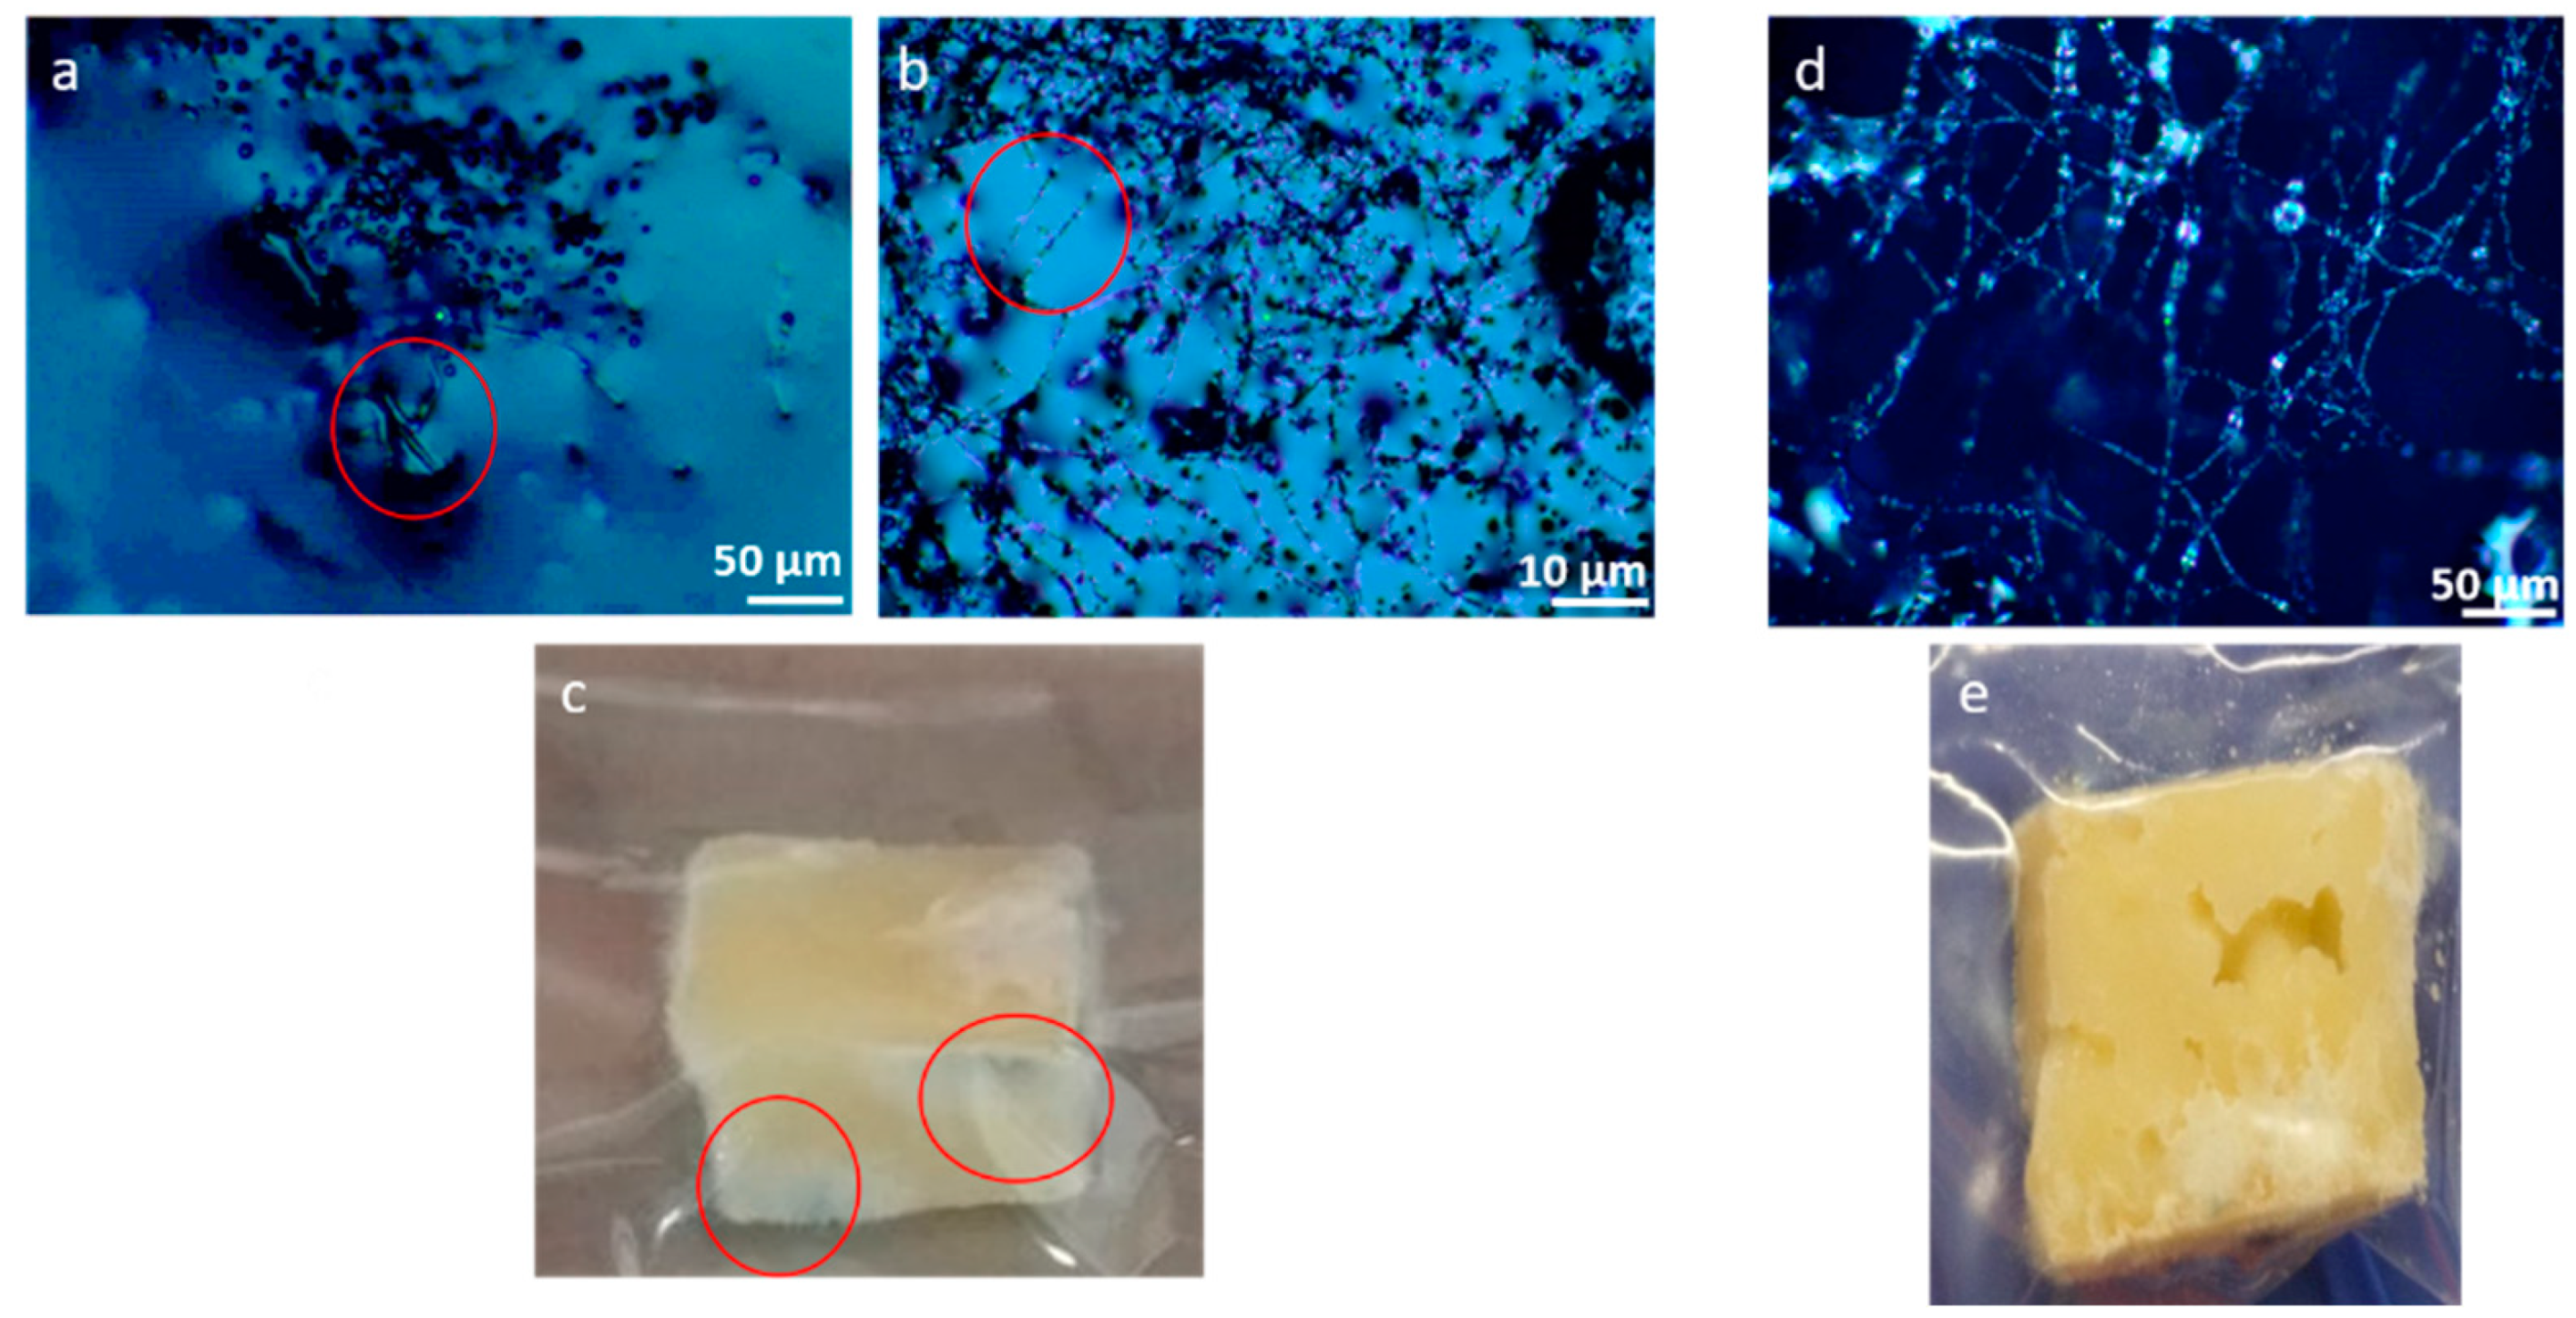
3.1. Microscopic Analysis of Graviera Cheese-Microbial Growth

As was observed from the following storage approach of cheese samples in plastic packages, the LDPE and PP plastic packaging of Graviera samples did not prevent microbial film formation on the cheese surface. Based on the parallel microscopic observations we had, together with the Raman measurements, it is supported that the disappearance of LDPE and PP peaks at specific time points occurs at the same time as the biofilm formation. In more detail, as presented below, while the polymer peaks began to fade and eventually disappear, the development of microbial growth created a signal that overlapped with the peaks associated with MPs. The only distinguishable change was the increased microbial growth between the days when the MP signal was present and the subsequent days when it was not; the MP signal was covered by the biofilm formation. As this phenomenon was observed during the experiment, we had to include it in the results.
Based on microscopic observations, biofilm started to develop on Day 9 in a 4-month-old Graviera sample, stored in an LDPE pouch. Microbial fibers were developed in some areas, as presented in Figure 4a. In 8-month-old Graviera samples, microscopic microbial growth started to appear on Day 18, as presented in Figure 4b. However, macroscopic microbial growth was first observed on Day 12 in all samples, on lateral surfaces, where the minimum optical microbial growth was formed in an 8-month-old sample, stored in PP, as presented in Figure 4c. These observations make sense as 4-month-old cheese samples have more moisture than the 8-month-old cheese samples, so the microbial growth grows faster in the 4-month-old samples [24].
In all samples, microbial biofilm development started after Day 12, which is presented in Figure 4d. In particular, on Day 21 the entire surface of the Graviera cheese was covered by biofilm fibers. Furthermore, it was observed that the minimum macroscopic microbial growth was formed in an 8-month-old sample, stored in LDPE, as presented in Figure 4e, because microbial growth was very little. This observation is consistent with the literature, because the 8-month-old cheese samples had less moisture [24], and the LDPE polymer has good moisture resistance [9]. It has been observed that lactic acid bacteria (LAB) flora is present in traditional Greek Graviera cheese after five weeks of ripening [50]. In this three-week experiment, it is possible that most of the microbial population did not manage to grow.

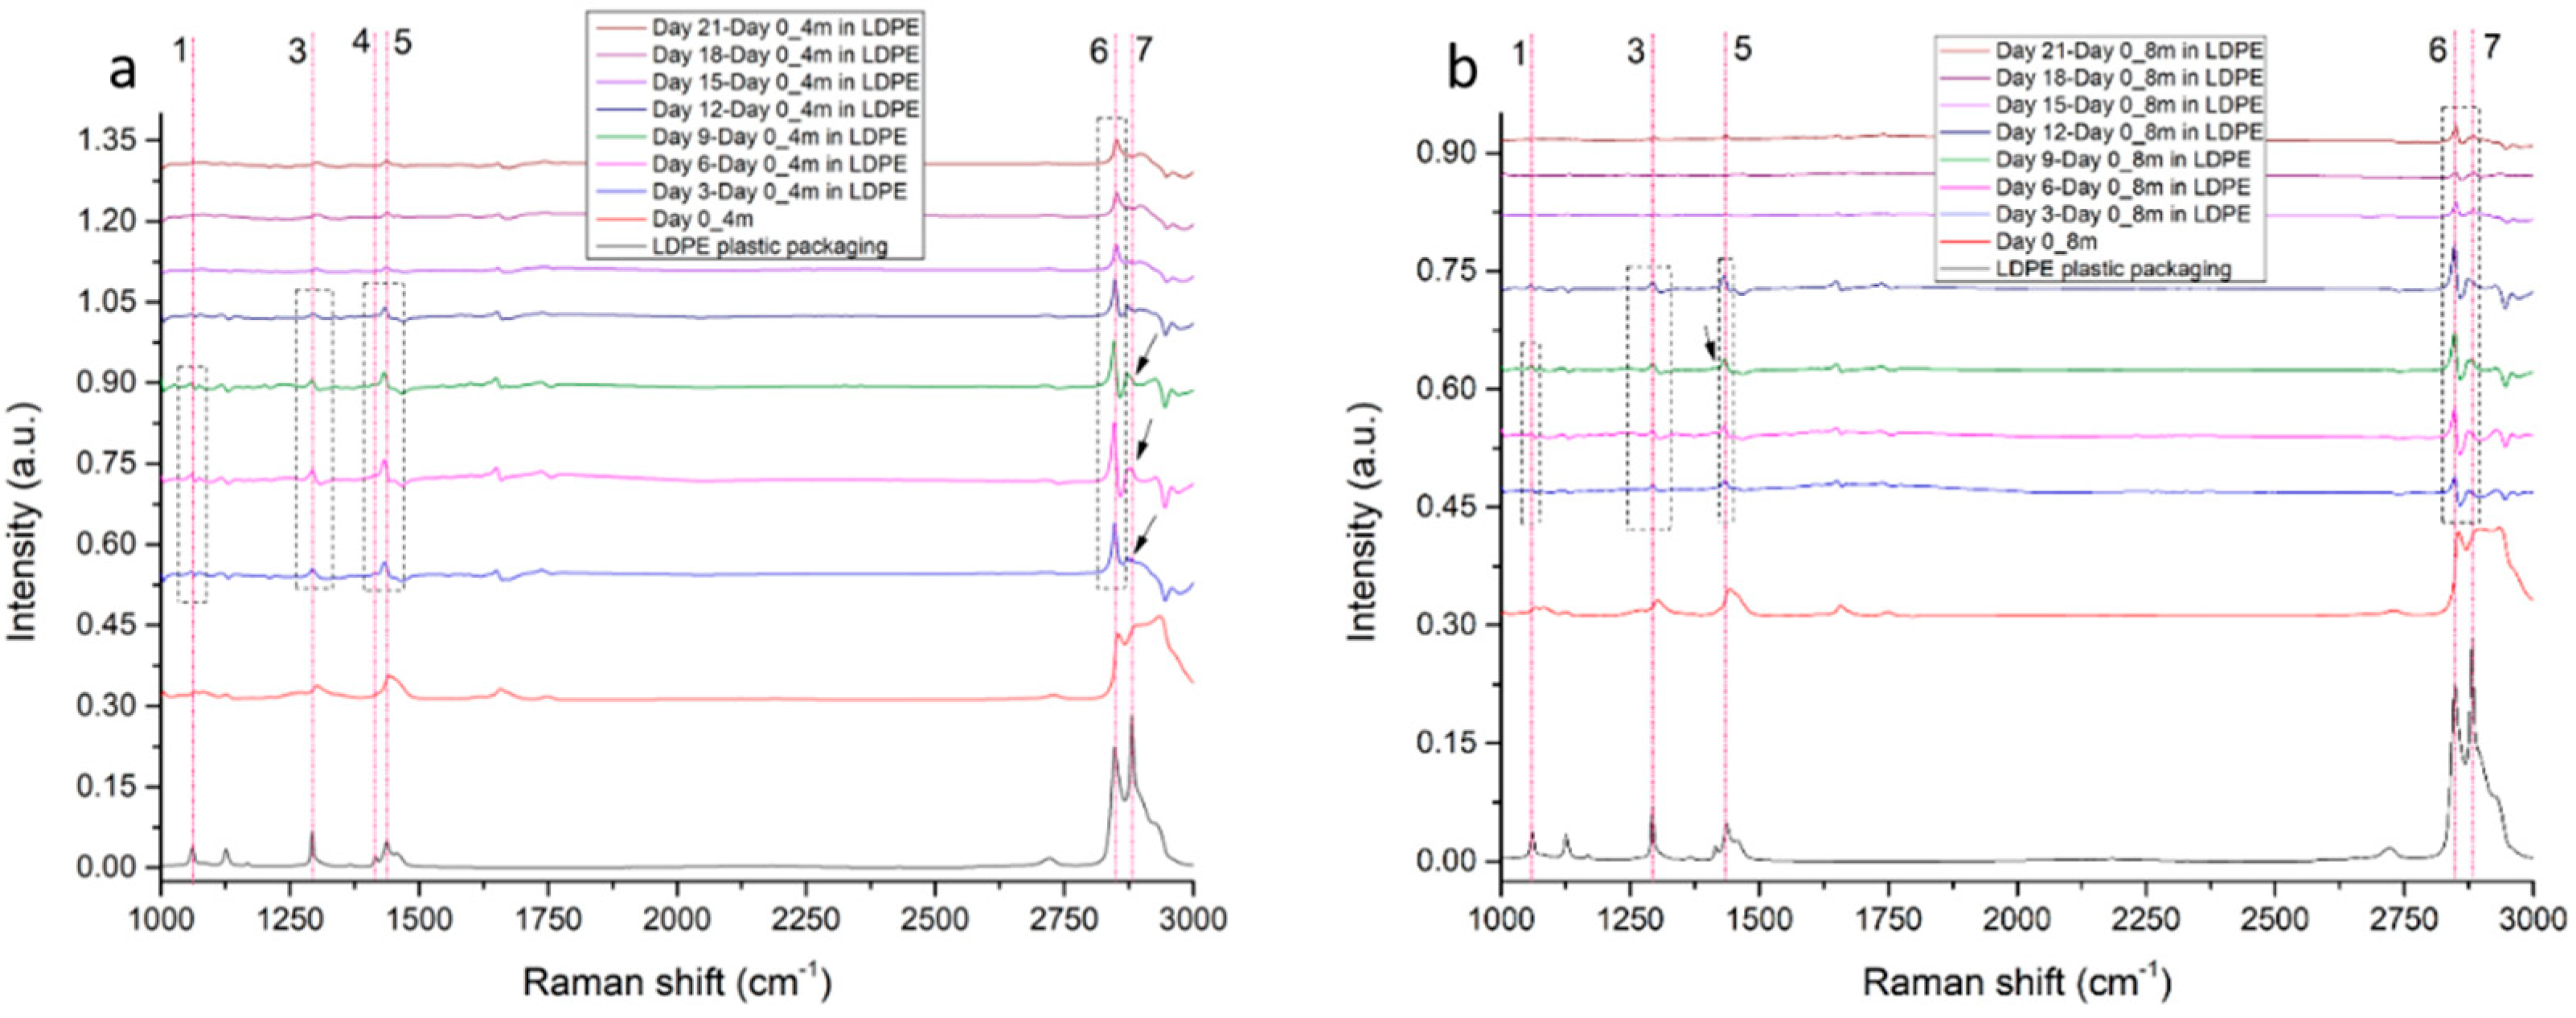
3.2. Raman Spectroscopic Analysis

3.2.1. LDPE Migration Traces in 4-Month-Old and 8-Month-Old Graviera Cheese

Initially, we measured all 4-month-old and 8-month-old Graviera cheese samples on Day 0 to clarify whether or not there was any overlap between the characteristic Raman peaks of the cheese samples and the ones from the LDPE package. The Raman peaks of LDPE are not present in these cheese spectrums, as shown in Figure 5a,b. At this point, we should comment that, after Day 15, as seen in Figure 4a,b, some inconsistencies are present that are attributed to the biofilm that started to develop after Day 12. Due to the microbial growth, the signal overlaps with most of the polymer peaks in all samples stored in LDPE and PP packages, as shown in Figure 5. Based on Table S1, all Raman peaks of LDPE polymer, except for number 2 at 1127 cm−1, started to appear from Day 3 and are still visible on Day 9 in 4-month-old samples. In the 8-month-old samples, all Raman peaks of LDPE polymer, except for number 2 at 1127 cm−1 and number 4 at 1416 cm−1, started to appear from Day 3 and are still visible on Day 9. Surprisingly, peaks 6 and 7 are visible until Day 21, while in 4-month-old samples peak 7 disappears after Day 12. The disappearance of LDPE peaks is believed to be due to the biofilm that was created, as referred to in Section 3.1.

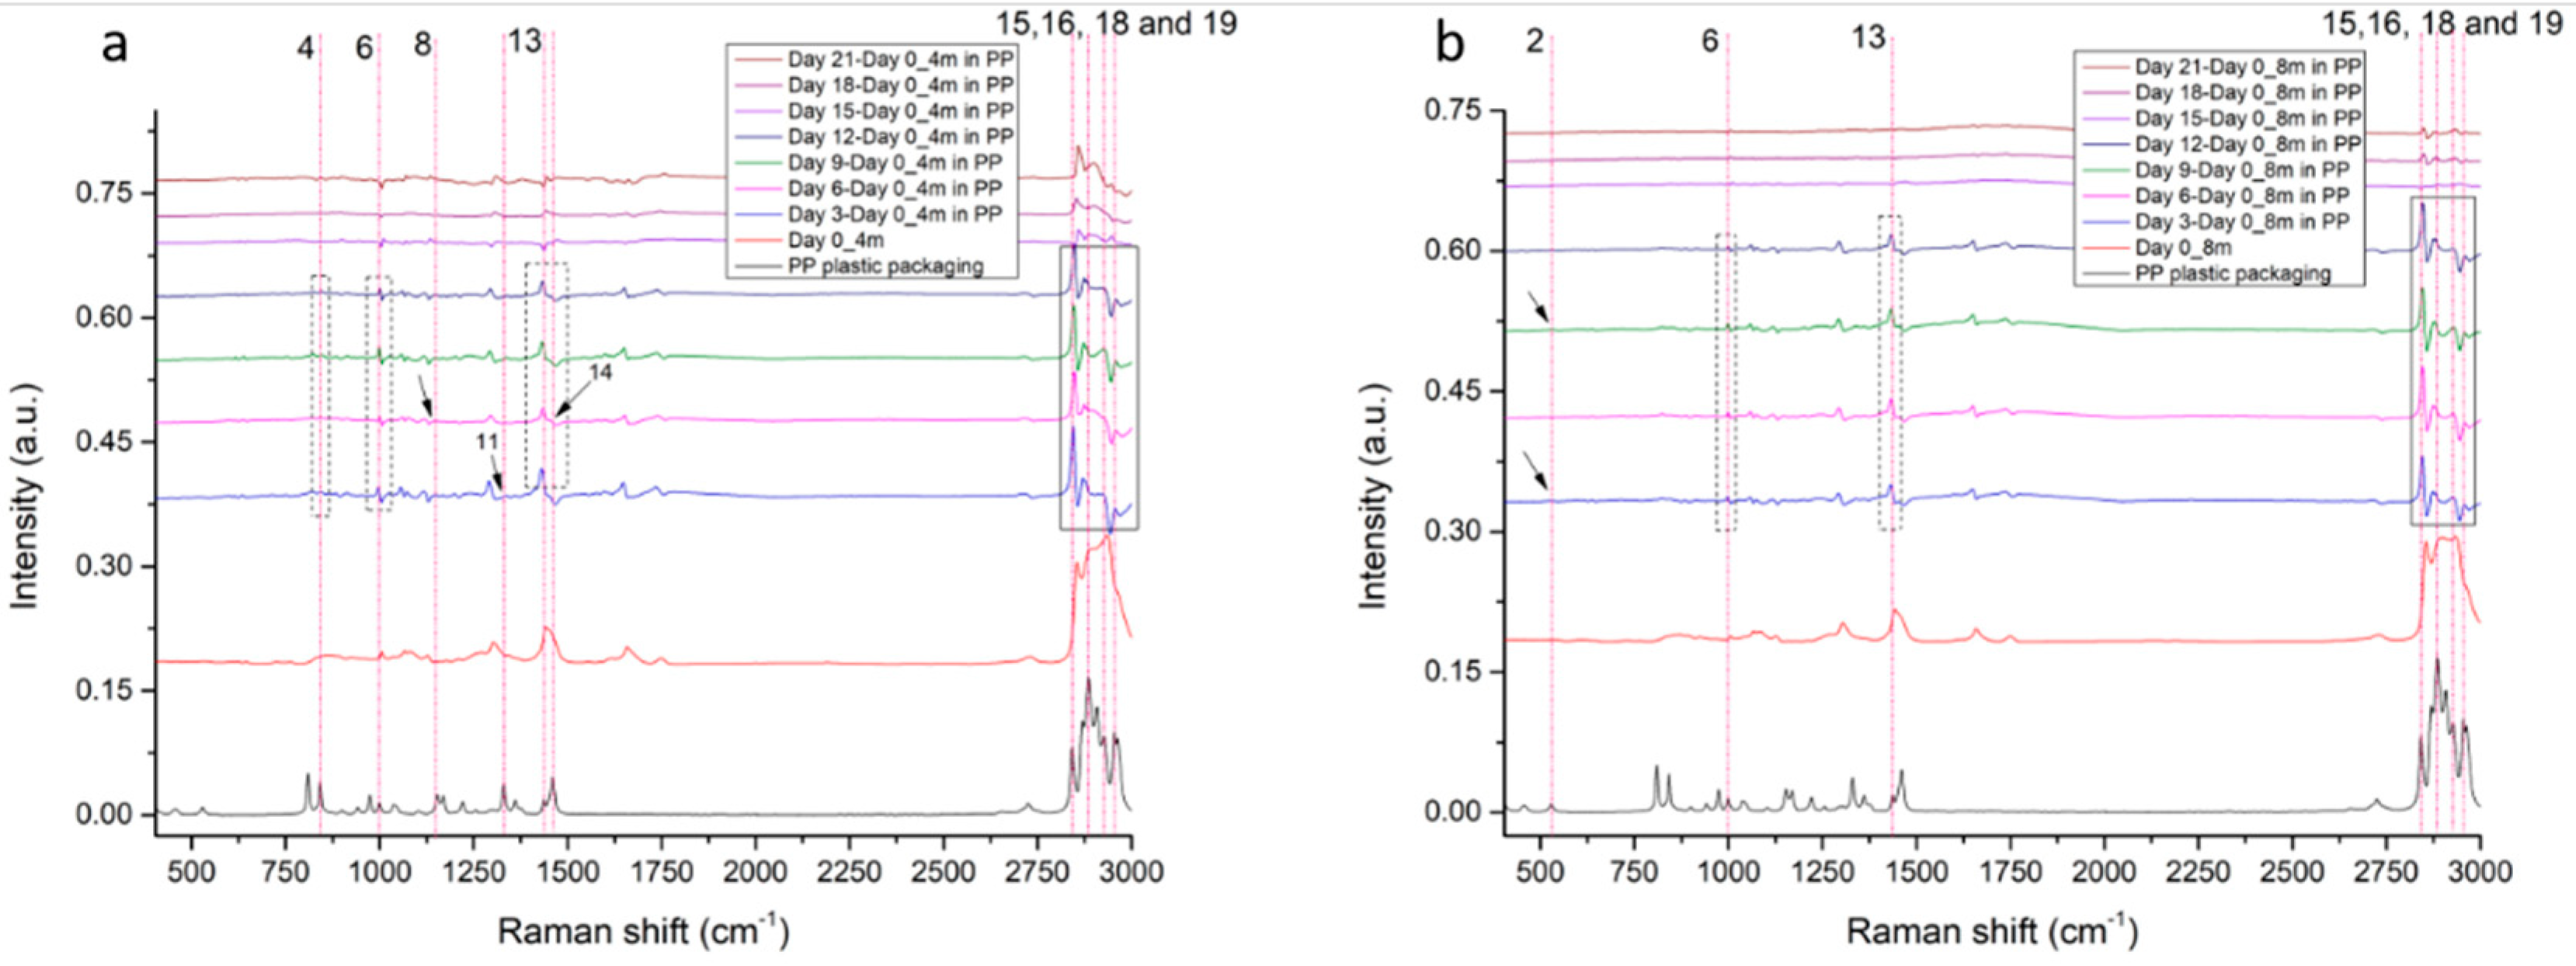
3.2.2. PP Migration Traces in 4-Month-Old and 8-Month-Old Graviera Cheese

Additionally, we measured all 4-month-old and 8-month-old Graviera cheese samples at Day 0 to record any PP migration to the cheese. The Raman peaks of PP are not present in these cheese spectrums, as shown in Figure 6a,b. Based on Table S2, nine Raman peaks of PP polymer (numbers 4, 6, 8, 13, 14, 15, 16, 18, and 19) appeared on Day 6 in the 4-month-old Graviera cheese samples. On Day 3, eight PP peaks (numbers 4, 6, 11, 13, 15, 16, 18, and 19) started to appear until Day 12, where only seven PP peaks remained. Even though all the PP Raman peaks were not detected, these nine peaks on Day 6 are sufficient to conclude that there is PP migration in 4-month-old Graviera cheese from the PP packaging. The disappearance of polymer peaks is believed to be due to the created biofilm, as mentioned in Section 3.1. However, in 8-month-old Graviera cheese, only seven Raman peaks of PP (numbers 2, 6, 13, 15, 16, 18, and 19) appeared on Day 3. Of these seven peaks, only four were important (number 15, 16, 18, and 19), although peak number 2 does not exist in the cheese samples. This is the reason why the migration of PP in 8-month-old Graviera cheese is not as clear as it was in 4-month-old Graviera cheese.
Although fat concentration in the 8-month-old samples is higher compared to the 4-month-old samples [24], there is no difference in LDPE migration between the different maturity samples. However, concerning the samples stored in PP, there was a strong difference between the 4-month-old and 8-month-old samples, because PP peaks only appeared in the 4-month-old Graviera samples.

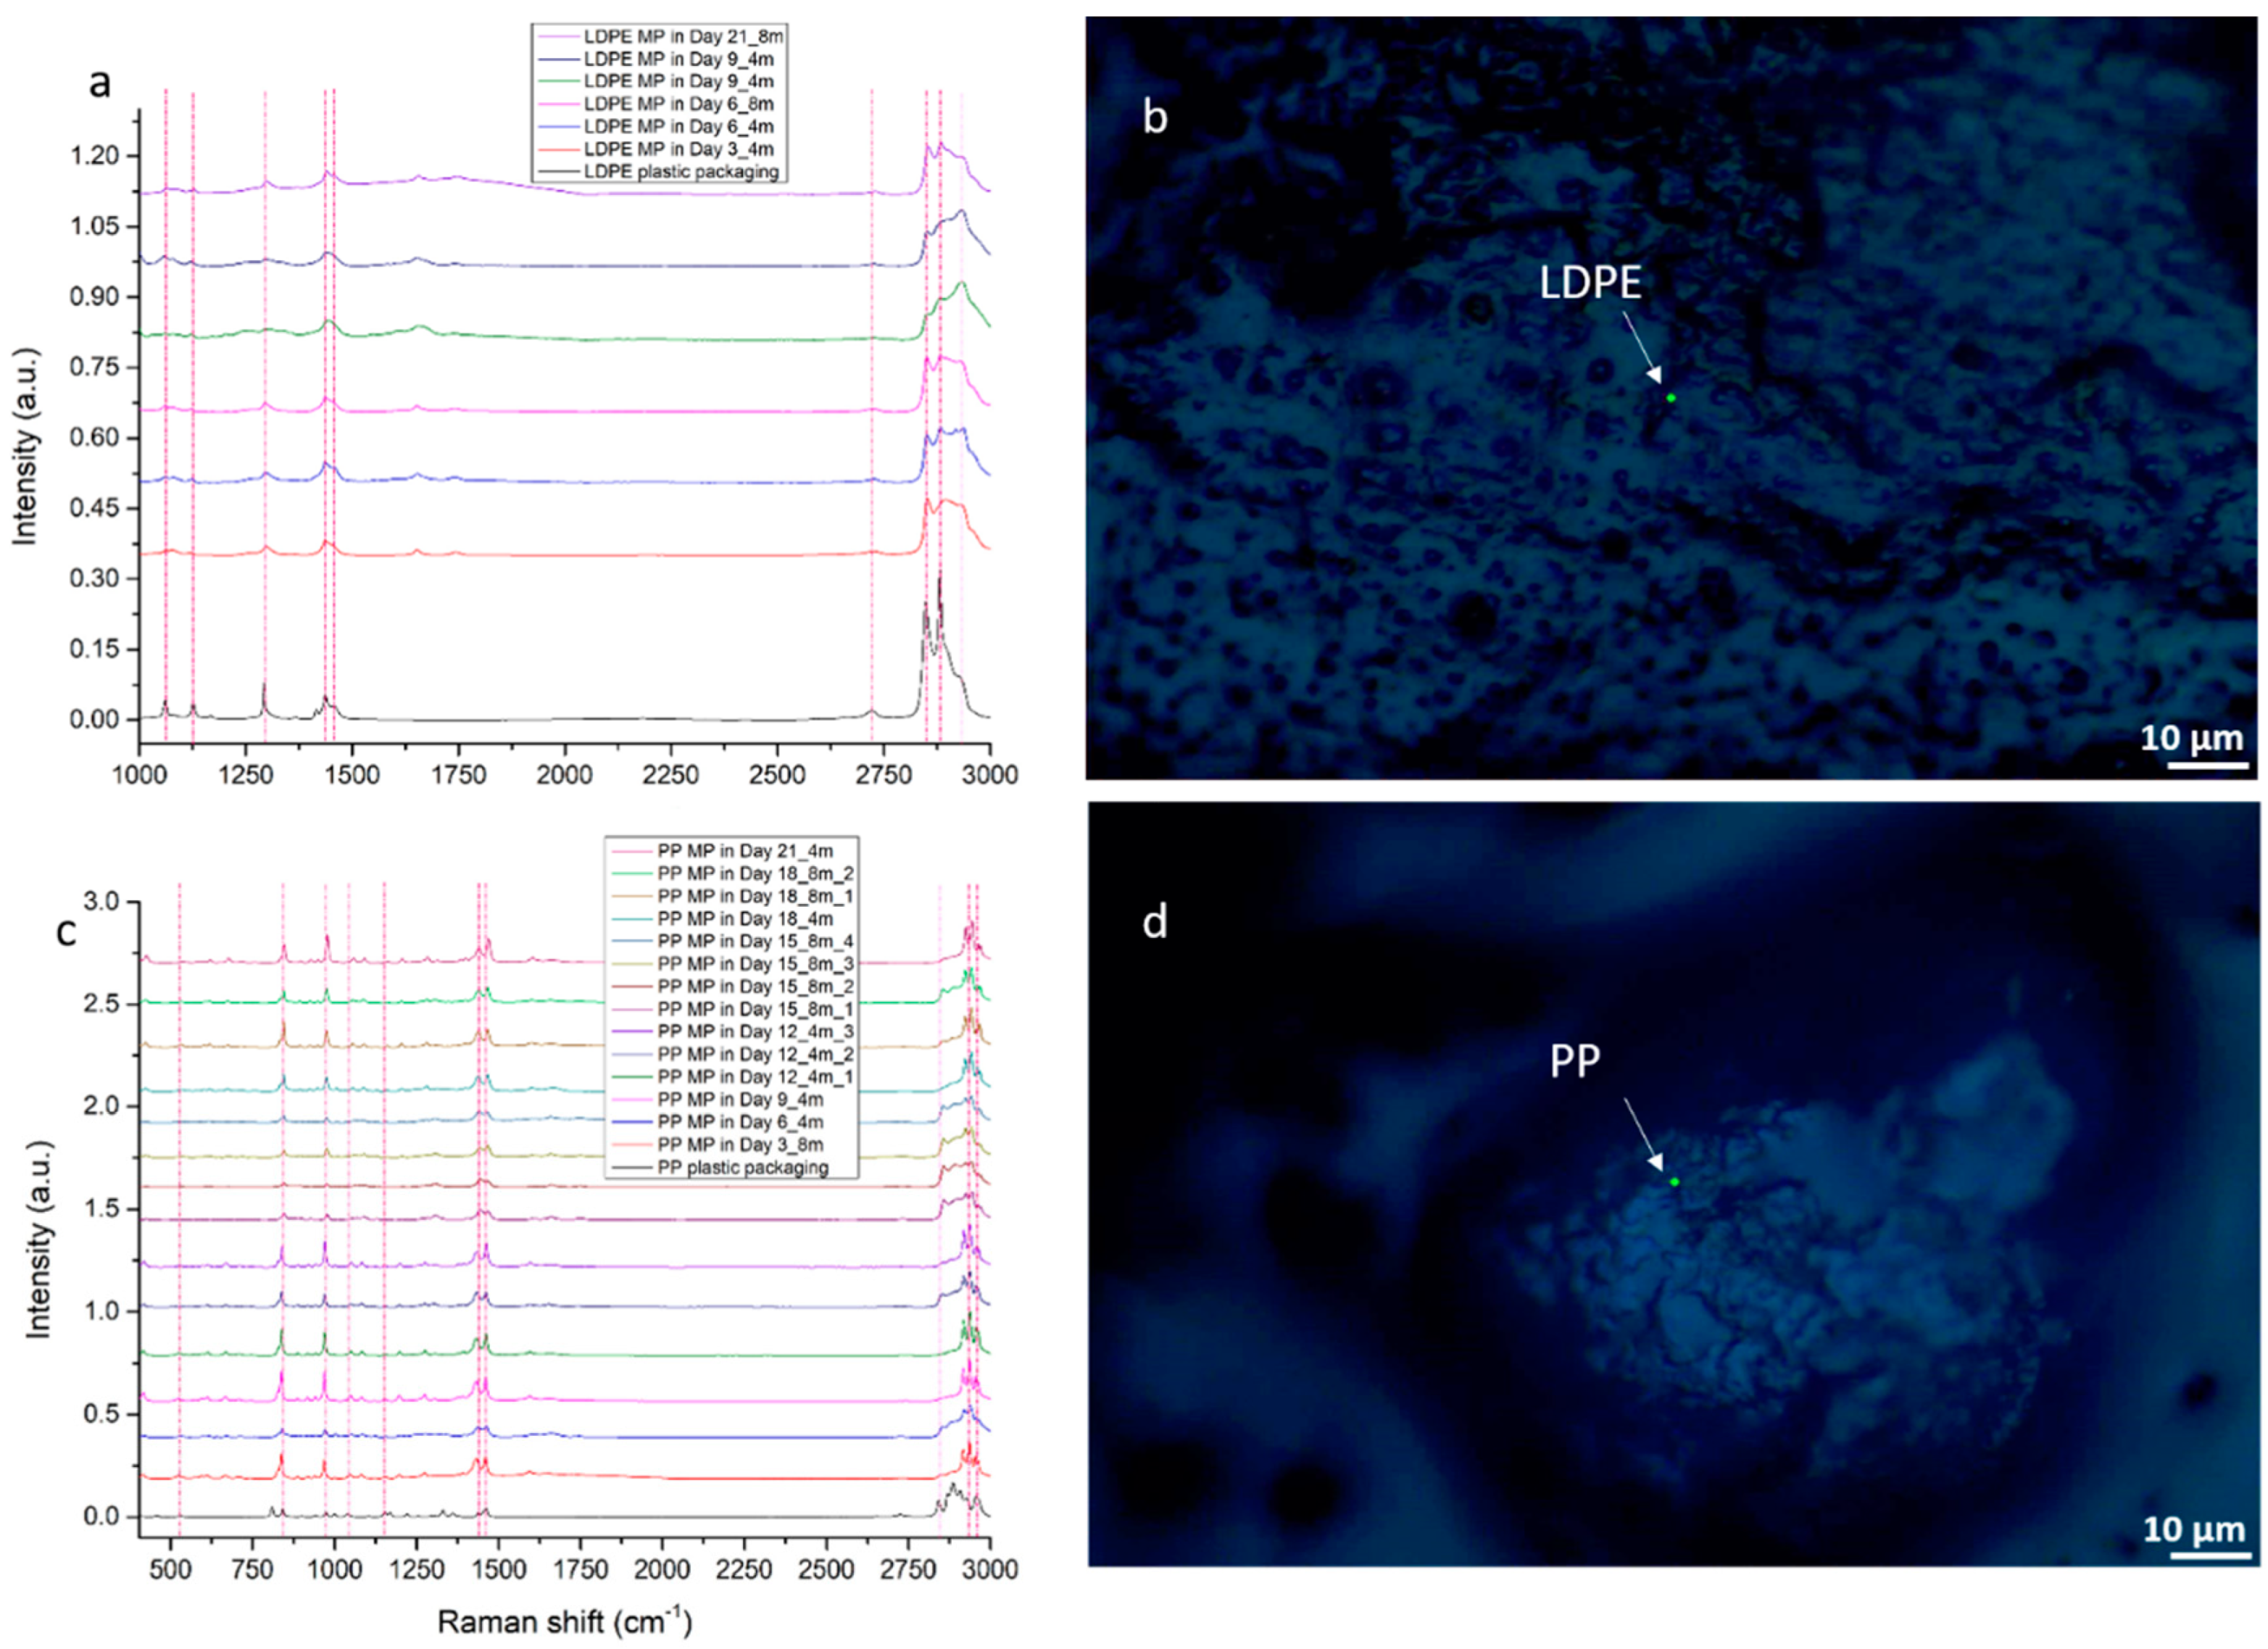
3.2.3. MP Detection in Graviera Cheese Samples by Raman Spectroscopy

Regardless of the packaging, Raman peaks (migration traces) detected in the Graviera cheese samples based on Day × minus Day 0 data processing were detected in some cheese samples. The same samples were used; in these measurements, MPs were detected via the microscope in random areas of the cheese surface, and the Raman measurement data were used unchanged. In particular, in the Graviera cheese samples stored in LDPE, the following six LDPE MPs were detected: one MP on 4-month-old of Day 3, two MPs on Day 6 (one in the 4-month-old and one in the 8-month-old sample), two MPs in 4-month-old of Day 9, and one in 8-month-old of Day 21. On Days 12, 15, and 18, LDPE MPs were not detected, perhaps due to the developed biofilm. In the Graviera cheese samples stored in PP, the following fourteen PP MPs were detected: one MP on 8-month-old of Day 3, one MP on 4-month-old of Day 6, one MP on 4-month-old of Day 9, three MPs on 4-month-old of Day 12, four MPs in 8-month-old of Day 15, three MPs of Day 18 (one in the 4-month-old and two in the 8-month-old samples), and one MP in 4-month-old of Day 21. It is observed that more PP MPs than LDPE MPs were migrated from the Graviera cheese samples. At the same time, more PP MPs than PP traces were detected. The findings are presented in Figure 7 below.

3.3. FTIR-ATR Spectroscopic Analysis

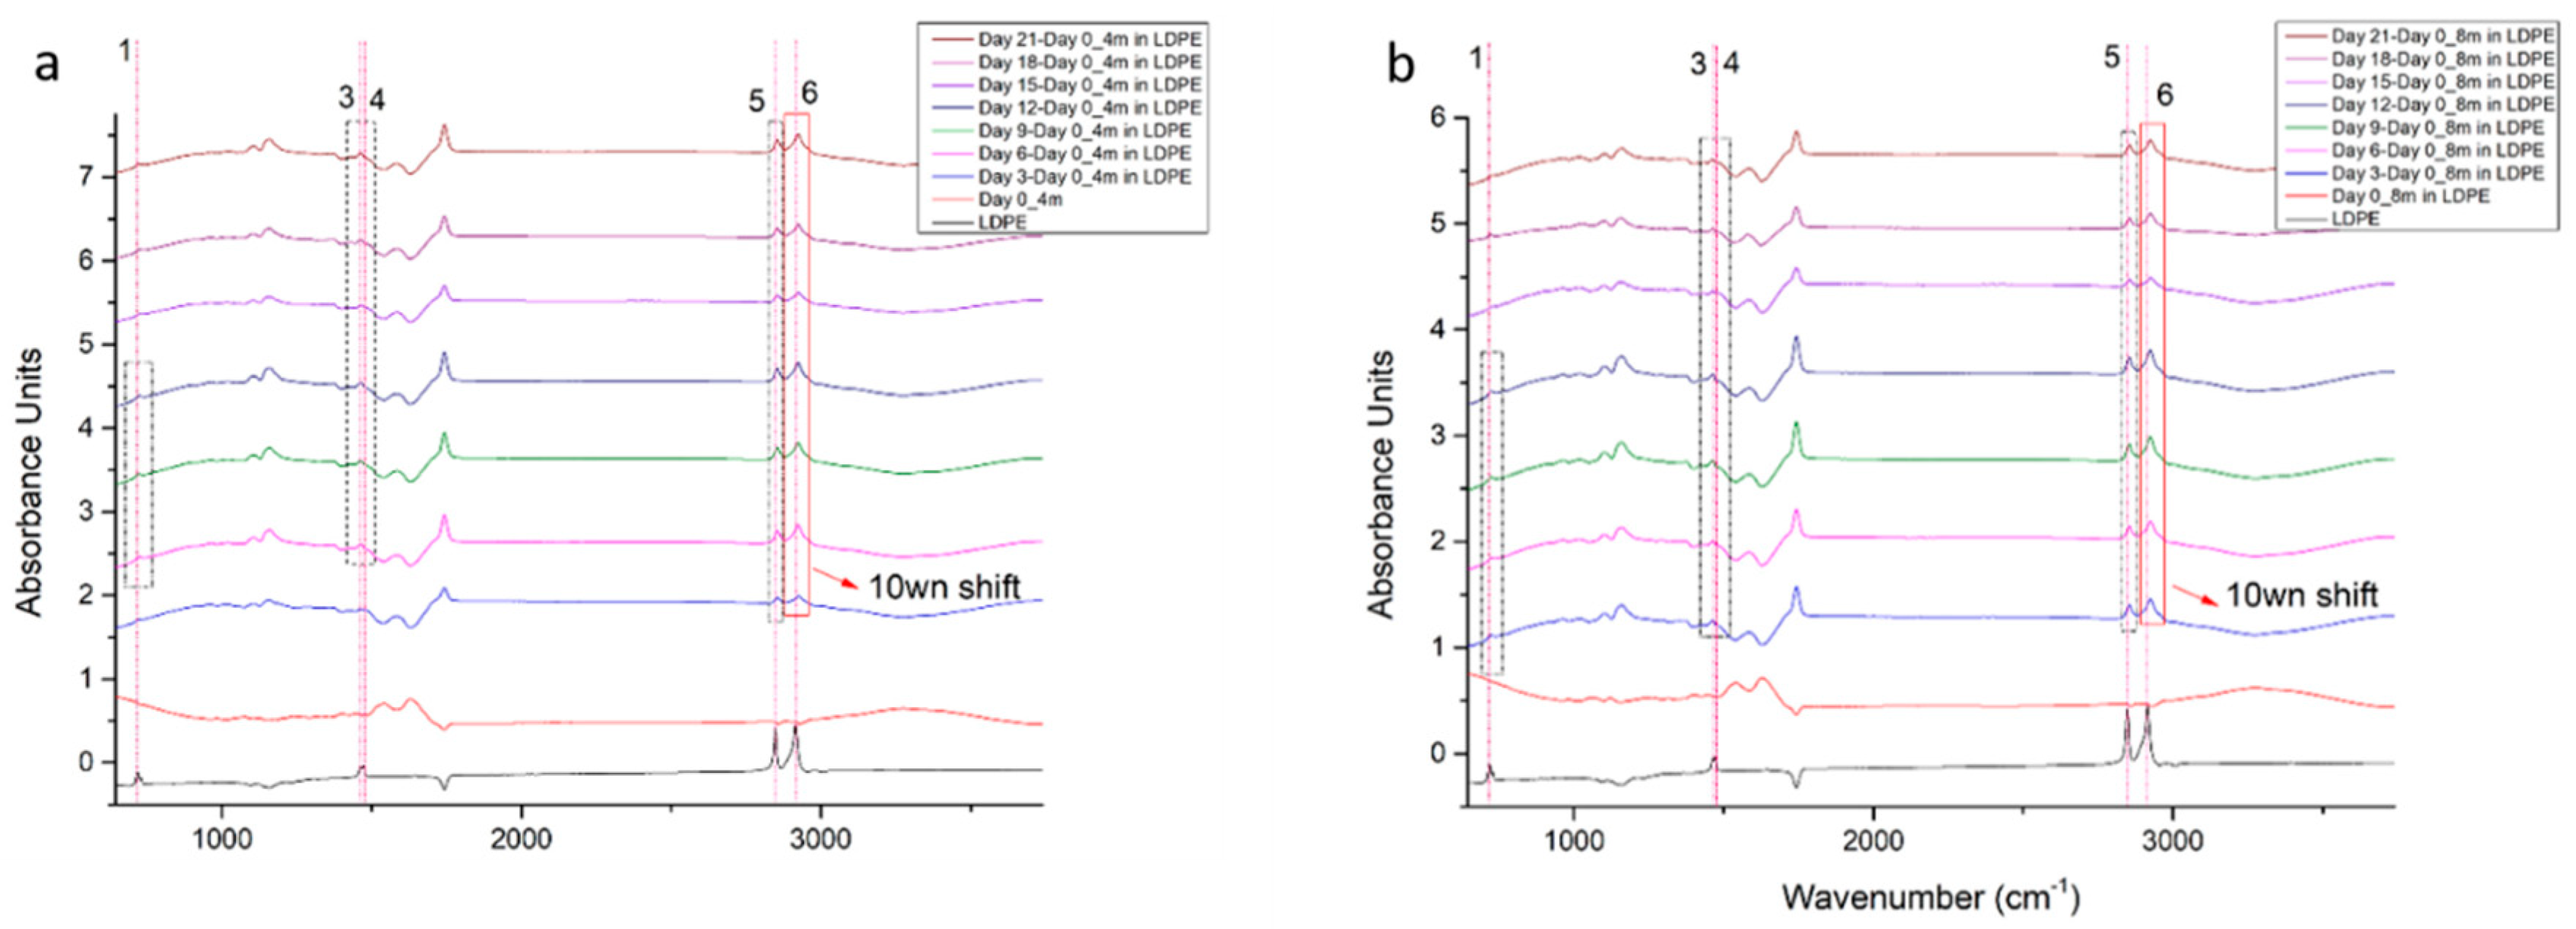
3.3.1. LDPE Migration Traces in 4-Month-Old and 8-Month-Old Graviera Cheese

Initially, we measured all 4-month-old and 8-month-old Graviera cheese samples on Day 0 to understand if there was any overlap between the characteristic absorbance peaks of the cheese samples and the ones from the LDPE packaging. The absorbance peaks of LDPE are not present in these cheese spectrums, as shown in Figure 8. Based on Table S3, all absorbance peaks of LDPE polymer, except for number 2 at 729 cm−1, started to appear from Day 6 and are still visible on Day 12 in 4-month-old samples and from Day 3 until Day 12 in 8-month-old samples. The disappearance of the LDPE peaks is believed to be due to the biofilm that is created, as mentioned in Section 3.1. In both samples (4-month-old and 8-month-old), peak number 6 at 2913 cm−1 has a right shift of 10 wavenumbers, which is acceptable in IR measurements due to possible changes in the relative intensities of overlapping bands, rather than by the gradual frequency shift of a single band resulting from changes in the strength of molecular interactions [51].

3.3.2. PP Migration Traces in 4-Month-Old and 8-Month-Old Graviera Cheese

Initially, we measured all 4-month-old and 8-month-old Graviera cheese samples on Day 0 to understand if there was any overlap between the characteristic absorbance peaks of the cheese samples with the ones from the PP packaging. The absorbance peaks of PP are not present in these cheese spectrums, as shown in Figure 9a,b. Based on Table S4, only three PP Raman peaks (number 5, 6, and 9) started to appear from Day 3 to Day 21 for 4-month-old samples, and from Day 3 to Day 12 for 8-month-old samples. However, these are the most important absorbance peaks of PP. The disappearance of PP peaks is believed to be due to the biofilm that is created, as mentioned in Section 3.1. In both samples, (4-month-old and 8-month-old), peak number 6 at 1452 cm−1 has a right shift of 10 wavenumbers, which is acceptable in IR measurements due to possible changes in the relative intensities of overlapping bands, rather than by a gradual frequency shift of a single band resulting from changes in the strength of molecular interactions [51]. Finally, it is speculated that, in high wavenumber peaks, the PP peaks with red cycles in Figure 9 below have been replaced by 2854 cm−1 (blue dotted lines in Figure 9 below), while peak number 10 disappeared, due to overlapping bands, as presented in the relevant literature [51]. Also, from Day 3 until Day 21, in both samples (4- and 8-month-old), a peak of 1743 cm−1 appeared, which is the characteristic peak for degraded PP (black line) [52]. The above fact confirms that PP migrates from PP plastic packaging to the surface of the Graviera cheese samples.

4. Conclusions

In this work, we showed that LDPE and PP migration from food packaging occurs in Cretan Graviera (in two maturities, 4- and 8-month-old), while stored at refrigeration temperatures (7 °C). MPs from LDPE and PP packaging pouches were detected on Graviera cheese surfaces as early as starting from Day 3 of storage. We observed that LDPE is more prone to migration than PP, as detected by employing Raman and FTIR-ATR spectroscopy.
In particular, based on the Raman analysis, Graviera’s maturity does not affect polymer migration when it is stored in LDPE pouches. On the other hand, polymer migration is affected by Graviera’s maturity when it is stored in PP pouches. More specifically, we observed polymer migration in 4-month-old but not in 8-month-old Graviera samples, using Raman spectroscopy, based on the identification of PP Raman peaks and MPs. Even though some PP Raman peaks were detected, we did not manage to prove PP migration on the 8-month-old Graviera cheese samples using Raman spectroscopy. Raman peaks in both polymers distinctly appeared in the cheese samples in the early stages of the experiment, from Day 3 of storage.
With FTIR-ATR spectroscopy, plastic migration was identified early in the experimental period, on Day 3 in all samples, while in 4-month-old samples migration was detectable until Day 21. Plastic migration was also observed on Day 6 in 4-month-old and on Day 3 in the 8-month-old cheese samples. Moreover, LDPE peaks were clearly visible in both methods, in contrast to the PP peaks.
Finally, we proved that MPs migrate from LDPE and PP plastic packaging to the surface of Graviera cheese, using Raman and FTIR-ATR spectroscopy. In the case of PP, the migration is dependent on the maturity of the Graviera cheese. We suggest that PP and LDPE are not appropriate packaging materials for Cretan Graviera cheese, regardless of the cheese’s maturity. In addition, microbial growth is more prone to develop in LDPE pouches than in PP pouches, based on optical microscopy observations. We suggest storing Graviera cheese in glass containers to prevent MP migration.

Supplementary Materials

The following supporting information can be downloaded at: https://www.mdpi.com/article/10.3390/microplastics4020017/s1, Table S1: List of the major Raman peak assignments commonly found in cheese and LDPE; Table S2: List of the major Raman peak assignments commonly found in cheese and PP; Table S3: List of the major FTIR-ATR LDPE peaks and their assignments; Table S4: List of the major FTIR-ATR PP peaks and their assignments.

Author Contributions

Conceptualization and methodology, K.K., G.K. and V.M.P.; bibliographic investigation, K.K.; experimental characterization and analysis, K.K., G.K. and V.M.P.; manuscript reviewing, G.K., Z.V. and V.M.P.; funding acquisition, G.K. and V.M.P. All authors have read and agreed to the published version of the manuscript.

Funding

This work was financially supported by the Hellenic Foundation for Research and Innovation (HFRI) under the 4th Call for HFRI PhD Fellowships (Fellowship Number: 10660).

Institutional Review Board Statement

Not applicable.

Informed Consent Statement

Not applicable.

Data Availability Statement

All data reported here can be made available upon request.

Acknowledgments

Special thanks to Alexandros Patronidis for the English language review and corrections.

Conflicts of Interest

The authors declare that they have no known competing financial interests or personal relationships that could have appeared to influence the work reported in this paper.

References

  1. Kajla, P.; Sharma, A. Polymer Migration. 2018. Available online: https://www.researchgate.net/publication/327822021_Polymer_Migration (accessed on 26 January 2025).
  2. Arvanitoyannis, I.S.; Bosnea, L. Migration of substances from food packaging materials to foods. Crit. Rev. Food Sci. Nutr. 2004, 44, 63–76. [Google Scholar] [CrossRef] [PubMed]
  3. Montoille, L.; Morales Vicencio, C.; Fontalba, D.; Ortiz, J.A.; Moreno-Serna, V.; Peponi, L.; Matiacevich, S.; Zapata, P.A. Study of the effect of the addition of plasticizers on the physical properties of biodegradable films based on kefiran for potential application as food packaging. Food Chem. 2021, 360, 129966. [Google Scholar] [CrossRef]
  4. Bhunia, K.; Sablani, S.S.; Tang, J.; Rasco, B. Migration of Chemical Compounds from Packaging Polymers during Microwave, Conventional Heat Treatment, and Storage. Compr. Rev. Food Sci. Food Saf. 2013, 12, 523–545. [Google Scholar] [CrossRef]
  5. Katsara, K.; Kenanakis, G.; Viskadourakis, Z.; Papadakis, V.M. Polyethylene Migration from Food Packaging on Cheese Detected by Raman and Infrared (ATR/FT-IR) Spectroscopy. Materials 2021, 14, 3872. [Google Scholar] [CrossRef]
  6. Katsara, K.; Kenanakis, G.; Alissandrakis, E.; Papadakis, V.M. Honey Quality and Microplastic Migration from Food Packaging: A Potential Threat for Consumer Health? Microplastics 2022, 1, 406–427. [Google Scholar] [CrossRef]
  7. Fasihnia, S.H.; Peighambardoust, S.H.; Peighambardoust, S.J.; Oromiehie, A.; Soltanzadeh, M.; Peressini, D. Migration analysis, antioxidant, and mechanical characterization of polypropylene-based active food packaging films loaded with BHA, BHT, and TBHQ. J. Food Sci. 2020, 85, 2317–2328. [Google Scholar] [CrossRef] [PubMed]
  8. Katsara, K.; Viskadourakis, Z.; Alissandrakis, E.; Kountourakis, N.; Kenanakis, G.; Papadakis, V.M. Microplastics’ Detection in Honey: Development of Protocols in a Simulation. Appl. Sci. 2024, 14, 4720. [Google Scholar] [CrossRef]
  9. Katsara, K.; Kenanakis, G.; Alissandrakis, E.; Papadakis, V.M. Low-Density Polyethylene Migration from Food Packaging on Cured Meat Products Detected by Micro-Raman Spectroscopy. Microplastics 2022, 1, 428–439. [Google Scholar] [CrossRef]
  10. MATERIALS, I.A. Cheese Manufacturing and Processing Materials (NAICS 311513). Available online: https://interstateam.com/cheese-manufacturing-processing-materials (accessed on 27 June 2024).
  11. Govari, M.; Iliadis, S.; Papageorgiou, D.; Fletouris, D. Lipid and protein oxidation of grated Kefalotyri cheese packaged in vacuum or modified atmosphere and stored under retail display conditions. Int. Dairy J. 2022, 131, 105369. [Google Scholar] [CrossRef]
  12. Giri, S.; Lamichhane, G.; Khadka, D.; Devkota, H.P. Microplastics contamination in food products: Occurrence, analytical techniques and potential impacts on human health. Curr. Res. Biotechnol. 2024, 7, 100190. [Google Scholar] [CrossRef]
  13. Gambino, I.; Bagordo, F.; Grassi, T.; Panico, A.; De Donno, A. Occurrence of Microplastics in Tap and Bottled Water: Current Knowledge. Int. J. Environ. Res. Public Health 2022, 19, 5283. [Google Scholar] [CrossRef]
  14. Yu, C.; Takhistov, P.; Alocilja, E.; de Corcuera, J.R.; Frey, M.W.; Gomes, C.L.; Mao, Y.J.; McLamore, E.S.; Lin, M.; Tsyusko, O.V.; et al. Bioanalytical approaches for the detection, characterization, and risk assessment of micro/nanoplastics in agriculture and food systems. Anal. Bioanal. Chem. 2022, 414, 4591–4612. [Google Scholar] [CrossRef]
  15. Aly, S.S.H. Studying the Migration of Plasticizers from Plastic Packaging to Local Processed Cheese. Middle East J. Appl. Sci. 2016, 6, 957–963. [Google Scholar]
  16. Chiesa, L.M.; Panseri, S.; Soncin, S.; Vallone, L.; Dragoni, I. Determination of styrene content in Gorgonzola PDO cheese by headspace solid phase micro-extraction (HS-SPME) and gas-chromatography mass-spectrometry (GC-MS). Veter- Res. Commun. 2010, 34 (Suppl. S1), S167–S170. [Google Scholar] [CrossRef]
  17. Wang, Q.; Storm, B. Migration Study of Polypropylene (PP) Oil Blends in Food Simulants. Macromol. Symp. 2006, 242, 307–314. [Google Scholar] [CrossRef]
  18. Pappa, E.C.; Kondyli, E. Descriptive Characteristics and Cheesemaking Technology of Greek Cheeses Not Listed in the EU Geographical Indications Registers. Dairy 2023, 4, 43–67. [Google Scholar] [CrossRef]
  19. Hartmann, K.; Licitra, G.; Eugster-Meier, E.; Fröhlich-Wyder, M.-T.; Jakob, E.; Wechsler, D.; Maubois, J.L.; Karatzas, K.-A.G.; Bintsis, T.; Alichanidis, E.; et al. Hard Cheeses. In Global Cheesemaking Technology; Wiley: Hoboken, NJ, USA, 2017; pp. 204–246. [Google Scholar]
  20. Danezis, G.; Theodorou, C.; Massouras, T.; Zoidis, E.; Hadjigeorgiou, I.; Georgiou, C.A. Greek Graviera Cheese Assessment through Elemental Metabolomics—Implications for Authentication, Safety and Nutrition. Molecules 2019, 24, 670. [Google Scholar] [CrossRef]
  21. Arvanitoyannis, I.S.; Kargaki, G.K.; Hadjichristodoulou, C. Effect of several MAP compositions on the microbiological and sensory properties of Graviera cheese. Anaerobe 2011, 17, 310–314. [Google Scholar] [CrossRef]
  22. Mexis, S.F.; Chouliara, E.; Kontominas, M.G. Quality Evaluation of Grated Graviera Cheese Stored at 4 and 12 °C using Active and Modified Atmosphere Packaging. Packag. Technol. Sci. 2011, 24, 15–29. [Google Scholar] [CrossRef]
  23. McSweeney, P.L.H. Biochemistry of cheese ripening. Int. J. Dairy Technol. 2004, 57, 127–144. [Google Scholar] [CrossRef]
  24. Ioannidou, M.D.; Maggira, M.; Samouris, G. Physicochemical Characteristics, Fatty Acids Profile and Lipid Oxidation during Ripening of Graviera Cheese Produced with Raw and Pasteurized Milk. Foods 2022, 11, 2138. [Google Scholar] [CrossRef] [PubMed]
  25. Solomakos, N.; Govari, M.; Botsoglou, E.; Pexara, A. Effect of modified atmosphere packaging on physicochemical and microbiological characteristics of Graviera Agraphon cheese during refrigerated storage. J. Dairy Res. 2019, 86, 483–489. [Google Scholar] [CrossRef] [PubMed]
  26. Smith, G.P.; Holroyd, S.E.; Reid, D.C.W.; Gordon, K.C. Raman imaging processed cheese and its components. J. Raman Spectrosc. 2016, 48, 374–383. [Google Scholar] [CrossRef]
  27. Burdikova, Z.; Svindrych, Z.; Hickey, C.; Wilkinson, M.G.; Auty, M.A.E.; Samek, O.; Bernatova, S.; Krzyzanek, V.; Periasamy, A.; Sheehan, J.J. Application of advanced light microscopic techniques to gain deeper insights into cheese matrix physico-chemistry. Dairy Sci. Technol. 2015, 95, 687–700. [Google Scholar] [CrossRef]
  28. Oliveira Kde, S.; Callegaro Lde, S.; Stephani, R.; Almeida, M.R.; de Oliveira, L.F. Analysis of spreadable cheese by Raman spectroscopy and chemometric tools. Food Chem. 2016, 194, 441–446. [Google Scholar] [CrossRef]
  29. Talari, A.C.S.; Movasaghi, Z.; Rehman, S.; Rehman, I.u. Raman Spectroscopy of Biological Tissues. Appl. Spectrosc. Rev. 2015, 50, 46–111. [Google Scholar] [CrossRef]
  30. da Silva, D.J.; Parra, D.F.; Wiebeck, H. Applying confocal Raman spectroscopy and different linear multivariate analyses to sort polyethylene residues. Chem. Eng. J. 2021, 426, 131344. [Google Scholar] [CrossRef]
  31. Sato, H.; Shimoyama, M.; Kamiya, T.; Amari, T.; Aic, S.; Ninomiya, T.; Siesler, H.W.; Ozaki, Y. Raman spectra of high-density, low-density, and linear low-density polyethylene pellets and prediction of their physical properties by multivariate data analysis. J. Appl. Polym. Sci. 2002, 86, 443–448. [Google Scholar] [CrossRef]
  32. Banquet-Teran, J.; Johnson-Restrepo, B.; Hernandez-Morelo, A.; Ropero, J.; Fontalvo-Gomez, M.; Romanach, R.J. Linear and Nonlinear Calibration Methods for Predicting Mechanical Properties of Polypropylene Pellets Using Raman Spectroscopy. Appl. Spectrosc. 2016, 70, 1118–1127. [Google Scholar] [CrossRef] [PubMed]
  33. Dorota, P.; Malgorzata, C. Raman Spectroscopy in the Analysis of Textile Structures. In Recent Developments in Atomic Force Microscopy and Raman Spectroscopy for Materials Characterization; Chandra Shakher, P., Samir, K., Eds.; IntechOpen: Rijeka, Croatia, 2021; Chapter 9. [Google Scholar]
  34. Ferchichi, S.; Sheibat-Othman, N.; Boyron, O.; Bonnin, C.; Norsic, S.; Rey-Bayle, M.; Monteil, V. In situ dissolved polypropylene prediction by Raman and ATR-IR spectroscopy for its recycling. Anal. Methods 2024, 16, 3109–3117. [Google Scholar] [CrossRef]
  35. Furukawa, T.; Sato, H.; Kita, Y.; Matsukawa, K.; Yamaguchi, H.; Ochiai, S.; Siesler, H.; Ozaki, Y. Molecular Structure, Crystallinity and Morphology of Polyethylene/Polypropylene Blends Studied by Raman Mapping, Scanning Electron Microscopy, Wide Angle X-Ray Diffraction, and Differential Scanning Calorimetry. Polym. J. 2006, 38, 1127–1136. [Google Scholar] [CrossRef]
  36. Gopanna, A.; Mandapati, R.N.; Thomas, S.P.; Rajan, K.; Chavali, M. Fourier transform infrared spectroscopy (FTIR), Raman spectroscopy and wide-angle X-ray scattering (WAXS) of polypropylene (PP)/cyclic olefin copolymer (COC) blends for qualitative and quantitative analysis. Polym. Bull. 2019, 76, 4259–4274. [Google Scholar] [CrossRef]
  37. Guo, X.; Lin, Z.; Wang, Y.; He, Z.; Wang, M.; Jin, G. In-Line Monitoring the Degradation of Polypropylene under Multiple Extrusions Based on Raman Spectroscopy. Polymers 2019, 11, 1698. [Google Scholar] [CrossRef]
  38. Xiang, T.; Sun, Y.; Ding, D.; Yao, W.; Yu, Z.; Xie, Y. Microscopic Raman-based rapid detection of submicron/nano polypropylene plastics in tea and tea beverages. Food Chem. 2024, 454, 139657. [Google Scholar] [CrossRef]
  39. Zhang, Z.-Y. Rapid Discrimination of Cheese Products Based on Probabilistic Neural Network and Raman Spectroscopy. J. Spectrosc. 2020, 2020, 8896535. [Google Scholar] [CrossRef]
  40. Koca, N.; Rodriguez-Saona, L.E.; Harper, W.J.; Alvarez, V.B. Application of Fourier transform infrared spectroscopy for monitoring short-chain free fatty acids in Swiss cheese. J. Dairy Sci. 2007, 90, 3596–3603. [Google Scholar] [CrossRef]
  41. Leite, A.I.N.; Pereira, C.G.; Andrade, J.; Vicentini, N.M.; Bell, M.J.V.; Anjos, V. FTIR-ATR spectroscopy as a tool for the rapid detection of adulterations in butter cheeses. LWT 2019, 109, 63–69. [Google Scholar] [CrossRef]
  42. Pax, A.P.; Ong, L.; Vongsvivut, J.; Tobin, M.J.; Kentish, S.E.; Gras, S.L. The characterisation of Mozzarella cheese microstructure using high resolution synchrotron transmission and ATR-FTIR microspectroscopy. Food Chem. 2019, 291, 214–222. [Google Scholar] [CrossRef]
  43. Martín-Del-Campo, S.; Picque, D.; Cosío-Ramírez, R.; Corrieu, G. Middle infrared spectroscopy characterization of ripening stages of Camembert-type cheeses. Int. Dairy J. 2007, 17, 835–845. [Google Scholar]
  44. Phan, S.; Padilla-Gamiño, J.L.; Luscombe, C.K. The effect of weathering environments on microplastic chemical identification with Raman and IR spectroscopy: Part I. polyethylene and polypropylene. Polym. Test. 2022, 116, 107752. [Google Scholar] [CrossRef]
  45. Cheruthazhekatt, S.; Pijpers, T.F.; Mathot, V.B.; Pasch, H. Combination of TREF, high-temperature HPLC, FTIR and HPer DSC for the comprehensive analysis of complex polypropylene copolymers. Anal. Bioanal. Chem. 2013, 405, 8995–9007. [Google Scholar] [CrossRef]
  46. Lin, J.H.; Pan, Y.J.; Liu, C.F.; Huang, C.L.; Hsieh, C.T.; Chen, C.K.; Lin, Z.I.; Lou, C.W. Preparation and Compatibility Evaluation of Polypropylene/High Density Polyethylene Polyblends. Materials 2015, 8, 8850–8859. [Google Scholar] [CrossRef]
  47. Tian, N.; Lv, R.; Na, B.; Xu, W.; Li, Z. Molecular origin of enhanced strength in the monofilament of syndiotactic polypropylene because of annealing: A micro-FTIR study. J. Phys. Chem. B 2009, 113, 14920–14924. [Google Scholar] [CrossRef] [PubMed]
  48. Subramanian, A.; Harper, W.J.; Rodriguez-Saona, L.E. Cheddar cheese classification based on flavor quality using a novel extraction method and Fourier transform infrared spectroscopy. J. Dairy Sci. 2009, 92, 87–94. [Google Scholar] [CrossRef] [PubMed]
  49. Pinzone, M.; Nordøy, E.; Eppe, G.; Malherbe, C.; Das, K.; Collard, F. First record of plastic debris in the stomach of a hooded seal pup from the Greenland Sea. Mar. Pollut. Bull. 2021, 167, 112350. [Google Scholar] [CrossRef] [PubMed]
  50. Samelis, J.; Bleicher, A.; Delbes-Paus, C.; Kakouri, A.; Neuhaus, K.; Montel, M.C. FTIR-based polyphasic identification of lactic acid bacteria isolated from traditional Greek Graviera cheese. Food Microbiol. 2011, 28, 76–83. [Google Scholar] [CrossRef]
  51. Ryu, S.R.; Noda, I.; Jung, Y.M. What is the origin of positional fluctuation of spectral features: True frequency shift or relative intensity changes of two overlapped bands? Appl. Spectrosc. 2010, 64, 1017–1021. [Google Scholar] [CrossRef]
  52. Blinco, J. The Synthesis and Application of Novel Profluorescent Nitroxides as Probes for Polymer Degradation. Ph.D. Thesis, Queensland University of Technology, Brisbane, Australia, 2008. [Google Scholar]
Figure 1. Sample preparation and measurement process. (a) Cheese cutting; (b) vacuum sealing of the Graviera sample into its plastic packaging; (c) sealed plastic packages including the Graviera samples; (d) control Day 0 samples on the microscopic slide; (e) temperature stabilization stage with the samples under the Raman microscope; (f) the ATR press.
Microplastics 04 00017 g001
Figure 2. (a) Raman spectrum of LDPE; (b) Raman spectrum of PP.
Microplastics 04 00017 g002
Figure 3. (a) Absorbance spectrum of LDPE; (b) Absorbance spectrum of PP.
Microplastics 04 00017 g003
Figure 4. (a) Bright-field optical microscope picture of 4-month-old Graviera cheese sample on Day 9, stored in LDPE pouch; (b) Bright-field, optical microscope picture of 8-month-old Graviera cheese sample on Day 18, stored in LDPE pouch; (c) PP pouch of 8-month-old Graviera at Day 12 with microbial growth; (d) Bright-field picture of 8-month-old Graviera cheese sample from Raman microscope at Day 21, stored in PP pouch; (e) LDPE pouch of 8-month-old Graviera at Day 21. In the red circles, some fibers of microbial growth are depicted in the Section 3.2.
Microplastics 04 00017 g004
Figure 5. (a) Raman spectra of 4-month-old Graviera cheese on different days, in comparison with LDPE spectrum; (b) Raman spectra of 8-month-old Graviera cheese on different days, in comparison with LDPE spectrum. In both subfigures, all spectra from Day 3 are original spectra subtracted by the Day 0 spectrum. Spectra are presented in a stack-line format, with an offset between them, to present the full spectral details in each sample. For this reason, the intensity axis is in arbitrary units. The red lines depict the important Raman peaks for MP migration, while the dotted lines show the days those peaks are present.
Microplastics 04 00017 g005
Figure 6. (a) Raman spectra of 4-month-old Graviera cheese on different days, in comparison with PP spectrum; (b) Raman spectra of 8-month-old Graviera cheese on different days, in comparison with PP spectrum. In both subfigures, all spectra from Day 3 are original spectra subtracted by the Day 0 spectrum. Spectra are presented in a stack-line format, with an offset between them, to present the full spectral details in each sample. For this reason, the intensity axis is in arbitrary units. The red lines depict the important Raman peaks for MP migration, while the dotted lines show the days that those peaks are present.
Microplastics 04 00017 g006
Figure 7. (a) LDPE MPs found in Graviera cheese samples; (b) example of a 5 μm LDPE MP; (c) PP MPs found in Graviera cheese samples; (d) example of a 5 μm PP MP. The red lines depict the important Raman peaks for MP migration.
Microplastics 04 00017 g007
Figure 8. (a) FTIR-ATR spectra of 4-month-old Graviera cheese on different days, in comparison with LDPE spectrum; (b) FTIR-ATR spectra of 8-month-old Graviera cheese on different days, in comparison with LDPE spectrum. In both subfigures, spectra are presented in a stack-line format, with an offset between them, to present the full spectral details in each sample. For this reason, the intensity axis is in arbitrary units. The red lines depict the important absorbance peaks for MP migration, while the dotted lines show the days those peaks are present.
Microplastics 04 00017 g008
Figure 9. (a) FTIR-ATR spectra of 4-month-old Graviera cheese on different days, in comparison with PP spectrum; (b) FTIR-ATR spectra of 8-month-old Graviera cheese on different days, in comparison with PP spectrum. In both subfigures, spectra are presented in a stack-line format, with an offset between them, to present the full spectral details in each sample. For this reason, the intensity axis is in arbitrary units. The red lines depict the important absorbance peaks for MP migration, while the dotted lines show the days that those peaks are present.
Microplastics 04 00017 g009
Disclaimer/Publisher’s Note: The statements, opinions and data contained in all publications are solely those of the individual author(s) and contributor(s) and not of MDPI and/or the editor(s). MDPI and/or the editor(s) disclaim responsibility for any injury to people or property resulting from any ideas, methods, instructions or products referred to in the content.

