Cell Responses to Simulated Microgravity and Hydrodynamic Stress Can Be Distinguished by Comparative Transcriptomics
Abstract
:1. Introduction
2. Materials and Methods
2.1. Mouse Primary T Cells Isolation
2.2. Cultured Human T Cells
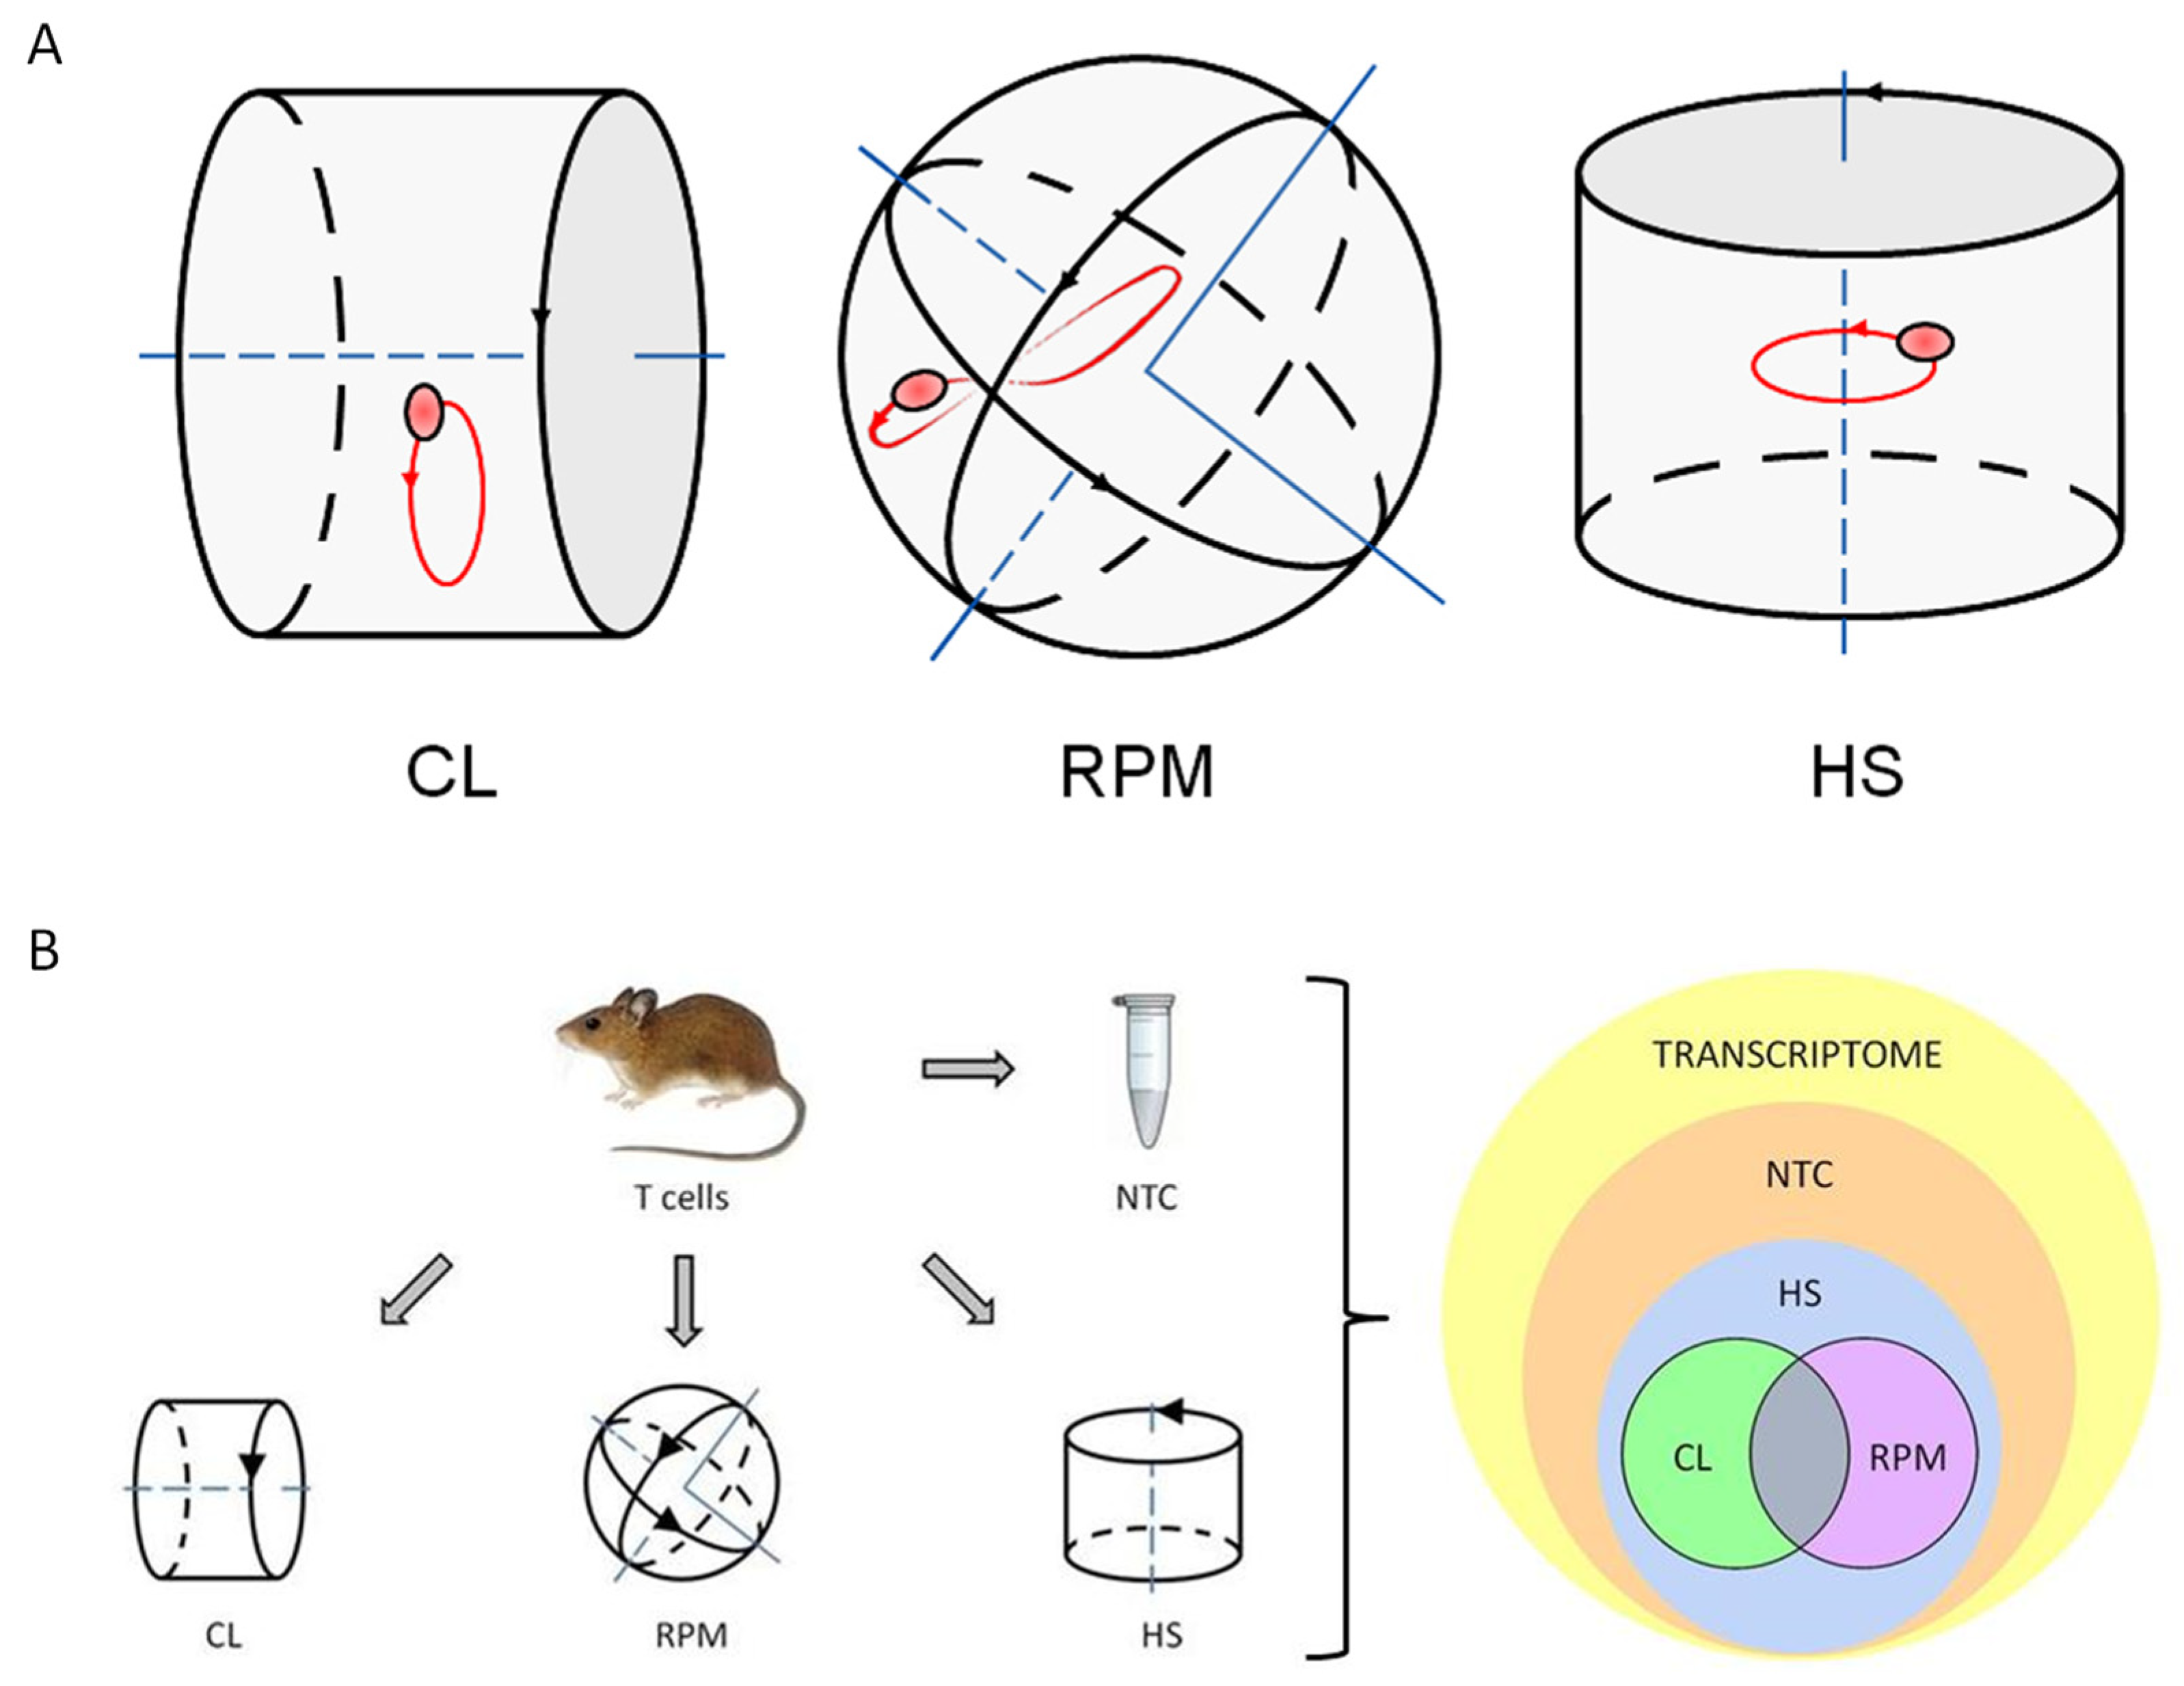
2.3. Experimental Platforms
2.4. RNA Extraction
2.5. Real-Time qPCR-Based Gene Expression Profiling
2.6. RNA-Seq and Bioinformatic Analysis
3. Results
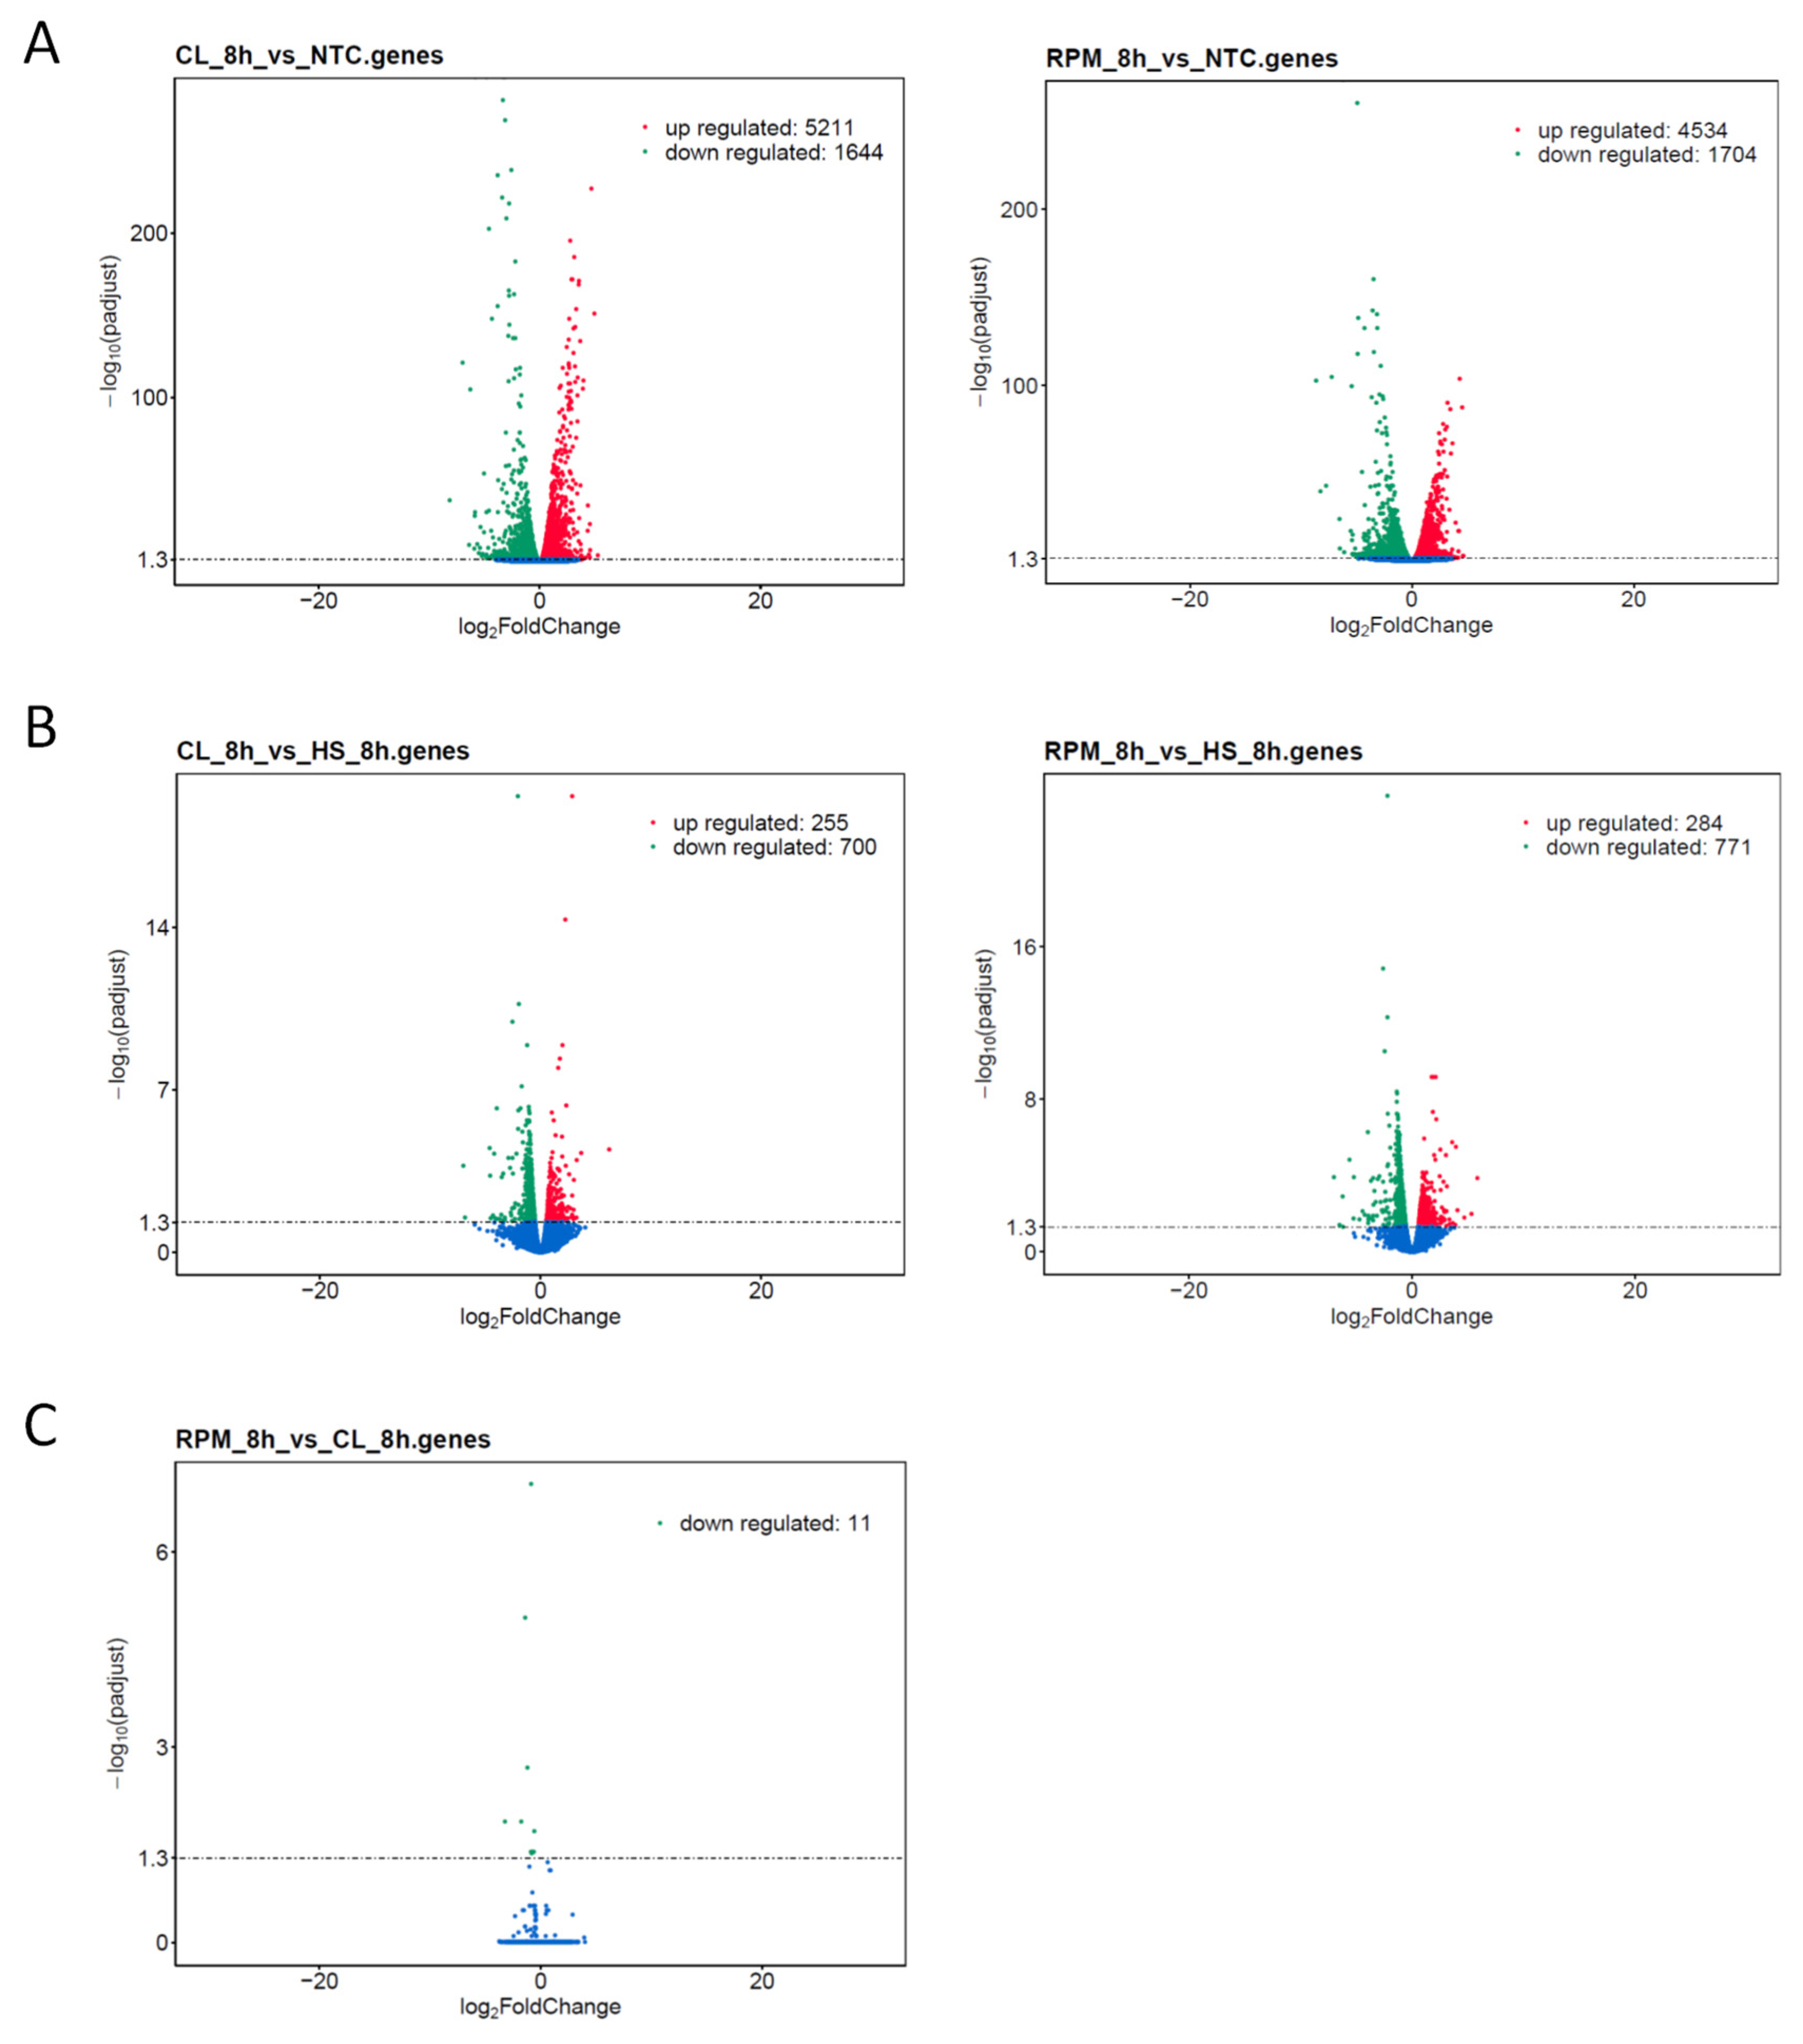
3.1. RNA-Seq
3.1.1. Transcript Distribution and Gene Expression Pattern
3.1.2. Gene Ontology
3.1.3. Co-Expression DEG Analysis
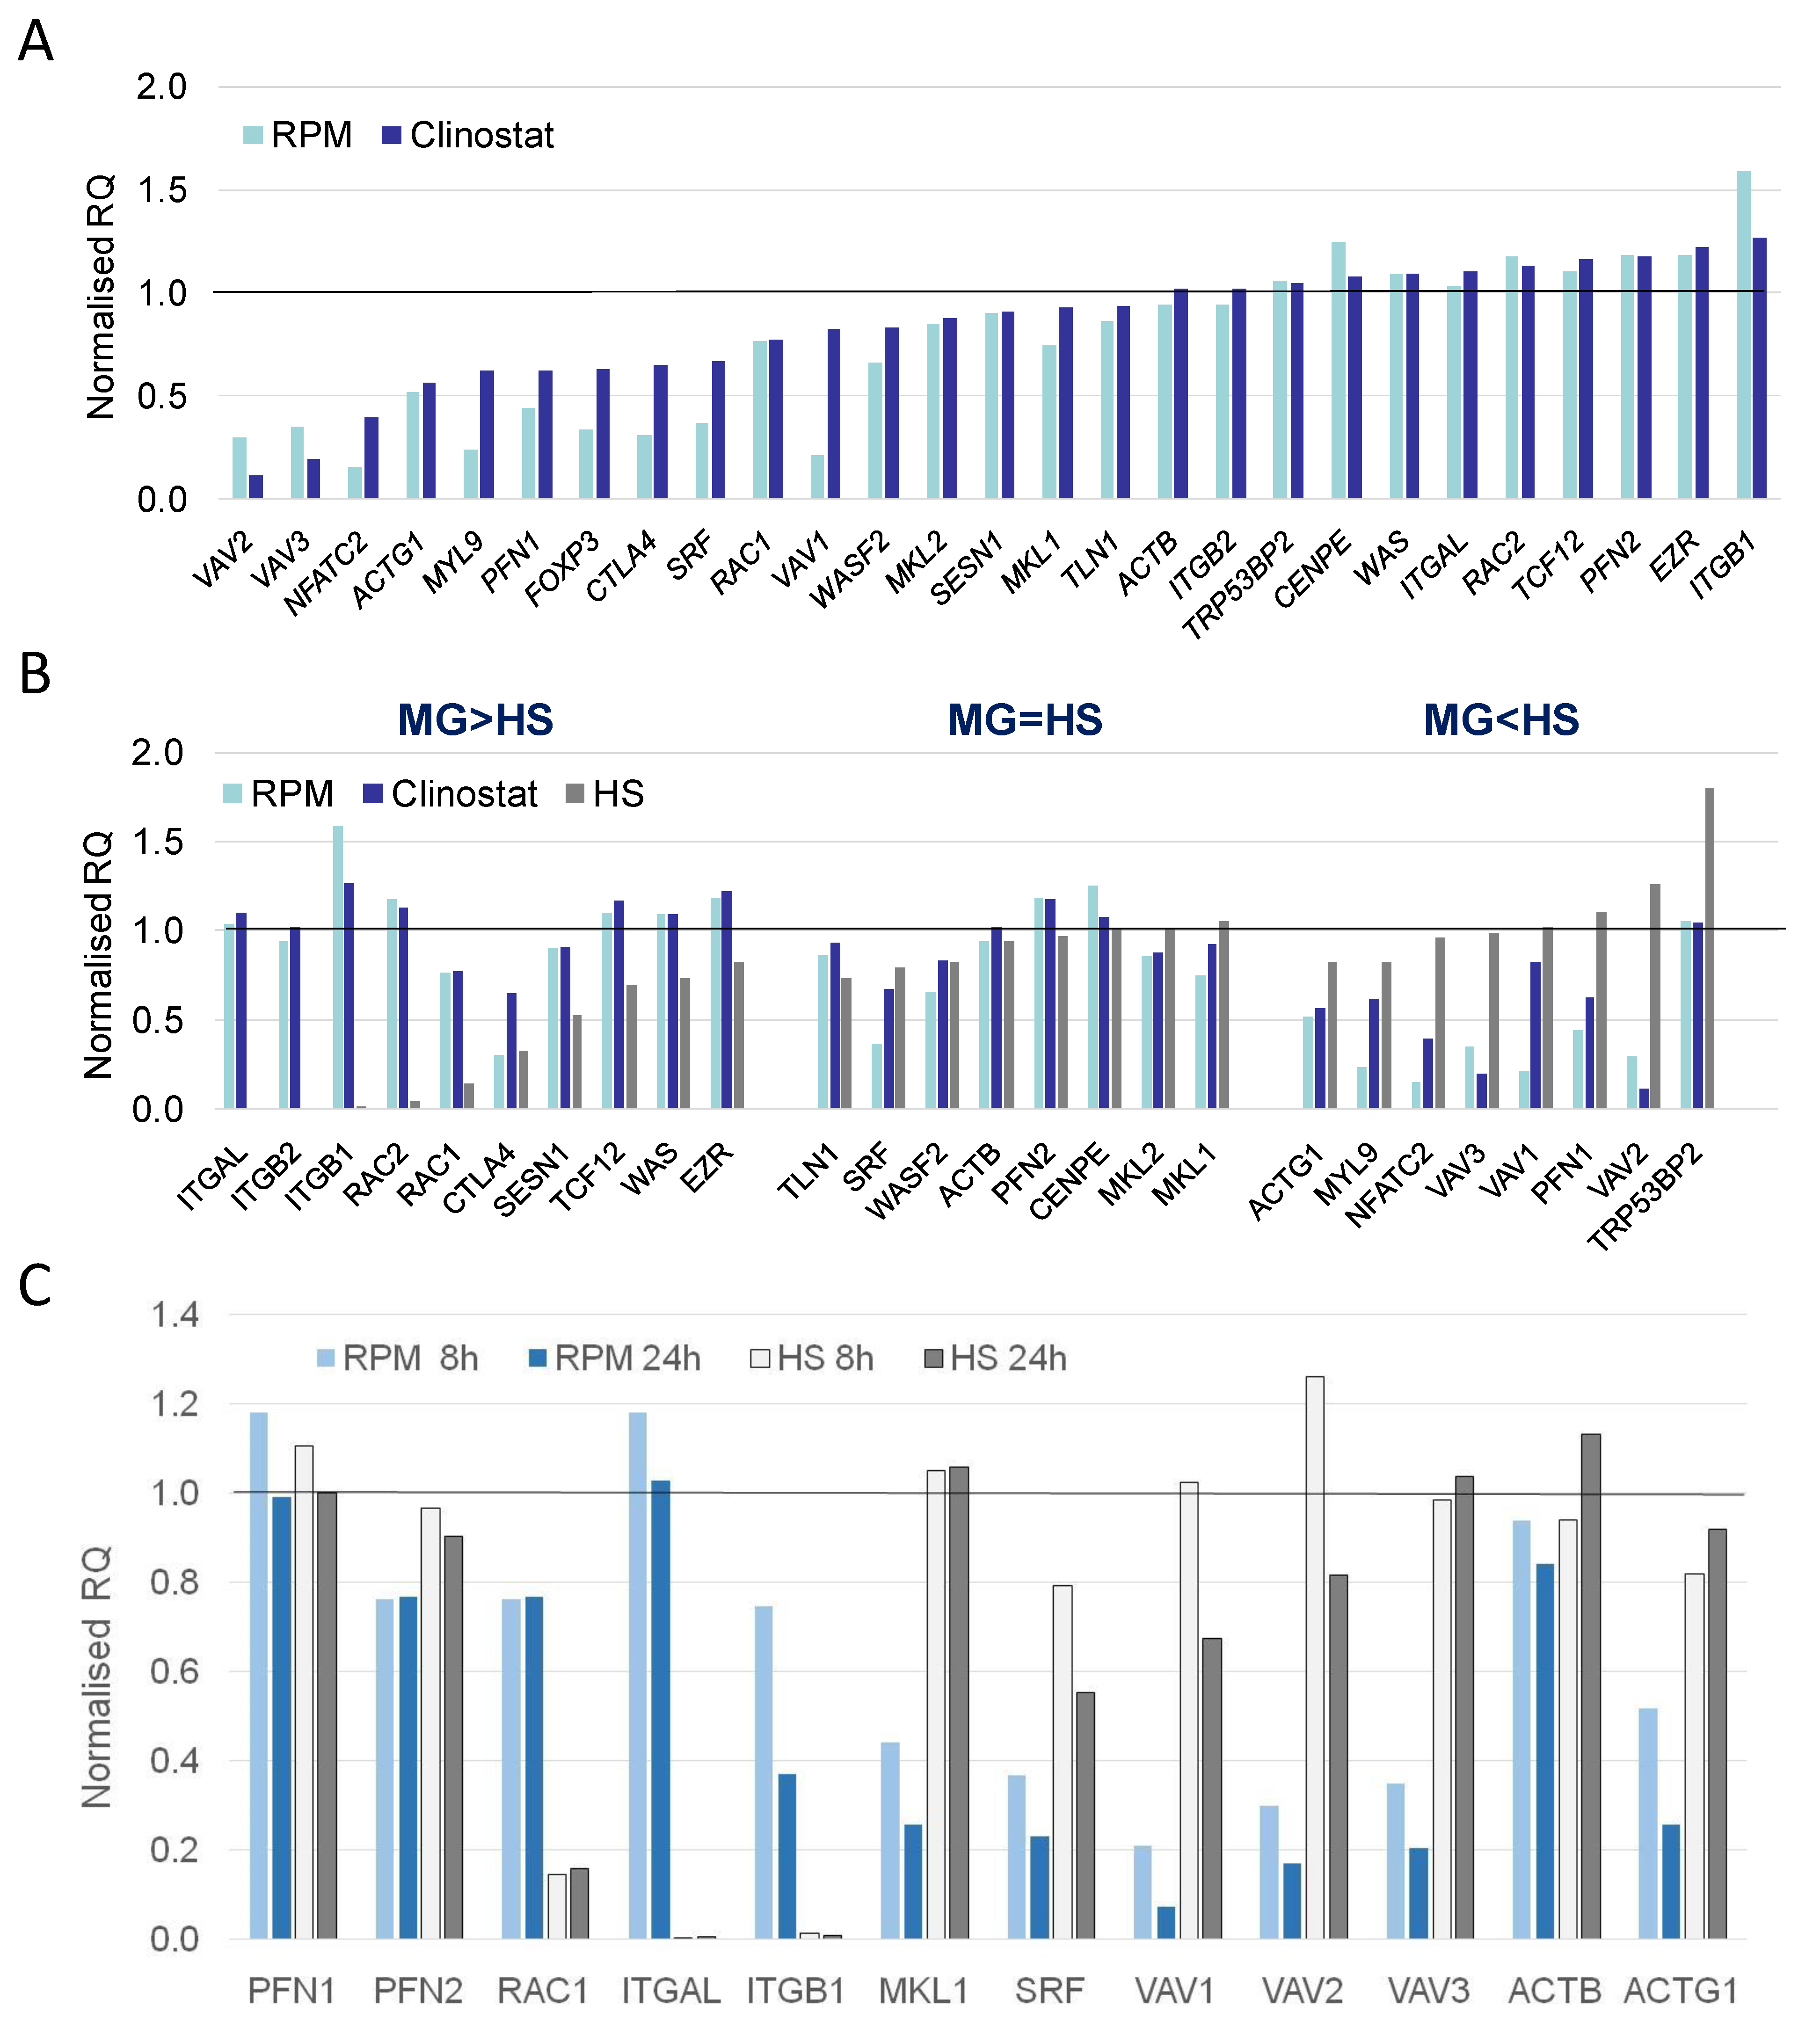
3.2. Real-Time qPCR DEG Analysis
4. Discussion
Supplementary Materials
Funding
Informed Consent Statement
Data Availability Statement
Acknowledgments
Conflicts of Interest
Appendix A
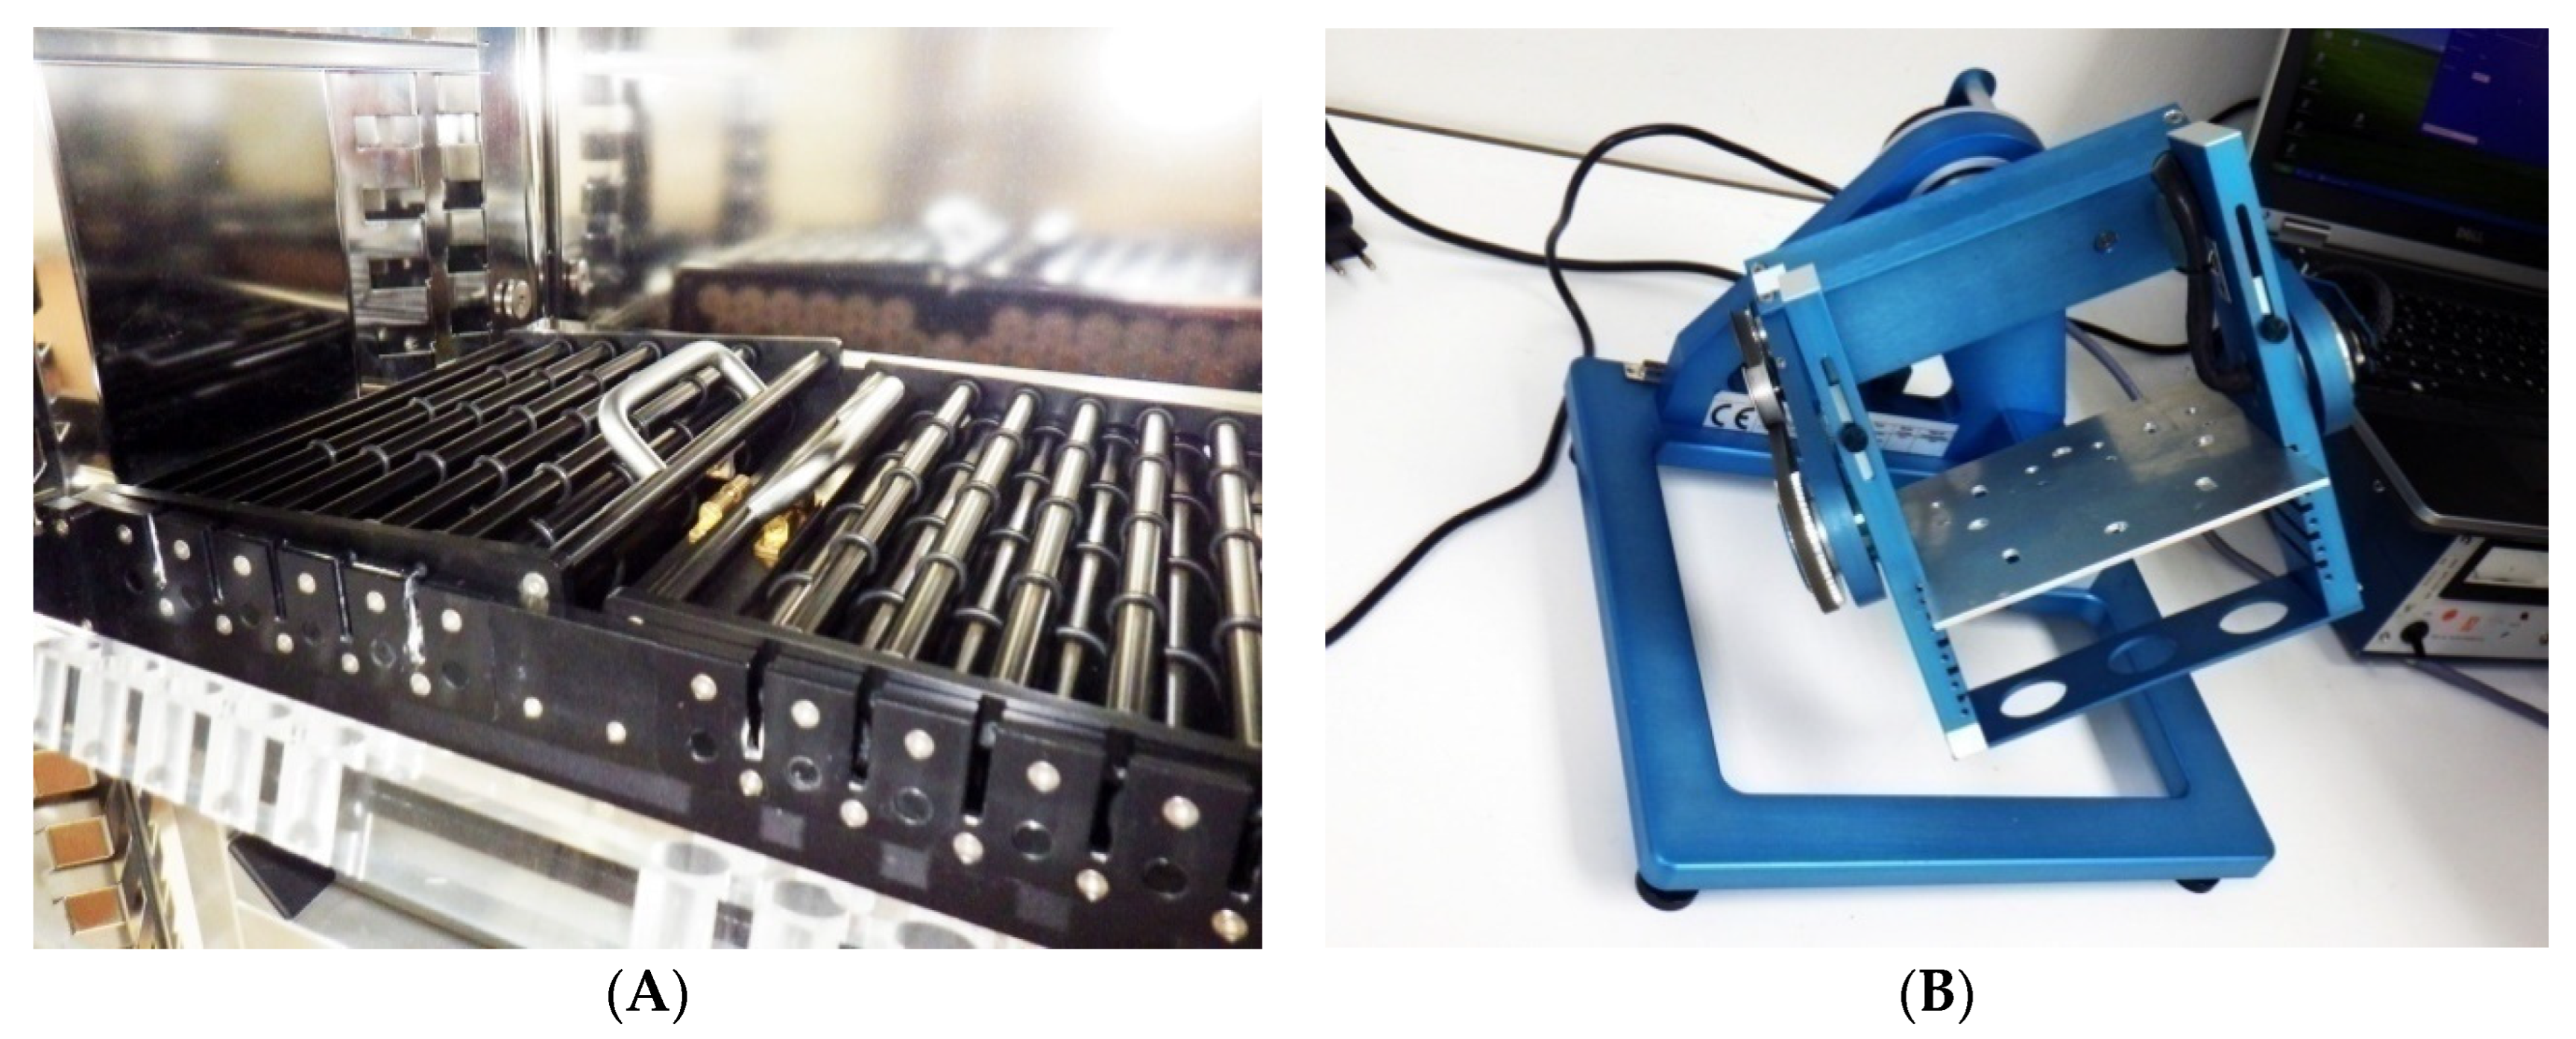
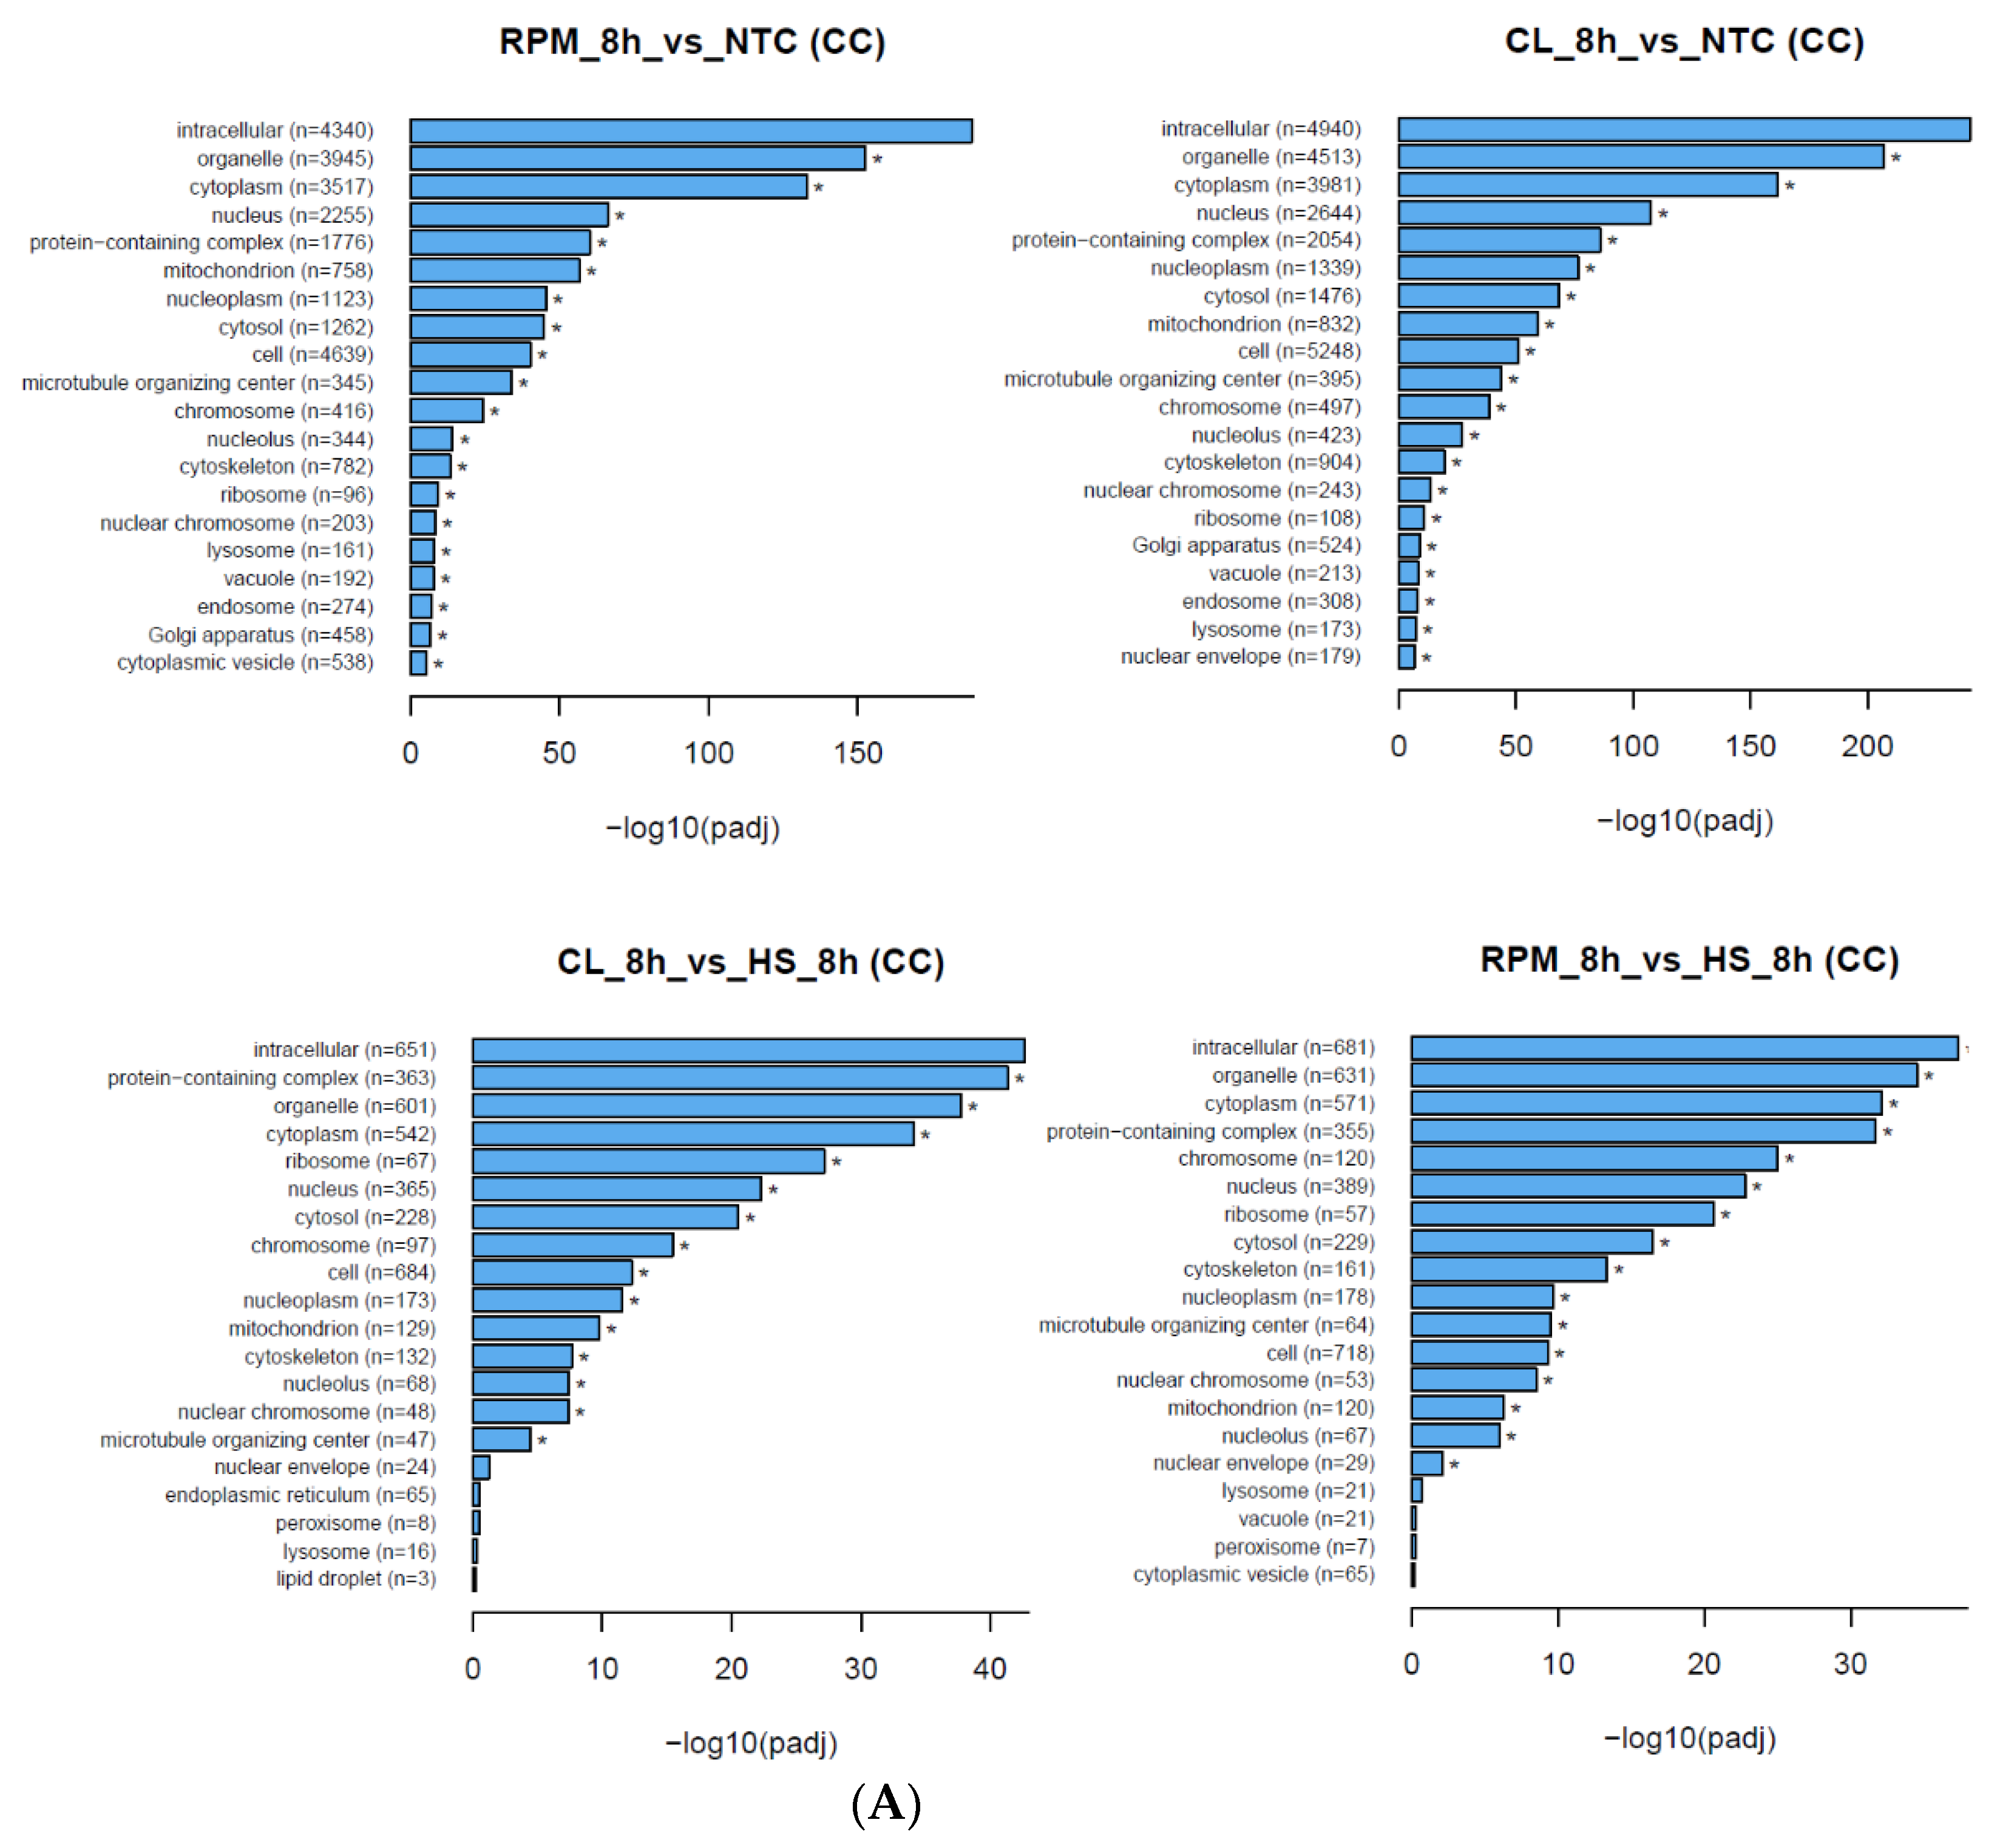
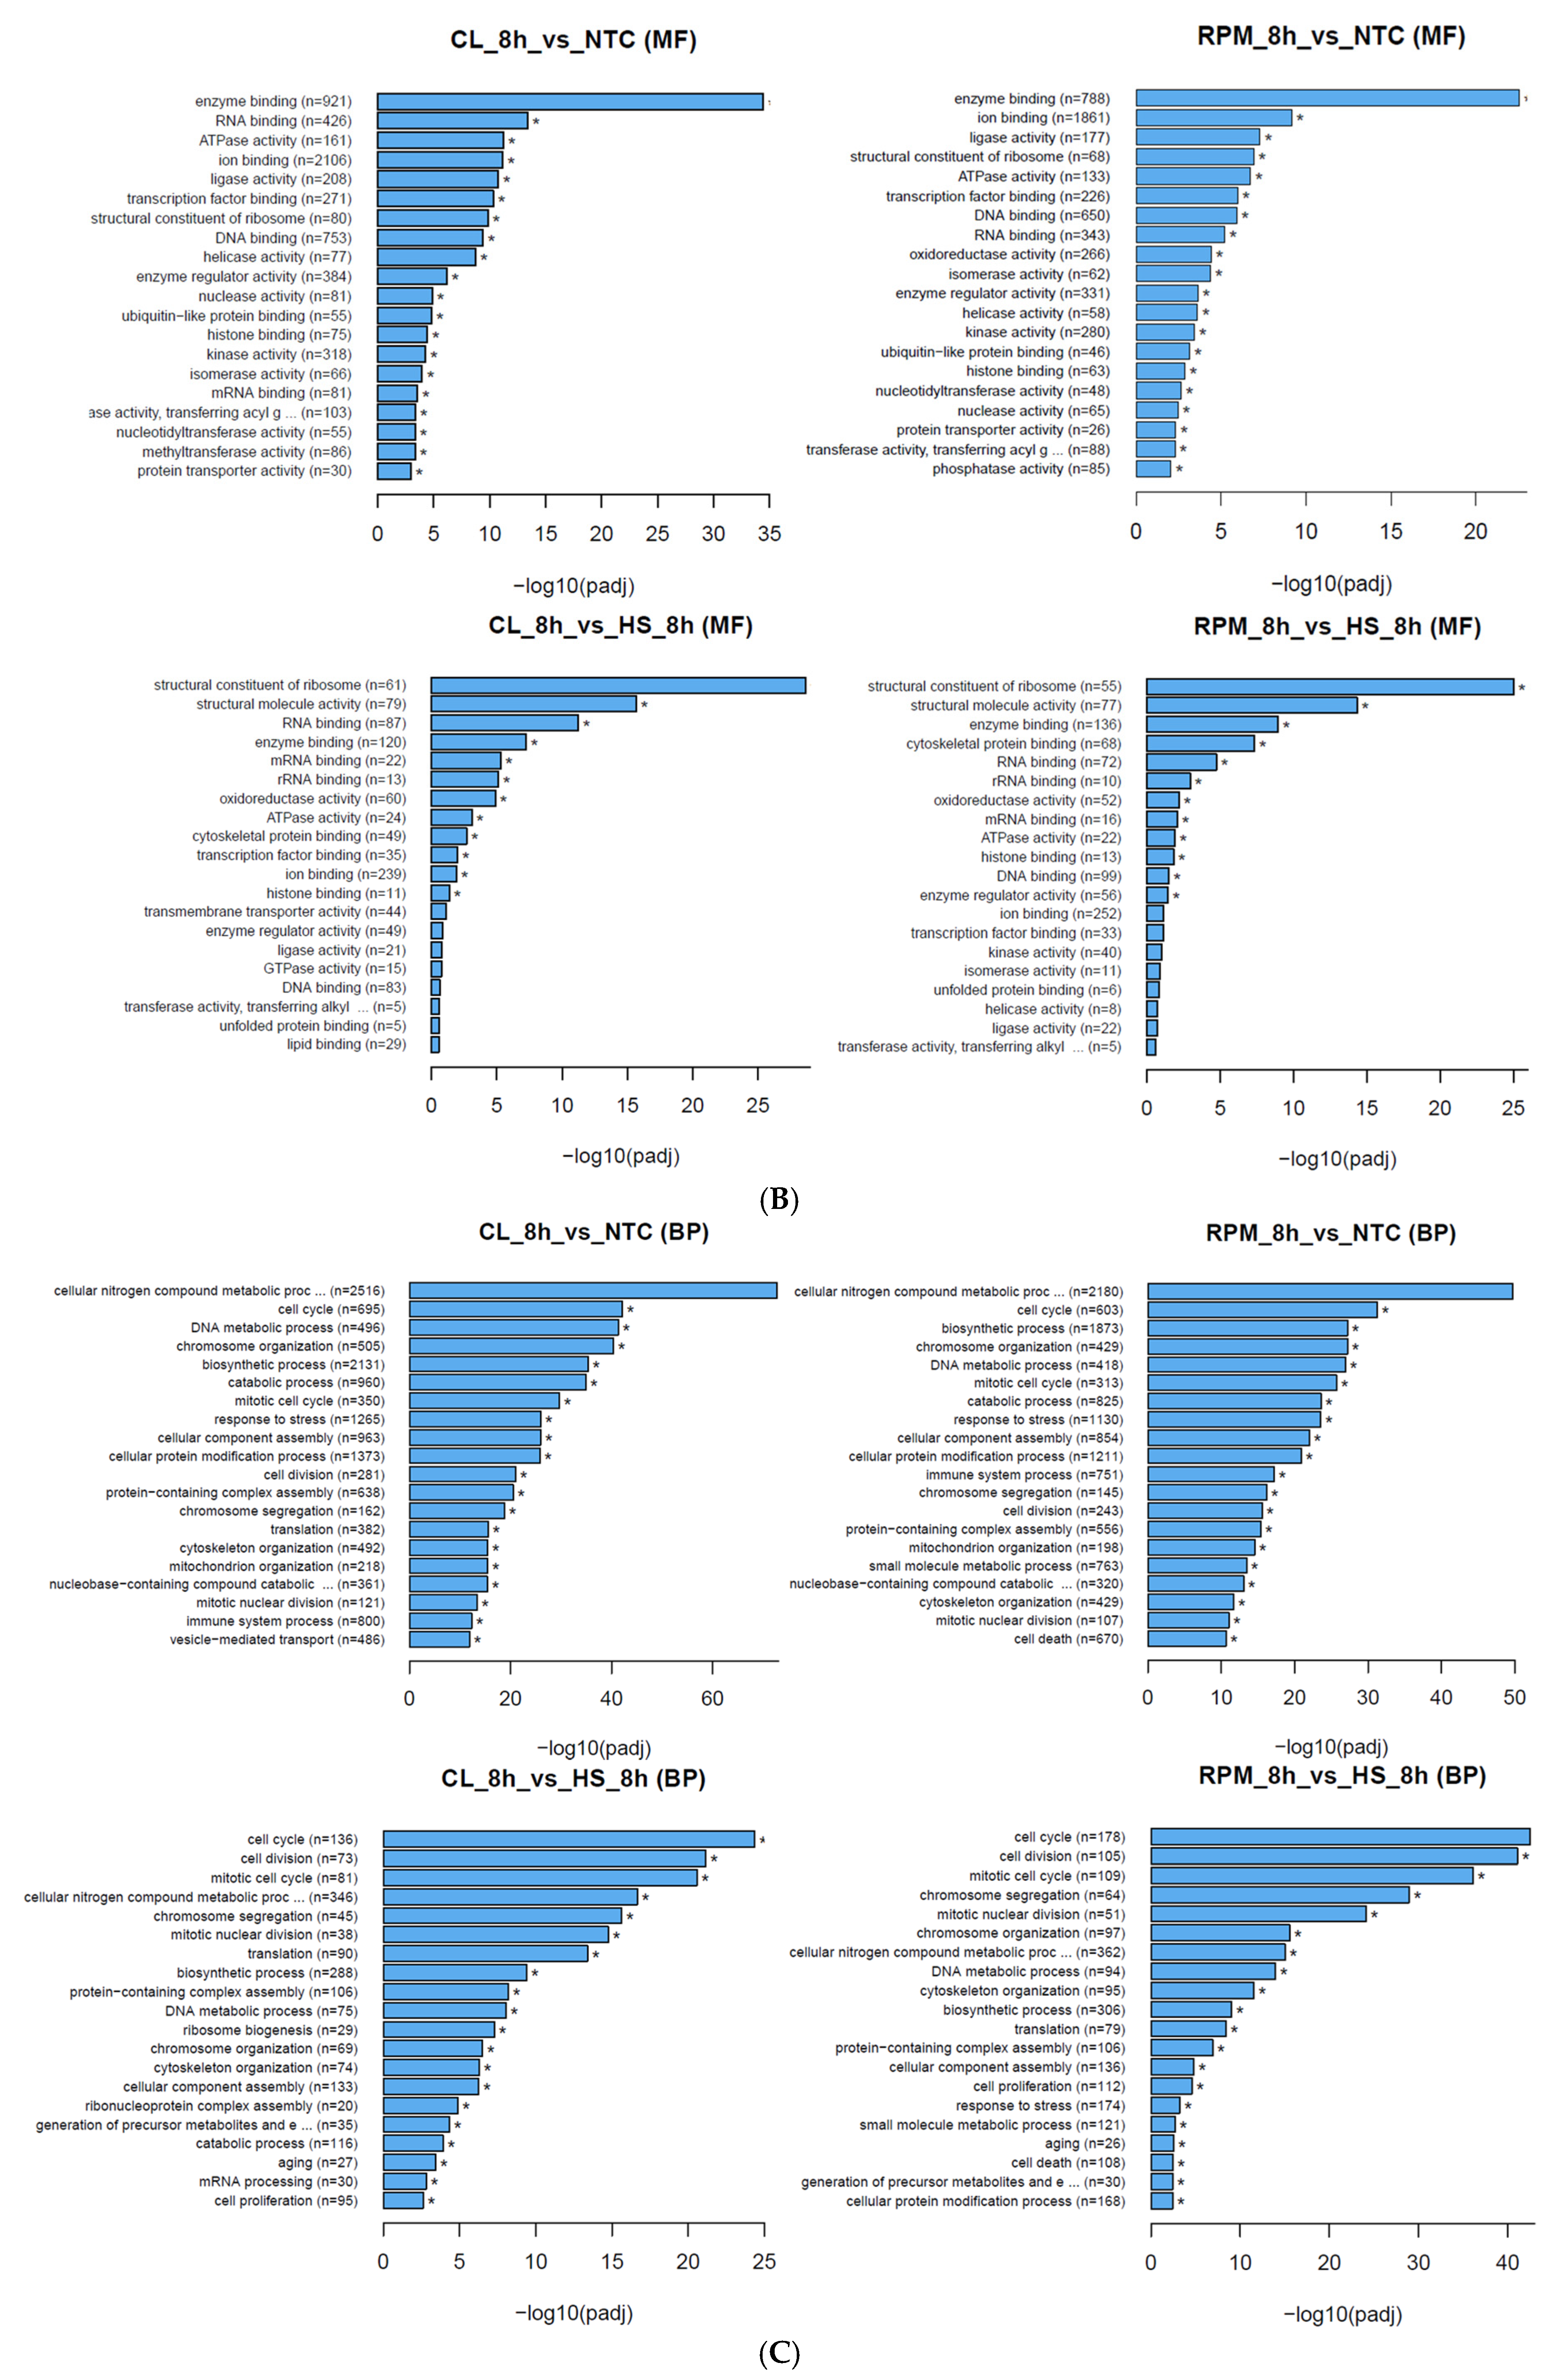
Appendix B
| GO Category | GO Term ID | Description | Count, RPM vs. HS, 8 h | Count, CL vs. HS, 8 h | p-Value, RPM vs. HS, 8 h | p-Value, CL vs. HS, 8 h |
|---|---|---|---|---|---|---|
| CC | 0043226 | organelle | 631 | 601 | 1.0982 × 10−36 | 4.1886 × 10−40 |
| CC | 0005737 | cytoplasm | 571 | 542 | 3.4794 × 10⁻³⁴ | 2.6777 × 10−36 |
| CC | 0005634 | nucleus | 389 | 365 | 1.5571 × 10⁻²⁴ | 3.0424 × 10⁻²⁴ |
| CC | 0032991 | protein-containing complex | 355 | 363 | 1.001 × 10⁻³³ | 6.768 × 10−44 |
| CC | 0005694 | chromosome | 120 | 97 | 7.3686 × 10⁻²⁷ | 4.2603 × 10⁻¹⁷ |
| MF | 0019899 | enzyme binding | 136 | 120 | 2.0757 × 10⁻¹⁰ | 0019899 |
| MF | 0005198 | structural molecule activity | 77 | 79 | 5.9878 × 10⁻¹⁶ | 2.0991 × 10⁻¹⁷ |
| MF | 0003723 | RNA binding | 72 | 87 | 4.4686 × 10−06 | 0003723 |
| MF | 0008092 | cytoskeletal protein binding | 68 | 49 | 9.5479 × 10−09 | 0008092 |
| MF | 0003735 | structural constituent of ribosome | 55 | 61 | 6.5833 × 10⁻²⁷ | 8.7689 × 10⁻³¹ |
| BP | 0034641 | nitrogen compound metabolic process | 362 | 346 | 1.1454 × 10⁻¹⁶ | 2.0049 × 10⁻¹⁸ |
| BP | 0009058 | biosynthetic process | 306 | 288 | 1.6028 × 10⁻¹⁰ | 6.6327 × 10⁻¹¹ |
| BP | 0007049 | cell cycle | 178 | 136 | 2.4143 × 10−45 | 2.2782 × 10⁻²⁶ |
| BP | 0006950 | response to stress | 174 | 152 | 0.00015733 | 0.0079929 |
| BP | 0022607 | cellular component assembly | 136 | 133 | 3.6597 × 10⁻⁶ | 1.3117 × 10⁻⁷ |
| Gene ID | Gene Symbol | GENE NAME | T Cell Gene Expression | Log2 Fold Change CL vs. HS, 8 h | Log2 Fold Change RPM vs. HS, 8 h |
|---|---|---|---|---|---|
| 109349 | Fam163b | family with sequence similarity 163, member B | + | −1.06 | −1.24 |
| 381101 | Dnph1 | 2′-deoxynucleoside 5′-phosphate N-hydrolase 1 | + | ns * | −1.44 |
| 434218 | Trim34b | tripartite motif-containing 34B | + | 2.83 | ns |
| 319581 | Xkr5 | X-linked Kx blood group related 5 | + | ns | −1.40 |
| Upk1b | uroplakin−1b | + | −1.69 | ns | |
| 6608222 | LOC6608222 | sodium/calcium exchanger protein | - | ns | −1.28 |
| - | Gm26737 | lncRNA, predicted gene, 26737 | - | ns | −1.55 |
| Gene ID | Gene Symbol | Gene Name | T Cell Gene Expression | Log2 Fold Change RPM vs. CL, 8 h | Log2 Fold Change CL/RPM vs. HS, 8 h |
|---|---|---|---|---|---|
| 68195 | Rnaset2b | ribonuclease T2B | + | −0.87 | ns/ns * |
| 16149 | Cd74 | CD74 antigen | + | −0.69 | ns/−1.2 |
| 14086 | Fscn1 | fascin actin-bundling protein1 | + | −1.21 | 0.82/ns |
| 208084 | Pif1 | PIF1 5′-to-3′ DNA helicase | + | −0.61 | ns/−0.83 |
| 108956 | Apol7c | apolipoprotein L 7c | + | −1.69 | 2.86/1.46 |
| 100042807 | Eif3j2 | eukaryotic translation initiation factor 3 s.J2 | + | −1.75 | ns/ns |
| 193740 | Hspa1a | heat shock protein 1A | + | −3.24 | ns/ns |
| 12316 | Aspm | abnormal spindle microtubule assembly | + | −0.57 | ns/ns |
| 17476 | Mpeg1 | macrophage expressed gene 1 | + | −0.90 | ns/ns |
| 14969 | H2-Eb1 | histocompatibility 2, class II antigen E beta | + | −0.80 | ns/−1.23 |
| 432447 | Gm9824 | predicted pseudogene 9824 | − | −0.81 | ns/−0.99 |
| Relative Gene Expression. | ||
|---|---|---|
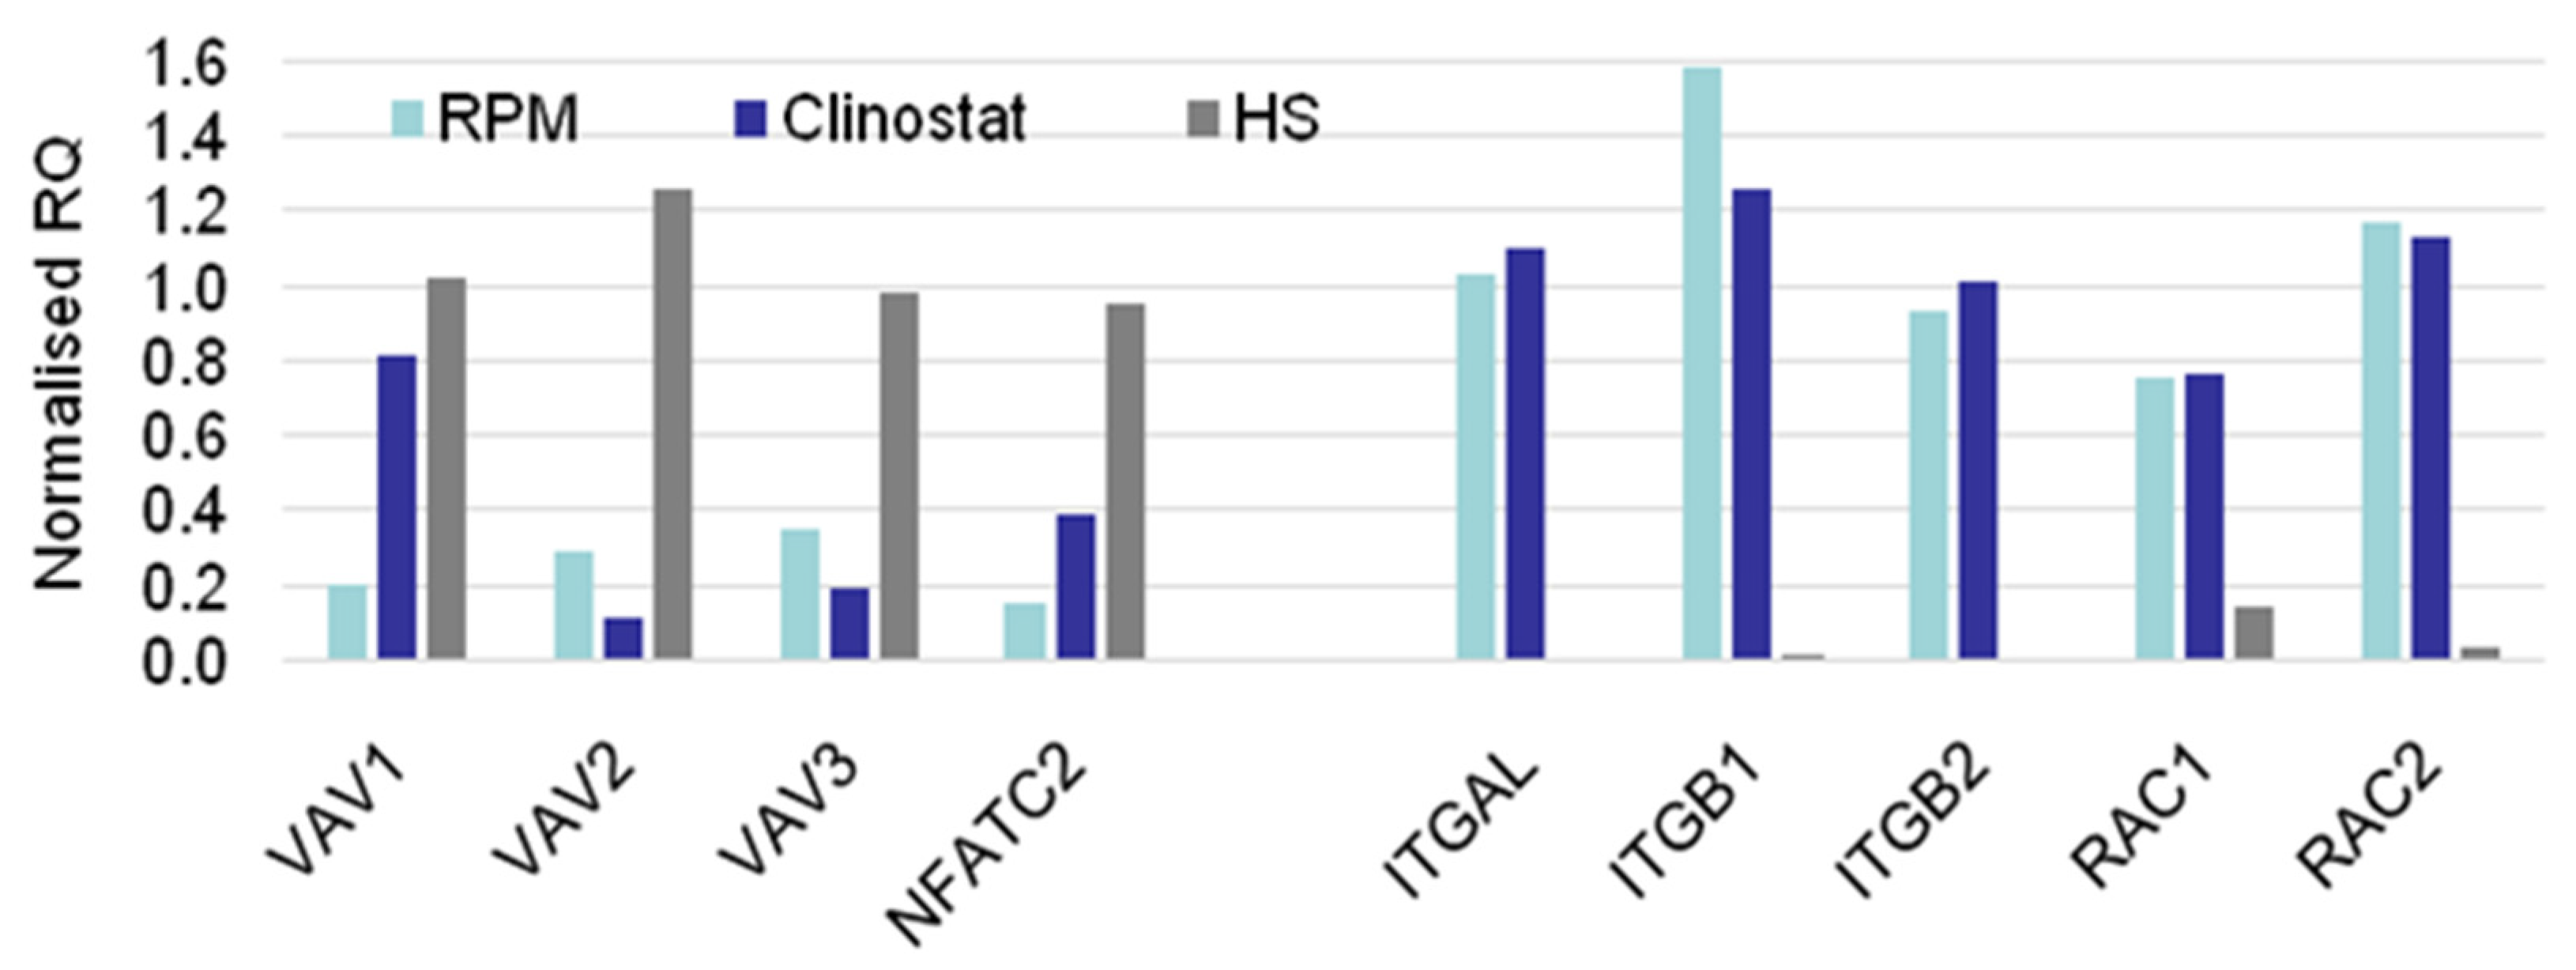
| MG > HS | MG = HS | MG < HS |
| CTLA4 | ACTB | ACTG1 |
| EZR | CENPE | FOXP3 |
| ITGAL | MKL1 | MYL9 |
| ITGB1 | MKL2 | NFATC2 |
| ITGB2 | PFN2 | PFN1 |
| RAC1 | SRF | TRP53BP2 |
| RC2 | TLN1 | VAV1 |
| SESN1 | WASF2 | VAV2 |
| TCF12 | VAV3 | |
| WAS | ||
| Sample Name | Raw Reads | Clean Reads | Raw_Data (G) | Clean_Data (G) | Error_Rate (%) | Q20 (%) | Q30 (%) | GC_Content (%) |
|---|---|---|---|---|---|---|---|---|
| HS_8h_1 | 22275588 | 21763739 | 6.7 | 6.5 | 0.02 | 98.35 | 94.96 | 44.63 |
| HS_8h_2 | 25204052 | 24721513 | 7.6 | 7.4 | 0.02 | 98.22 | 94.63 | 49.22 |
| NTC_1 | 21231374 | 21054307 | 6.4 | 6.3 | 0.03 | 97.79 | 93.58 | 48.93 |
| NTC_2 | 20185658 | 20021323 | 6.1 | 6.0 | 0.02 | 98.21 | 94.53 | 49.63 |
| CL_8h_1 | 24315174 | 23786569 | 7.3 | 7.1 | 0.02 | 98.22 | 94.66 | 49.26 |
| CL_8h_2 | 23844401 | 23296130 | 7.2 | 7.0 | 0.02 | 98.19 | 94.57 | 49.18 |
| RPM8h_1 | 25600529 | 25051563 | 7.7 | 7.5 | 0.02 | 98.20 | 94.61 | 50.06 |
| RPM8h_2 | 22988902 | 22513805 | 6.9 | 6.8 | 0.02 | 98.07 | 94.39 | 48.78 |
| CL_24h | 27021052 | 26760888 | 8.1 | 8.0 | 0.03 | 97.63 | 93.13 | 48.71 |
| RPM24h | 21106398 | 20567883 | 6.3 | 6.2 | 0.02 | 98.22 | 94.61 | 49.56 |
| Sample Name | Total Reads | Total Mapped | Multiple Mapped | Uniquely Mapped | Read 1 | Read 2 | Reads Map to ‘+’ | Reads Map to ‘−’ |
|---|---|---|---|---|---|---|---|---|
| HS_8h_1 | 43527478 | 41999085 (96.49%) | 1920836 (4.41%) | 40078249 (92.08%) | 20065964 (46.10%) | 20012285 (45.98%) | 20033591 (46.03%) | 20044658 (46.05%) |
| HS_8h_2 | 49443026 | 47804795 (96.69%) | 1935536 (3.91%) | 45869259 (92.77%) | 22985377 (46.49%) | 22883882 (46.28%) | 22924203 (46.36%) | 22945056 (46.41%) |
| NTC_1 | 42108614 | 40639633 (96.51%) | 1341423 (3.19%) | 39298210 (93.33%) | 19725847 (46.85%) | 19572363 (46.48%) | 19643692 (46.65%) | 19654518 (46.68%) |
| NTC_2 | 40042646 | 38799106 (96.89%) | 1315043 (3.28%) | 37484063 (93.61%) | 18781111 (46.90%) | 18702952 (46.71%) | 18737591 (46.79%) | 18746472 (46.82%) |
| CL_8h_1 | 47573138 | 46039566 (96.78%) | 1665988 (3.50%) | 44373578 (93.27%) | 22228572 (46.73%) | 22145006 (46.55%) | 22179441 (46.62%) | 22194137 (46.65%) |
| CL_8h_2 | 46592260 | 45158442 (96.92%) | 1615703 (3.47%) | 43542739 (93.45%) | 21819540 (46.83%) | 21723199 (46.62%) | 21763512 (46.71%) | 21779227 (46.74%) |
| RPM8h_1 | 50103126 | 48551851 (96.90%) | 1743876 (3.48%) | 46807975 (93.42%) | 23452298 (46.81%) | 23355677 (46.62%) | 23394967 (46.69%) | 23413008 (46.73%) |
| RPM8h_2 | 45027610 | 43384044 (96.35%) | 1601933 (3.56%) | 41782111 (92.79%) | 20937166 (46.50%) | 20844945 (46.29%) | 20883276 (46.38%) | 20898835 (46.41%) |
| CL_24h | 53521776 | 50474422 (94.31%) | 1761017 (3.29%) | 48713405 (91.02%) | 24427089 (45.64%) | 24286316 (45.38%) | 24348363 (45.49%) | 24365042 (45.52%) |
| RPM24h | 41135766 | 39828513 (96.82%) | 1328387 (3.23%) | 38500126 (93.59%) | 19287634 (46.89%) | 19212492 (46.71%) | 19243508 (46.78%) | 19256618 (46.81%) |
| Sample ID # | Sample Group | Biological Replicate ID | Biological Source | Treatment | Time Point | Downstream Application |
|---|---|---|---|---|---|---|
| T1 T2 T3 | HS_8h | HS_8h_1 HS_8h_2 HS_8h_3 | Primary T cells, Mus musculus | HS | 8 h | RNA-seq RNA-seq - |
| T4 T5 T6 | NTC_8h | NTC_8h NTC_8h NTC_8h | Primary T cells, Mus musculus | NTC | 8 h | RNA-seq RNA-seq - |
| T7 T8 T9 | CL_8h | CL_8h_1 CL_8h_2 CL_8h_3 | Primary T cells, Mus musculus | CL | 8 h | RNA-seq RNA-seq - |
| T10 T11 T12 | RPM_8h | RPM_8h_1 RPM_8h_2 RPM_8h_3 | Primary T cells, Mus musculus | RPM | 8 h | RNA-seq RNA-seq - |
| T13 T14 T15 | CL_24h | CL_24h_1 CL_24h_2 CL_24h_3 | Primary T cells, Mus musculus | CL | 24 h | RNA-seq - - |
| T16 T17 T18 | RPM_24h | RPM_24h_1 RPM_24h_2 RPM_24h_3 | Primary T cells, Mus musculus | RPM | 24 h | RNA-seq - - |
| J1 J2 J3 | HS_8h | HS_8h_1J HS_8h_2J HS_8h_3J | Jurkat T cells, Homo sapiens | HS | 8 h | RT-qPCR RT-qPCR - |
| J4 J5 J6 | CL_8h | CL_8h_1J CL_8h_2J CL_8h_3J | Jurkat T cells, Homo sapiens | CL | 8 h | RT-qPCR RT-qPCR - |
| J7 J8 J9 | RPM_8h | RPM_8h_1J RPM_8h_2J RPM_8h_3J | Jurkat T cells, Homo sapiens | RPM | 8 h | RT-qPCR RT-qPCR - |
| J10 J11 J12 | NTC_8h | NTC_8h_1J NTC_8h_2J NTC_8h_3J | Jurkat T cells, Homo sapiens | NTC | 8 h | RT-qPCR RT-qPCR - |
| J13 J14 J15 | HS_24h | HS_24h_1J HS_24h_2J HS_24h_3J | Jurkat T cells, Homo sapiens | HS | 24 h | RT-qPCR RT-qPCR - |
| J16 J17 J18 | CL_24h | CL_24h_1J CL_24h_2J CL_24h_3J | Jurkat T cells, Homo sapiens | CL | 24 h | RT-qPCR RT-qPCR - |
| J19 J20 J21 | RPM_24h | RPM_24h_1J RPM_24h_2J RPM_24h_3J | Jurkat T cells, Homo sapiens | RPM | 24 h | RT-qPCR RT-qPCR - |
| J22 J23 J24 | NTC_24h | NTC_24h_1J NTC_24h_2J NTC_24h_3J | Jurkat T cells, Homo sapiens | NTC | 24 h | RT-qPCR RT-qPCR - |
| Analysis | Software | Version | Parameters | Remarks |
|---|---|---|---|---|
| Mapping to reference genome | HISAT2 | V2.0.5 | default parameters | |
| Quantification | HTSeq | v0.6.1 | -m union | |
| Differential Expression Analysis | DEGseq | v1.36.1 | |log2Fold change| > 1; Padj < 0.005 | |
| DESeq2 | v1.22.2 | Padj < 0.05 | ||
| GO Enrichment | GOSeq, topGO, hmmscan | v1.34.1 | Padj < 0.05 | padj < 0.05 were considered significantly enriched |
References
- Rich, R.R.; Fleisher, T.A.; Shearer, W.T. Clinical Immunology: Principles and Practice, 4th ed.; Saunders: Philadelphia, PA, USA, 2012. [Google Scholar]
- Ullrich, O.; Thiel, C.S. Gravitational force: Triggered stress in cells of the immune system. In Stress Challenges and Immunity in Space: From Mechanisms to Monitoring and Preventive Strategies; Springer: Berlin/Heidelberg, Germany, 2012. [Google Scholar]
- Tauber, S.; Hauschild, S.; Paulsen, K.; Gutewort, A.; Raig, C.; Hürlimann, E.; Biskup, J.; Philpot, C.; Lier, H.; Engelmann, F.; et al. Signal transduction in primary human T lymphocytes in altered gravity during parabolic flight and clinostat experiments. Cell. Physiol. Biochem. 2015, 35, 1034–1051. [Google Scholar] [CrossRef] [PubMed]
- Cogoli-Greuter, M. Influence of microgravity on mitogen binding, motility and cytoskeleton patterns of T lymphocytes and jurkat cells-experiments on sounding rockets. Jpn. J. Aerosp. Environ. Med. 1998, 35, 27–39. [Google Scholar]
- Luo, H.; Wang, C.; Feng, M.; Zhao, Y. Microgravity inhibits resting T cell immunity in an exposure time-dependent manner. Int. J. Med. Sci. 2013, 11, 87–96. [Google Scholar] [CrossRef] [Green Version]
- Maccarrone, M.; Battista, N.; Meloni, M.; Bari, M.; Galleri, G.; Pippia, P.; Cogoli, A.; Finazzi-Agrò, A. Creating conditions similar to those that occur during exposure of cells to microgravity induces apoptosis in human lymphocytes by 5-lipoxygenase-mediated mitochondrial uncoupling and cytochrome c release. J. Leukoc. Biol. 2003, 73, 472–481. [Google Scholar] [CrossRef]
- Hashemi, B.B.; Penkala, J.E.; Vens, C.; Huls, H.; Cubbage, M.; Sams, C.F. T cell activation responses are differentially regulated during clinorotation and in spaceflight. FASEB J. 1999, 13, 2071–2082. [Google Scholar] [CrossRef] [PubMed] [Green Version]
- Hughes-Fulford, M.; Sugano, E.; Schopper, T.; Li, C.; Boonyaratanakornkit, J.; Cogoli, A. Early immune response and regulation of IL-2 receptor subunits. Cell. Signal. 2005, 17, 1111–1124. [Google Scholar] [CrossRef] [PubMed]
- Lewis, M.L.; Cubano, L.A.; Zhao, B.; Dinh, H.-K.; Pabalan, J.G.; Piepmeier, E.H.; Bowman, P.D. cDNA microarray reveals altered cytoskeletal gene expression in space-flown leukemic T lymphocytes (Jurkat). FASEB J. 2001, 15, 1783–1785. [Google Scholar] [CrossRef]
- Chang, T.T.; Walther, I.; Li, C.-F.; Boonyaratanakornkit, J.; Galleri, G.; Meloni, M.A.; Pippia, P.; Cogoli, A.; Hughes-Fulford, M. The Rel/NF-κB pathway and transcription of immediate early genes in T cell activation are inhibited by microgravity. J. Leukoc. Biol. 2012, 92, 1133–1145. [Google Scholar] [CrossRef] [Green Version]
- Sonnenfeld, G. Space flight modifies T cell activation-role of microgravity. J. Leukoc. Biol. 2012, 92, 1125–1126. [Google Scholar] [CrossRef] [Green Version]
- Boonyaratanakornkit, J.B.; Cogoli, A.; Li, C.-F.; Schopper, T.; Pippia, P.; Galleri, G.; Meloni, M.A.; Hughes-Fulford, M. Key gravity-sensitive signaling pathways drive T-cell activation. FASEB J. 2005, 19, 2020–2022. [Google Scholar] [CrossRef] [Green Version]
- Reed, F.; Larsuel, S.T.; Mayday, M.Y.; Scanlon, V.; Krause, D.S. MRTFA: A critical protein in normal and malignant hematopoiesis and beyond. J. Biol. Chem. 2021, 296, 100543. [Google Scholar] [CrossRef] [PubMed]
- Miranda, M.; Lichner, Z.; Szászi, K.; Kapus, A. MRTF: Basic Biology and Role in Kidney Disease. Int. J. Mol. Sci. 2021, 22, 6040. [Google Scholar] [CrossRef] [PubMed]
- Record, J.; Sendel, A.; Kritikou, J.S.; Kuznetsov, N.V.; Brauner, H.; He, M.; Nagy, N.; Oliveira, M.; Griseti, E.; Haase, C.B.; et al. An intronic deletion in megakaryoblastic leukemia 1 is associated with hyperproliferation of B cells in triplets with Hodgkin lymphoma. Haematologica 2020, 105, 1339–1350. [Google Scholar] [CrossRef] [PubMed] [Green Version]
- Herranz, R.; Anken, R.; Boonstra, J.; Braun, M.; Christianen, P.C.M.; De Geest, M.; Hauslage, J.; Hilbig, R.; Hill, R.J.A.; Lebert, M.; et al. Ground-based facilities for simulation of microgravity: Organism-specific recommendations for their use, and recommended terminology. Astrobiology 2013, 13, 1–17. [Google Scholar] [CrossRef] [Green Version]
- Wuest, S.L.; Richard, S.; Kopp, S.; Grimm, D.; Egli, M. Simulated Microgravity: Critical Review on the Use of Random Positioning Machines for Mammalian Cell Culture. BioMed Res. Int. 2015, 2015, 971474. [Google Scholar] [CrossRef] [Green Version]
- Brungs, S.; Hauslage, J.; Hemmersbach, R. Validation of Random Positioning Versus Clinorotation Using a Macrophage Model System. Microgravity Sci. Technol. 2019, 31, 223–230. [Google Scholar] [CrossRef] [Green Version]
- Kuznetsov, N.V.; Almuzzaini, B.; Kritikou, J.S.; Baptista, M.A.P.; Oliveira, M.M.S.; Keszei, M.; Snapper, S.B.; Percipalle, P.; Westerberg, L.S. Nuclear Wiskott-Aldrich syndrome protein co-regulates T cell factor 1-mediated transcription in T cells. Genome Med. 2017, 9, 91. [Google Scholar] [CrossRef]
- Young, M.D.; Wakefield, M.J.; Smyth, G.K.; Oshlack, A. Gene ontology analysis for RNA-seq: Accounting for selection bias. Genome Biol. 2010, 11, R14. [Google Scholar] [CrossRef] [Green Version]
- Anders, S.; Huber, W. Differential expression analysis for sequence count data. Genome Biol. 2010, 11, R106. [Google Scholar] [CrossRef] [Green Version]
- Anders, S.; Huber, W. Differential expression of RNA-Seq data at the gene level–the DESeq package. In DESq Manual; European Molecular Biology Laboratory: Heidelberg, Germany, 2012. [Google Scholar]
- Wang, L.; Feng, Z.; Wang, X.; Wang, X.; Zhang, X. DEGseq: An R package for identifying differentially expressed genes from RNA-seq data. Bioinformatics 2009, 26, 136–138. [Google Scholar] [CrossRef]
- Ghiorghi, Y.K.; Zeller, K.I.; Dang, C.; Kaminski, P.A. The c-Myc target gene Rcl (C6orf108) encodes a novel enzyme, deoxynucleoside 5′-monophosphate N-glycosidase. J. Biol. Chem. 2007, 282, 8150–8156. [Google Scholar] [CrossRef] [PubMed] [Green Version]
- Garrett-Bakelman, F.E.; Darshi, M.; Green, S.J.; Gur, R.C.; Lin, L.; Macias, B.R.; McKenna, M.J.; Meydan, C.; Mishra, T.; Nasrini, J.; et al. The NASA twins study: A multidimensional analysis of a year-long human spaceflight. Science 2019, 364, eaau8650. [Google Scholar] [CrossRef] [PubMed]
- Suzuki, J.; Imanishi, E.; Nagata, S. Exposure of phosphatidylserine by Xk related protein family members during apoptosis. J. Biol. Chem. 2014, 289, 30257–30267. [Google Scholar] [CrossRef] [Green Version]
- Sun, D.; An, X.; Ji, B. TRIM34 facilitates the formation of multinucleated giant cells by enhancing cell fusion and phagocytosis in epithelial cells. Exp. Cell Res. 2019, 384, 111594. [Google Scholar] [CrossRef]
- Huang, Y.; Zucker, B.; Zhang, S.; Elias, S.; Zhu, Y.; Chen, H.; Ding, T.; Li, Y.; Sun, Y.; Lou, J.; et al. Migrasome formation is mediated by assembly of micron-scale tetraspanin macrodomains. Nat. Cell Biol. 2019, 21, 991–1002. [Google Scholar] [CrossRef]
- Zhang, Y.; Wang, J.; Ding, Y.; Zhang, J.; Xu, Y.; Xu, J.; Zheng, S.; Yang, H. Migrasome and Tetraspanins in Vascular Homeostasis: Concept, Present, and Future. Front. Cell Dev. Biol. 2020, 8, 438. [Google Scholar] [CrossRef] [PubMed]
- Radons, J. The human HSP70 family of chaperones: Where do we stand? Cell Stress Chaperones 2016, 21, 379–404. [Google Scholar] [CrossRef] [Green Version]
- Walline, C.C.; Deffit, S.N.; Wang, N.; Guindon, L.M.; Crotzer, V.L.; Liu, J.; Hollister, K.; Eisenlohr, L.C.; Brutkiewicz, R.R.; Kaplan, M.H.; et al. Virus-encoded ectopic CD74 enhances poxvirus vaccine efficacy. Immunology 2014, 141, 531–539. [Google Scholar] [CrossRef] [Green Version]
- Adams, J.C. Roles of fascin in cell adhesion and motility. Curr. Opin. Cell Biol. 2004, 16, 590–596. [Google Scholar] [CrossRef]
- Hashimoto, Y.; Kim, D.J.; Adams, J.C. The roles of fascins in health and disease. J. Pathol. 2011, 224, 289–300. [Google Scholar] [CrossRef]
- Huang, J.; Liu, P.; Wang, G. Regulation of mitochondrion-associated cytosolic ribosomes by mammalian mitochondrial ribonuclease T2 (RNASET2). J. Biol. Chem. 2018, 293, 19633–19644. [Google Scholar] [CrossRef] [PubMed] [Green Version]
- Dehghani-Tafti, S.; Levdikov, V.; Antson, A.A.; Bax, B.; Sanders, C.M. Structural and functional analysis of the nucleotide and DNA binding activities of the human PIF1 helicase. Nucleic Acids Res. 2019, 47, 3208–3222. [Google Scholar] [CrossRef] [PubMed] [Green Version]
- Snow, B.E.; Mateyak, M.; Paderova, J.; Wakeham, A.; Iorio, C.; Zakian, V.; Squire, J.; Harrington, L. Murine Pif1 Interacts with Telomerase and Is Dispensable for Telomere Function In Vivo. Mol. Cell. Biol. 2007, 27, 1017–1026. [Google Scholar] [CrossRef] [PubMed] [Green Version]
- Etienne-Manneville, S.; Hall, A. Rho GTPases in cell biology. Nature 2002, 420, 629–635. [Google Scholar] [CrossRef] [PubMed]
- Tybulewicz, V.L. Vav-family proteins in T-cell signalling. Curr. Opin. Immunol. 2005, 17, 267–274. [Google Scholar] [CrossRef]
- Mognol, G.P.; Carneiro, F.R.G.; Robbs, B.K.; Faget, D.V.; Viola, J.P.B. Cell cycle and apoptosis regulation by NFAT transcription factors: New roles for an old player. Cell Death Dis. 2016, 7, e2199. [Google Scholar] [CrossRef] [Green Version]
- Gerasimčik, N.; He, M.; Dahlberg, C.I.M.; Kuznetsov, N.V.; Severinson, E.; Westerberg, L.S. The Small Rho GTPases Rac1 and Rac2 Are Important for T-Cell Independent Antigen Responses and for Suppressing Switching to IgG2b in Mice. Front. Immunol. 2017, 8, 1264. [Google Scholar] [CrossRef] [Green Version]
- Krishnan, K.; Moens, P.D.J. Structure and functions of profilins. Biophys. Rev. 2009, 1, 71–81. [Google Scholar] [CrossRef] [Green Version]
- Moore, D.; Bie, P.; Oser, H. Biological and Medical Research in Space: An Overview of Life Sciences Research in Microgravity; Springer: GmbH, Heidelberg, 1996. [Google Scholar]
- Anken, R. Simulation of microgravity for studies in gravitational biology. Curr. Biotechnol. 2013, 2, 192–200. [Google Scholar] [CrossRef] [Green Version]
- Borst, A.G.; Van Loon, J.J.W.A. Technology and developments for the Random Positioning Machine, RPM. Microgravity Sci. Technol. 2009, 21, 287–292. [Google Scholar] [CrossRef]
- Pfister, G.; Toor, S.M.; Nair, V.S.; Elkord, E. An evaluation of sorter induced cell stress (SICS) on peripheral blood mononuclear cells (PBMCs) after different sort conditions—Are your sorted cells getting SICS? J. Immunol. Methods 2020, 487, 112902. [Google Scholar] [CrossRef] [PubMed]
- Zhan, C.; Bidkhori, G.; Schwarz, H.; Malm, M.; Mebrahtu, A.; Field, R.; Sellick, C.; Hatton, D.; Varley, P.; Mardinoglu, A.; et al. Low Shear Stress Increases Recombinant Protein Production and High Shear Stress Increases Apoptosis in Human Cells. iScience 2020, 23, 101653. [Google Scholar] [CrossRef] [PubMed]
- Sieck, J.B.; Budach, W.E.; Suemeghy, Z.; Leist, C.; Villiger, T.K.; Morbidelli, M.; Soos, M. Adaptation for survival: Phenotype and transcriptome response of CHO cells to elevated stress induced by agitation and sparging. J. Biotechnol. 2014, 189, 94–103. [Google Scholar] [CrossRef] [PubMed]
- Sun, L.; Zborowski, M.; Moore, L.R.; Chalmers, J.J. Continuous, flow-through immunomagnetic cell sorting in a quadrupole field. Cytometry 1998, 33, 469–475. [Google Scholar] [CrossRef]
- Kunnen, S.J.; Malas, T.B.; Semeins, C.M.; Bakker, A.D.; Peters, D.J.M. Comprehensive transcriptome analysis of fluid shear stress altered gene expression in renal epithelial cells. J. Cell. Physiol. 2018, 233, 3615–3628. [Google Scholar] [CrossRef] [Green Version]
- Kutikhin, A.G.; Sinitsky, M.Y.; Yuzhalin, A.E.; Velikanova, E.A. Shear stress: An essential driver of endothelial progenitor cells. J. Mol. Cell. Cardiol. 2018, 118, 46–69. [Google Scholar] [CrossRef]
- Molladavoodi, S.; Robichaud, M.; Wulff, D.; Gorbet, M. Corneal epithelial cells exposed to shear stress show altered cytoskeleton and migratory behaviour. PLoS ONE 2017, 12, e0178981. [Google Scholar] [CrossRef] [Green Version]
- Hauslage, J.; Cevik, V.; Hemmersbach, R. Pyrocystis noctiluca represents an excellent bioassay for shear forces induced in ground-based microgravity simulators (clinostat and random positioning machine). Npj Microgravity 2017, 3, 12. [Google Scholar] [CrossRef] [Green Version]


Publisher’s Note: MDPI stays neutral with regard to jurisdictional claims in published maps and institutional affiliations. |
© 2022 by the author. Licensee MDPI, Basel, Switzerland. This article is an open access article distributed under the terms and conditions of the Creative Commons Attribution (CC BY) license (https://creativecommons.org/licenses/by/4.0/).
Share and Cite
Kouznetsov, N.V. Cell Responses to Simulated Microgravity and Hydrodynamic Stress Can Be Distinguished by Comparative Transcriptomics. Int. J. Transl. Med. 2022, 2, 364-386. https://doi.org/10.3390/ijtm2030029
Kouznetsov NV. Cell Responses to Simulated Microgravity and Hydrodynamic Stress Can Be Distinguished by Comparative Transcriptomics. International Journal of Translational Medicine. 2022; 2(3):364-386. https://doi.org/10.3390/ijtm2030029
Chicago/Turabian StyleKouznetsov, Nik V. 2022. "Cell Responses to Simulated Microgravity and Hydrodynamic Stress Can Be Distinguished by Comparative Transcriptomics" International Journal of Translational Medicine 2, no. 3: 364-386. https://doi.org/10.3390/ijtm2030029
APA StyleKouznetsov, N. V. (2022). Cell Responses to Simulated Microgravity and Hydrodynamic Stress Can Be Distinguished by Comparative Transcriptomics. International Journal of Translational Medicine, 2(3), 364-386. https://doi.org/10.3390/ijtm2030029


