Article

The Co-Localization of NLRP3 and ASC Specks Does Not Automatically Entail NLRP3 Inflammasome Functionality in PDAC Cell Lines

1
Translational Medicine, School of Health Sciences, University of Skövde, 541 28 Skövde, Sweden
2
School of Medical Sciences, Faculty of Medicine and Health, Örebro University, 701 82 Örebro, Sweden
3
Inflammatory Response and Infection Susceptibility Centre (iRiSC), Örebro University, 701 82 Örebro, Sweden
4
School of Bioscience, Systems Biology Research Centre, Infection Biology, University of Skövde, 541 28 Skövde, Sweden
5
Department of Life Sciences, Division of Systems and Synthetic Biology, Chalmers University of Technology, 412 96 Göteborg, Sweden
6
Unit of Oncology, Department of Surgery, Skaraborg Hospital, 541 85 Skövde, Sweden
*
Author to whom correspondence should be addressed.
These authors contributed equally to this work.
Int. J. Transl. Med. 2024, 4(2), 224-237; https://doi.org/10.3390/ijtm4020013
Submission received: 18 December 2023 / Revised: 20 March 2024 / Accepted: 28 March 2024 / Published: 30 March 2024

Abstract

:
The NLRP3 inflammasome is an important mediator of the host inflammatory response, and downregulation of inflammation is important in cancer treatment. Here, we investigated four different pancreatic ductal adenocarcinoma (PDAC) cell lines, AsPC-1, BxPC-3, CFPAC-1 and Panc-1, with regards to NLRP3 inflammasome formation and cytokine secretion. ASC specks were observed in all the cell lines investigated, but AsPC-1 was the only cell-line with the co-localization of anti-ASC and anti-NLRP3 and spontaneously formed multiple NLRP3 inflammasomes per cell. The co-localization of NLRP3 and ASC was not accompanied by IL-1β release nor significant IL-18 release. BxPC-3 displayed relatively high expression of the inflammasome-related genes IL1B and CASP1 and had the highest levels of IL1β and IL18 secretion and the highest amount of ASC. The inflammasome-associated genes IL18 and PYCARD were up-regulated in the PDAC primary tumors compared to normal tissue, and high PDAC tumor expression of IL18, CASP1 and PYCARD correlated with low patient survival. We have shown that PDAC cell lines display significant variations in their inflammasome-related gene expression and readouts. We conclude that spontaneous ASC speck formation is possible in PDAC cells and that multiple NLRP3 inflammasomes are formed spontaneously in AsPC-1 cells but that the co-localization of NLRP3 and ASC specks does not automatically entail inflammasome function.

1. Introduction

The occurrence of pancreatic ductal adenocarcinoma (PDAC) is increasing worldwide, with a correlated increase in deaths caused by the disease. PDAC tumors have abundant stromata, with fibrosis surrounding the cancer cells. It is made of infiltrating immune-competent cells and pancreatic stellate cells, macrophages and cancer-associated fibroblasts. Chronic inflammation in the pancreas, pancreatitis, is a known risk factor for the initiation and progression of pancreatic cancer [1,2] and also promotes metastasis [3]. Damaged pancreatic cells can release damage-associated molecular patterns (DAMPs), molecules that induce the formation of the Nucleotide-binding oligomerization domain, Leucine-Rich repeat and Pyrin domain-containing 3 (NLRP3) inflammasome [4,5].
Inflammasomes are multimeric protein complexes that initiate inflammation in response to pathogen-associated molecular patterns (PAMPs), such as infectious microbes, and DAMPs [6]. The NLRP3 inflammasome plays a crucial role in host immune responses by activating caspase-1. The formation of the inflammasome leads to proximity-mediated, proteolytic cleavage of inactive pro-caspase-1 into active caspase-1. Active caspase-1, in turn, cleaves the biologically inactive precursors pro-interleukin (IL)-1β and pro-IL-18 into mature and biologically active IL-1β and IL-18, respectively [7]. Active caspase-1 also cleaves gasdermin D, which subsequently forms pores in the plasma membrane, facilitating inflammatory cell death, pyroptosis and the release of active IL-1β and IL-18 [8,9,10]. NLRP3 inflammasome function is dependent upon Apoptosis-associated speck-like protein containing a caspase recruitment domain (ASC), which is coded by the PYD and CARD domain-containing (PYCARD) gene. Upon inflammasome activation, ASC polymerizes into a large speck-like structure, which functions as a scaffold for caspase-1 cleavage and activation, a process which also requires the intracellular redistribution of ASC [11,12]. The formation of ASC specks is therefore often used as a readout for inflammasome formation [13].
An important consequence of inflammasome activation is the maturation and release of IL-1β, one of several important proinflammatory cytokines. Interleukin-1β is crucial to resolving both acute [14] and chronic inflammation and is also of importance during tumor development [15]. In a variety of cancers, IL-1β is frequently upregulated, and a high level of IL-1β is associated with a poor prognosis in PDAC, hepatocellular carcinoma and lung cancer [16,17].
As inflammation seems to play a large part in the development of pancreatic cancer and the NLRP3 inflammasome is one of the key regulators of inflammation, investigating the connection between the NLRP3 inflammasome and PDAC continues to be of the utmost interest. NLRP3 inflammasome formation is believed to be pro-tumorigenic with regards to PDAC (reviewed in [5]). PDAC tumor cells can produce IL-1β through NLRP3 inflammasome activation [18], and this is essential to the establishment of the tumor microenvironment [19]. However, the IL-1β protein is often undetected in PDAC cell lines grown in vitro and as organoids but robustly produced by primary PDAC tumors [17]. PDAC is highly associated with inflammation, and NLRP3 inflammasomes have been observed within pancreatitis and in the PDAC mouse model KPC [17]. Thus, the tumor cells themselves orchestrate an immune-modulatory program that supports tumorigenesis [17,20]. Components of the NLRP3 inflammasome, such as NLRP3, ASC and caspase-1, along with IL-1β, were shown to be present at higher levels in PDAC tumors compared to adjacent normal tissues and were associated with the clinical stage in a recent study [21]. Furthermore, clinical data have shown that high expression of ASC in PDAC tumors correlates with a poor prognosis [20,22].
Since the use of cell lines is crucial to continued investigation into the role of the NLRP3 inflammasome in PDAC [23], it is imperative that differences in cell lines’ basal inflammasome readouts are well understood. We therefore investigated the discrepancies in basal inflammasome formation in four well-characterized commercially available pancreatic cancer cell lines; AsPC-1, BxPC-3, CFPAC-1 and Panc-1. The cell lines are derived from either primary tumors or metastases in order to give a good representation and a broad picture of the various forms of the PDAC disease.

2. Materials and Methods

2.1. Cell Culturing

Four pancreatic cancer cell lines, AsPC-1 (CRL-1682, xenograft), Panc-1 (CRL-1469, primary), BxPC-3 (CRL-1687, primary) and CFPAC-1 (CRL-1918, metastasis liver), were used (ATCC—LGC Standards GmbH, Wesel, Germany). AsPC-1 and BxPC-3 were grown in RPMI-1640 medium supplemented with 1% HEPES and 1% sodium pyruvate, Panc-1 was grown in Dulbecco’s Modified Eagle Medium (DMEM) with 1% L-glutamine and CFPAC-1 was grown in Iscove’s Modified Dulbecco’s Medium (IMDM). The media were also supplemented with 10% FBS and 1% PEST (Sigma-Aldrich, St. Louis, MO, USA). All the incubations were performed at 37 °C with 5% CO2.

2.2. RNA Extraction, cDNA Synthesis and Real-Time PCR

For the RNA extraction, the cells were seeded at 1.2 × 10⁵ cells per well in 6-well plates in 2.4 mL of complete medium and incubated at 37 °C with 5% CO2 to a sub-confluent monolayer. After ~20 h, the media were removed, new media were added and the cells were further incubated for 48 h. RNA was extracted using the RNeasy Mini Kit (QIAGEN, Hilden, Germany) according to the manufacturer’s protocol. For cDNA synthesis, 1 μg of RNA from each sample was reverse-transcribed using the High-Capacity cDNA Reverse Transcription Kit Reagent (Thermo Fisher Scientific, Waltham, MA, USA).
cDNA corresponding to 5 ng of RNA was used in each qPCR reaction. qPCR was performed using a PikoReal qPCR System (Thermo Fisher Scientific, Waltham, MA, USA) in duplicate for the TaqMan target transcripts (TaqMan Gene Expression Assays, Applied Biosystems, Foster City, CA, USA), using TaqMan™ Gene Expression Master Mix (4369016, Applied Biosystems, Foster City, CA, USA) for the genes IL1B (Assay ID: Hs01555410_m1), IL18 (Assay ID: Hs01038788_m1), PYCARD (Assay ID: Hs1547324_m1), NLRP3 (Assay ID: Hs00918082_m1) and CASP1 (Assay ID: Hs00354836_m1) and the reference genes PMM1 (Assay ID: Hs00963626_m1) and GAPDH (Assay ID: Hs02786624_m1). The geometric means of the two reference genes were used for calculation of the delta Ct values.

2.3. The Cytokines IL-1β and IL-18 in the Cell Media

The cells were seeded at a quantity of 1.2 × 10⁵ cells per well in 6-well plates with 2.4 mL complete media and incubated for 20 h at 37 °C with 5% CO2; thereafter, the old media were removed, and 1 mL of new media were added. The media were collected after another 48 h and used in the enzyme-linked immunosorbent assays (ELISA) ELISA MAX™ Deluxe Set Human IL-1β (#437004, BioLegend, San Diego, CA, USA) and Human Total IL-18 DuoSet ELISA (#DY318-05, R&D Systems, Minneapolis, MN, USA). The expected minimum detectable concentrations of IL-1β and IL-18 were 0.5 pg/mL and 11.7 pg/mL, respectively.

2.4. Immunofluorescence and Co-Localization

For the co-localization experiments, the cells were seeded at 2 × 10⁴ cells per well on 8-well glass slides (Sarstedt, Hildesheim, Germany) in 400 µL media and incubated for 20 h at 37 °C with 5% CO2. Thereafter, the old media were removed, and new media were added. The cells were further incubated for 48 h at 37 °C with 5% CO2. The cells were fixed with 4% PFA, permeabilized for 10 min with 0.4% Triton, blocked for 1 h with PBS with 2% BSA (Bio-Rad Laboratories Inc., Hercules, CA, USA) and incubated with the primary antibodies, anti-ASC (sc-514414, Santa Cruz Biotechnology, Inc., Dallas, TX, USA) and anti-NLRP3 (ABF23, MilliporeSigma, Burlington, MA, USA), diluted 1:100 in PBS with 0.1% BSA at 4 °C overnight. The specificity of the antibodies has previously been shown [24,25]. The secondary antibodies Cy5TM goat anti-mouse IgG (H + L) (A10524, Invitrogen, Waltham, MA, USA) and Alexa FluorTM 488 goat anti-rabbit IgG (H + L) (A11034, Invitrogen, Waltham, MA, USA) were added at concentrations of 1:2000.

2.5. Protein Extraction and WB

The cells were seeded at a quantity of 5 × 10⁵ cells in 20 mL of media per 75 cm2 flask. The media were changed after 24 h and then further incubated for 48 h in 37 °C with 5% CO2. The cells were thereafter lysed in lysis buffer (FNN0011, Thermo Fisher Scientific, Waltham, MA, USA) supplemented with phenylmethylsulphonyl fluoride (PMSF) (36978, Thermo Fisher Scientific, Waltham, MA, USA) and a protein inhibitor cocktail (P2714, Sigma-Aldrich, St Louis, MO, USA). The protein concentration was determined using the Pierce™ BCA Protein Assay Kit (Thermo Fisher Scientific, Waltham, MA, USA).
From each sample, 10 µg of total protein was separated using sodium dodecyl sulfate –polyacrylamide gel electrophoresis (8–16% gel). The proteins were then blotted onto PVDF membranes. After blotting, the membranes were activated for 45 s using the ChemiDoc system (Bio-Rad Laboratories Inc., Hercules, CA, USA) and blocked in TBST with 5% milk before incubation with the primary antibody anti-ASC (sc-514414, Santa Cruz Biotechnology, Inc., Dallas, TX, USA) (1:1000) overnight at 4 °C. After washing them three times, the membranes were further incubated with the secondary antibody, goat anti-mouse IgG, Alexa Fluor Plus 555 (A32727, Invitrogen, Waltham, MA, USA) (1:2500). The amount of protein was measured using the ChemiDoc system (Bio-Rad Laboratories Inc., Hercules, CA, USA). The amount of protein was normalized to the total protein for each sample.

2.6. R2 Gene Expression Analysis

The data for the analyses and comparison of the gene expression between the normal pancreatic tissue, primary PDAC tumor tissue and metastases were imported from the R2 platform (http://r2.amc.nl)(accessed on 14 December 2023). Five independent PDAC cohorts, (GSE71729) [26] (GSE62165) [27], (GSE28735) [28], Mixed Pancreatic Adenocarcinoma (2022v32) (genecode36; http://r2.amc.nl) (accessed on 14 December 2023) and (GSE62452) [29], were selected. The microarray data were downloaded as the log2 fold change.

2.7. Statistical Analysis

All of the statistical analysis was performed using IBM SPSS Statistics 27 software (IBM Corp.), unless otherwise specified. Differences in the mRNA and protein expression data between cell lines were analyzed using one-way analysis of variance (ANOVA) followed by Tukey’s HSD correction to confirm significant differences between cell lines. A p-value < 0.05 was considered to indicate a statistically significant difference.
The gene expression data presented are plotted as Tukey’s box-and-whisker plots showing the IQR, with the line at the median ± 1.5-fold the interquartile range, or as Kaplan–Meier plots to determine the overall survival (OS) over time. The survival analysis was performed using Kaplan–Meier analysis, and comparisons between the survival curves were conducted using the Log-rank test. For comparisons of the gene expression between two groups, a one-way analysis of variance (ANOVA) was used, * p < 0.05, ** p < 0.01, *** p < 0.001, **** p < 0.0001. The gene expression analyses were conducted using the R2 platform (http://r2.amc.nl) (accessed on 14 December 2023).
Co-localization was measured using the JACoP plugin in ImageJ [30]. The cells were delineated in background-subtracted images, after which the JACoP plugin was used to determine the level of colocalization (Pearson’s coefficient) utilizing Costes’ automatic threshold.

3. Results

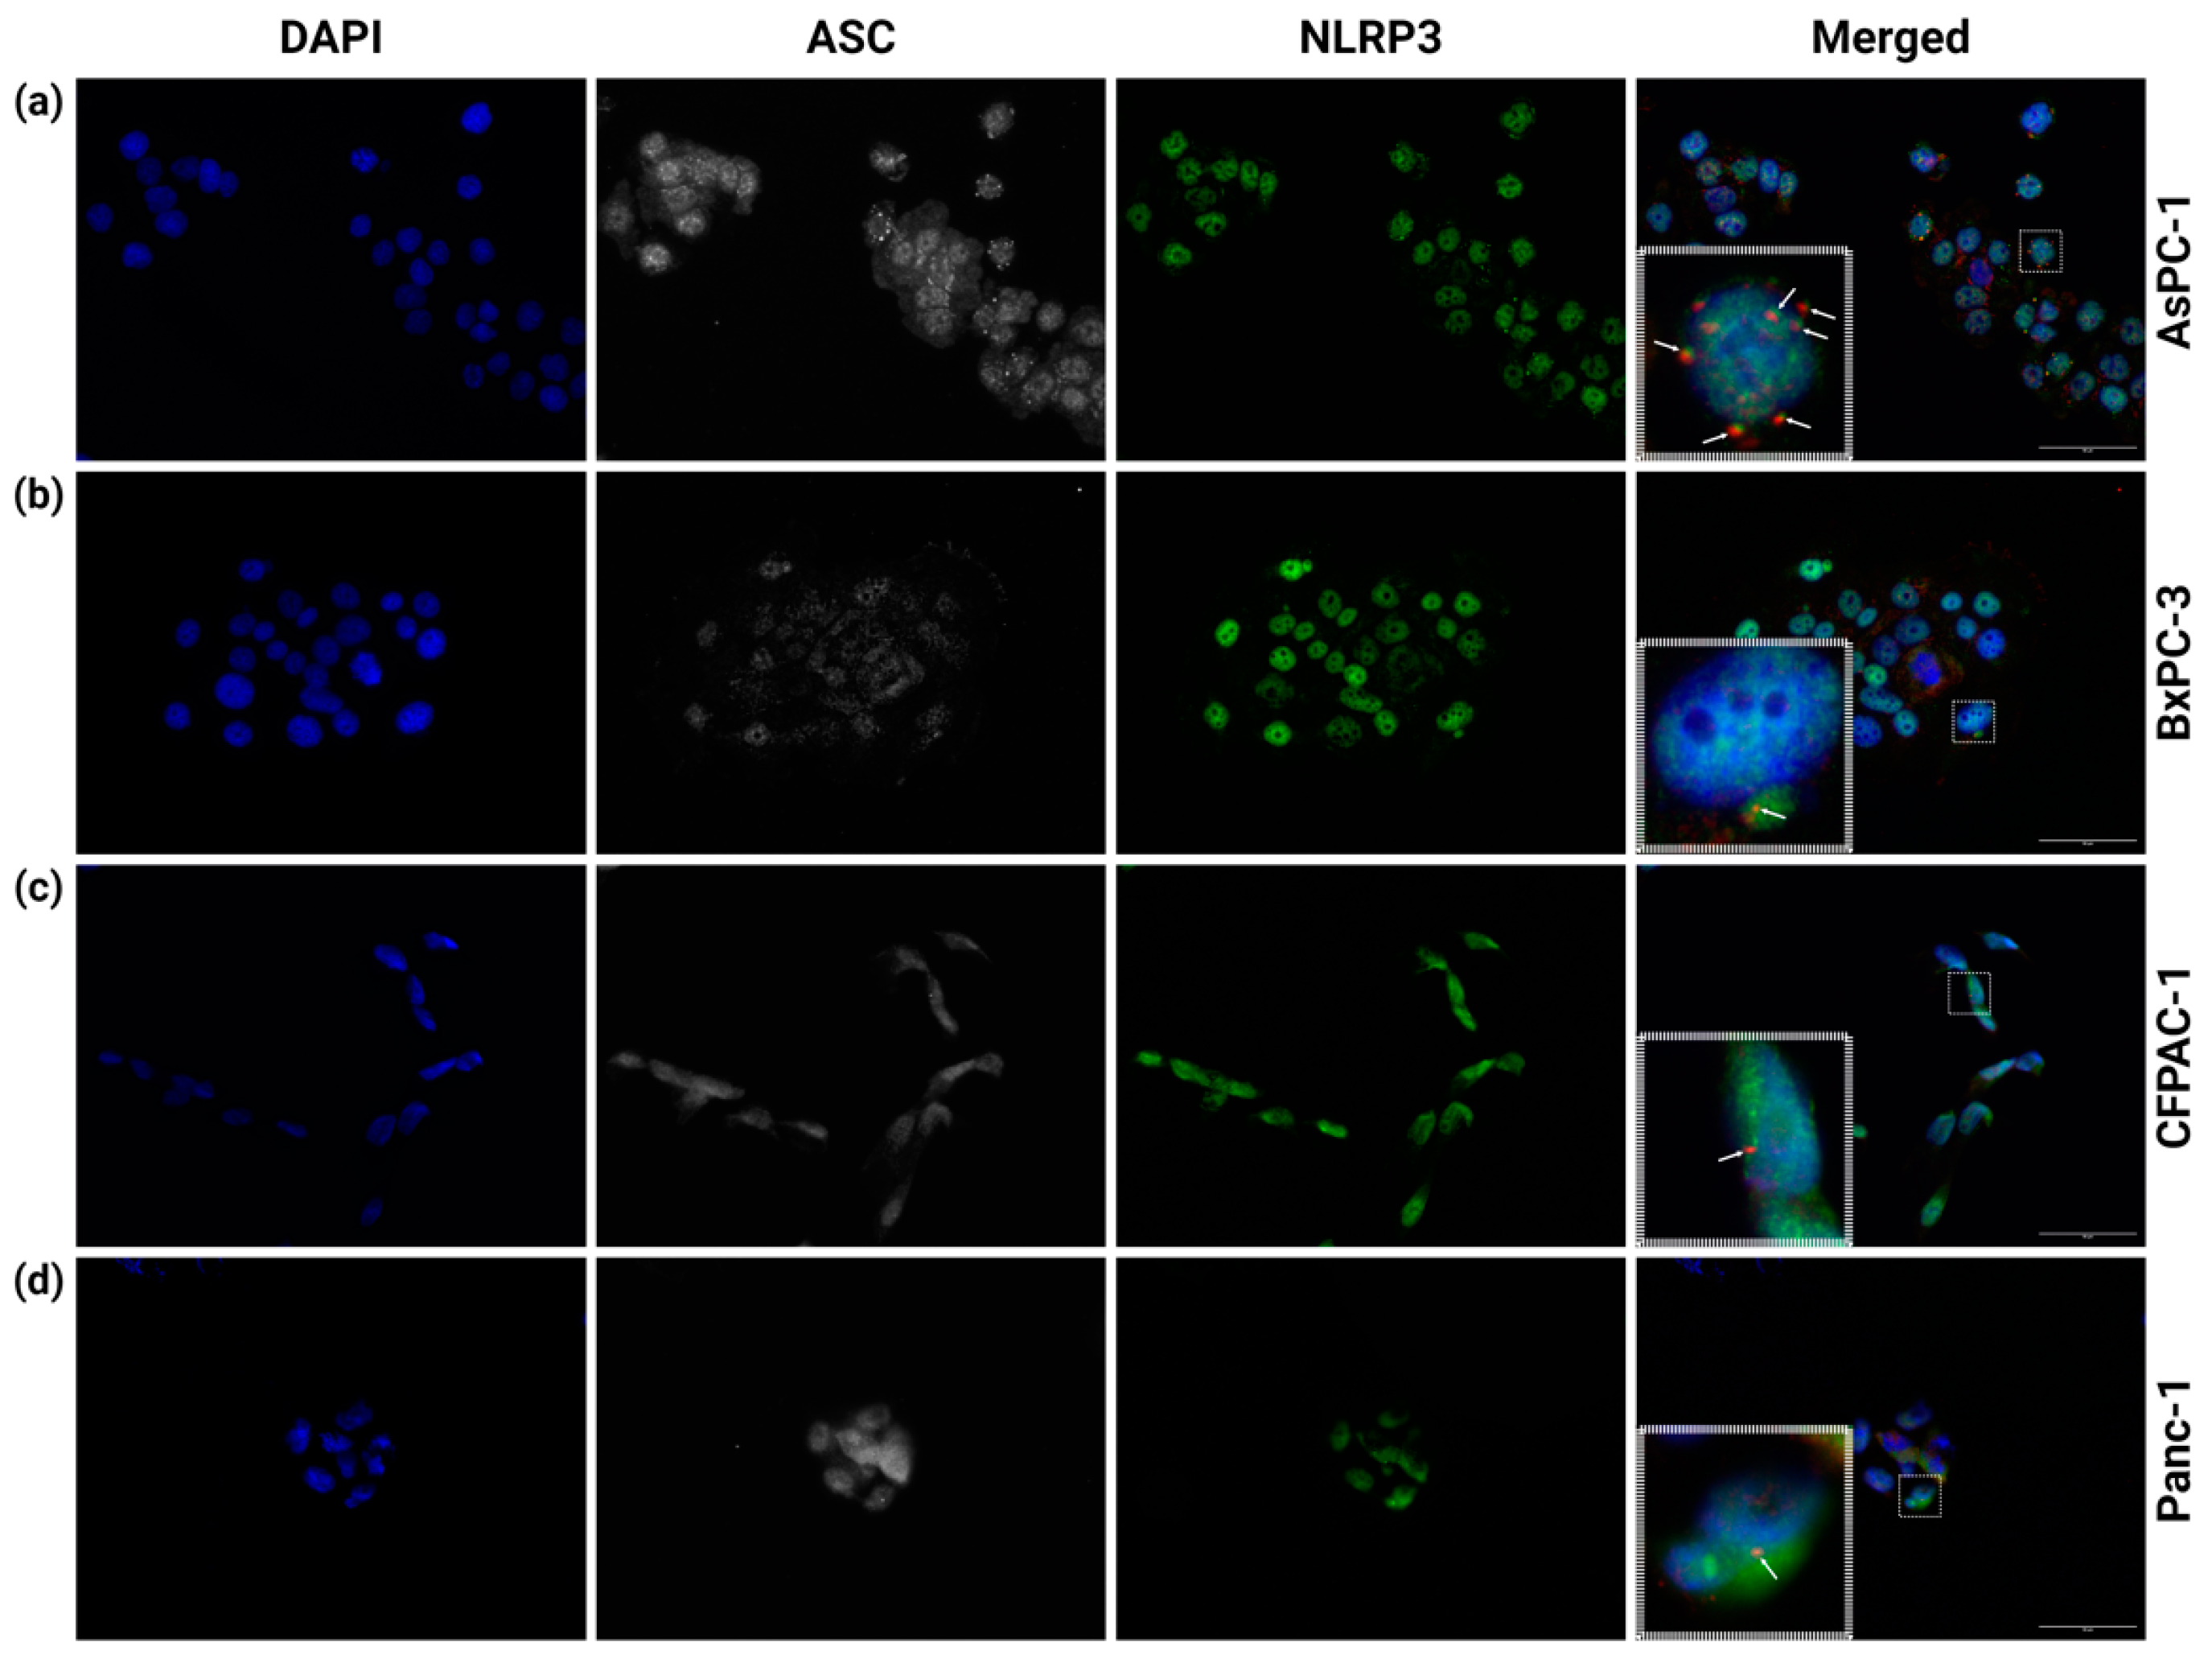
3.1. Multiple NLRP3 Inflammasomes Form Spontaneously in AsPC-1 Cells

The interaction between NLRP3 and ASC and the subsequent formation of an ASC speck are generally seen as required for inflammasome function. We therefore investigated the basal (unstimulated) inflammasome formation of the PDAC cell lines AsPC-1, BxPC-3, CFPAC-1 and Panc-1. To detect inflammasome formation, the PDAC cells were coimmunostained with anti-ASC and anti-NLRP3 antibodies. The co-localization of anti-ASC and anti-NLRP3 indicates NLRP3 inflammasome formation. In the AsPC-1 cells, several inflammasomes in the same cell could be detected (Figure 1a). The co-localization of NLRP3 and ASC was measured in the AsPC-1 cells (n = 8) and showed a high degree of above-threshold correlation (r = 0.727 ± 0.06). The Costes’ p-value for all the co-localization measurements was 1.00 (values above 0.95 indicate significance). In the cell lines BxPC-3, CFPAC-1 and Panc-1, ASC-speck-like structures were infrequently observed (Figure 1b–d), but these did not co-localize with NLRP3.
As there were important differences in the inflammasome formation observed between the cell lines, and as the inflammasome functions as a scaffold for the cleavage of pro-IL-1β and -18, we next evaluated whether or not the various PDAC cell lines secreted these cytokines. BxPC-3 was the only cell line with detectable basal levels of extracellular IL-1β (mean of 7.2 pg/mL, n = 3). The extracellular IL-18 levels were significantly higher in BxPC-3 as compared to the other cell lines (Figure 2). The secretion of IL-18 was reliably detected in the media from AsPC-1 and CFPAC-1 (Figure 2) but was in both cases under the quantification limit of the assay. Panc-1 did not produce detectable levels of IL-18.

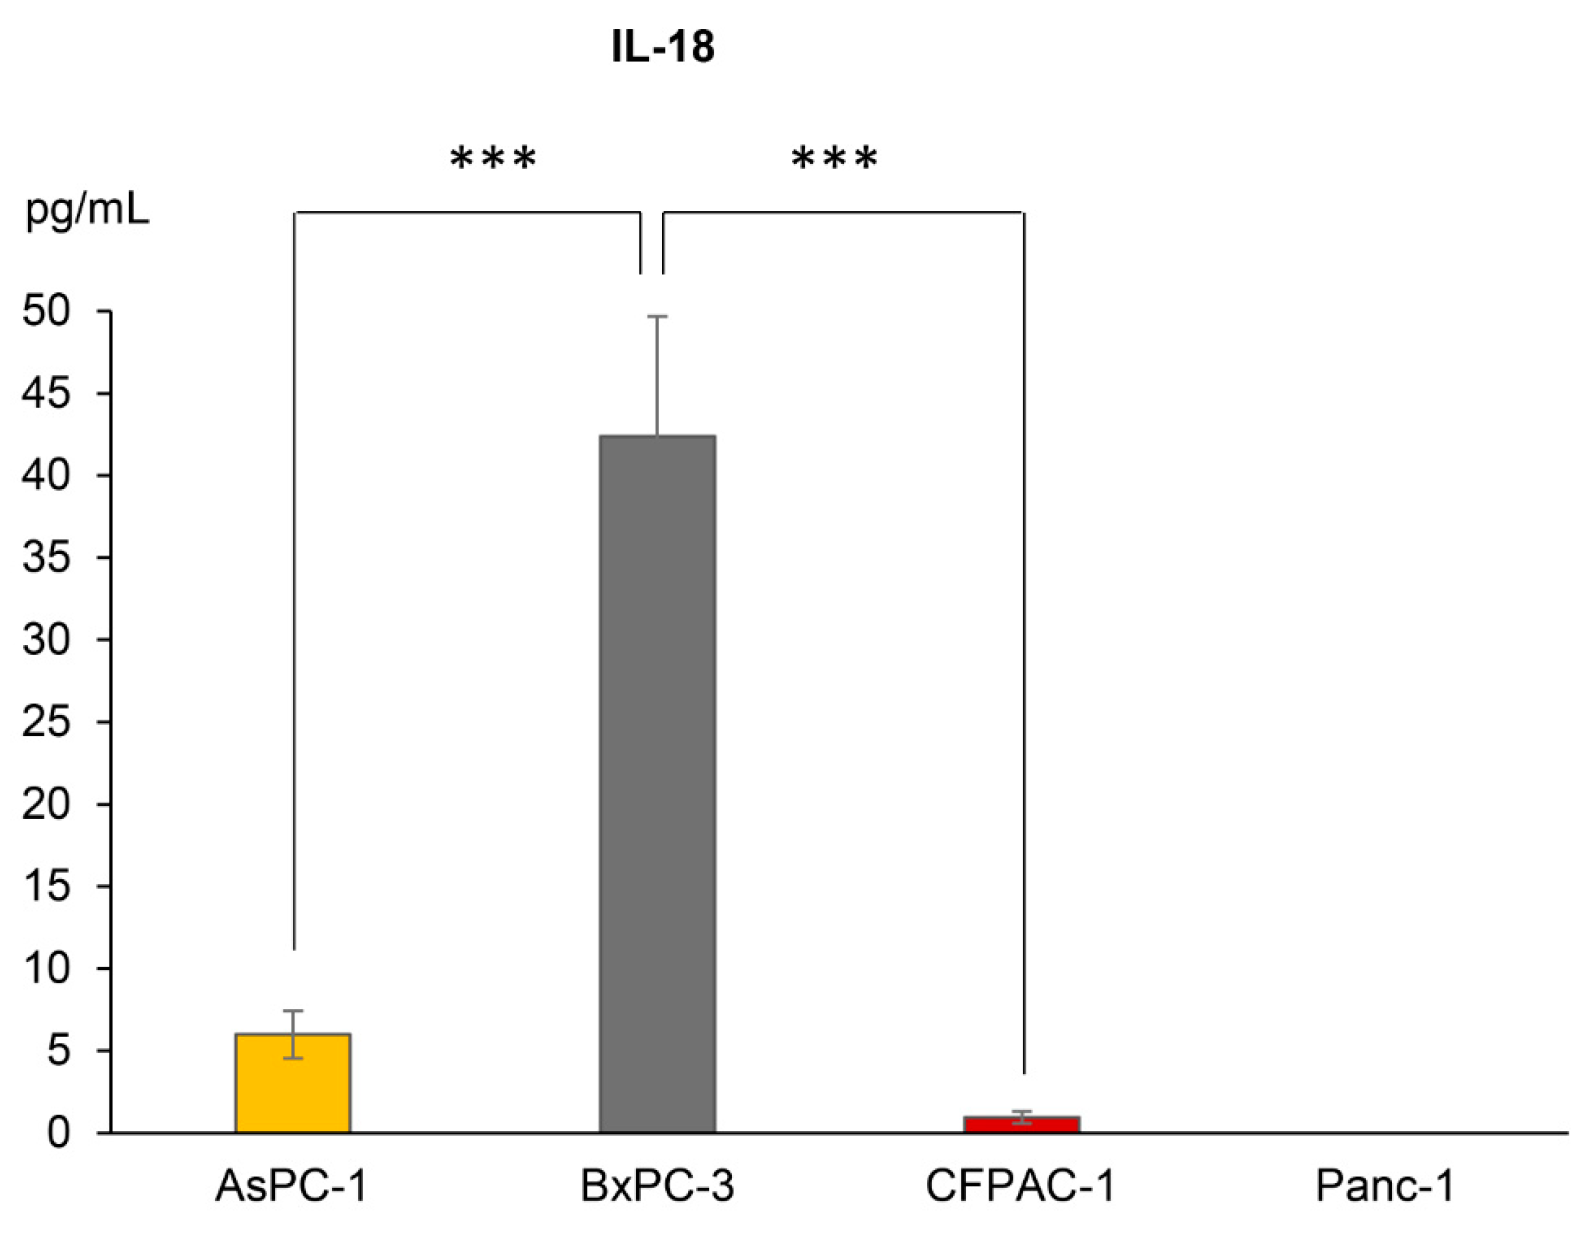
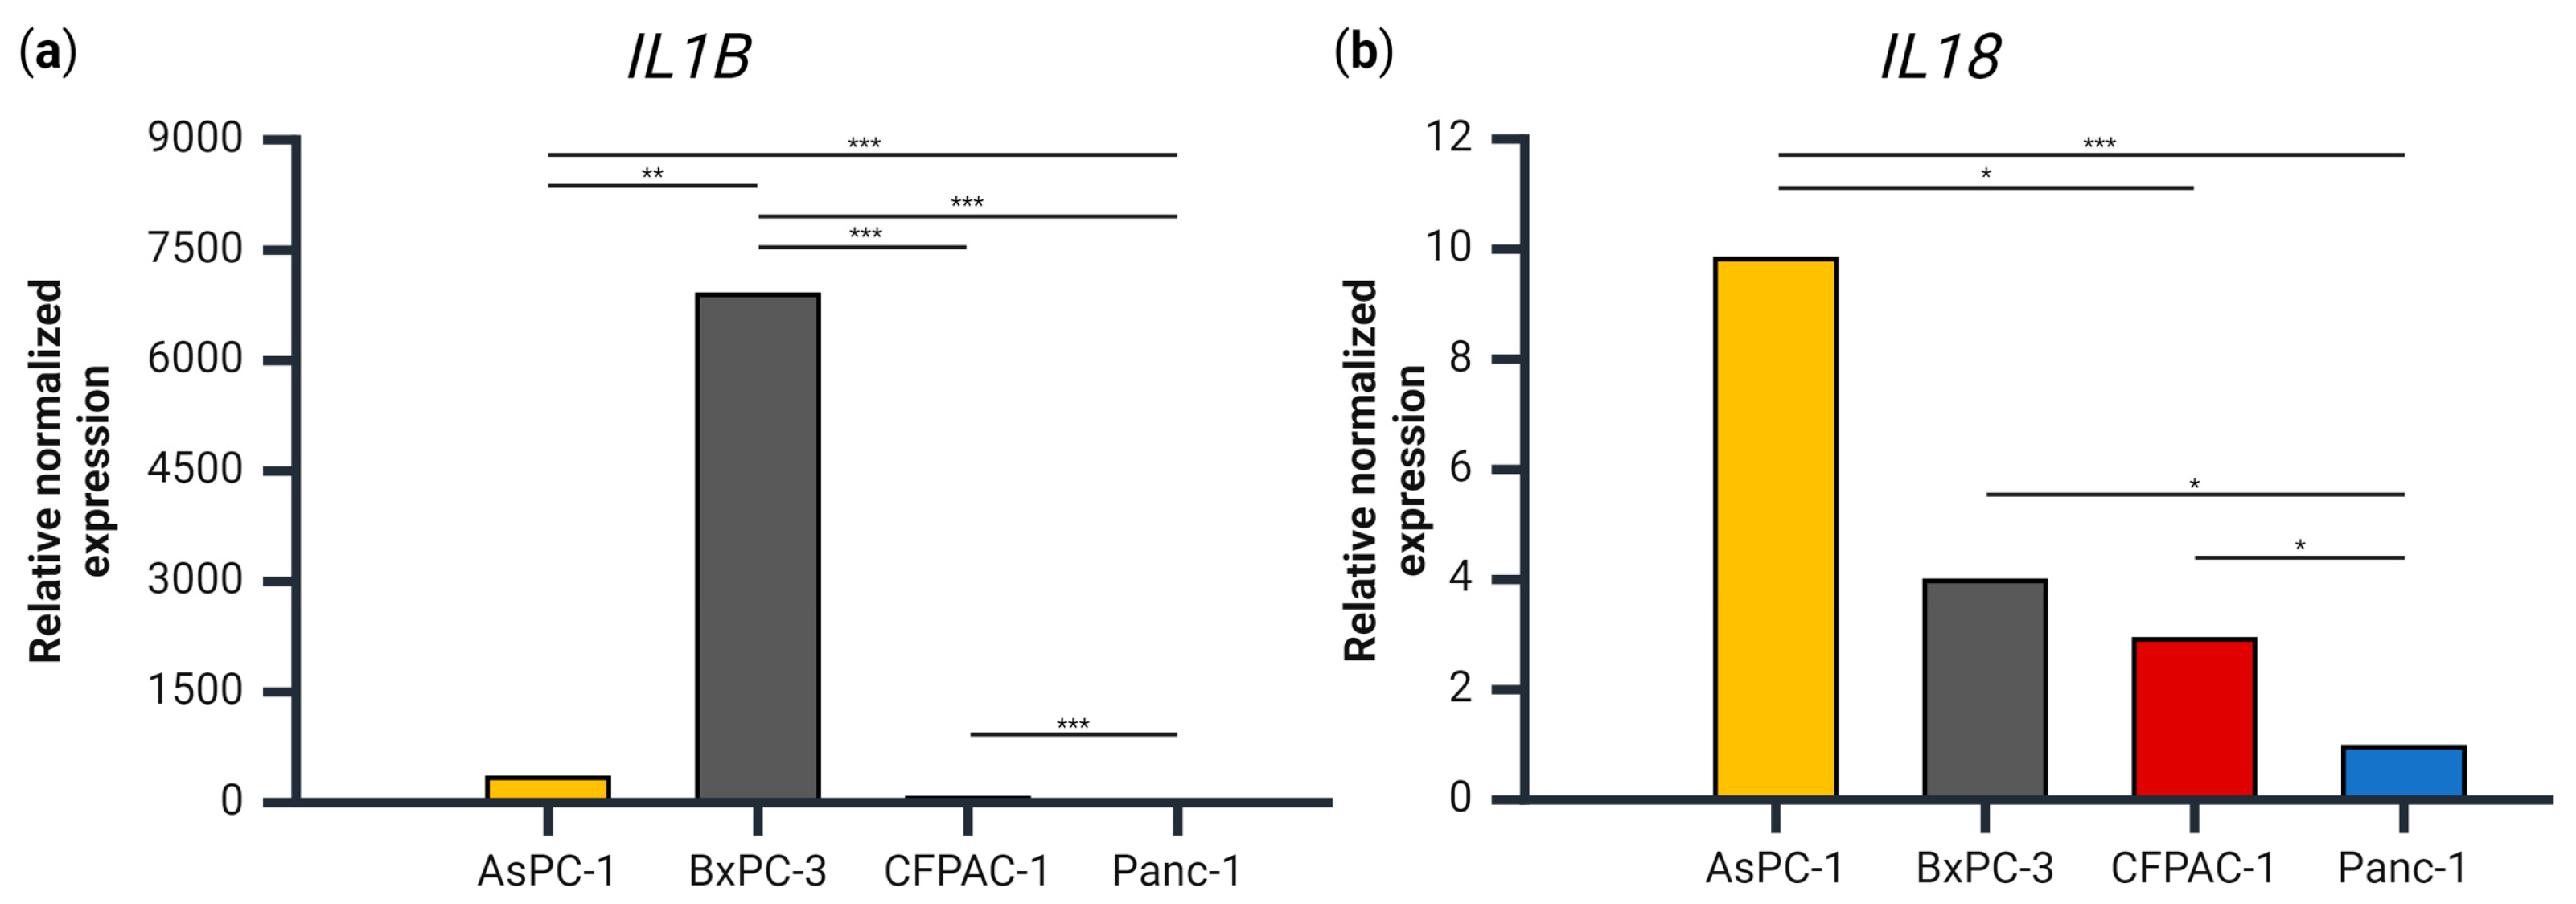
3.2. IL1B, but Not IL18, Gene Expression Levels Coincide with Secretion Levels

The role of ASC speck assembly is, ultimately, to lead to the secretion of IL-1β and IL-18, but IL-1β secretion was only observed in one of the four cell lines. We therefore examined the gene expression of IL1B and IL18 to see whether the secretion levels corresponded to the level of the respective transcript. The expression of IL1B relative to PMM1 and GAPDH was approximately 7000-, 60- and 20-fold higher in the BxPC-3 cells compared Panc-1, CFPAC-1 and AsPC-1, respectively (Figure 3). These results coincide well with the fact that BxPC-3 was the only cell line with detectable levels of extracellular IL-1β.
With regards to IL18 expression, AsPC-1 had a significantly higher expression than both CFPAC-1 and Panc-1 (Figure 3b), which was not the case for IL-18 release (Figure 2). BxPC-3 and CFPAC-1 both had a significantly higher IL18 expression than Panc-1, which corresponds with the IL-18 secretion patterns.

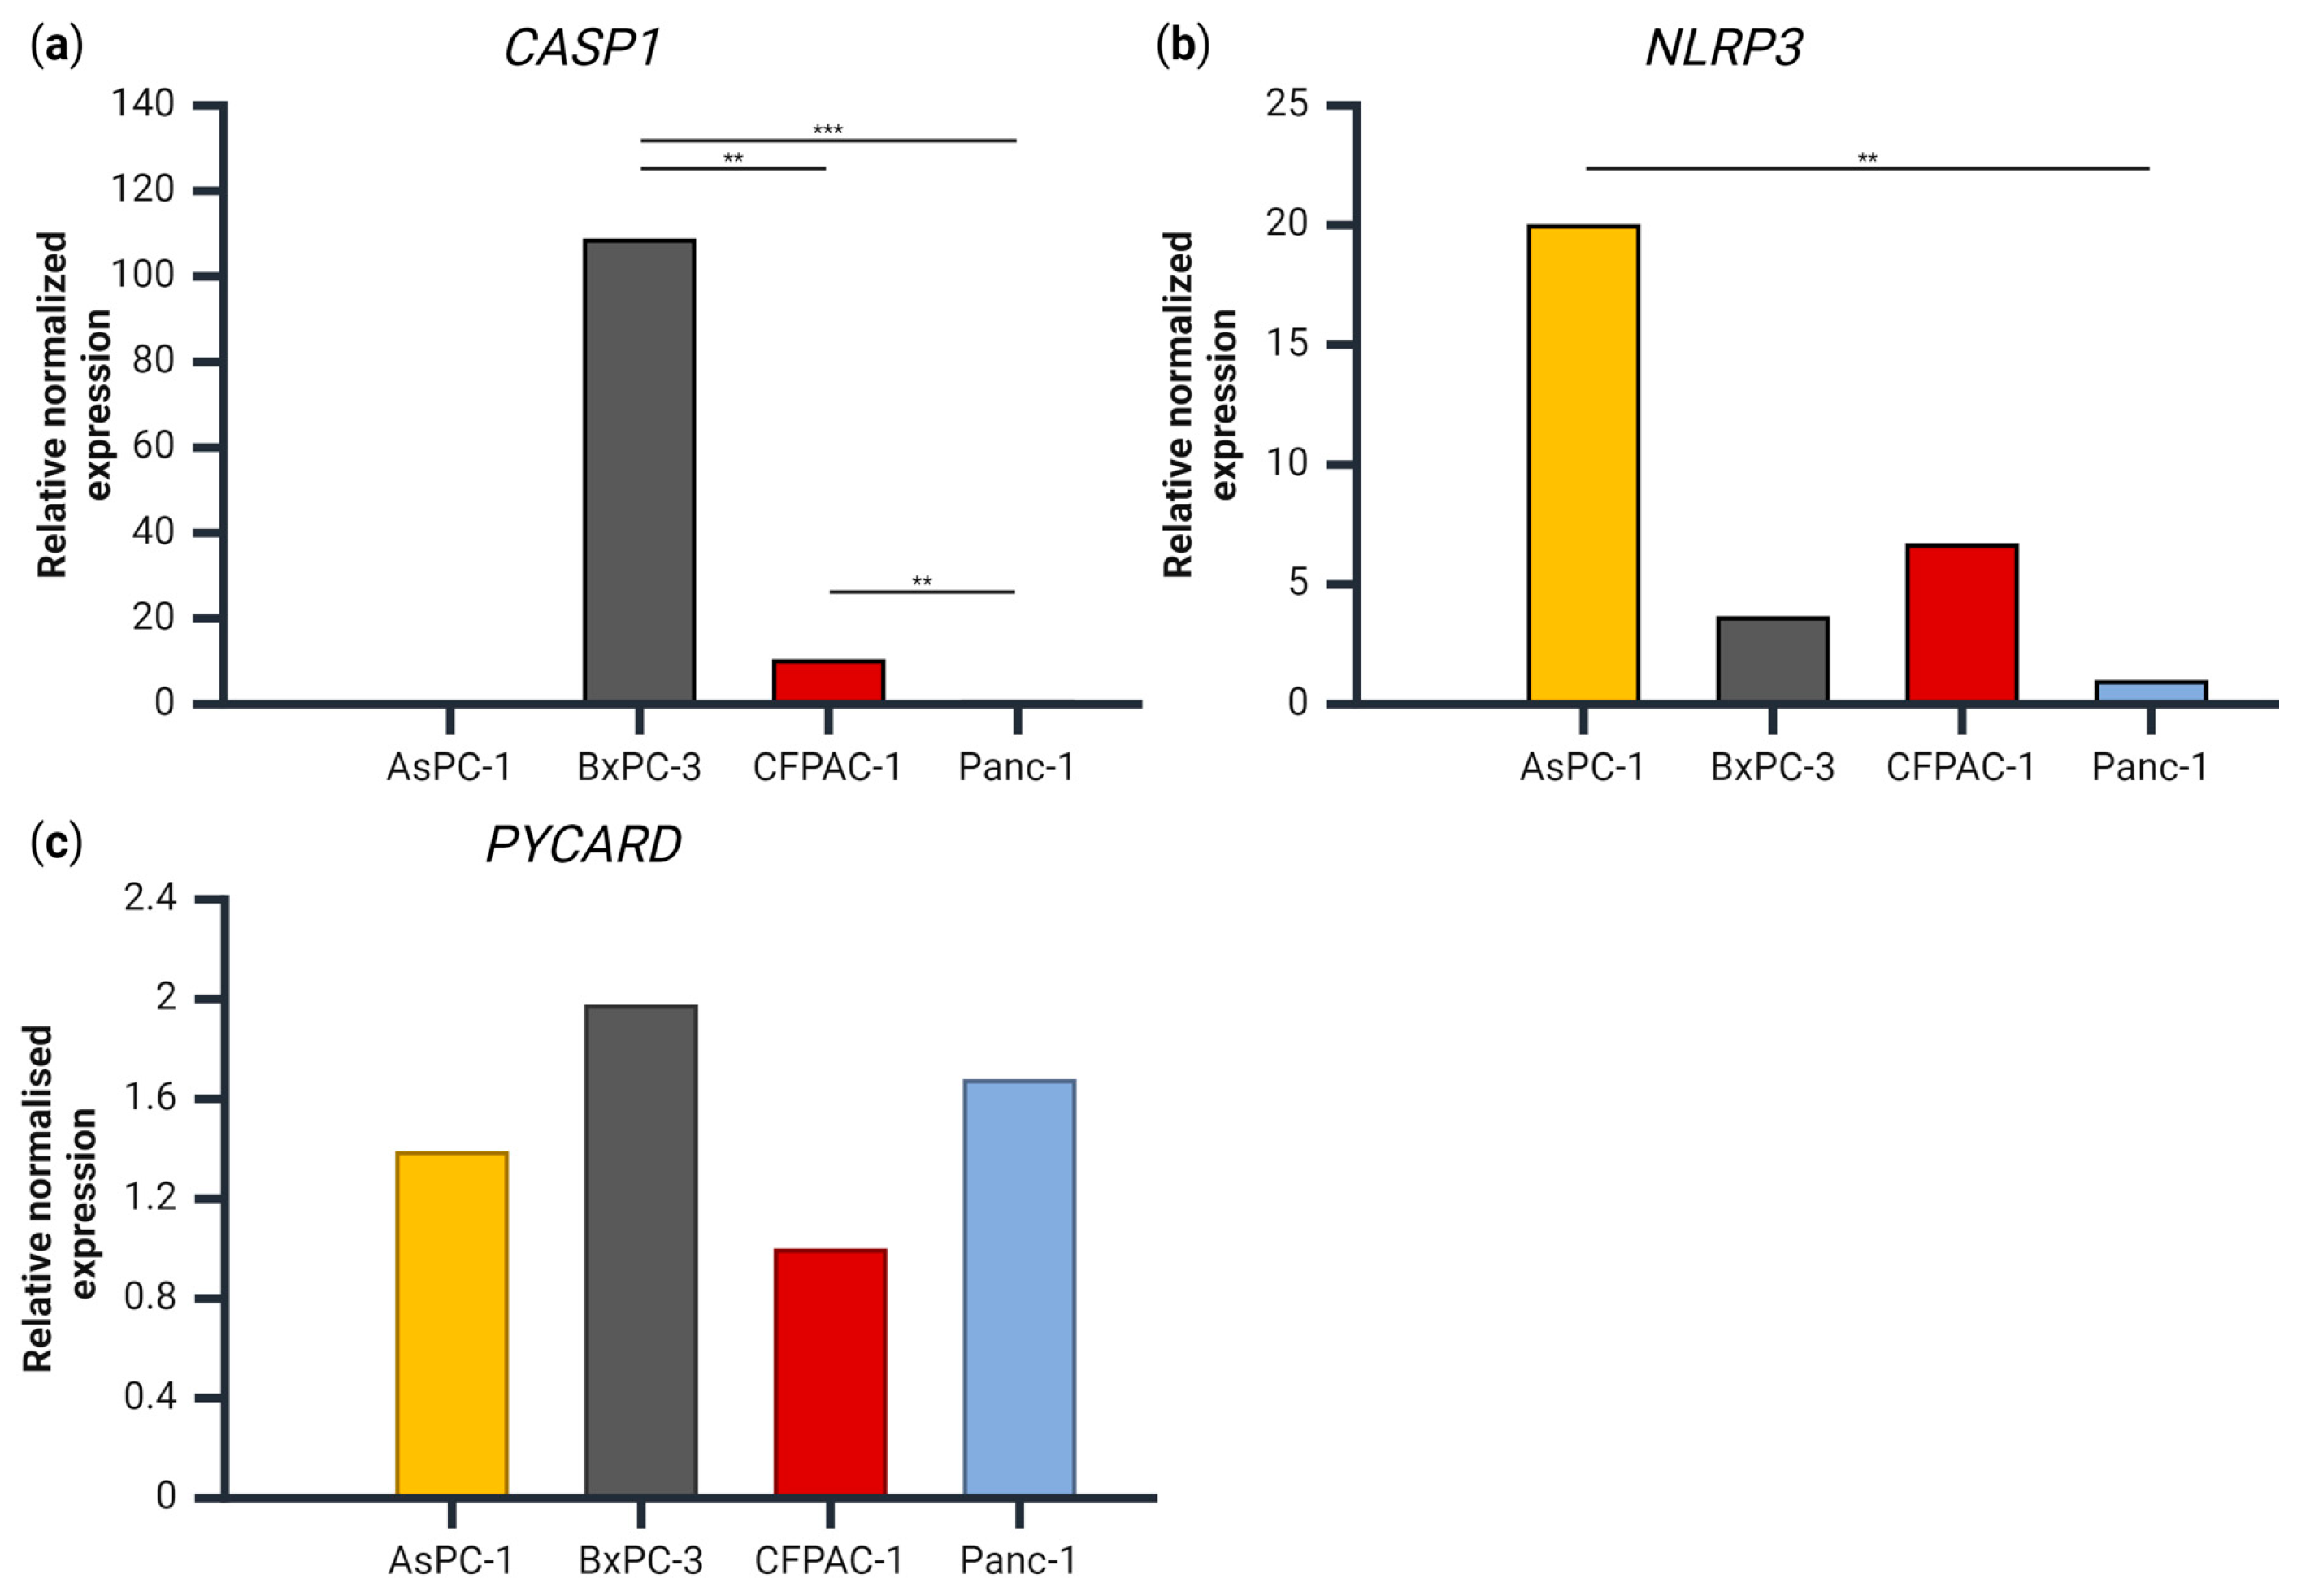
3.3. Gene Expression of CASP1, PYCARD and NLRP3 in the PDAC Cell Lines

As IL-1β and IL-18 release were seemingly not associated with the presence of NLRP3 inflammasome complexes, we examined the gene expression to evaluate whether the lack of released IL-1β was due to a lack of expression of the NLRP3-inflammasome related genes CASP1, NLRP3 or PYCARD (which codes for ASC) (Figure 4). For the gene expression of CASP1, there were significant differences between all the cell lines, with the highest expression measured in BxPC-3 and no detectable expression in the AsPC-1 cells (Figure 4a). For the NLRP3 gene, AsPC-1 had a significantly higher expression compared to Panc-1 (Figure 4b), but no other significant differences were observed between the cell lines. There was no significant difference in the PYCARD gene expression between any of the cell lines (Figure 4c).

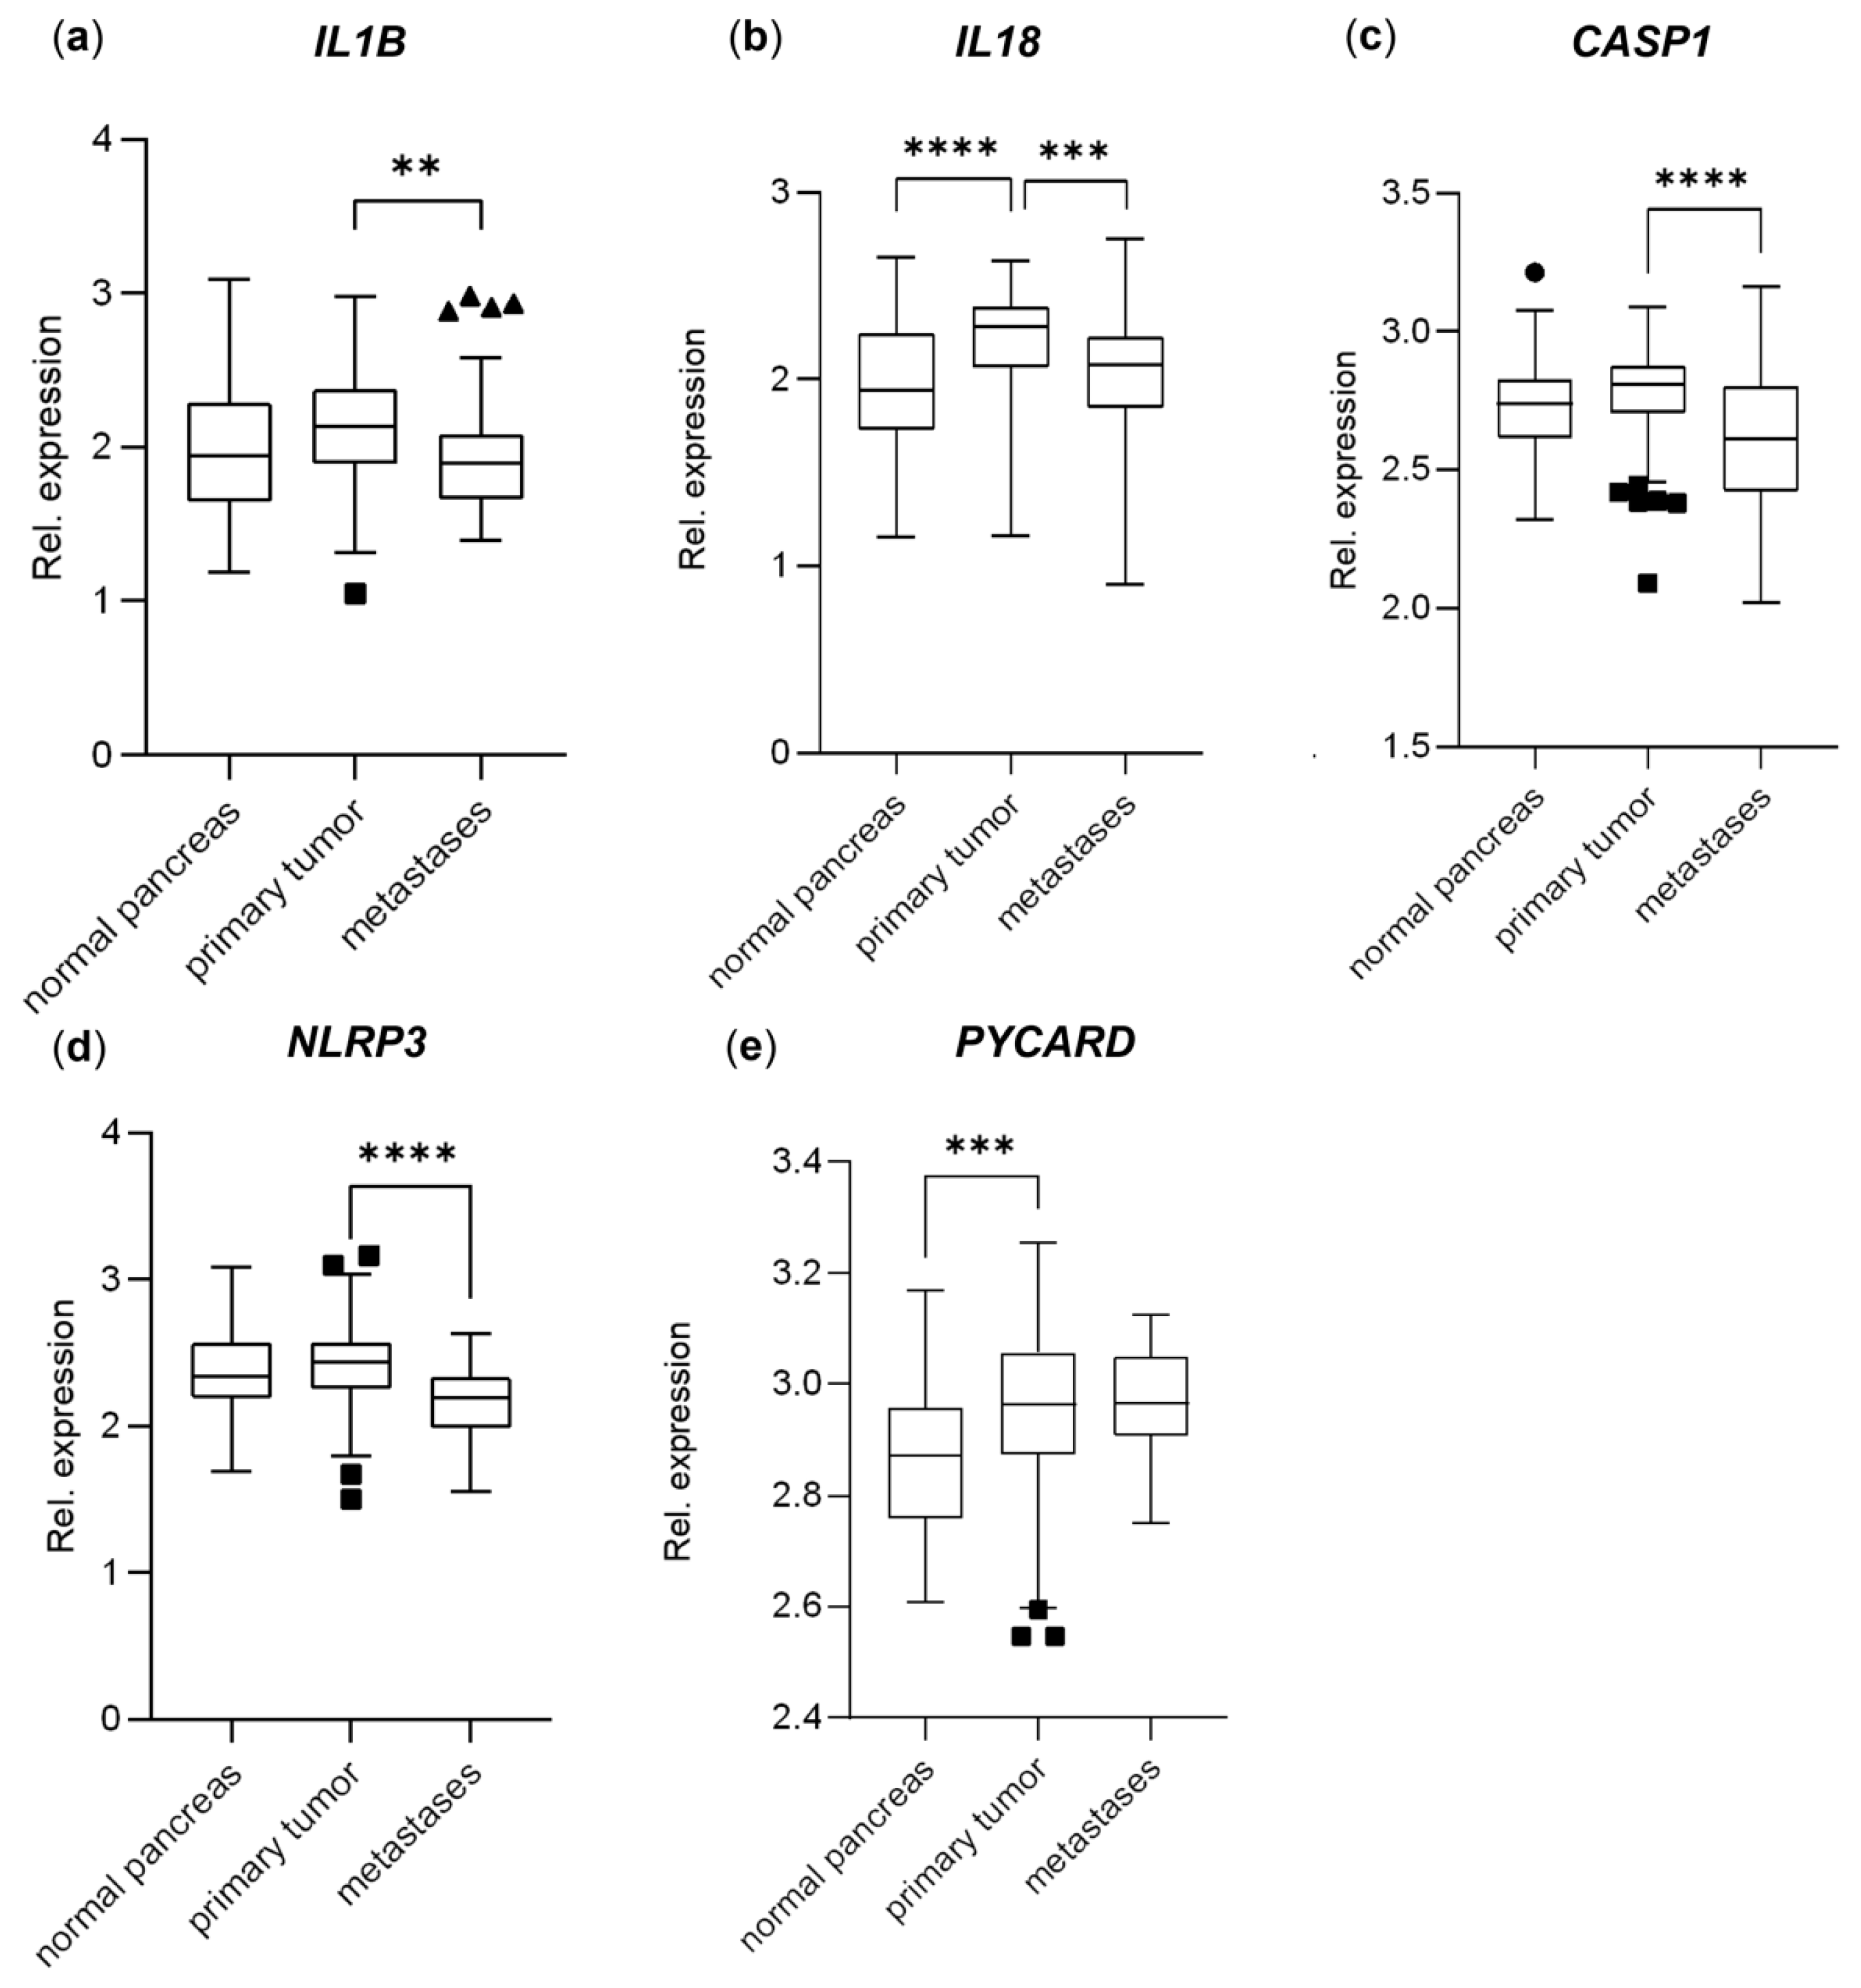
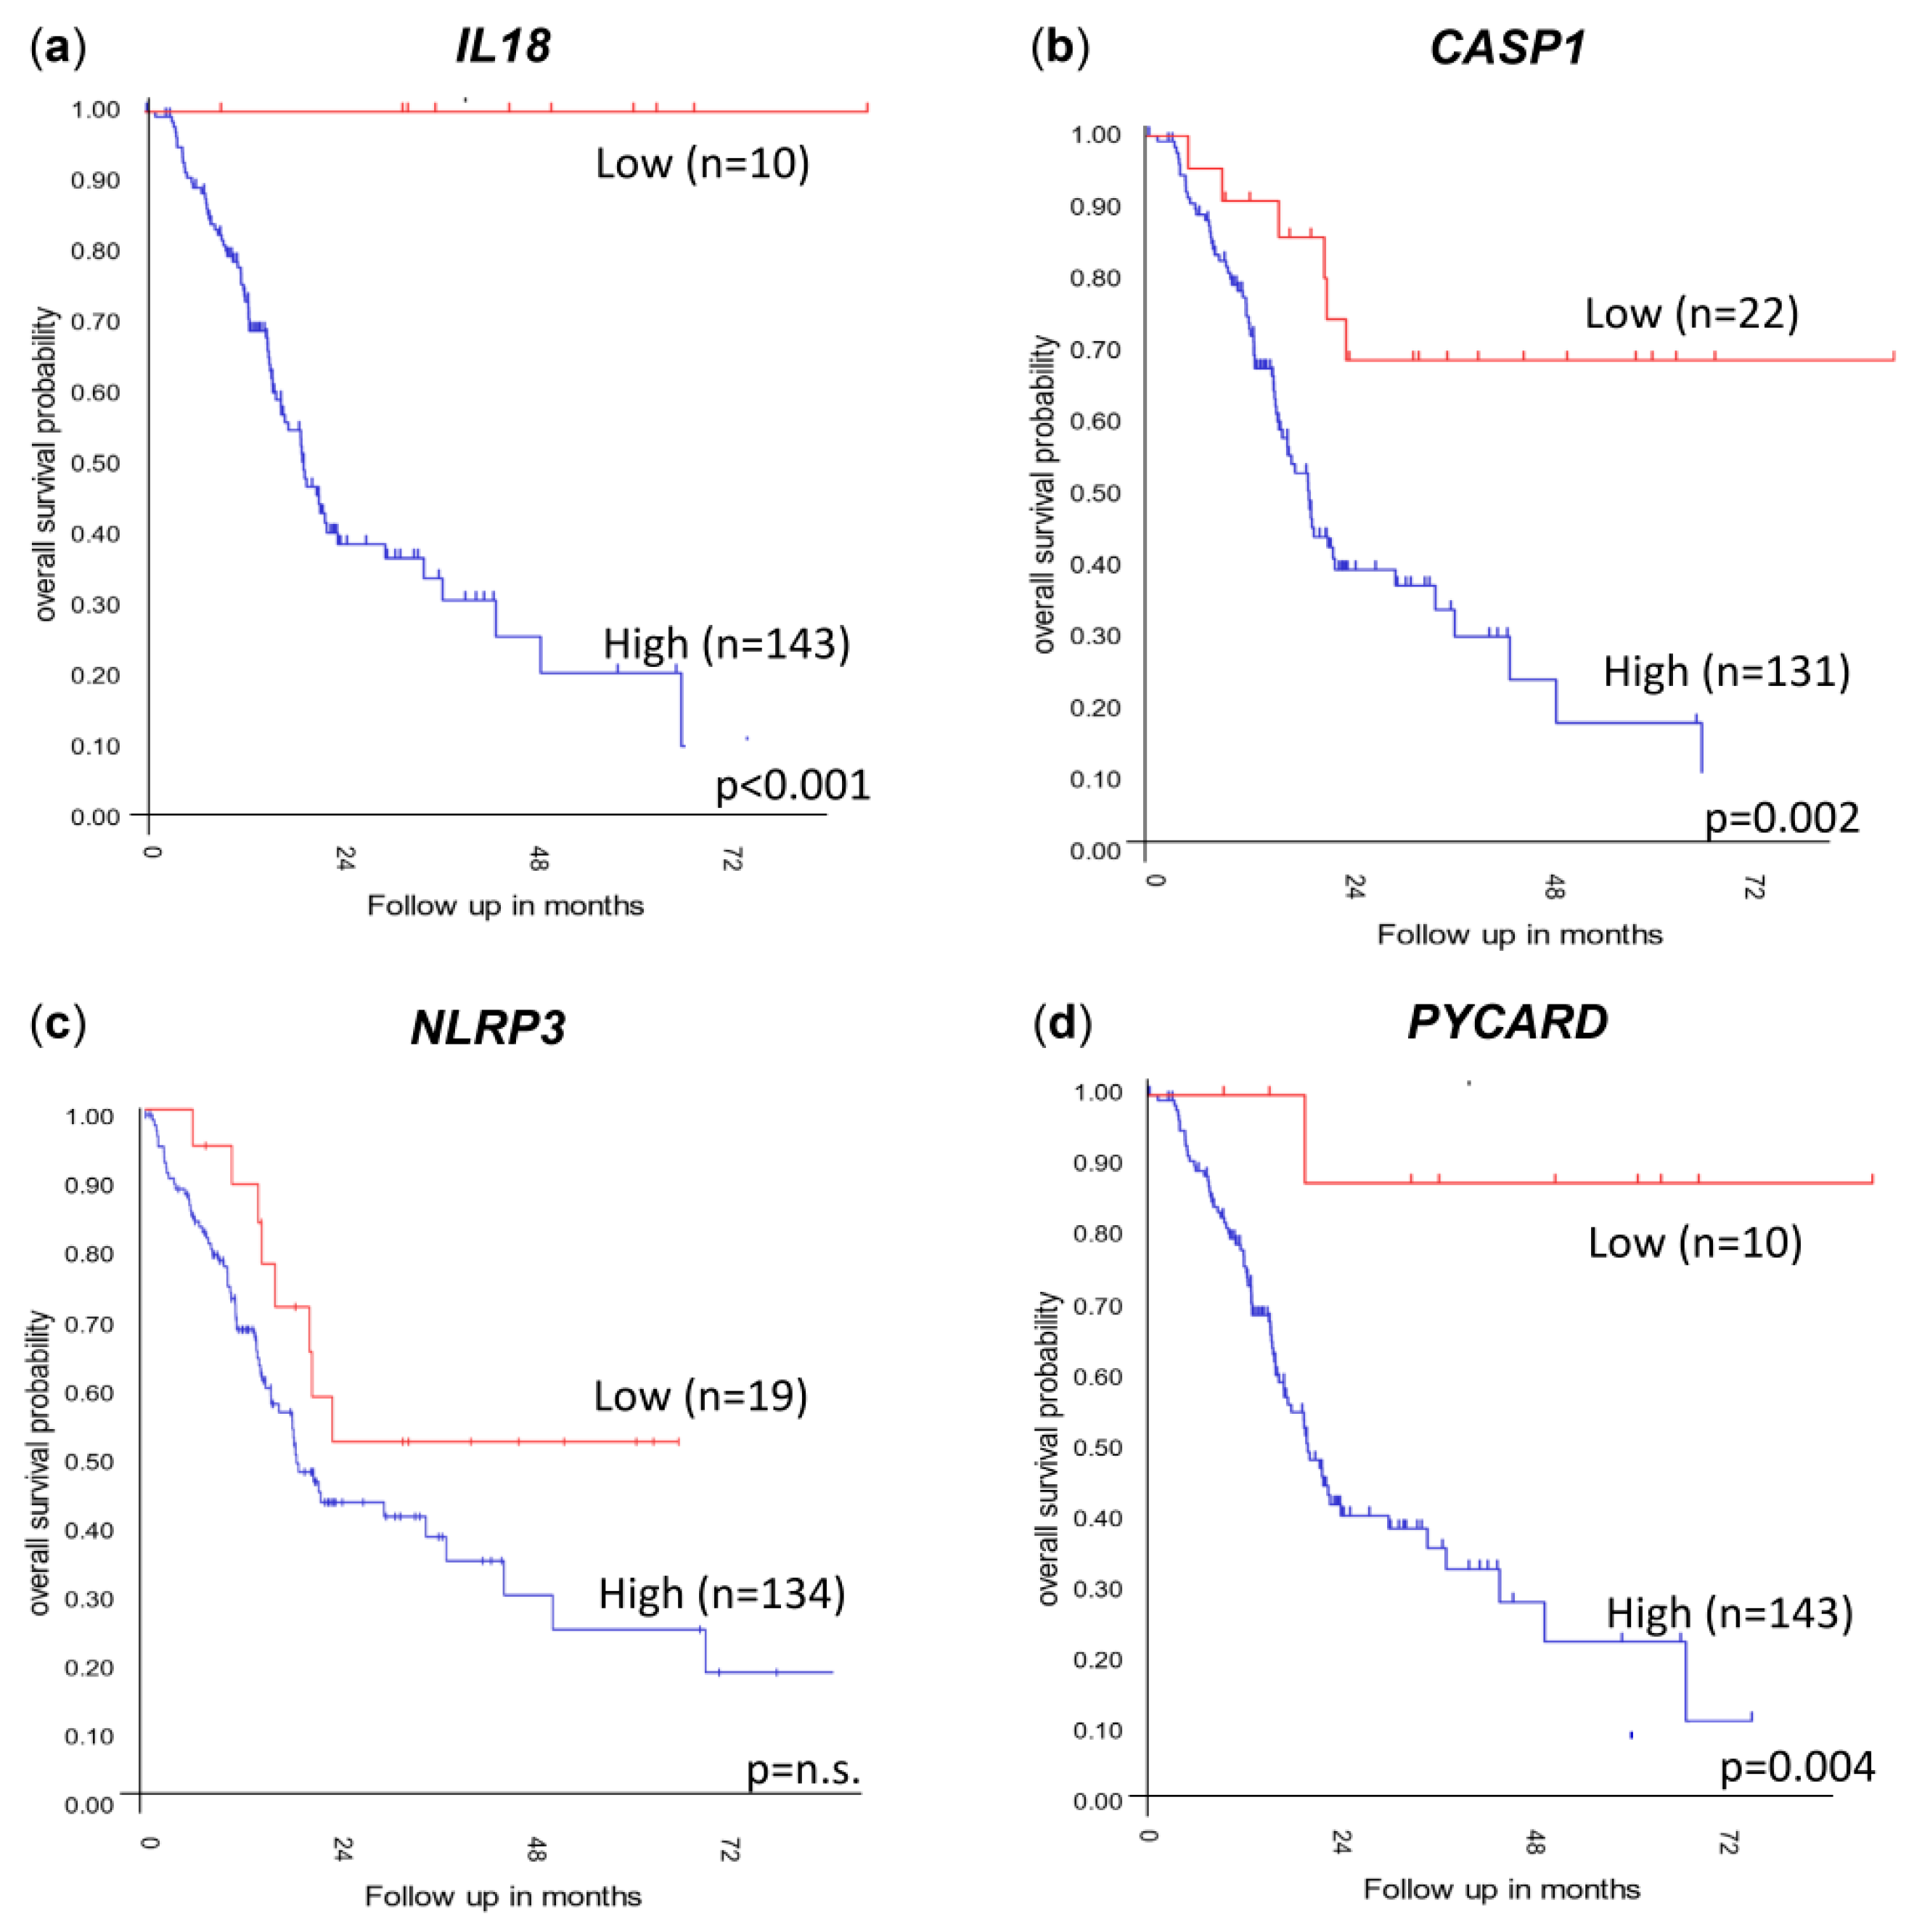
3.4. Genes Important to Inflammasome Response Are Affected in PDAC Primary Tumors and Metastases and Affect Overall Survival

To confirm the importance of inflammasome-related genes in PDAC, we investigated the expression of the inflammasome-related genes IL1B, IL18, CASP1, NLRP3 and PYCARD using publicly available microarray data on a PDAC primary tumor cohort (GSE71729) [26]. The results were verified using independent PDAC cohorts (GSE62165) [27] and (GSE28735) [28]. All the datasets were obtained from the R2 Genomics Analysis and Visualization Platform (http://r2.amc.nl) (accessed on 14 December 2023).
The IL1B gene expression was slightly higher in the primary PDAC tumors compared to both the normal pancreatic tissue (10% higher, not significant) and metastases (14% higher, p < 0.01) (Figure 5a), and IL18 had a significantly higher expression in the primary tumor samples compared to both the normal tissue (19% higher, p < 0.0001) and the metastases (14% higher, p < 0.001) (Figure 5b) in the PDAC primary tumor cohort (GSE71729) [26]. The CASP1 expression was equal between the normal and primary tumor tissues; however, it was lower in the metastases (13% lower, p < 0.0001) (Figure 5c), similar to NLRP3, with a 17% lowered expression in the metastases (p < 0.0001) (Figure 5d). The PYCARD gene, encoding the ASC protein, had increased expression in both the primary PDAC tumors and metastases compared to the normal pancreatic tissue (6% increase, p < 0.001) (Figure 5e).
To investigate whether the levels of IL1B, IL18, CASP1, NLRP3 and PYCARD gene expression affected the overall survival, the independent PDAC tumor cohorts Mixed Pancreatic Adenocarcinoma (2022v32) (http://r2.amc.nl) (accessed on 14 December 2023 (Figure 6) and GSE62452 [29] were used; the data were obtained and analyzed on the R2 Genomics Analysis and Visualization Platform (http://r2.amc.nl) (accessed on 14 December 2023. The patients were sorted according to their gene expression levels and assigned to a low-expression or high-expression group. The best possible Kaplan–Meier curve was based on the Log-rank test with a minimum group size of eight. The overall survival was evaluated and visualized using a Kaplan–Meier plot (Figure 6).
Significant differences in survival were correlated with a high PDAC tumor expression of IL18 (Figure 6a, p < 0.001) and PYCARD (Figure 6d, p = 0.004) in the 183 PDAC tumor cohort “Mixed Pancreatic Adenocarcinoma (2022v32)” (http://r2.amc.nl) (accessed on 14 December 2023), and these results could also be confirmed in the smaller second cohort GSE62452 including 130 PDAC tumors [29] (Figure S1). Decreased survival correlating with a high expression of CASP1 (Figure 6b, p = 0.002) was seen in the Mixed Pancreatic Adenocarcinoma (2022v32) (http://r2.amc.nl) (accessed on 14 December 2023) cohort. These results could not be verified in the independent PDAC tumor cohort (GSE62452) (Figure S1) [29]. A high expression of NLRP3 did not correlate with survival in the Mixed Pancreatic Adenocarcinoma (2022v32) (http://r2.amc.nl) (accessed on 14 December 2023) cohort (Figure 6c). Verifying the results in the GSE62452 cohort showed a correlation between a low expression of NLRP3 and a low overall survival (p = 0.001) (Figure S1). No significant difference in the survival of PDAC patients due to the level of tumor gene expression was detected for IL1B in these two datasets.

3.5. BxPC-3 Cells Have a High Total ASC Level

A high gene expression of PYCARD was detected in the PDAC primary tumors and metastases (Figure 5e) and correlated with poor survival (Figure 6d). Further, an increased ASC amount has been associated with pancreatic cancer in patient material [21]. We therefore decided to investigate whether the amount of ASC protein was connected with inflammasome assembly in the PDAC cell lines. Western blotting was performed, and the results showed a significantly higher amount of ASC in the BxPC-3 cells as compared to the other three cell lines, AsPC-1 (p = 0.002), CFPAC-1 (p = 0.004) and Panc-1 (p = 0.027) (Figure 7). No significant difference in expression between AsPC-1 and CFPAC-1 or Panc-1 or between BxPC-3 and CFPAC-1 or Panc-1 was observed.

4. Discussion

Inflammasomes have been shown to have both beneficial and detrimental roles in cancer development, depending on the type and stage of the cancer [31,32,33], and NLRP3 has been proposed as a potentially promising therapeutic target in certain cancers [34,35,36]. In PDAC, the NLRP3 inflammasome is believed to have a detrimental role, as IL-1β increases PDAC cancer cell invasiveness [37], and IL-18, but not IL-1β, is associated with poor survival [38,39], which is in agreement with our data (Figure 6a). In addition, we found that increased expression of CASP1 (Figure 6b) and PYCARD (Figure 6d) correlates with poor survival. NLRP3 inhibition shows antitumor effects in PDAC models [36], although we found no association between NLRP3 expression and overall survival in the cohorts examined (Figure 6c). The expression of IL1B, IL18, CASP1 and NLRP3 was significantly lower in the metastases compared to the primary tumors (Figure 5), which may be reflective of differential microenvironments leading to an altered immune modulatory program, which the tumor itself can affect, as proposed earlier [17], through changed expression of inflammasome-associated genes. Inhibition of the initial steps of inflammation, i.e., inhibiting important parts of the inflammasome building (ASC speck formation, caspase-1, IL-1β and IL-18), is a promising treatment approach, making antagonists of the inflammasome pathway potential antitumor drugs [40].
Cell lines derived from PDAC tumors are often used as models for PDAC, and since inflammation in general, and the NLRP3 inflammasome in particular, seems to play an important role in PDAC, it is important to be aware of which, if any, differences exist between cell lines with regards to inflammasome formation and downstream readouts.
The AsPC-1 cells exhibited clear NLRP3 inflammasome formation, as determined by the co-localization of NLRP3 and ASC, with the cells often having five to ten NLRP3 inflammasomes per cell (Figure 1a). These observations are contrary to the common view that a cell only forms a single inflammasome [41,42]. The co-localization of NLRP3 and ASC in the AsPC-1 cells did not lead to IL-1β release and only very low levels of extracellular IL-18 (Figure 2). Importantly, the lack of detectable CASP1 expression (Figure 4a) in the AsPC-1 cells likely leads to a very low level of pro-caspase-1 and incomplete (lacking caspase-1) or poorly functioning NLRP3 inflammasome complexes.
BxPC-3 was the only cell line with detectable levels of extracellular IL-1β, despite no NLRP3/ASC speck co-localization. These cells also had a high expression of IL1B (Figure 3a) and CASP1 (Figure 4a) and a significantly higher amount of ASC compared to the other cell lines investigated. In the BxPC-3 cells, we saw a connection between the ASC amount and the inflammasome readouts of IL-1β/18, although this was seemingly not mediated by the NLRP3 inflammasome. Further investigation of this cell line with regards to other NLRPs is therefore warranted to elucidate the mechanisms behind this cytokine release and the importance of the ASC amount.
The CFPAC-1 and Panc-1 cell lines had no detectable secretion of IL-1β and low (CFPAC-1) or undetectable (Panc-1) release of IL-18 (Figure 2). We did not observe any co-localization of NLRP3 and ASC specks in the CFPAC-1 or Panc-1 cells, even if occasional ASC specks were observed (Figure 1c,d).
Spontaneous ASC speck formation has been shown in PDAC cell lines previously [20], and our results confirm this but also show that the basal tendency to form NLRP3/ASC speck co-localization (inflammasomes) differs between PDAC cell lines. We also observed a difference in the ASC amount between cell lines, but a higher ASC amount was not associated with more ASC speck formation. A high expression of ASC protein is often used as a marker for inflammasome formation in multiple types of cancer [21,31,43,44,45,46,47,48,49]. The ASC protein levels [13] and PYCARD gene expression [50] (Figure 5e) were increased in the PDAC tissue, but our results imply that the ASC amount alone may be a poor marker for inflammasome formation.
The discrepancies in the basal inflammasome-related gene expression, NLRP3 inflammasome formation and cytokine release observed in this study demonstrate the heterogeneity between PDAC cell lines. Furthermore, it is important to note that single readout (e.g., ASC speck or cytokine release) analysis is not sufficient to infer the functionality of a specific inflammasome, as we see NLRP3/ASC speck co-localization (inferring NLRP3 inflammasome complex formation) without cytokine readouts and cytokine readouts without NLRP3 inflammasome formation. It has also previously been shown that ASC speck formation is not necessarily correlated with IL-1β processing and that inflammasome formation and inflammasome function may be distinct from each other [51]. Confirming inflammasome functionality may require verification of the presence of multiple readouts in combination, such as ASC speck formation, caspase-1 activation and/or IL-1β secretion. It is also necessary to investigate the differences observed in this study in a more pro-inflammatory setting.
We conclude that, in line with the previous data, inflammasome formation in PDAC cells is possible, and even spontaneous, in a subset of PDAC cells but that the presence of inflammasome structures per se does not automatically entail mechanistic functionality, i.e., the secretion of active IL-1β and IL18. Using a selection of available PDAC cell lines, we demonstrated fundamental differences and pointed out important discrepancies with regards to inflammasome formation and IL-1β/IL-18 secretion, which are important to note when choosing appropriate cell lines to use as PDAC models. The impact of these differences must be assessed and evaluated by researchers, and their importance depends entirely on the research question. Research on the inflammasome in PDAC seems to be a good avenue to explore further since the inflammasome is an important key player in the development and progression of PDAC.

Supplementary Materials

The following supporting information can be downloaded at https://www.mdpi.com/article/10.3390/ijtm4020013/s1. Figure S1. WB ASC.

Author Contributions

H.L., M.H. and K.E. performed the experiments and statistical analysis and drafted the manuscript. H.L. and M.H. designed the study and performed the data interpretation. F.S., K.E., J.H. and M.F. contributed to the methodological discussions, manuscript writing and critical editing. All authors have read and agreed to the published version of the manuscript.

Funding

This research was funded by the Assar Gabrielsson Foundation, grant number FB22-55.

Institutional Review Board Statement

Not applicable.

Informed Consent Statement

Not applicable.

Data Availability Statement

The datasets used and/or analyzed during the current study are available from the corresponding author on reasonable request.

Conflicts of Interest

The authors declare no conflicts of interest.

References

  1. Lesina, M.; Kurkowski, M.U.; Ludes, K.; Rose-John, S.; Treiber, M.; Klöppel, G.; Yoshimura, A.; Reindl, W.; Sipos, B.; Akira, S.; et al. Stat3/Socs3 Activation by IL-6 Transsignaling Promotes Progression of Pancreatic Intraepithelial Neoplasia and Development of Pancreatic Cancer. Cancer Cell 2011, 19, 456–469. [Google Scholar] [CrossRef] [PubMed]
  2. Fukuda, A.; Wang Sam, C.; Morris John, P.I.V.; Folias Alexandra, E.; Liou, A.; Kim Grace, E.; Akira, S.; Boucher Kenneth, M.; Firpo Matthew, A.; Mulvihill Sean, J.; et al. Stat3 and MMP7 Contribute to Pancreatic Ductal Adenocarcinoma Initiation and Progression. Cancer Cell 2011, 19, 441–455. [Google Scholar] [CrossRef]
  3. Farrow B, Evers BM: Inflammation and the development of pancreatic cancer. Surg. Oncol. 2002, 10, 153–169. [CrossRef] [PubMed]
  4. Kanak, M.A.; Shahbazov, R.; Yoshimatsu, G.; Levy, M.F.; Lawrence, M.C.; Naziruddin, B. A small molecule inhibitor of NFκB blocks ER stress and the NLRP3 inflammasome and prevents progression of pancreatitis. J. Gastroenterol. 2017, 52, 352–365. [Google Scholar] [CrossRef]
  5. Liu, T.; Wang, Q.; Du, Z.; Yin, L.; Li, J.; Meng, X.; Xue, D. The trigger for pancreatic disease: NLRP3 inflammasome. Cell Death Discov. 2023, 9, 246. [Google Scholar] [CrossRef] [PubMed]
  6. Latz, E.; Xiao, T.S.; Stutz, A. Activation and regulation of the inflammasomes. Nat. Rev. Immunol. 2013, 13, 397–411. [Google Scholar] [CrossRef] [PubMed]
  7. Zhiyu, W.; Wang, N.; Wang, Q.; Peng, C.; Zhang, J.; Liu, P.; Ou, A.; Zhong, S.; Cordero, M.D.; Lin, Y. The inflammasome: An emerging therapeutic oncotarget for cancer prevention. Oncotarget 2016, 7, 50766–50780. [Google Scholar] [CrossRef] [PubMed]
  8. Evavold, C.L.; Ruan, J.; Tan, Y.; Xia, S.; Wu, H.; Kagan, J.C. The Pore-Forming Protein Gasdermin D Regulates Interleukin-1 Secretion from Living Macrophages. Immunity 2018, 48, 35–44.e36. [Google Scholar] [CrossRef]
  9. He, W.T.; Wan, H.; Hu, L.; Chen, P.; Wang, X.; Huang, Z.; Yang, Z.-H.; Zhong, C.-Q.; Han, J. Gasdermin D is an executor of pyroptosis and required for interleukin-1β secretion. Cell Res. 2015, 25, 1285–1298. [Google Scholar] [CrossRef]
  10. Heilig, R.; Dick, M.S.; Sborgi, L.; Meunier, E.; Hiller, S.; Broz, P. The Gasdermin-D pore acts as a conduit for IL-1β secretion in mice. Eur. J. Immunol. 2018, 48, 584–592. [Google Scholar] [CrossRef]
  11. Bryan, N.B.; Dorfleutner, A.; Rojanasakul, Y.; Stehlik, C. Activation of inflammasomes requires intracellular redistribution of the apoptotic speck-like protein containing a caspase recruitment domain. J. Immunol. 2009, 182, 3173–3182. [Google Scholar] [CrossRef] [PubMed]
  12. He, Y.; Zeng, M.Y.; Yang, D.; Motro, B.; Núñez, G. NEK7 is an essential mediator of NLRP3 activation downstream of potassium efflux. Nature 2016, 530, 354–357. [Google Scholar] [CrossRef] [PubMed]
  13. Amo-Aparicio, J.; Dominguez, A.; Atif, S.M.; Dinarello, A.; Azam, T.; Alula, K.M.; Piper, M.; Lieu, C.H.; Lentz, R.W.; Leal, A.D.; et al. Pancreatic Ductal Adenocarcinoma Cells Regulate NLRP3 Activation to Generate a Tolerogenic Microenvironment. Cancer Res. Commun. 2023, 3, 1899–1911. [Google Scholar] [CrossRef] [PubMed]
  14. Turner, M.D.; Nedjai, B.; Hurst, T.; Pennington, D.J. Cytokines and chemokines: At the crossroads of cell signalling and inflammatory disease. Biochim. Biophys. Acta (BBA)-Mol. Cell Res. 2014, 1843, 2563–2582. [Google Scholar] [CrossRef] [PubMed]
  15. Mantovani, A.; Barajon, I.; Garlanda, C. IL-1 and IL-1 regulatory pathways in cancer progression and therapy. Immunol. Rev. 2018, 281, 57–61. [Google Scholar] [CrossRef] [PubMed]
  16. Bent, R.; Moll, L.; Grabbe, S.; Bros, M. Interleukin-1 Beta—A Friend or Foe in Malignancies? Int. J. Mol. Sci. 2018, 19, 2155. [Google Scholar] [CrossRef] [PubMed]
  17. Das, S.; Shapiro, B.; Vucic, E.A.; Vogt, S.; Bar-Sagi, D. Tumor Cell-Derived IL1β Promotes Desmoplasia and Immune Suppression in Pancreatic Cancer. Cancer Res. 2020, 80, 1088–1101. [Google Scholar] [CrossRef] [PubMed]
  18. Qiang, R.; Li, Y.; Dai, X.; Lv, W. NLRP3 inflammasome in digestive diseases: From mechanism to therapy. Front. Immunol. 2022, 13, 978190. [Google Scholar] [CrossRef] [PubMed]
  19. Tjomsland, V.; Spångeus, A.; Välilä, J.; Sandström, P.; Borch, K.; Druid, H.; Falkmer, S.; Falkmer, U.; Messmer, D.; Larsson, M. Interleukin 1α sustains the expression of inflammatory factors in human pancreatic cancer microenvironment by targeting cancer-associated fibroblasts. Neoplasia 2011, 13, 664–675. [Google Scholar] [CrossRef]
  20. Brunetto, E.; De Monte, L.; Balzano, G.; Camisa, B.; Laino, V.; Riba, M.; Heltai, S.; Bianchi, M.; Bordignon, C.; Falconi, M.; et al. The IL-1/IL-1 receptor axis and tumor cell released inflammasome adaptor ASC are key regulators of TSLP secretion by cancer associated fibroblasts in pancreatic cancer. J. Immunother. Cancer 2019, 7, 45. [Google Scholar] [CrossRef]
  21. Zheng, L.; Liu, H. Prognostic association between NLRP3 inflammasome expression level and operable pancreatic adenocarcinoma. Int. J. Biol. Markers 2022, 37, 314–321. [Google Scholar] [CrossRef] [PubMed]
  22. Koizumi, M.; Watanabe, T.; Masumoto, J.; Sunago, K.; Imamura, Y.; Kanemitsu, K.; Kumagi, T.; Hiasa, Y. Apoptosis-associated speck-like protein containing a CARD regulates the growth of pancreatic ductal adenocarcinoma. Sci. Rep. 2021, 11, 22351. [Google Scholar] [CrossRef] [PubMed]
  23. Yu, Y.; Yang, G.; Huang, H.; Fu, Z.; Cao, Z.; Zheng, L.; You, L.; Zhang, T. Preclinical models of pancreatic ductal adenocarcinoma: Challenges and opportunities in the era of precision medicine. J. Exp. Clin. Cancer Res. 2021, 40, 8. [Google Scholar] [CrossRef] [PubMed]
  24. Daussy, C.F.; Monard, S.C.; Guy, C.; Muñoz-González, S.; Chazal, M.; Anthonsen, M.W.; Jouvenet, N.; Henry, T.; Dreux, M.; Meurs, E.F.; et al. The Inflammasome Components NLRP3 and ASC Act in Concert with IRGM To Rearrange the Golgi Apparatus during Hepatitis C Virus Infection. J. Virol. 2021, 95, 10–1128. [Google Scholar] [CrossRef]
  25. Bodnar-Wachtel, M.; Huber, A.L.; Gorry, J.; Hacot, S.; Burlet, D.; Gérossier, L.; Guey, B.; Goutagny, N.; Bartosch, B.; Ballot, E.; et al. Inflammasome-independent NLRP3 function enforces ATM activity in response to genotoxic stress. Life Sci. Alliance 2023, 6. [Google Scholar] [CrossRef] [PubMed]
  26. Moffitt, R.A.; Marayati, R.; Flate, E.L.; Volmar, K.E.; Loeza, S.G.H.; Hoadley, K.A.; Rashid, N.U.; Williams, L.A.; Eaton, S.C.; Chung, A.H.; et al. Virtual microdissection identifies distinct tumor- and stroma-specific subtypes of pancreatic ductal adenocarcinoma. Nat. Genet. 2015, 47, 1168–1178. [Google Scholar] [CrossRef]
  27. Janky Rs Binda, M.M.; Allemeersch, J.; Van den Broeck, A.; Govaere, O.; Swinnen, J.V.; Roskams, T.; Aerts, S.; Topal, B. Prognostic relevance of molecular subtypes and master regulators in pancreatic ductal adenocarcinoma. BMC Cancer 2016, 16, 632. [Google Scholar] [CrossRef]
  28. Zhang, G.; He, P.; Tan, H.; Budhu, A.; Gaedcke, J.; Ghadimi, B.M.; Ried, T.; Yfantis, H.G.; Lee, D.H.; Maitra, A.; et al. Integration of metabolomics and transcriptomics revealed a fatty acid network exerting growth inhibitory effects in human pancreatic cancer. Clin. Cancer Res. 2013, 19, 4983–4993. [Google Scholar] [CrossRef]
  29. Yang, S.; He, P.; Wang, J.; Schetter, A.; Tang, W.; Funamizu, N.; Yanaga, K.; Uwagawa, T.; Satoskar, A.R.; Gaedcke, J.; et al. A Novel MIF Signaling Pathway Drives the Malignant Character of Pancreatic Cancer by Targeting NR3C2. Cancer Res. 2016, 76, 3838–3850. [Google Scholar] [CrossRef]
  30. Bolte, S.; Cordelières, F.P. A guided tour into subcellular colocalization analysis in light microscopy. J. Microsc. 2006, 224, 213–232. [Google Scholar] [CrossRef]
  31. Hamarsheh, S.; Zeiser, R. NLRP3 Inflammasome Activation in Cancer: A Double-Edged Sword. Front. Immunol. 2020, 11, 538030. [Google Scholar] [CrossRef] [PubMed]
  32. Deng, Z.; Lu, L.; Li, B.; Shi, X.; Jin, H.; Hu, W. The roles of inflammasomes in cancer. Front. Immunol. 2023, 14, 1195572. [Google Scholar] [CrossRef] [PubMed]
  33. Moossavi, M.; Parsamanesh, N.; Bahrami, A.; Atkin, S.L.; Sahebkar, A. Role of the NLRP3 inflammasome in cancer. Mol. Cancer 2018, 17, 158. [Google Scholar] [CrossRef] [PubMed]
  34. Saponaro, C.; Scarpi, E.; Sonnessa, M.; Cioffi, A.; Buccino, F.; Giotta, F.; Pastena, M.I.; Zito, F.A.; Mangia, A. Prognostic Value of NLRP3 Inflammasome and TLR4 Expression in Breast Cancer Patients. Front. Oncol. 2021, 11, 705331. [Google Scholar] [CrossRef] [PubMed]
  35. Missiroli, S.; Perrone, M.; Boncompagni, C.; Borghi, C.; Campagnaro, A.; Marchetti, F.; Anania, G.; Greco, P.; Fiorica, F.; Pinton, P.; et al. Targeting the NLRP3 Inflammasome as a New Therapeutic Option for Overcoming Cancer. Cancers 2021, 13, 2297. [Google Scholar] [CrossRef] [PubMed]
  36. Liu, H.; Xu, Y.; Liang, K.; Liu, R. Immune Cells Combined With NLRP3 Inflammasome Inhibitor Exert Better Antitumor Effect on Pancreatic Ductal Adenocarcinoma. Front. Oncol. 2020, 10, 1378. [Google Scholar] [CrossRef] [PubMed]
  37. Greco, E.; Basso, D.; Fogar, P.; Mazza, S.; Navaglia, F.; Zambon, C.-F.; Falda, A.; Pedrazzoli, S.; Ancona, E.; Plebani, M. Pancreatic Cancer Cells Invasiveness is Mainly Affected by Interleukin-1β not by Transforming Growth Factor-β1. Int. J. Biol. Markers 2005, 20, 235–241. [Google Scholar] [CrossRef] [PubMed]
  38. Herremans, K.M.; Szymkiewicz, D.D.; Riner, A.N.; Bohan, R.P.; Tushoski, G.W.; Davidson, A.M.; Lou, X.; Leong, M.C.; Dean, B.D.; Gerber, M.; et al. The interleukin-1 axis and the tumor immune microenvironment in pancreatic ductal adenocarcinoma. Neoplasia 2022, 28, 100789. [Google Scholar] [CrossRef] [PubMed]
  39. Carbone, A.; Vizio, B.; Novarino, A.; Mauri, F.A.; Geuna, M.; Robino, C.; Brondino, G.; Prati, A.; Giacobino, A.; Campra, D.; et al. IL-18 Paradox in Pancreatic Carcinoma: Elevated Serum Levels of Free IL-18 are Correlated with Poor Survival. J. Immunother. 2009, 32, 920–931. [Google Scholar] [CrossRef]
  40. Xu, S.; Li, X.; Liu, Y.; Xia, Y.; Chang, R.; Zhang, C. Inflammasome inhibitors: Promising therapeutic approaches against cancer. J. Hematol. Oncol. 2019, 12, 64. [Google Scholar] [CrossRef]
  41. Li, X.; Thome, S.; Ma, X.; Amrute-Nayak, M.; Finigan, A.; Kitt, L.; Masters, L.; James, J.R.; Shi, Y.; Meng, G.; et al. MARK4 regulates NLRP3 positioning and inflammasome activation through a microtubule-dependent mechanism. Nat. Commun. 2017, 8, 15986. [Google Scholar] [CrossRef] [PubMed]
  42. Fernandes-Alnemri, T.; Wu, J.; Yu, J.W.; Datta, P.; Miller, B.; Jankowski, W.; Rosenberg, S.; Zhang, J.; Alnemri, E.S. The pyroptosome: A supramolecular assembly of ASC dimers mediating inflammatory cell death via caspase-1 activation. Cell Death Differ 2007, 14, 1590–1604. [Google Scholar] [CrossRef] [PubMed]
  43. Cai, H.; Wang, P.; Zhang, B.; Dong, X. Expression of the NEK7/NLRP3 inflammasome pathway in patients with diabetic lower extremity arterial disease. BMJ Open Diabetes Res. Care 2020, 8, e001808. [Google Scholar] [CrossRef] [PubMed]
  44. Huang, C.F.; Chen, L.; Li, Y.C.; Wu, L.; Yu, G.T.; Zhang, W.F.; Sun, Z.J. NLRP3 inflammasome activation promotes inflammation-induced carcinogenesis in head and neck squamous cell carcinoma. J. Exp. Clin. Cancer Res. 2017, 36, 116. [Google Scholar] [CrossRef] [PubMed]
  45. Mao, K.; Chen, S.; Chen, M.; Ma, Y.; Wang, Y.; Huang, B.; He, Z.; Zeng, Y.; Hu, Y.; Sun, S.; et al. Nitric oxide suppresses NLRP3 inflammasome activation and protects against LPS-induced septic shock. Cell Res. 2013, 23, 201–212. [Google Scholar] [CrossRef] [PubMed]
  46. Mishra, N.; Schwerdtner, L.; Sams, K.; Mondal, S.; Ahmad, F.; Schmidt, R.E.; Coonrod, S.A.; Thompson, P.R.; Lerch, M.M.; Bossaller, L. Cutting Edge: Protein Arginine Deiminase 2 and 4 Regulate NLRP3 Inflammasome-Dependent IL-1β Maturation and ASC Speck Formation in Macrophages. J. Immunol. 2019, 203, 795–800. [Google Scholar] [CrossRef]
  47. Saponaro, C.; Fanizzi, A.; Sonnessa, M.; Mondelli, P.; Vergara, D.; Loisi, D.; Massafra, R.; Latorre, A.; Zito, F.A.; Schirosi, L. Downstream Signaling of Inflammasome Pathway Affects Patients’ Outcome in the Context of Distinct Molecular Breast Cancer Subtypes. Pharmaceuticals 2022, 15, 651. [Google Scholar] [CrossRef]
  48. Xue, Y.; Zhang, Y.; Chen, L.; Wang, Y.; Lv, Z.; Yang, L.-Q.; Li, S. Citrulline protects against LPS-induced acute lung injury by inhibiting ROS/NLRP3-dependent pyroptosis and apoptosis via the Nrf2 signaling pathway. Exp. Ther. Med. 2022, 24, 632. [Google Scholar] [CrossRef]
  49. Xue, Y.; Du, H.D.; Tang, D.; Zhang, D.; Zhou, J.; Zhai, C.W.; Yuan, C.C.; Hsueh, C.Y.; Li, S.J.; Heng, Y.; et al. Correlation Between the NLRP3 Inflammasome and the Prognosis of Patients With LSCC. Front. Oncol. 2019, 9, 588. [Google Scholar] [CrossRef]
  50. Liang, A.; Zhong, S.; Xi, B.; Zhou, C.; Jiang, X.; Zhu, R.; Yang, Y.; Zhong, L.; Wan, D. High expression of PYCARD is an independent predictor of unfavorable prognosis and chemotherapy resistance in glioma. Ann. Transl. Med. 2021, 9, 986. [Google Scholar] [CrossRef]
  51. Nagar, A.; Rahman, T.; Harton, J.A. The ASC Speck and NLRP3 Inflammasome Function Are Spatially and Temporally Distinct. Front. Immunol. 2021, 12, 752482. [Google Scholar] [CrossRef] [PubMed]
Figure 1. Immunostaining of (a) AsPC-1, (b) BxPC-3, (c) CFPAC-1 and (d) Panc-1 PDAC cells. Fixed cells were immunostained with anti-ASC (CY5, white) and anti-NLRP3 (AF488, green). Inserts (dashed-line boxes) show corresponding marked areas containing ASC specks with (a) or without (bd) NLRP3 co-localization of anti-ASC (CY5, red) and anti-NLRP3 (AF488, green). Representative arrows indicate ASC specks. All experiments performed five times; figures from one representative replicate. Images were taken at 40× magnification; scale bars 50 µm. Created using BioRender.com (Science Suite Inc., Toronto, ON, Canada).
Ijtm 04 00013 g001
Figure 2. Extracellular concentrations of IL-18 from AsPC-1, BxPC-3, CFPAC-1 and Panc-1 cells, detected using ELISA. Samples are shown as the mean of three biological replicates; error bars represent +/− SEM. Significant p-values indicated with *** <0.001. Comparison of IL-18 release between the cell lines was analyzed using one-way analysis of variance (ANOVA), post hoc correction Tukey’s HSD, p-value 0.05.
Ijtm 04 00013 g002
Figure 3. The gene expression of (a) IL1B and (b) IL18 relative to PMM1 and GAPDH for each cell line, normalized to the cell line with the lowest expression of each respective gene. Samples are shown as the mean of three biological replicates. Data were analyzed using one-way analysis of variance (ANOVA), post hoc correction Tukey’s HSD, * p < 0.05, ** p < 0.01, *** p < 0.001. Created using BioRender.com (Science Suite Inc., Toronto, ON, Canada).
Ijtm 04 00013 g003
Figure 4. The gene expression of (a) CASP1, (b) NLRP3 and (c) PYCARD relative to PMM1 and GAPDH for each cell line, normalized to the cell line with the lowest expression of each respective gene. Samples are shown as the mean of three biological replicates. Data were analyzed using one-way analysis of variance (ANOVA), post hoc correction Tukey’s HSD ** p < 0.01, *** p < 0.001. Created using BioRender.com (Science Suite Inc., Toronto, ON, Canada).
Ijtm 04 00013 g004
Figure 5. Relative gene expression levels of (a) IL1B, (b) IL18, (c) CASP1, (d) NLRP3, (e) PYCARD; comparing normal pancreas tissue (n = 46), primary PDAC tumors (n = 145) and metastases (n = 61); data extracted from the dataset GSE71729. The data are plotted as Tukey’s box-and-whisker plots showing the IQR, line at the median ± 1.5-fold the interquartile range. Data outside the whiskers are shown as outliers (circles = normal pancreas, squares = primary tumors, triangles = metastases). Statistical analysis comparing groups was made using log2-values, 0.05, ** p < 0.01, *** p < 0.001, **** p < 0.0001.
Ijtm 04 00013 g005
Figure 6. Kaplan–Meier plots showing the overall survival probability when stratified due to (a) IL18, (b) CASP1, (c) NLRP3 and (d) PYCARD gene expression levels. Data extracted from the Mixed Pancreatic Adenocarcinoma (2022v32) cohort (http://r2.amc.nl) (accessed on 14 December 2023). Kaplan–Meier plots are determined using the Log-rank test using the R2 Genomics Analysis and Visualization Platform 2.3. n.s. = not significant.
Ijtm 04 00013 g006
Figure 7. Representative blot (five biological replicates) (a) of ASC protein expression in PDAC cell lines, (b) total protein. (c) ASC protein expression is significantly higher in BxPC-3 compared to AsPC-1. Statistical analysis: one-way ANOVA, post hoc correction Tukey’s HSD, for comparison between samples. * p < 0.05, ** p < 0.01.
Ijtm 04 00013 g007
Disclaimer/Publisher’s Note: The statements, opinions and data contained in all publications are solely those of the individual author(s) and contributor(s) and not of MDPI and/or the editor(s). MDPI and/or the editor(s) disclaim responsibility for any injury to people or property resulting from any ideas, methods, instructions or products referred to in the content.

