Article

Serum-Derived Macrophage-Activating Factor Exhibits Anti-Tumor Activity via M2-to-M1 Macrophage Reprogramming

by
Tsuyoshi Takara
1,
Rei Takara
1,
Aya Kobayashi
1,
Hina Shirakata
1,
Shinobu Ambai
2,
Yusei Shinohara
1 and
Yoshihiro Uto
1,*
1
Institute of Technology, Industrial and Social Sciences, Tokushima University Graduate School, Tokushima 770-8506, Japan
2
Mori Co., Ltd., Tokyo 106-6155, Japan
*
Author to whom correspondence should be addressed.
Int. J. Transl. Med. 2024, 4(3), 439-449; https://doi.org/10.3390/ijtm4030029 (registering DOI)
Submission received: 11 June 2024 / Revised: 28 June 2024 / Accepted: 29 June 2024 / Published: 30 June 2024

Abstract

:
Many anti-tumor effects of group-specific component-derived macrophage-activating factors (GcMAFs) have been reported; however, the specific mechanisms remain unclear. Controlling tumor-associated macrophages (TAMs) in the tumor microenvironment is essential for cancer treatment. This study assessed the role of GcMAF in macrophage activation, elucidated the mechanisms by which it exerts its anti-tumor effects, and determined its effects on TAMs in the tumor microenvironment. GcMAF-stimulated RAW264.7 macrophages and EMT6 breast tumor cells were co-cultured in a 0.4 µm pore cell culture insert, and gene and protein expression and cell viability were evaluated. DNA microarray analysis of GcMAF-stimulated RAW264.7 cells was conducted. The induction of M2 RAW264.7 cells by interleukin (IL)-4 and IL-13 was analyzed. GcMAF stimulation increased the tumor necrosis factor-α and inducible nitric oxide synthase mRNA and protein levels in RAW264.7 cells but decreased the viability of co-cultured EMT6 cells. Although the details of the receptor or signal pathway of GcMAF are still unclear, these results were confirmed in the M2 RAW264.7 cells, suggesting that GcMAF exerts anti-tumor effects by inducing the differentiation of macrophages into the M1 type and reprogramming M2 macrophages to the M1 type. The anti-tumor activity of GcMAF via M2-to-M1 macrophage reprogramming could aid in developing novel cancer immunotherapies.

1. Introduction

The group-specific component (Gc) protein is a 51–58 kDa glycoprotein that functions as a vitamin D transporter and actin scavenger in the blood [1,2,3]. In vivo, galactose and sialic acid of Gc protein are cleaved by β-galactosidase derived from B cells and sialidase derived from T cells, respectively, to form group-specific component-derived macrophage-activating factors (GcMAFs) with an N-acetylgalactosamine residue [4]. GcMAF induces superoxide production in macrophages and inhibits angiogenesis in cancer cells [5]. We have previously observed that GcMAF enhances the phagocytic activity of peritoneal macrophages [6], inhibits angiogenesis, and reduces tumor size in tumor-bearing mice [7]. Furthermore, we report a cancer immunotherapeutic strategy to enhance the immune activity of patients with cancer using artificially glycosylated GcMAFs [8].
Tumor growth is greatly influenced by the tumor microenvironment formed by the tumor and surrounding stromal cells. Tumor-associated macrophages (TAMs), fibroblasts, and vascular endothelial cells are the major components of tumor stromal cells that promote tumor growth, invasion, angiogenesis, and immunosuppression [9]. There are two main types of macrophages: M1 macrophages, which are important in innate immunity, such as the production of inflammatory cytokines and phagocytosis, and M2 macrophages, which exert anti-inflammatory effects and induce immunosuppressive cytokines [10]. Although macrophages are a mixture of these two types, many TAMs in malignant tumors are of the M2 type [11]. Recent studies reported that the M2 type is a collection of multiple functionally distinct subsets and can be divided into M2a/M2b/M2c/M2d phenotypes according to different gene expression profiles [12]; that TAMs can be reprogrammed between M1 and M2 depending on the surrounding environment [13]; and that TAMs sometimes co-expresses M1- and M2-related genes [14].TAMs showed an M2 phenotype that induces tumor-promoting factors, such as interleukin (IL)-10 and transforming growth factor-β, in tumors [15], and produces various factors, such as the vascular endothelial growth factor (VEGF), IL-8, and cyclooxygenase-2 (COX-2), under hypoxic stimulation [16,17]. They activate the factors involved in angiogenesis [18], creating a favorable tumor microenvironment. Controlling macrophage function in the tumor microenvironment is important for inhibiting tumor progression.
GcMAF has been reported to have anti-tumor effects in in vitro models via macrophage activation [19,20,21,22], biological activities such as inhibition of angiogenesis in tumor tissue [5,19], and anti-tumor effects against several types of cancer in case reports using GcMAFs [7,23]. Research is being conducted to elucidate the mechanism of action and its usefulness as a new therapeutic agent. This study clarifies the effects of GcMAF-stimulated macrophages on adjacent tumor cells in a noncontact environment and assesses the effects of GcMAF on M2 macrophages. We investigated the anti-tumor mechanisms of GcMAFs in the tumor microenvironment.

2. Results

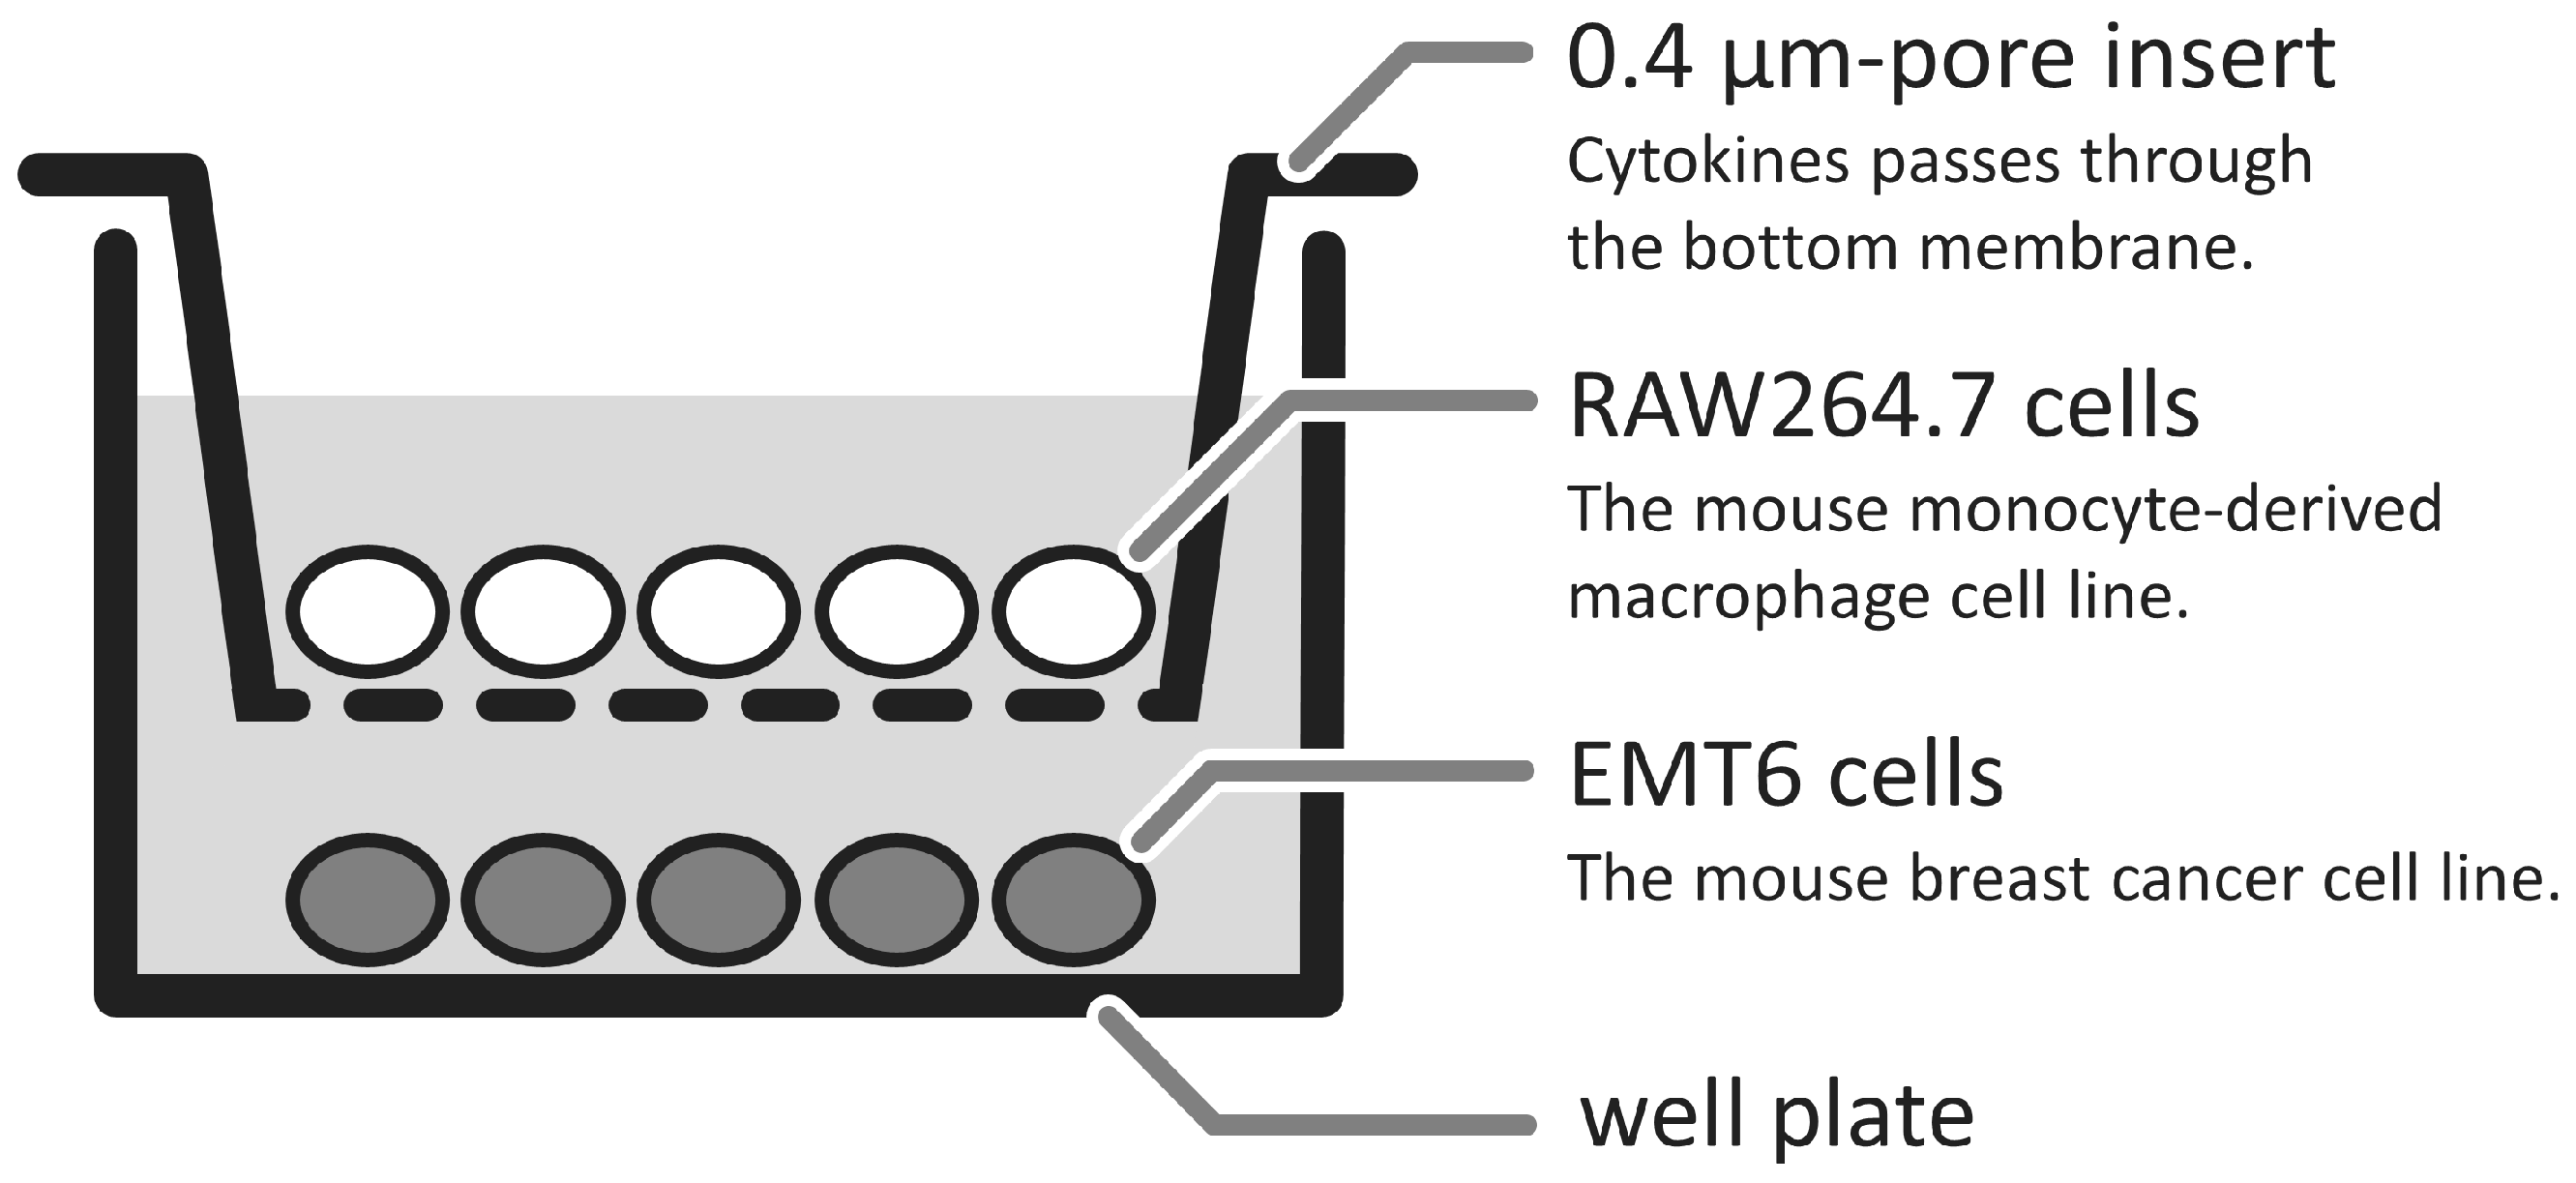
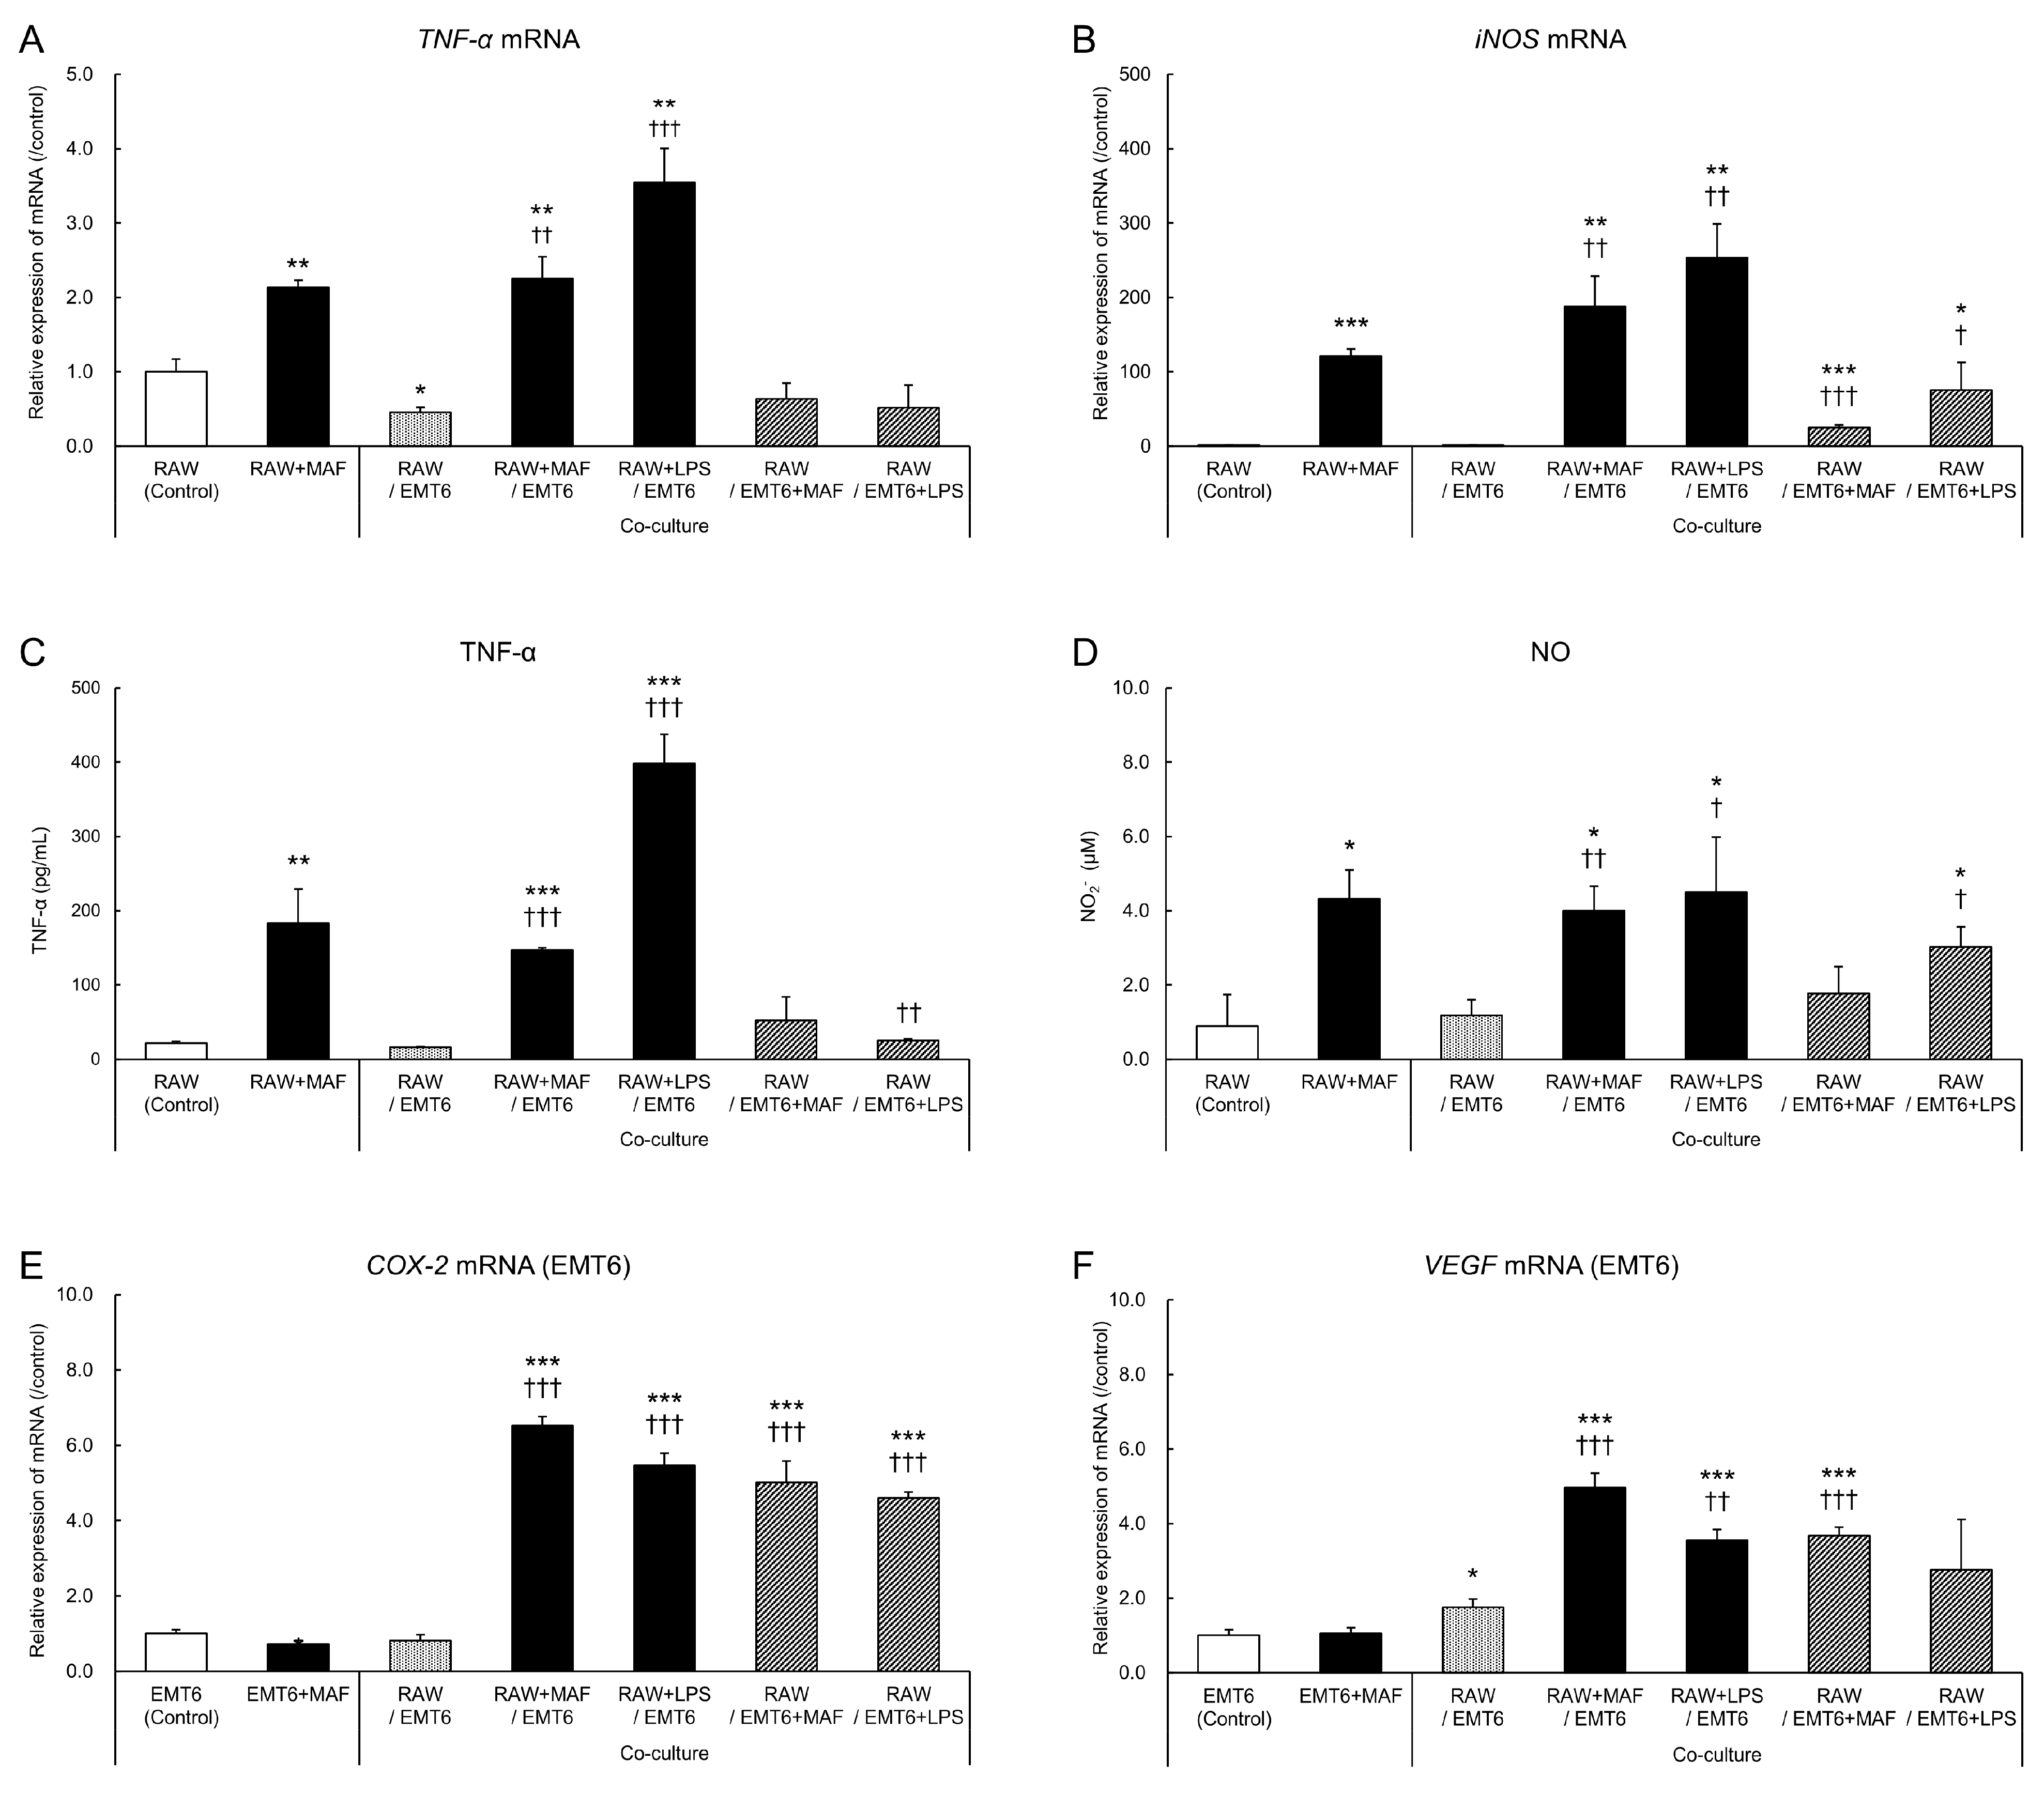
2.1. Changes in GcMAF-Stimulated Cells in a Non-Contact Co-Culture System

Here, we examined the macrophage-derived humoral factors that influence the anti-tumor activity of GcMAF in the tumor microenvironment by co-culturing GcMAF-stimulated macrophages with tumor cells in a non-contact manner. GcMAF-stimulated RAW264.7 cells and EMT6 cells were co-cultured in a 0.4 μm pore cell culture insert, RNA was extracted from the cells, and gene and protein expression levels in the supernatant were determined using quantitative reverse transcription polymerase chain reaction (RT-qPCR), enzyme-linked immunosorbent assay (ELISA), and nitric oxide (NO) assays (Figure 1).
GcMAF-stimulated RAW264.7 cells exhibited higher mRNA expression levels of TNF-α and iNOS than the unstimulated monocultures (Figure 1A,B). The gene expression levels remained high even after co-culture with EMT6 cells. Similar TNF-α and NO level changes were observed in the culture supernatant, confirming the results (Figure 1C,D). These results suggest that GcMAF induces inflammatory cytokine production by macrophages and that its activity is unaffected by the presence of tumor cells. In EMT6 cells co-cultured with RAW264.7 cells, the mRNA expression levels of COX-2 and VEGF, which are associated with tumor growth and invasion [18], increased after GcMAF stimulation (Figure 1E,F). GcMAF-stimulated changes in RAW264.7 cells were confirmed following LPS treatment. Therefore, GcMAF may effectively activate macrophages.

2.2. Changes in EMT6 Cells Induced by GcMAF-Stimulated RAW264.7 Cells

LPS-activated macrophages suppress the proliferation of co-cultured tumor cells [24]. Here, we evaluated whether GcMAF, which activates macrophages similarly to LPS, alters the survival of co-cultured EMT6 cells (Figure 2).
Similar to the co-culture with LPS-stimulated RAW264.7 cells, 48 h co-culture with GcMAF-stimulated RAW264.7 cells significantly suppressed the proliferation of EMT6 cells.

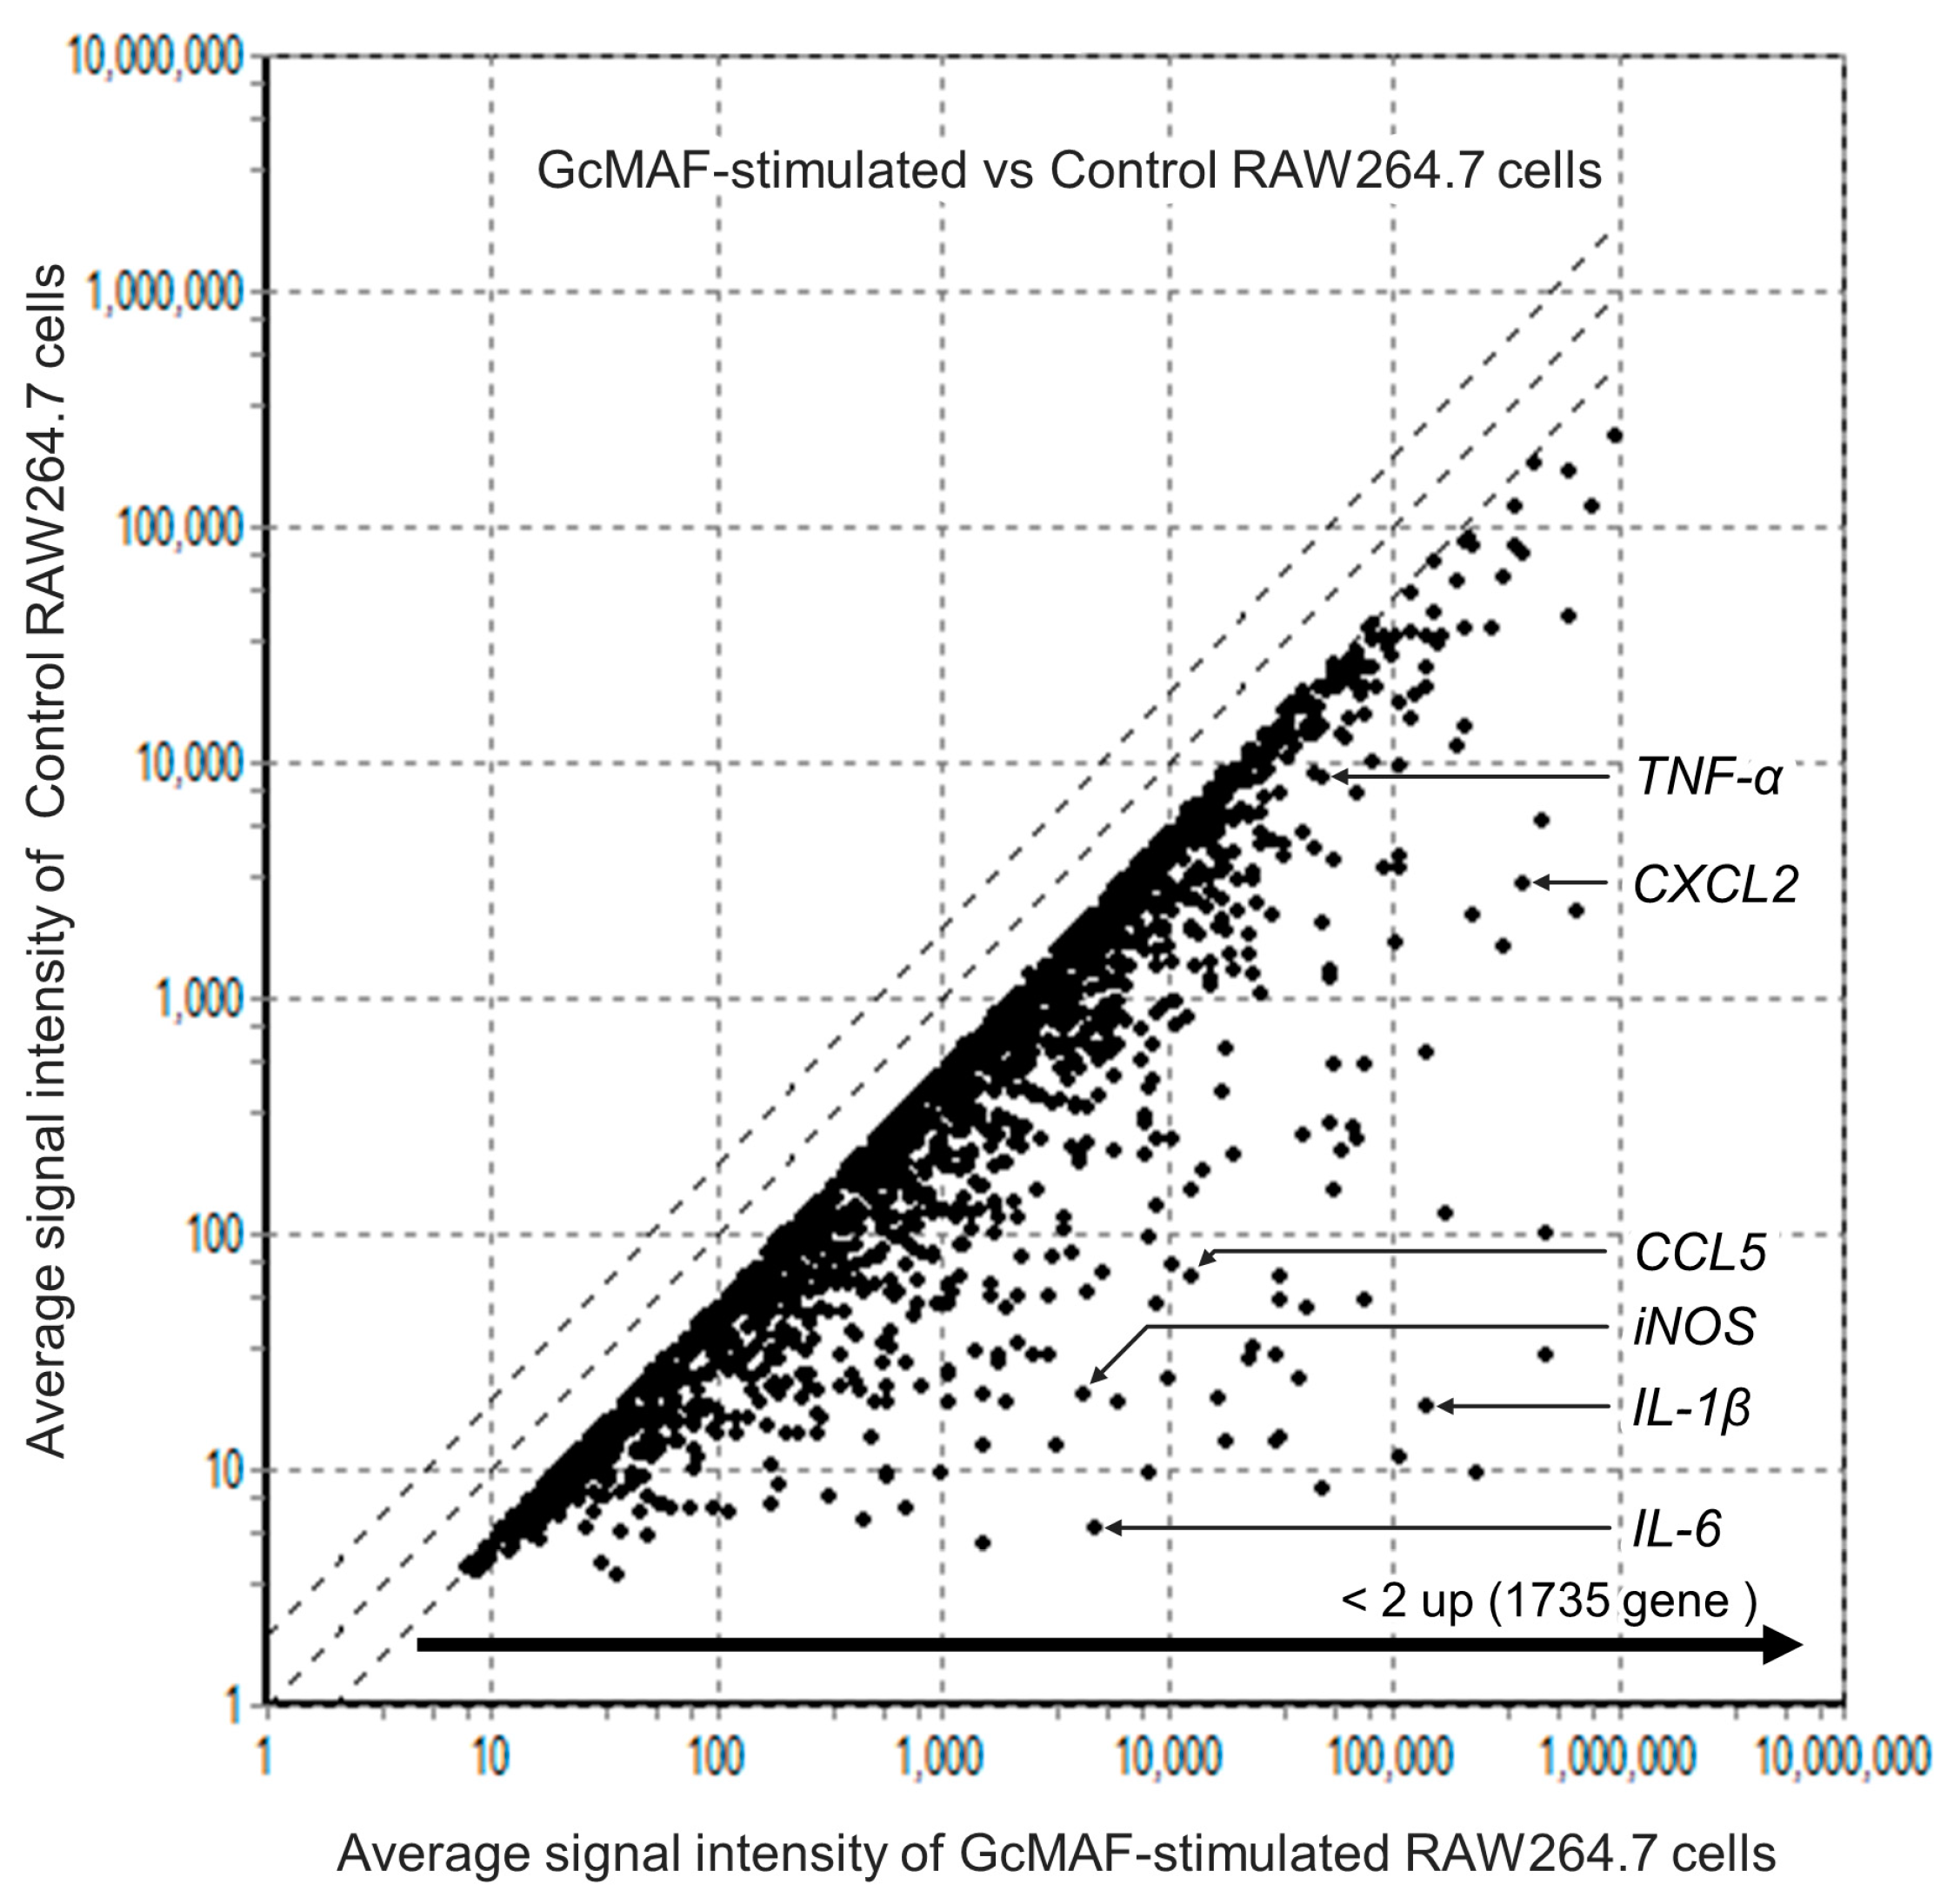
2.3. Comprehensive Analysis of Gene Levels in GcMAF-Stimulated Macrophages Using DNA Arrays

DNA arrays were used to analyze GcMAF-induced gene expression changes in macrophages (Figure 3).
In GcMAF-stimulated RAW264.7 cells, the levels of 1735 genes, including TNF-α, iNOS, IL-1β, IL-6, C-X-C motif chemokine ligand 2 (CXCL2), and C-C motif chemokine ligand 5 (CCL5), were upregulated more than 2-fold compared to unstimulated cells. The expression of several genes related to inflammatory cytokines was upregulated. Although a few genes related to anti-inflammatory cytokines were upregulated, the increase in the expression of M1-related genes was more significant. These results suggest that GcMAF induces M1 polarization in macrophages.

2.4. Evaluation of M2-to-M1 Macrophage Reprogramming by GcMAF

GcMAF activates macrophages to convert them into inflammatory cells and exerts anti-tumor effects. Although macrophages are a mixture of these two types, many TAMs in malignant tumors are of the M2 type [11], and RAW264.7 cells acquire the M2 type when they are stimulated with IL-4 and IL-13 [25]. Then, we examined the effect of GcMAF on the M2 RAW264.7 cells [25] to determine whether M2 polarized macrophages were reprogrammed to attain the M1 type (Figure 4).
Expression levels of CD206 in mRNA were increased in the M2 RAW264.7 cells compared to those in the unstimulated cells, but this effect was significantly suppressed in GcMAF-stimulated M2 RAW264.7 cells (Figure 4A). GcMAF-stimulated M2 RAW264.7 cells exhibited increased mRNA expression levels of TNF-α and iNOS, which are M1 macrophage-related genes, compared to the unstimulated cells (Figure 4B,C). A similar trend was observed in the TNF-α and NO levels in the culture supernatant. According to the previous results, TNF-α and NO production were increased in the GcMAF-stimulated cells compared to the unstimulated and IL-4- and IL-13-stimulated RAW264.7 cells (Figure 4D,E). These results suggest that GcMAF induces M2-to-M1 macrophage reprogramming.

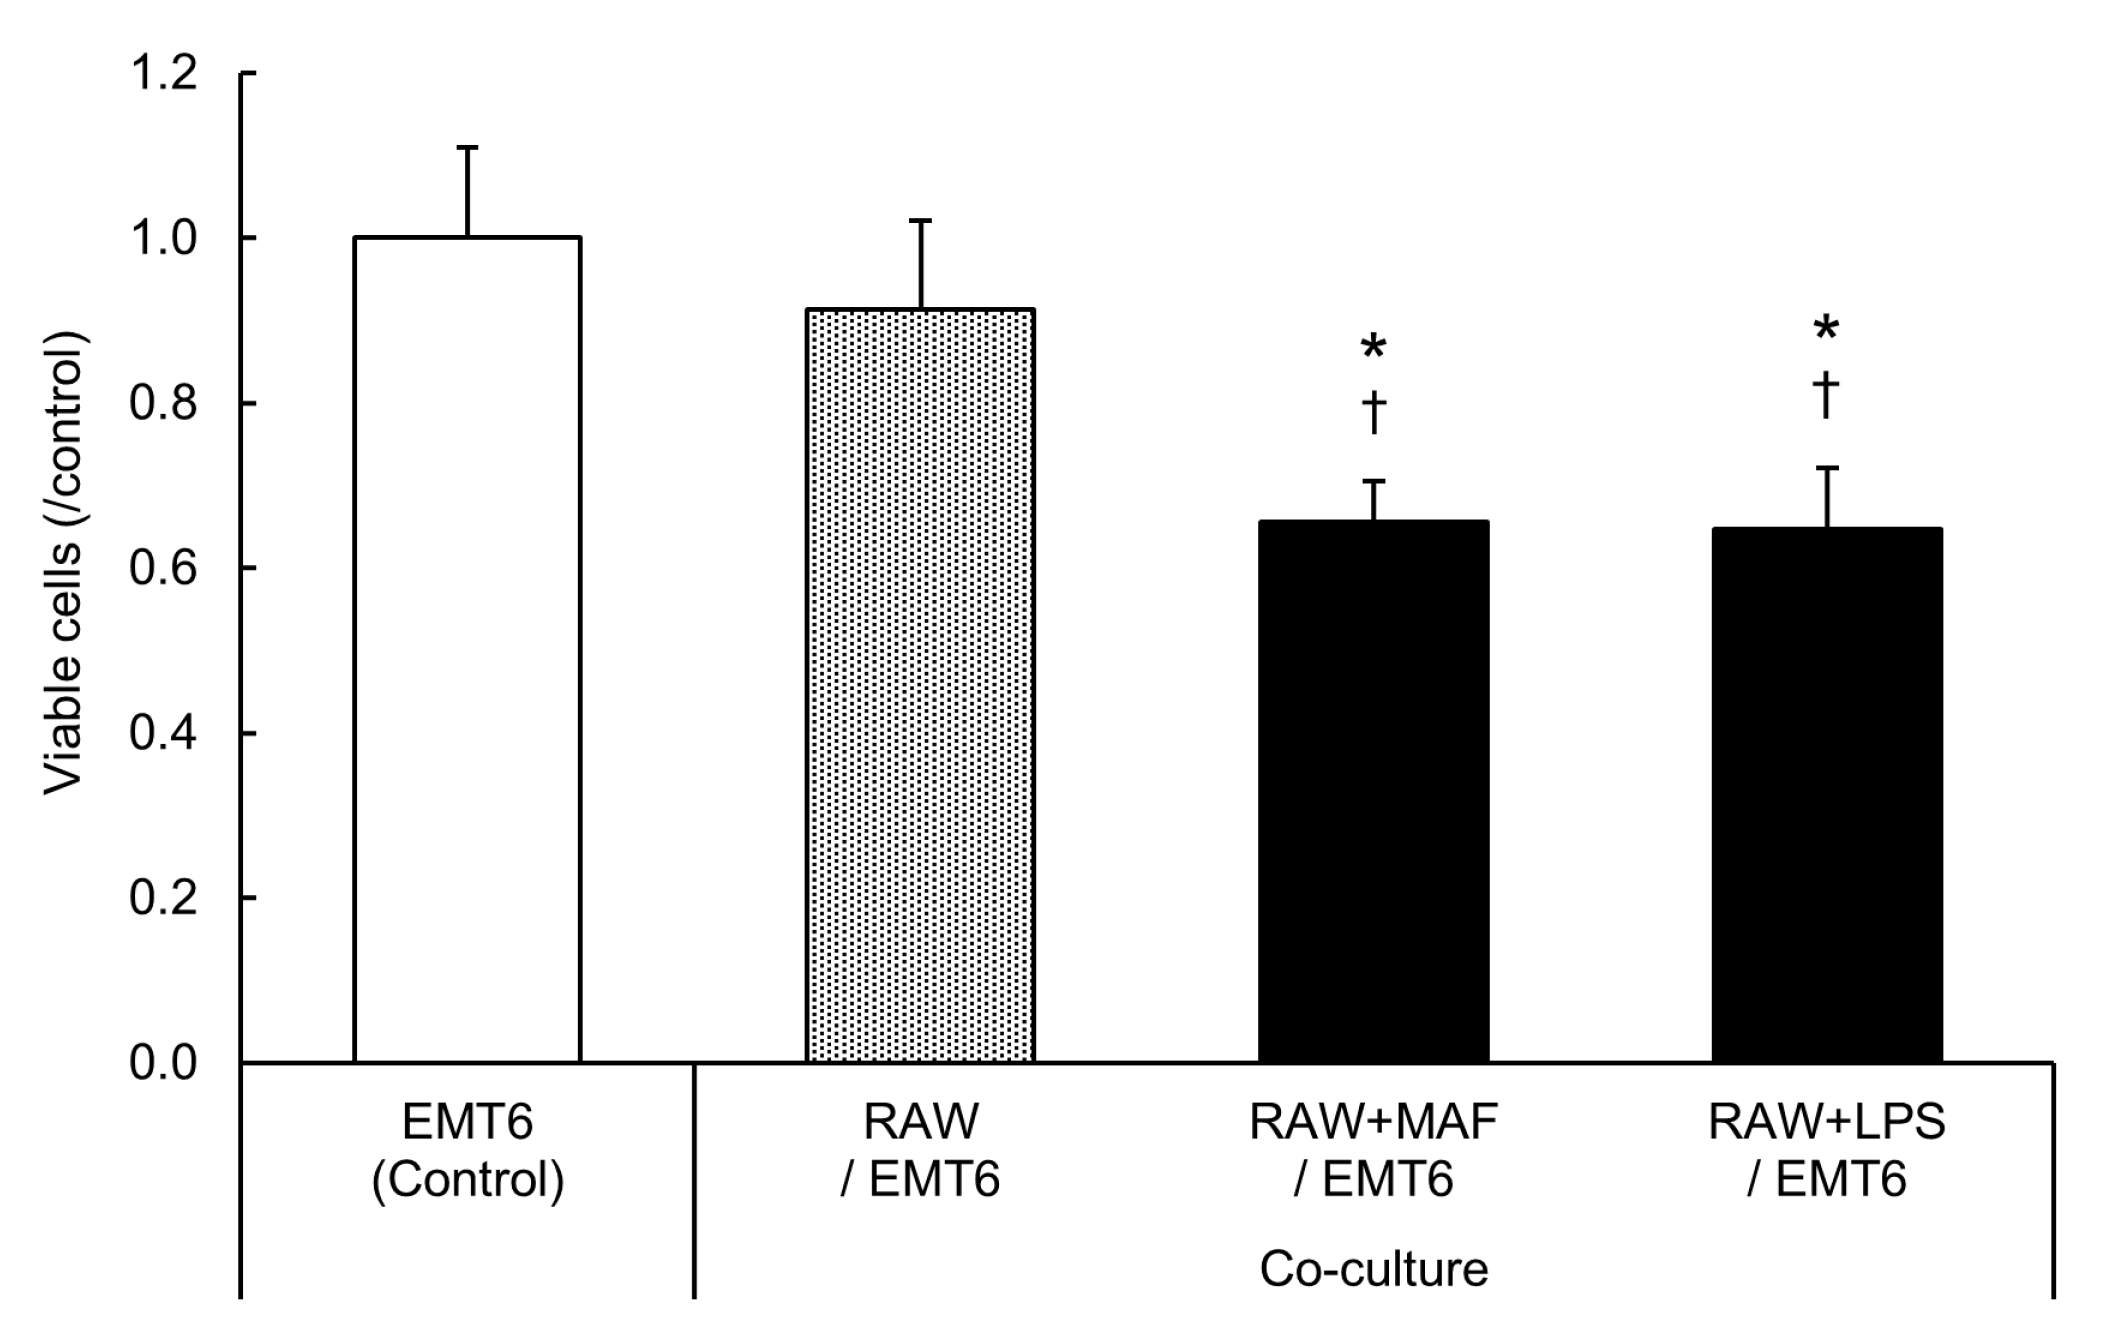
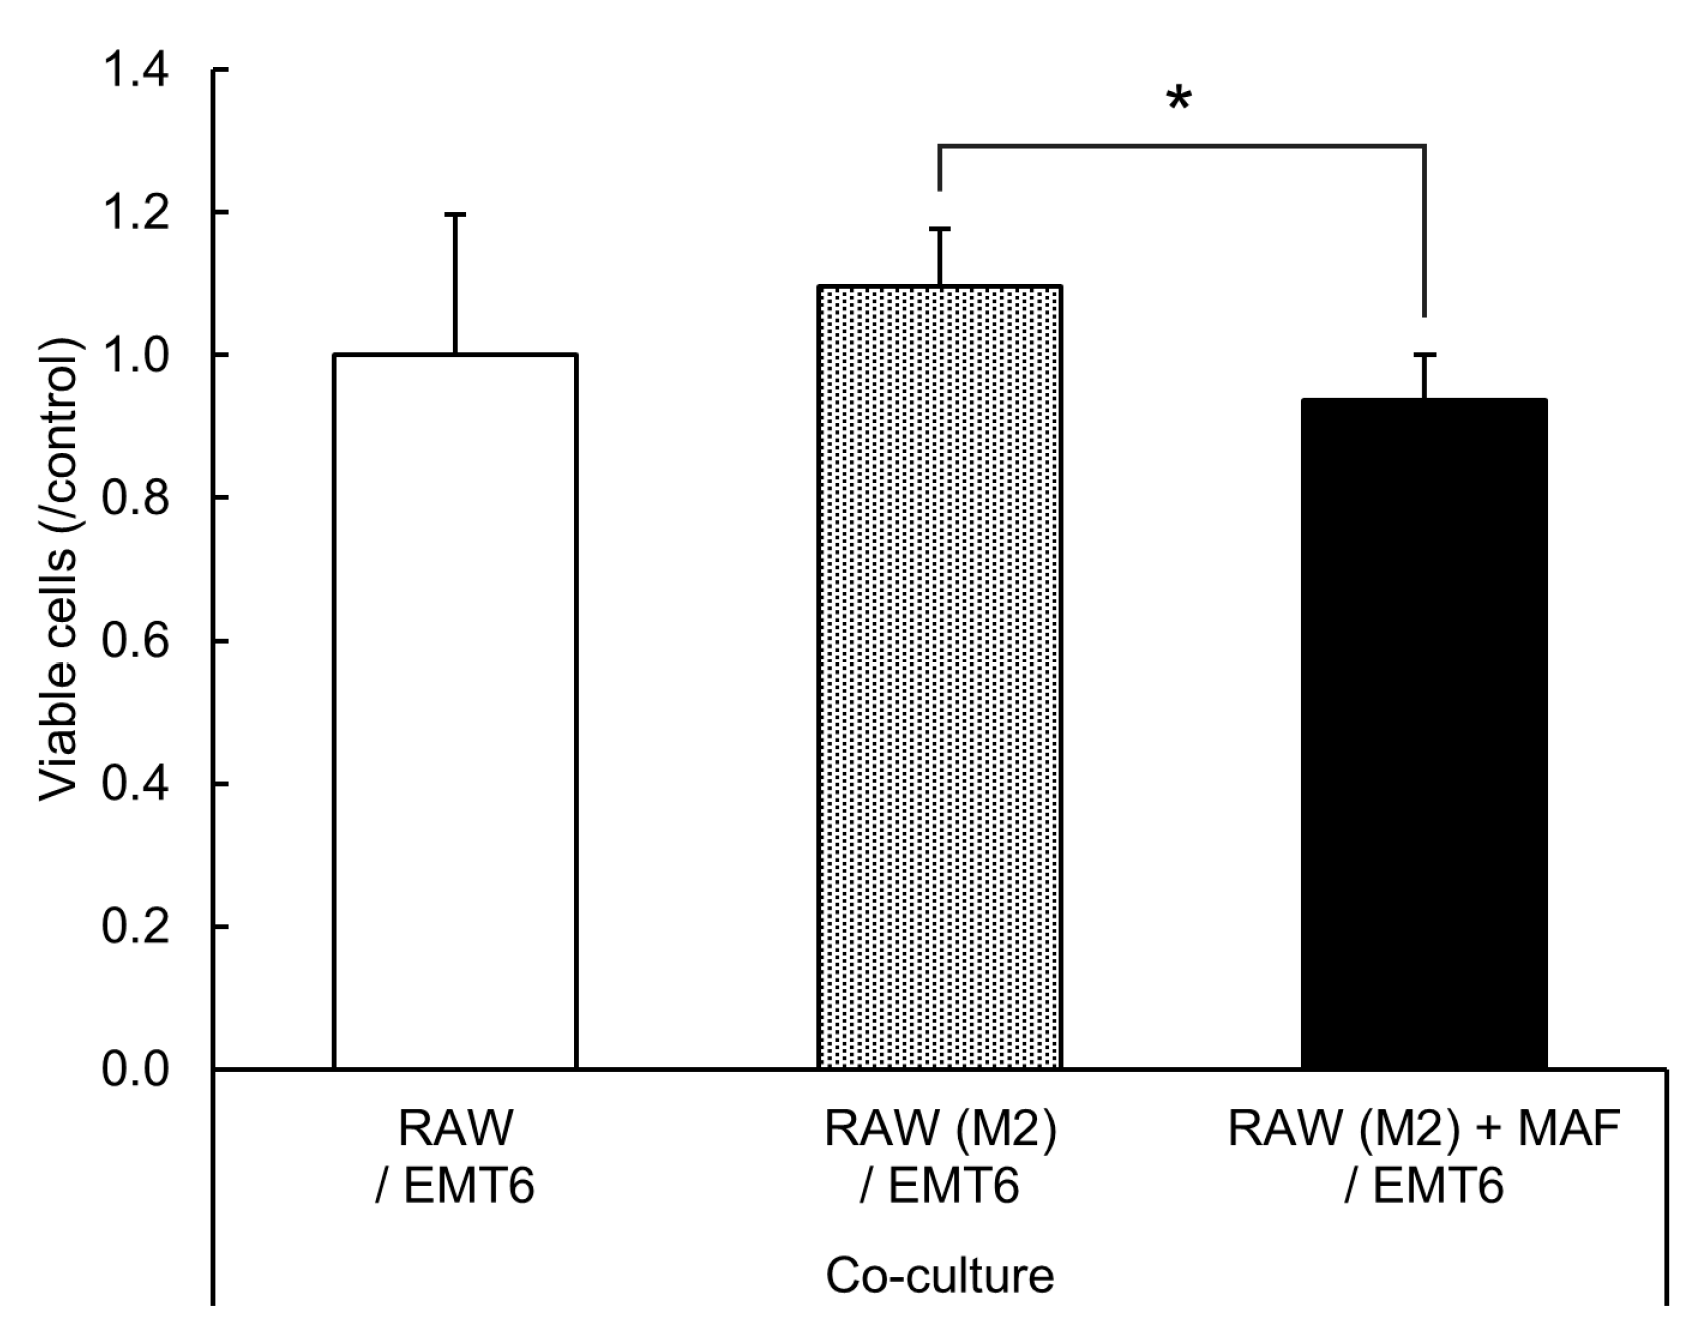
2.5. Suppression of EMT6 Cell Proliferation by GcMAF-Stimulated M2 RAW264.7 Cells

We verified whether GcMAF exerts anti-tumor effects on M2 RAW264.7 cells (Figure 5).
Cell viability analysis using CCK-8 revealed that co-culture with GcMAF-stimulated M2 RAW264.7 cells inhibited the proliferation of EMT6 cells more significantly than the co-culture with unstimulated M2 RAW264.7 cells. Therefore, GcMAF acts on M2 macrophages and suppresses the proliferation of coexisting tumor cells. This result suggests that stimulation of macrophages with GcMAF induces anti-tumor effects and cell death in tumor cells.

3. Discussion

This study observed that GcMAF-stimulated RAW264.7 cells induced inflammatory cytokine production and suppressed the proliferation of adjacent EMT6 cells in a non-contact environment via humoral factors. In a previous study, enzyme-treated bovine colostrum MAF enhanced the phagocytic activity of mouse peritoneal macrophages but did not induce the production of inflammatory cytokines, such as TNF-α and IL-1β [26]. This suggests that GcMAF purified from serum and colostrum MAF (a mixture of proteins including GcMAF) exhibits different properties. When co-cultured with GcMAF-stimulated RAW264.7 cells, EMT6 cells exhibited enhanced gene expression levels of COX-2 and VEGF, which are involved in cell invasion and proliferation. These reactions seemed to be caused by surviving EMT6 cells under the influence of GcMAF-stimulated RAW264.7 cells [27]. Cell proliferation was decreased in EMT6 cells co-cultured with GcMAF-stimulated RAW264.7 cells, suggesting that GcMAF suppresses tumor cell proliferation signals via macrophage activation.
In the tumor microenvironment, TAMs stimulated by colony-stimulating factor-1 produced by tumor cells exist as M2 macrophages that secrete epidermal growth factors and promote tumor cell proliferation and invasion [28]. In contrast, M1 macrophages attack tumor cells directly by producing reactive oxygen species and NO or indirectly via antibody-dependent cellular cytotoxicity mediated by anti-tumor antibodies [29,30]. To verify whether GcMAF exerted anti-tumor effects in the M2 macrophage-dominant tumor microenvironment, we examined its effects on M2 macrophages. The cells were cultured in a medium containing IL-4 and IL-13 to differentiate undifferentiated macrophages into the M2 type in vitro [25]. In this study, when RAW264.7 cells induced to the M2 type were stimulated with GcMAF, a shift to the M1 type was observed by analyzing the mRNA expression and components produced in the culture supernatant. The survival rate of the co-cultured EMT6 cells decreased, similar to the results of in vivo studies using a mouse model in which tumor cells were implanted subcutaneously [31]. These results suggest that GcMAF exerts anti-tumor effects by stimulating macrophages in the tumor microenvironment to exert M1-type functions or reprogramming M2 macrophages to express M1-type functions. Our study revealed the anti-tumor action mechanisms of GcMAF-stimulated macrophages on adjacent tumor cells, highlighting the potential use of GcMAFs in cancer immunotherapy.

4. Materials and Methods

4.1. Reagents

Gc protein was extracted from human serum using 25(OH)D3-sepharose column chromatography as previously described [6]. Gc protein was treated with β-D-galactosidase (Fujifilm WAKO Pure Chemical Corp., Osaka, Japan) at 37 °C for 3 h and then with sialidase enzyme (Sigma-Aldrich Japan Inc., Tokyo, Japan) at 37 °C for 3 h to produce the GcMAF. GcMAF was purified using a 25(OH)D3-sepharose column.

4.2. Cells

RAW264.7 mouse monocyte-derived macrophage cells (RIKENKAC Co., Ltd., Kyoto, Japan) were cultured in Dulbecco’s modified Eagle’s medium (DMEM; Fujifilm WAKO Pure Chemical Corp., Osaka, Japan) supplemented with 10% fetal bovine serum (FBS; Nichirei Biosciences Inc., Tokyo, Japan), 100 units/mL penicillin G, and 100 μg/mL streptomycin (Fujifilm WAKO Pure Chemical Corp., Osaka, Japan). EMT6 mouse breast cancer cells (kindly provided by Professor Osaki, Tottori University, Tottori, Japan) were cultured in Eagle’s minimum essential medium (EMEM; Fujifilm WAKO Pure Chemical Corp., Osaka, Japan) supplemented with 10% FBS, 100 units/mL penicillin G, and 100 μg/mL streptomycin.

4.3. Co-Culture of RAW264.7 Cells and EMT6 Cells

RAW264.7 cells were seeded in 0.4 μm pore 6-well cell culture inserts (Griner Japan Inc., Tokyo, Japan) at 5 × 10⁵ per insert, set in a 6-well plate (AS ONE Corp., Osaka, Japan), and cultured overnight (Figure 6). After washing with phosphate-buffered saline (PBS; Nacalai Tesque, Inc., Kyoto, Japan), GcMAF (0.1 μg/mL) or LPS (Escherichia coli O111:B4; 1 μg/mL; Sigma-Aldrich Japan) was added to FBS-free DMEM, and cells were cultured for 24 h. EMT6 cells were seeded in a 6-well plate at 5 × 10⁵ per well, cultured overnight, and subsequently co-cultured with stimulated RAW264.7 cells (ratio 1:1) in FBS-free EMEM for 24 h. After incubation, cells and the supernatant were collected and kept at −80 °C for further use.

4.4. Quantitative RT-qPCR

RNA was extracted from the cells using NucleoSpin RNA (Takara Bio Inc., Shiga, Japan) and reverse-transcribed into cDNA using a PrimeScript II 1st strand cDNA Synthesis Kit (Takara Bio Inc., Shiga, Japan). RT-qPCR was performed using Power Up SYBR Green Master Mix (Thermo Fisher Scientific Inc., Waltham, MA, USA) with the StepOne Plus Real-Time System (Thermo Fisher Scientific Inc., Waltham, MA, USA). The real-time PCR applied 40 cycles of amplification consisting of 3 s at 95 °C (denaturation) and 30 s at 60 °C (annealing and extension). The relative expression calculated using the 2−ΔΔCt method was applied to analyze the results with glyceraldehyde 3-phosphate dehydrogenase (GAPDH) as an internal control. Sequences of all primers (Thermo Fisher Scientific Inc., Waltham, MA, USA) used here are as follows [32,33,34]: GAPDH (Forward, 5′-ATGGCCTTCCGTGTTCCTAC-3′ and Reverse, 5′-TAGCCCAAGATGCCCTTCAG-3′), TNF-α (Forward, 5′-AATGGCCTCCCTCTCATCAG-3′ and Reverse, 5′-ACTTGGTGGTTTGCTACGAC-3′), iNOS (Forward, 5′-GGAATCTTGGAGCGAGTTGT-3′ and Reverse, 5′-GCAGCCTCTTGTCTTTGACC-3′), CD206 (Forward, 5′-GGAGGCTGATTACGAGCAGT-3′ and Reverse, 5′-CATAGGAAACGGGAGAACCA-3′), COX-2 (Forward, 5′-CCACTTCAAGGGAGTCTGGA-3′ and Reverse, 5′-AGTCATCTGCTACGGGAGGA-3′), and VEGF (Forward, 5′-TACCTCCACCATGCCAAGTGGT-3′ and Reverse, 5′-AGGACGGCTTGAAGATGTAC-3′).

4.5. NO Assay

The collected supernatants were evaluated using the Griess assay to measure NO production by determining the amount of nitrite ions (NO2) in the solution. The Griess reagent containing 1% sulfanilamide (Fujifilm WAKO Pure Chemical Corp., Osaka, Japan), 2.5% phosphoric acid (Fujifilm WAKO Pure Chemical Corp., Osaka, Japan), and 0.1% N-1-naphthylethylenediamine hydrochloride (Tokyo Chemical Industry Co., Ltd., Tokyo, Japan) was prepared and mixed with nitrous acid. The absorbance of a sample of known concentration prepared with an aqueous sodium solution (Fujifilm WAKO Pure Chemical Corp., Osaka, Japan) and the culture supernatant was measured at 550 nm using a microplate reader (Tecan Group Ltd., Männedorf, Switzerland), and the amount of nitrite ions was calculated.

4.6. ELISA

The concentrations of TNF-α in the cell supernatant were gauged using an ELISA kit (ThermoFisher Scientific Inc., Waltham, MA, USA), according to the manufacturer’s instructions.

4.7. Evaluation of EMT6 Cell Number for Crystal Violet Staining Assay

EMT6 cells were seeded in 6-well plates at 5 × 10⁵ per well and co-cultured with GcMAF-stimulated RAW264.7 cells (ratio 1:1) for 48 h. EMT6 cells were washed with PBS and stained with a crystal violet solution containing 0.5% crystal violet (Fujifilm WAKO Pure Chemical Corp., Osaka, Japan) and 20% methanol (Fujifilm WAKO Pure Chemical Corp., Osaka, Japan) for 15 min. The solution was removed, and the cells were washed four times with tap water. The stained cells were eluted with 1% SDS (Fujifilm WAKO Pure Chemical Corp., Osaka, Japan). Using a microplate reader, the number of live cells was evaluated by measuring the absorbance at 570 nm with a reference wavelength of 720 nm.

4.8. DNA Microarray Analysis

RAW264.7 cells were seeded in a 60 mm culture-dish plate at 6 × 10⁶ cells per well and cultured overnight. RAW264.7 cells were stimulated with GcMAF at a final concentration of 1 μg/mL for 24 h, and RNA was extracted. DNA microarray analysis was performed by Filgen Inc. (Aich, Japan) using a mouse GeneChip Clariom S Assay (Thermo Fisher Scientific Inc., Waltham, MA, USA). Microarray data were analyzed using the Microarray Data Analysis Tool v.3.2. (Filgen Inc., Aich, Japan).

4.9. M2 Polarization of RAW264.7 Cells

RAW264.7 cells were seeded in a 6-well plate at 8 × 10⁵ per well and cultured overnight. After washing with phosphate-buffered saline (PBS; Nacalai Tesque, Inc., Kyoto, Japan), the cells were cultured for 72 h in FBS-free DMEM supplemented with IL-4 and IL-13 (20 ng/mL each; Thermo Fisher Scientific Inc., Waltham, MA, USA) for M2 polarization. M2-stimulated RAW264.7 cells were treated with GcMAF (0.1 μg/mL) for 24 h, and the treated cells’ supernatant was collected.

4.10. Evaluation of EMT6 Cell Number for CCK-8 Assay

EMT6 cells were seeded in 24-well plates at 3 × 10⁴ per well and co-cultured with GcMAF-stimulated M2 RAW264.7 cells (ratio 1:1) for 48 h. EMT6 cells were washed with PBS and analyzed using the cell counting kit-8 (Dojindo, Kumamoto, Japan). The number of live cells was determined by measuring the absorbance at 450 nm with a reference wavelength of 600 nm using a microplate reader.

4.11. Statistical Analysis

Data are expressed as mean and standard deviation. The statistical significance of the differences between the results of at least three experiments were analyzed using Student’s t-test. A p-value of <0.05 was considered statistically significant.

Author Contributions

Conceptualization, T.T., R.T. and Y.U.; methodology, A.K. and S.A.; validation, A.K., H.S. and S.A.; formal analysis, A.K., H.S. and S.A.; investigation, A.K., H.S. and S.A.; resources, A.K., H.S. and Y.S.; data curation, A.K., H.S. and S.A.; writing—original draft preparation, A.K. and S.A.; writing—review and editing, Y.S. and Y.U.; visualization, A.K. and S.A.; supervision, Y.U.; project administration, A.K. and Y.U.; funding acquisition, T.T., R.T. and Y.U. All authors have read and agreed to the published version of the manuscript.

Funding

This research was funded by Takara Clinic (Tokyo, Japan) and Mori Co., Ltd. (Tokyo, Japan).

Data Availability Statement

Data contained in this article will be made available upon reasonable request.

Acknowledgments

We would like to thank Editage (www.editage.jp) for the English language editing. We also thank Health Service Office of Tokushima University for the collection of human serum for the raw material of GcMAF.

Conflicts of Interest

The author Shinobu Ambai is employed by Mori Co., Ltd., Tokyo, Japan. The authors declare that the research was conducted without commercial or financial relationships that could be construed as potential conflicts of interest.

References

  1. Daiger, S.P.; Schanfield, M.S.; Cavalli-Sforza, L.L. Group-Specific Component (Gc) Proteins Bind Vitamin D and 25-Hydroxyvitamin D. Proc. Natl. Acad. Sci. USA 1975, 72, 2076–2080. [Google Scholar] [CrossRef] [PubMed]
  2. White, P.; Cooke, N. The Multifunctional Properties and Characteristics of Vitamin D-Binding Protein. Trends Endocrinol. Metabol. 2000, 11, 320–327. [Google Scholar] [CrossRef] [PubMed]
  3. Yamamoto, N.; Homma, S. Vitamin D3 Binding Protein (Group-Specific Component) Is a Precursor for the Macrophage-Activating Signal Factor from Lysophosphatidylcholine-Treated Lymphocytes. Proc. Natl. Acad. Sci. USA 1991, 88, 8539–8543. [Google Scholar] [CrossRef] [PubMed]
  4. Yamamoto, N.; Kumashiro, R. Conversion of Vitamin D3 Binding Protein (Group-Specific Component) to a Macrophage Activating Factor by the Stepwise Action of Beta-Galactosidase of B Cells and Sialidase of T Cells. J. Immunol. 1993, 151, 2794–2802. [Google Scholar] [CrossRef] [PubMed]
  5. Kisker, O.; Onizuka, S.; Becker, C.M.; Fannon, M.; Flynn, E.; D’Amato, R.; Zetter, B.; Folkman, J.; Ray, R.; Swamy, N.; et al. Vitamin D Binding Protein-Macrophage Activating Factor (DBP-Maf) Inhibits Angiogenesis and Tumor Growth in Mice. Neoplasia 2003, 5, 32–40. [Google Scholar] [CrossRef] [PubMed]
  6. Uto, Y.; Yamamoto, S.; Takeuchi, R.; Nakagawa, Y.; Hirota, K.; Terada, H.; Onizuka, S.; Nakata, E.; Hori, H. Effect of the Gc-Derived Macrophage-Activating Factor Precursor (PreGcMAF) on Phagocytic Activation of Mouse Peritoneal Macrophages. Anticancer Res. 2011, 31, 2489–2492. [Google Scholar] [PubMed]
  7. Nonaka, K.; Onizuka, S.; Ishibashi, H.; Uto, Y.; Hori, H.; Nakayama, T.; Matsuura, N.; Kanematsu, T.; Fujioka, H. Vitamin D Binding Protein-Macrophage Activating Factor Inhibits HCC in SCID Mice. J. Surg. Res. 2012, 172, 116–122. [Google Scholar] [CrossRef] [PubMed]
  8. Inui, T.; Kuchiike, D.; Kubo, K.; Mette, M.; Uto, Y.; Hori, H.; Sakamoto, N. Clinical Experience of Integrative Cancer Immunotherapy with GcMAF. Anticancer Res. 2013, 33, 2917–2919. [Google Scholar] [PubMed]
  9. DeNardo, D.G.; Ruffell, B. Macrophages as Regulators of Tumour Immunity and Immunotherapy. Nat. Rev. Immunol. 2019, 19, 369–382. [Google Scholar] [CrossRef] [PubMed]
  10. Orecchioni, M.; Ghosheh, Y.; Pramod, A.B.; Ley, K. Macrophage Polarization: Different Gene Signatures in M1(LPS+) vs. Classically and M2(LPS–) vs. Alternatively Activated Macrophages. Front. Immunol. 2019, 10, 1084. [Google Scholar] [CrossRef]
  11. Yang, Q.; Guo, N.; Zhou, Y.; Chen, J.; Wei, Q.; Han, M. The Role of Tumor-Associated Macrophages (TAMs) in Tumor Progression and Relevant Advance in Targeted Therapy. Acta Pharm. Sin. B 2020, 10, 2156–2170. [Google Scholar] [CrossRef] [PubMed]
  12. Rőszer, T. Understanding the Mysterious M2 Macrophage through Activation Markers and Effector Mechanisms. Mediat. Inflamm. 2015, 2015, 816460. [Google Scholar] [CrossRef] [PubMed]
  13. Vitale, I.; Manic, G.; Coussens, L.M.; Kroemer, G.; Galluzzi, L. Macrophages and Metabolism in the Tumor Microenvironment. Cell Metab. 2019, 30, 36–50. [Google Scholar] [CrossRef]
  14. Müller, S.; Kohanbash, G.; Liu, S.J.; Alvarado, B.; Carrera, D.; Bhaduri, A.; Watchmaker, P.B.; Yagnik, G.; Di Lullo, E.; Malatesta, M.; et al. Single-Cell Profiling of Human Gliomas Reveals Macrophage Ontogeny as a Basis for Regional Differences in Macrophage Activation in the Tumor Microenvironment. Genome Biol. 2017, 18, 234. [Google Scholar] [CrossRef]
  15. Zhu, X.; Liang, R.; Lan, T.; Ding, D.; Huang, S.; Shao, J.; Zheng, Z.; Chen, T.; Huang, Y.; Liu, J.; et al. Tumor-Associated Macrophage-Specific CD155 Contributes to M2-Phenotype Transition, Immunosuppression, and Tumor Progression in Colorectal Cancer. J. Immunother. Cancer 2022, 10, e004219. [Google Scholar] [CrossRef]
  16. Hou, P.; Shi, P.; Jiang, T.; Yin, H.; Chu, S.; Shi, M.; Bai, J.; Song, J. DKC1 Enhances Angiogenesis by Promoting HIF-1α Transcription and Facilitates Metastasis in Colorectal Cancer. Br. J. Cancer 2020, 122, 668–679. [Google Scholar] [CrossRef]
  17. Delprat, V.; Tellier, C.; Demazy, C.; Raes, M.; Feron, O.; Michiels, C. Cycling Hypoxia Promotes a Pro-Inflammatory Phenotype in Macrophages via JNK/P65 Signaling Pathway. Sci. Rep. 2020, 10, 882. [Google Scholar] [CrossRef]
  18. Mu, G.; Zhu, Y.; Dong, Z.; Shi, L.; Deng, Y.; Li, H. Calmodulin 2 Facilitates Angiogenesis and Metastasis of Gastric Cancer via STAT3/HIF-1A/VEGF-A Mediated Macrophage Polarization. Front. Oncol. 2021, 11, 727306. [Google Scholar] [CrossRef] [PubMed]
  19. Pacini, S.; Punzi, T.; Morucci, G.; Gulisano, M.; Ruggiero, M. Effects of Vitamin D-Binding Protein-Derived Macrophage-Activating Factor on Human Breast Cancer Cells. Anticancer Res. 2012, 32, 45–52. [Google Scholar]
  20. Gregory, K.J.; Zhao, B.; Bielenberg, D.R.; Dridi, S.; Wu, J.; Jiang, W.; Huang, B.; Pirie-Shepherd, S.; Fannon, M. Vitamin D Binding Protein-Macrophage Activating Factor Directly Inhibits Proliferation, Migration, and UPAR Expression of Prostate Cancer Cells. PLoS ONE 2010, 5, e13428. [Google Scholar] [CrossRef]
  21. Thyer, L.; Ward, E.; Smith, R.; Fiore, M.; Magherini, S.; Branca, J.; Morucci, G.; Gulisano, M.; Ruggiero, M.; Pacini, S. A Novel Role for a Major Component of the Vitamin D Axis: Vitamin D Binding Protein-Derived Macrophage Activating Factor Induces Human Breast Cancer Cell Apoptosis through Stimulation of Macrophages. Nutrients 2013, 5, 2577–2589. [Google Scholar] [CrossRef] [PubMed]
  22. Hamilton, G.; Rath, B.; Klameth, L.; Hochmair, M.J. Small Cell Lung Cancer: Recruitment of Macrophages by Circulating Tumor Cells. Oncoimmunology 2016, 5, e1093277. [Google Scholar] [CrossRef] [PubMed]
  23. Chaiyasit, K.; Inui, T.; Wiwanitkit, V. The Use of Gc Protein-Derived Macrophage Activating Factor for Management of Thyroid Cancer. J. Cancer Res. Ther. 2015, 11, 1041. [Google Scholar] [CrossRef] [PubMed]
  24. Smith, M.; Young, H.; Hurlstone, A.; Wellbrock, C. Differentiation of THP1 Cells into Macrophages for Transwell Co-Culture Assay with Melanoma Cells. Bio-Protocol 2015, 5, e1638. [Google Scholar] [CrossRef] [PubMed]
  25. Wu, Z.; Zhou, J.; Chen, F.; Yu, J.; Li, H.; Li, Q.; Li, W. 13-Methyl-Palmatrubine Shows an Anti-Tumor Role in Non-Small Cell Lung Cancer via Shifting M2 to M1 Polarization of Tumor Macrophages. Int. Immunopharmacol. 2022, 104, 108468. [Google Scholar] [CrossRef]
  26. Uto, Y.; Kawai, T.; Sasaki, T.; Hamada, K.; Yamada, H.; Kuchiike, D.; Kubo, K.; Inui, T.; Mette, M.; Tokunaga, K.; et al. Degalactosylated/Desialylated Bovine Colostrum Induces Macrophage Phagocytic Activity Independently of Inflammatory Cytokine Production. Anticancer Res. 2015, 35, 4487–4492. [Google Scholar]
  27. Hangai, S.; Kawamura, T.; Kimura, Y.; Chang, C.-Y.; Hibino, S.; Yamamoto, D.; Nakai, Y.; Tateishi, R.; Oshima, M.; Oshima, H.; et al. Orchestration of Myeloid-Derived Suppressor Cells in the Tumor Microenvironment by Ubiquitous Cellular Protein TCTP Released by Tumor Cells. Nat. Immunol. 2021, 22, 947–957. [Google Scholar] [CrossRef]
  28. Wyckoff, J.; Wang, W.; Lin, E.Y.; Wang, Y.; Pixley, F.; Stanley, E.R.; Graf, T.; Pollard, J.W.; Segall, J.; Condeelis, J. A Paracrine Loop between Tumor Cells and Macrophages Is Required for Tumor Cell Migration in Mammary Tumors. Cancer Res. 2004, 64, 7022–7029. [Google Scholar] [CrossRef] [PubMed]
  29. Lewis, J.S.; Landers, R.J.; Underwood, J.C.; Harris, A.L.; Lewis, C.E. Expression of Vascular Endothelial Growth Factor by Macrophages Is Up-Regulated in Poorly Vascularized Areas of Breast Carcinomas. J. Pathol. 2000, 192, 150–158. [Google Scholar] [CrossRef]
  30. Bruns, H.; Büttner, M.; Fabri, M.; Mougiakakos, D.; Bittenbring, J.T.; Hoffmann, M.H.; Beier, F.; Pasemann, S.; Jitschin, R.; Hofmann, A.D.; et al. Vitamin D–Dependent Induction of Cathelicidin in Human Macrophages Results in Cytotoxicity against High-Grade B Cell Lymphoma. Sci. Transl. Med. 2015, 7, 282ra47. [Google Scholar] [CrossRef]
  31. Dolgova, E.V.; Kirikovich, S.S.; Levites, E.V.; Ruzanova, V.S.; Proskurina, A.S.; Ritter, G.S.; Taranov, O.S.; Varaksin, N.A.; Ryabicheva, T.G.; Leplina, O.Y.; et al. Analysis of the Biological Properties of Blood Plasma Protein with GcMAF Functional Activity. Int. J. Mol. Sci. 2022, 23, 8075. [Google Scholar] [CrossRef] [PubMed]
  32. Chen, L.; Sha, M.-L.; Li, D.; Zhu, Y.-P.; Wang, X.-J.; Jiang, C.-Y.; Xia, S.-J.; Shao, Y. Relaxin Abrogates Renal Interstitial Fibrosis by Regulating Macrophage Polarization via Inhibition of Toll-like Receptor 4 Signaling. Oncotarget 2017, 8, 21044–21053. [Google Scholar] [CrossRef] [PubMed]
  33. Font-Nieves, M.; Sans-Fons, M.G.; Gorina, R.; Bonfill-Teixidor, E.; Salas-Pérdomo, A.; Márquez-Kisinousky, L.; Santalucia, T.; Planas, A.M. Induction of COX-2 Enzyme and Down-Regulation of COX-1 Expression by Lipopolysaccharide (LPS) Control Prostaglandin E2 Production in Astrocytes. J. Biol. Chem. 2012, 287, 6454–6468. [Google Scholar] [CrossRef] [PubMed]
  34. Gonzalez-Perez, R.R.; Xu, Y.; Guo, S.; Watters, A.; Zhou, W.; Leibovich, S.J. Leptin Upregulates VEGF in Breast Cancer via Canonic and Non-Canonical Signalling Pathways and NFκB/HIF-1α Activation. Cell Signal 2010, 22, 1350–1362. [Google Scholar] [CrossRef] [PubMed]
Figure 1. Gene and protein expression levels in GcMAF-stimulated RAW264.7 cells and EMT6 breast tumor cells. RAW264.7 cells were stimulated with 0.1 µg/mL GcMAF or 1 µg/mL lipopolysaccharide (LPS) for 24 h and co-cultured with EMT6 cells for 24 h. Then, mRNA expression levels of (A) tumor necrosis factor-α (TNF-α) and (B) inducible nitric oxide synthase (iNOS) were determined in RAW264.7 cells; (E) COX-2 and (F) VEGF were measured in EMT6 cells using PCR and expressed as a ratio to the levels in unstimulated cells. (C) TNF-α and (D) NO production in the supernatant was evaluated using ELISA and NO assays, respectively. Results are expressed as the mean ± standard deviation (SD) of three independent experiments. * p < 0.05, ** p < 0.01, and *** p < 0.001 vs. control;  p < 0.05, †† p < 0.01, and ††† p < 0.001 vs. co-culture (RAW264.7 cells and EMT6 cells).
Ijtm 04 00029 g001
Figure 2. Change in EMT6 cell viability after co-culture with GcMAF-stimulated RAW264.7 cells. RAW264.7 cells were stimulated with 0.1 µg/mL GcMAF or 1 µg/mL LPS for 24 h and co-cultured with EMT6 cells for 48 h. After removing the insert, EMT6 cells were stained with crystal violet. After washing with tap water, the stained cells were eluted with 1% sodium dodecyl sulfate (SDS). Absorbance was measured and expressed as a ratio to the unstimulated cells. Results are expressed as the mean ± SD of three independent experiments. * p < 0.05 vs. control;  p < 0.05 vs. co-culture (RAW264.7 cells and EMT6 cells).
Ijtm 04 00029 g002
Figure 3. Comprehensive gene expression analysis using DNA microarrays. A scatter plot shows the differentially expressed genes between GcMAF-stimulated and control RAW264.7 cells. The X-axis displays the average signal intensity of genes in GcMAF-stimulated RAW264.7 cells, and the Y-axis corresponds to the average signal intensity of genes in control RAW264.7 cells. Genes that were expressed 2-fold or more in GcMAF-stimulated RAW264.7 cells are indicated by dots.
Ijtm 04 00029 g003
Figure 4. Gene and protein expression levels in GcMAF-induced M2 RAW264.7 cells. RAW264.7 cells were first stimulated with 20 ng/mL of IL-4 and IL-13 each for 72 h (M2) and then with GcMAF 0.1 μg/mL for 24 h. mRNA expression levels of (A) CD206, (B) TNF-α, and (C) iNOS were evaluated in RAW264.7 cells using RT-PCR. (D) TNF-α levels in the supernatant were evaluated using ELISA. (E) NO levels were evaluated using the NO assay. All levels are expressed as a ratio to the unstimulated cells. Results are expressed as the mean ± SD (n = 3). * p < 0.05, ** p < 0.01, and *** p < 0.001 vs. control;  p < 0.05, †† p < 0.01, and ††† p < 0.001 vs. co-culture (M2).
Ijtm 04 00029 g004
Figure 5. Suppression of EMT6 cell proliferation by GcMAF-stimulated M2 RAW264.7 cells. RAW264.7 cells seeded in the insert were first stimulated with IL-4 and IL-13 at 20 ng/mL for 72 h and then with GcMAF (0.1 μg/mL) for 24 h and co-cultured with EMT6 cells for 48 h. After removing the insert and washing with PBS, the viable cells were counted using the cell counting kit-8 (CCK-8) assay and expressed as a ratio to the unstimulated cells. Results are expressed as the mean ± SD (n = 5). * p < 0.05.
Ijtm 04 00029 g005
Figure 6. The image of co-culture. RAW264.7 cells and EMT6 cells were separated by 0.4 μm pore insert and cultured in a non-contact environment.
Ijtm 04 00029 g006
Disclaimer/Publisher’s Note: The statements, opinions and data contained in all publications are solely those of the individual author(s) and contributor(s) and not of MDPI and/or the editor(s). MDPI and/or the editor(s) disclaim responsibility for any injury to people or property resulting from any ideas, methods, instructions or products referred to in the content.

