Article

Occupant-Centric Digital Twin: A Case Study on Occupant Engagement in Thermal Comfort Decision-Making

School of Architecture, Carnegie Mellon University, Pittsburgh, PA 15213, USA
*
Author to whom correspondence should be addressed.
Architecture 2024, 4(2), 390-415; https://doi.org/10.3390/architecture4020022
Submission received: 8 April 2024 / Revised: 22 May 2024 / Accepted: 5 June 2024 / Published: 7 June 2024
(This article belongs to the Special Issue Sustainable Built Environments and Human Wellbeing)

Abstract

:
In open and shared workplaces, like co-working spaces or educational studios, thermal preferences vary widely among occupants. With the rise of flexible organizational workplace strategies, the challenge lies in balancing optimum, efficient temperature setpoints with maintaining occupants’ comfort. A potential solution involves a deeper understanding of variations in indoor climate and building occupants’ decision-making and preferences. This paper explores how an Occupant-Centric Digital Twin (OCDT) might address this by mapping indoor microclimates through a grid of IoT temperature sensors in real time. A large-screen display is utilized to present and visualize these data in an open workplace. The goal is to enhance awareness and provide agency for occupants to identify zones that align with their individual thermal preferences. A mixed-method occupant study (N = 27) was conducted to validate the approach. Exposure to the OCDT display resulted in higher thermal satisfaction among participants (p-value = 1.269 × 10⁻⁵, 0.05 significance level). The novelty of OCDT lies in extending the use of digital twin technology from facility managers to occupants, by granting them the agency to address comfort issues even in buildings where they lack direct control over the thermostat. This approach paves the way for a future where occupants in open workspaces can make informed decisions about where to work and how to achieve thermal comfort in those choices.

1. Introduction

Buildings hold a crucial position in the worldwide energy landscape, constituting approximately 40% of the overall energy consumption, which exceeds that of other sectors like transportation [1]. Within the life cycle of a building, the operation phase emerges as the lengthiest [2]. Notably, a staggering 80% of a building’s total energy consumption is attributed to this operational phase. This emphasizes the significance of addressing energy efficiency and sustainability measures during the operational lifespan of buildings to contribute positively to overall energy conservation efforts [3,4].
Over recent years, the infusion of cutting-edge technologies, notably, Internet of Things (IoT) sensors (see Appendix A for the list of abbreviations), has instigated a transformative shift in facility operations. These technological advancements introduce a new era of data-driven methodologies, particularly in the operational phase of buildings [5,6]. In the field of Facility Management (FM), the integration of IoT and the smart connectivity it provides can be used to optimize various activities, including document management, security monitoring, and energy management, among other activities [7]. Nevertheless, the rapid technological evolution presents its own array of challenges. While the benefits of this approach are substantial, the continuous flow of data from buildings adds complexity to the operational phase, given the challenge of managing large volumes of typically real-time data that continue to grow at a rapid rate. The inherent complexity of these datasets poses challenges in terms of data preparation, analysis, cleaning, processing, and management, making it inherently more intricate compared to simpler data structures. This complexity, in turn, affects the ability of managers to make insight-driven decisions effectively [8,9]. The intricacies introduced by these innovative approaches create limitations in the accessibility of insights derived from datasets. Typically, such valuable insights remain confined to the expertise of highly skilled Facility Managers (FMs), specializing in disciplines such as data mining, analytics, and related fields [10]. A noteworthy consequence of this complexity is the exclusion of buildings’ occupants—the end-users—from the decision-making process in the building’s operation phase. Decisions are often made on behalf of occupants without a comprehensive understanding of their needs and individual differences, resulting in a persistent state of dissatisfaction among the building occupants [11].

1.1. Challenges and Opportunities in Integrating Building Occupants into Data-Driven Operational Decisions

To address the aforementioned challenge, there is a pressing need for new technologies that can organize and manage large volumes of IoT data efficiently. Access to and usability of the data are crucial not only for expert facility managers but also for non-expert users, including building occupants. Therefore, technologies enabling occupants to engage in data-driven decision-making processes are necessary. It is important, especially in cases where occupants have the ability to control and adjust ambient conditions. In such cases, without proper information about the consequences of their actions, occupants may adjust ambient conditions solely based on their comfort and preferences. In environments like these, unpredictable and irregular changes directly impact the goals of FMs striving to reduce the buildings’ energy consumption. This highlights the critical need for a holistic approach that involves building occupants in data-driven decision-making processes. It is imperative to bridge the gap between technological advancements, expert insights, and the diverse needs of building occupants for a harmonized and energy-efficient built environment [12].
One innovative technological solution that has emerged to meet this need is the concept of a digital twin, which serves as a cutting-edge method for visualizing real-time IoT data in a spatialized format [13,14,15]. The utilization of a digital twin empowers users to gain insights into large datasets, discern patterns, and detect potential problems. In simple terms, a digital twin can be defined as “a dynamic digital representation of an asset/system that mimics its real-world behavior” [16]. This paper focuses on the operational phase of buildings, underscoring the critical role of real-time IoT data collection and storage through digital twin information technology. The digital twin concept in buildings comprises three distinct components: (1) the physical building, (2) its digital or virtual replica, and (3) the connection between the two [17]. This connection manifests in the form of data flowing from the physical world to the digital realm, as well as information available from the digital world to the physical environment [18]. Therefore, the creation of a digital twin necessitates a virtual model of the building, intricately connected to the physical structure, with data streaming through IoT devices facilitating a dynamic interplay between the two realms (Figure 1). This innovative approach not only enhances real-time monitoring capabilities but also opens avenues for more informed decision-making in the operation and management of buildings [19].
As the concept of the digital twin gains widespread recognition in the built environment, researchers are increasingly turning to tools that facilitate the integration of independent sensor networks and diverse data sources within the spatial framework of a building [20]. This integration serves various purposes, encompassing visualizing building performance data [21,22], establishing large-scale decision-making platforms for campus Operations and Maintenance (O&M) management [16], implementing predictive maintenance strategies [23,24], enabling real-time monitoring of a hospital’s operation [25], and integrating Building Information Modeling (BIM) and IoT to monitor thermal comfort conditions in real time [26].
The prevailing theme in previous studies has been to furnish digital twin information primarily geared toward empowering facility managers only [27]. A few studies have researched integrating occupants’ feedback into digital twins including [28,29], serving as a reference for facility managers’ decision-making. However, these data have not been elevated to the occupant level nor presented to them for their informed and data-driven decision-making.

1.2. Thermal Comfort-Oriented Challenges in the Operation Decisions of Shared Workspaces

As previously discussed, the challenge of conserving energy while ensuring occupants’ comfort remains a complex and multifaceted issue. Thermal comfort is a major aspect of a building’s operations yet maintaining occupants’ thermal comfort is increasingly challenging. Thermal comfort, defined as the perceived satisfaction with thermal conditions, is influenced by a diverse range of factors. These factors encompass air temperature, mean radiant temperature, air velocity, humidity, clothing insulation, and the level of physical activity [30]. Balancing these factors is crucial to creating the best temperature conditions in a building.
Instances of heightened thermal dissatisfaction are particularly found in spaces shared by multiple users, such as open-plan offices, classrooms, studios, and conference rooms. The challenge intensifies in these settings due to the diverse thermal comfort preferences exhibited by individuals. Factors contributing to these variations include differences in gender, age, metabolism, activity level, clothing choices, and other individual preferences [31]. Understanding and addressing this diversity of individual preferences become crucial in managing thermal comfort effectively.
The management of thermal comfort within buildings is predominantly facilitated through the implementation of heating, ventilation, and air conditioning (HVAC) systems. FMs operate the HVAC systems by controlling the temperature setpoints. In the realm of FM, decisions regarding heating and cooling setpoints are not arbitrary but are rather guided by a careful consideration of factors such as a building’s energy consumption and economic implications [32]. However, the dynamic nature of thermal comfort management extends beyond the technical parameters set by FMs. Occupants, the end users of these spaces, wield a certain degree of influence over the energy-related decisions associated with HVAC systems. Their experiences and preferences become evident through complaints and feedback about thermal conditions. Moreover, occupants actively engage with their surroundings, impacting energy consumption in various ways. Simple actions such as opening or closing windows, utilizing personal heaters or coolers, or independently adjusting thermostat setpoints contribute to the overall energy dynamics within the building [33].
While acknowledging the need to accommodate individual thermal preferences, a common scenario in shared occupancy spaces involves FMs exclusively dictating temperature setpoints. In these kinds of circumstances where occupants cannot control their ambient conditions, such as in most educational facilities, building managers face and have to respond to often daily complaints related to occupants’ thermal dissatisfaction. Conversely, in buildings where occupants can control the ambient condition of the space, such as shared office space, they usually want an immediate temperature adjustment; hence, they change the thermostat setpoints to an extra high or low value believing it will make faster adjustments. This not only imposes large shifts in thermal conditions on other occupants, but as they often forget to return to the base setpoint later, FMs face unpredictable amounts of energy use and costs for utility bills [34].
In contrast to domestic environments where individual utility costs may be more direct motivators, shared workspaces present a unique dynamic [35]. Interestingly, the traditional financial consequence associated with energy use has proven ineffective as a motivator for behavior-based energy reduction strategies among employees in shared workspaces [34]. As a result, a new strategic approach is required to efficiently balance the building’s energy consumption while increasing the thermal comfort of its occupants. Implementing technology solutions that allow for personalized thermal control within communal spaces and educating occupants about the broader implications of their individual adjustments could represent a more effective strategy. By fostering a sense of shared responsibility and providing occupants with a degree of control over their immediate environment, a harmonious balance can be essential—where energy efficiency is optimized without compromising the comfort of individuals within the shared workspace. This holistic approach recognizes the complexity of shared occupancy settings and seeks to create a sustainable and agreeable environment for all stakeholders involved.

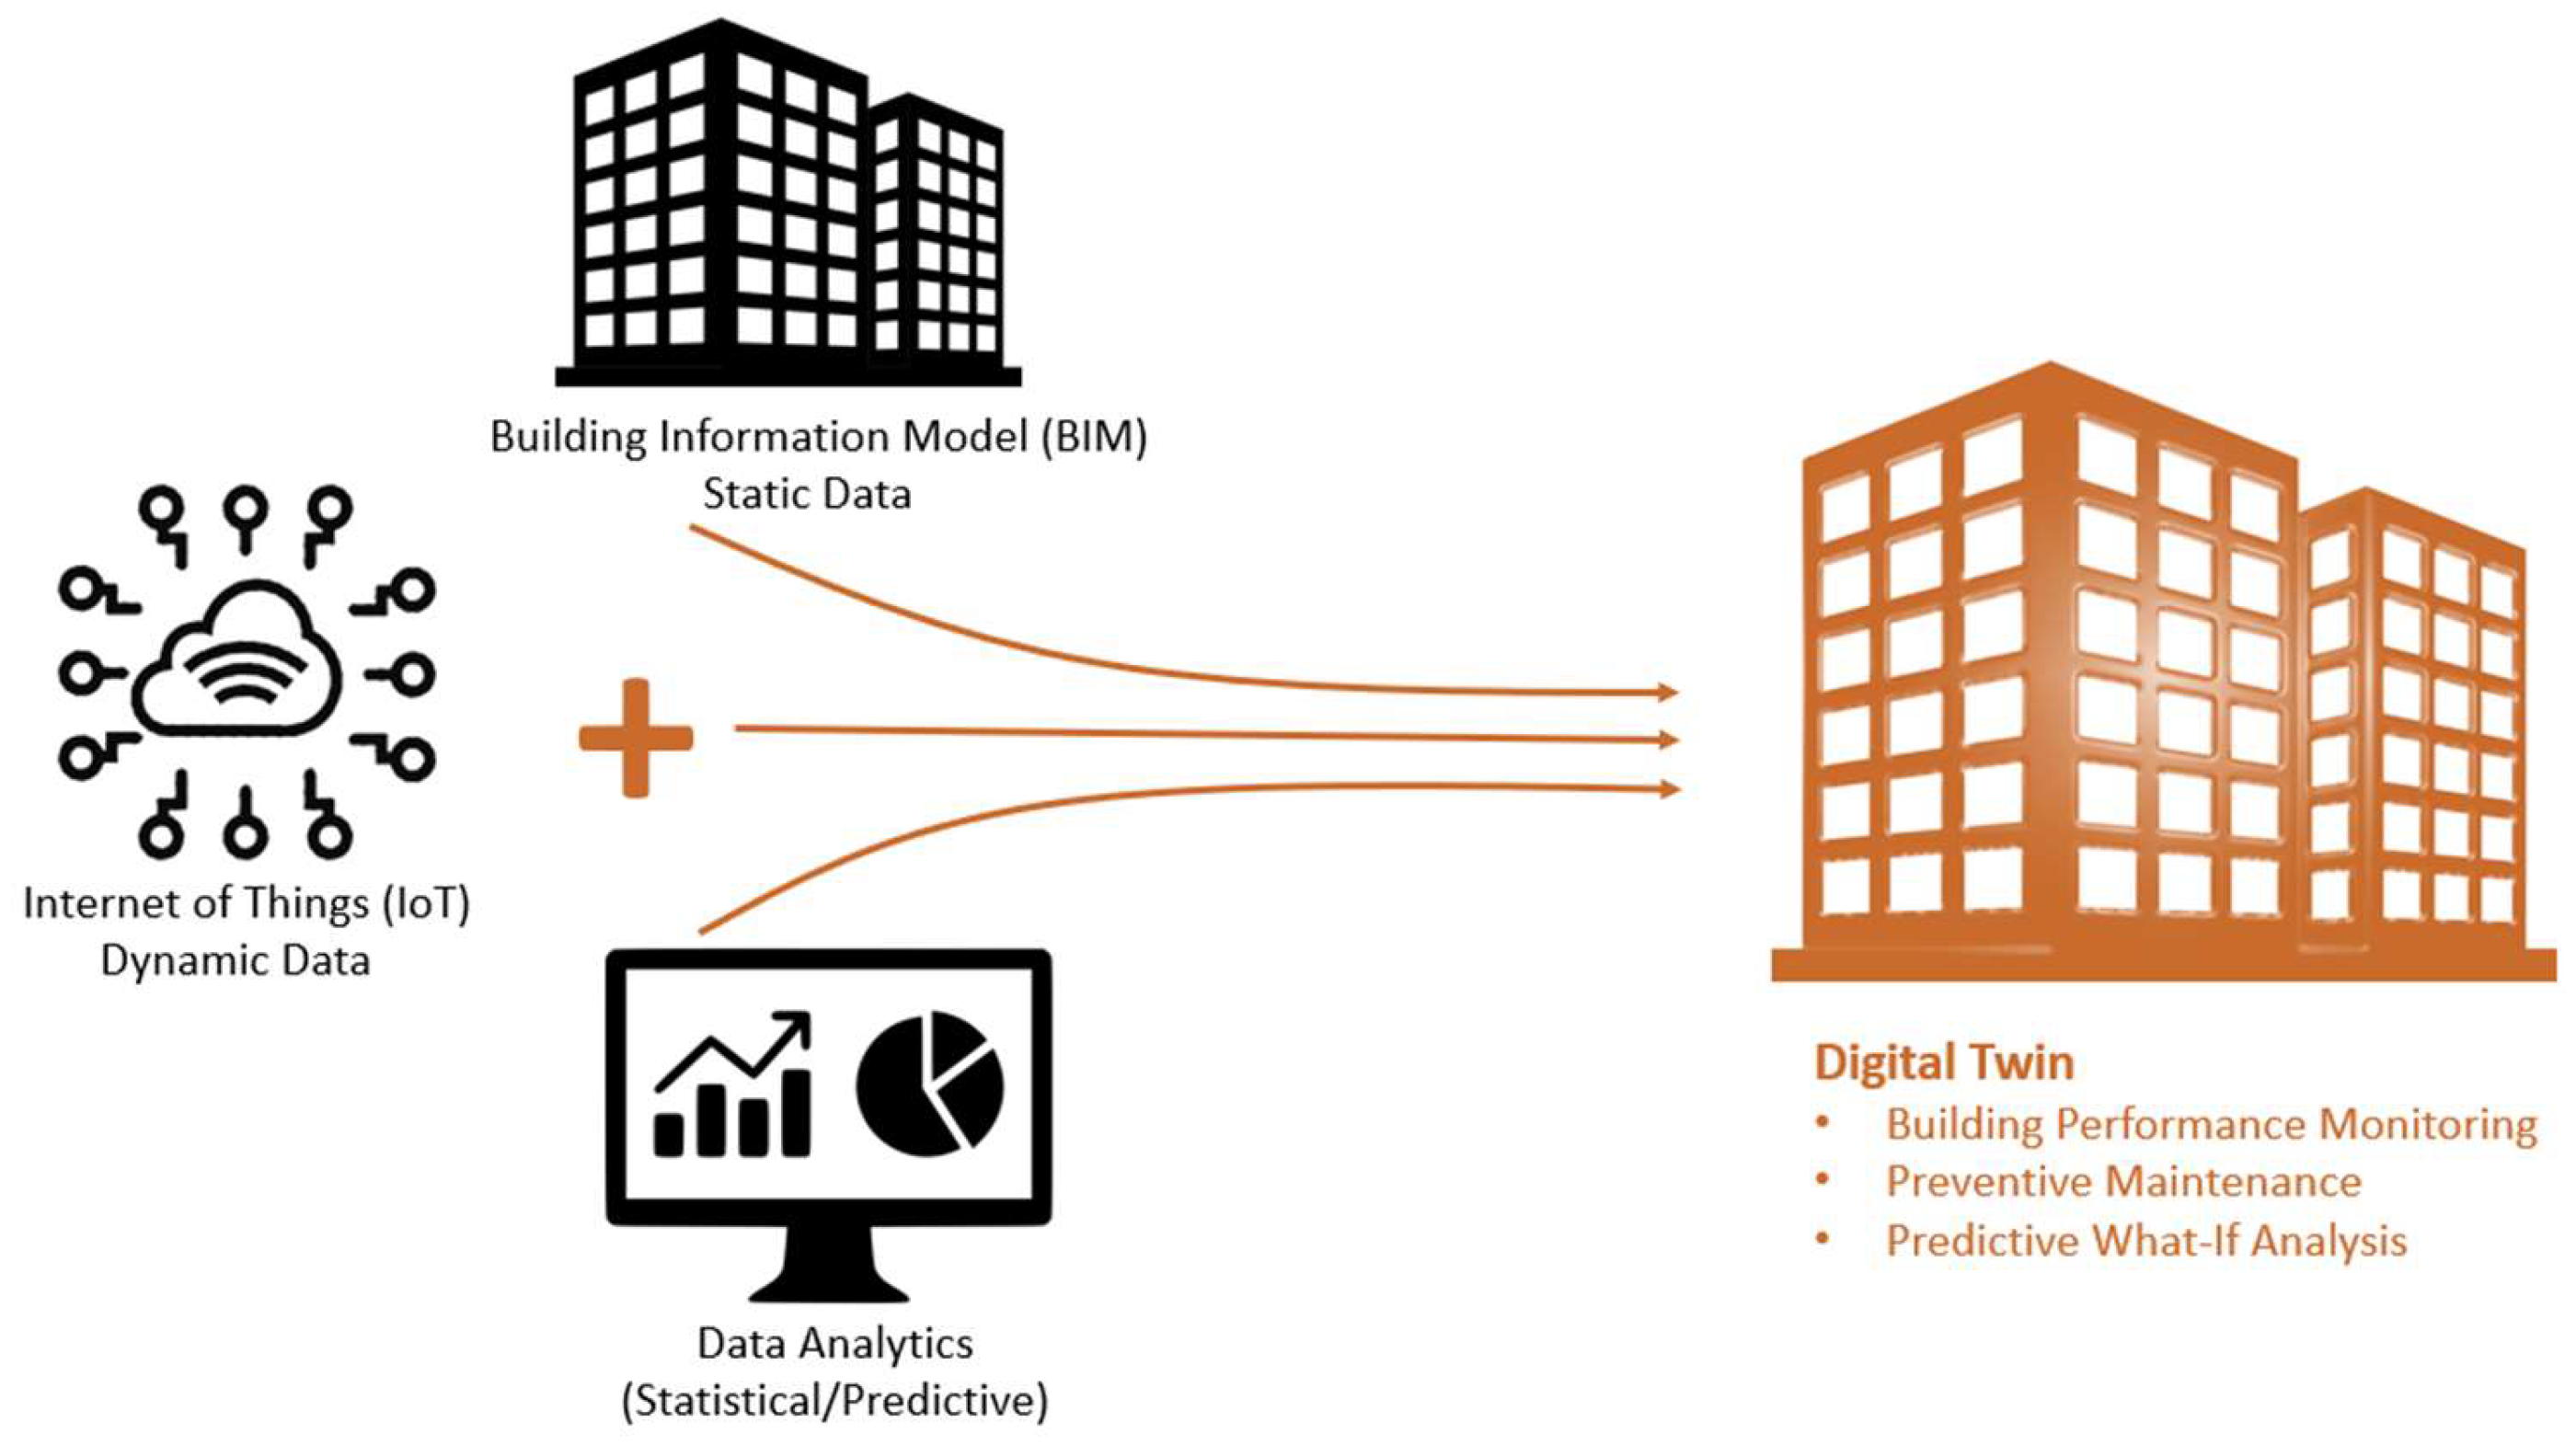
1.3. Introducing an Occupant-Centric Digital Twin (OCDT) Approach to Address Thermal Comfort-Oriented Challenges in Shared Workspaces

This research posits that addressing thermal comfort in shared spaces requires understanding occupants’ behavior and preferences. It introduces the Occupant-Centric Digital Twin (OCDT), a novel approach that integrates digital twin technology at the occupant level, unlike traditional facility management applications [36]. The primary goal of OCDT is to inform occupants about environmental conditions in real time, empowering them to participate in data-driven decision-making. This approach enables occupants to proactively manage their surroundings, enhancing their thermal comfort.
The OCDT approach in this paper empowers occupants to make informed decisions about their thermal comfort, focusing primarily on temperature preferences. While the initial phase centers on providing real-time data and insights about temperature, the concept is adaptable to include other factors like humidity, light, and acoustics. This paper represents a pilot study, with plans to expand OCDT to include more sociotechnical aspects of thermal comfort in future phases. Currently, OCDT integrates real-time data from IoT-enabled sensors, data analysis, and live visualization to enhance occupants’ decision-making and awareness of their environment.
The objective of OCDT in this paper is to keep occupants informed about the thermal conditions of their spaces by providing real-time temperature data and historical variations in indoor microclimates. Microclimates, often caused by modern building designs and environmental factors, create zones with differing conditions within the same space. Without detailed information on these variations, occupants struggle to optimize their spatial use, leading to imprecise feedback and dissatisfaction. Traditional facility management approaches adjust temperatures based on complaints, which is inefficient and fails to address diverse thermal preferences effectively. OCDT aims to overcome these challenges by offering comprehensive and precise temperature data, helping occupants make better-informed decisions, and enhancing overall comfort.
By providing detailed micro-level temperature information, FMs can empower occupants to maintain their comfort levels proactively. The OCDT allows occupants to understand localized conditions and make informed decisions about their working locations, enhancing comfort and enabling dynamic indoor environment management. This paper hypothesizes that real-time microclimate data and occupant agency in space selection can increase thermal satisfaction and reduce energy consumption. The user-centric approach, where HVAC systems respond to localized preferences, optimizes both comfort and energy efficiency. The study suggests integrating OCDT into future building management systems to better understand user experiences and incorporate human values into building design.
Overall, this paper seeks to address the persistent challenge of temperature-oriented thermal satisfaction in shared workspaces, particularly in environments where occupants lack control over the operating systems, such as educational buildings at universities, where occupants have no influence over HVAC temperature setpoints. OCDT as an innovative framework leveraging cutting-edge technologies is aimed at enhancing occupants’ thermal satisfaction. In the following chapters of this paper, initially, the methods used to develop a foundational digital twin that presents micro-level indoor temperature information in real time are introduced. This digital representation acts as a dynamic interface, offering occupants insights into the current thermal conditions of different areas within a space. Following the development phase, methods of an occupant study conducted to evaluate and assess the effectiveness of the implemented OCDT will be discussed. This study aims to gauge the impact of visualized live information from the OCDT on occupants’ decision-making processes concerning seat selection, thermal perception, and overall thermal satisfaction. Therefore, the results of this paper, will address the following research questions; “Could the provision of real-time visual representation of an indoor microclimate via an Occupant-Centric Digital Twin (OCDT) display influence occupants’ decisions regarding their choice of seating location? If such an influence exists, what would be its consequential impact on occupants’ thermal perception, thermal satisfaction, and awareness regarding the indoor microclimate phenomenon and its spatiotemporal characteristics?”

2. Materials and Methods

In this Section, the methodology for constructing the initial prototype of the OCDT display is outlined. A concise overview of the steps involved in its development is provided (Section 2.1). Additionally, the empirical study conducted with occupants to evaluate the effectiveness of the developed OCDT is delved into (Section 2.2).

2.1. Occupant-Centric Digital Twin (OCDT) Display Development Methodology

Within this work, the aim is to create a digital twin that displays indoor microclimates. To achieve this, the following three elements are required: (1) the physical building, (2) the development of digital/virtual replica, and (3) a means of connection between the two [19]. These are next described. For this work, the selected physical building context is an open studio workspace on the Carnegie Mellon University campus. This space is a large open-plan shared work area with 189 seats. For this phase, only a small portion of the workspace (27 seats) was used to create an initial digital twin. The workspace has large west-facing windows, so there is a high potential for extreme indoor microclimates in this space. This was subsequently validated by manual temperature measurements (Figure 2a). To prepare a virtual replica of the space, an intuitive strategy for presenting spatial information was first identified. This strategy aimed at helping occupants easily interpret, understand, and relate temperature differences across the space. A 2D-floor-plan view of the workspace was ultimately selected to represent the space’s spatial information to occupants in the digital twin approach (Figure 2b). Finally, to make the connection between physical and virtual space, LoRaWan-enabled IoT temperature sensors [37] were used to retrieve temperature readings from the physical space at fifteen-minute intervals. The operating temperature range of these sensors is −22 °F to 158 °F (−30 °C to 70 °C), with accurate readings within a margin of +/− 0.3 degrees Celsius (+/− 0.54 degrees Fahrenheit). These readings supported subsequent analysis and visualization in virtual space (Figure 2c).
The following steps were taken to create the digital twin of indoor microclimate within the case study location.

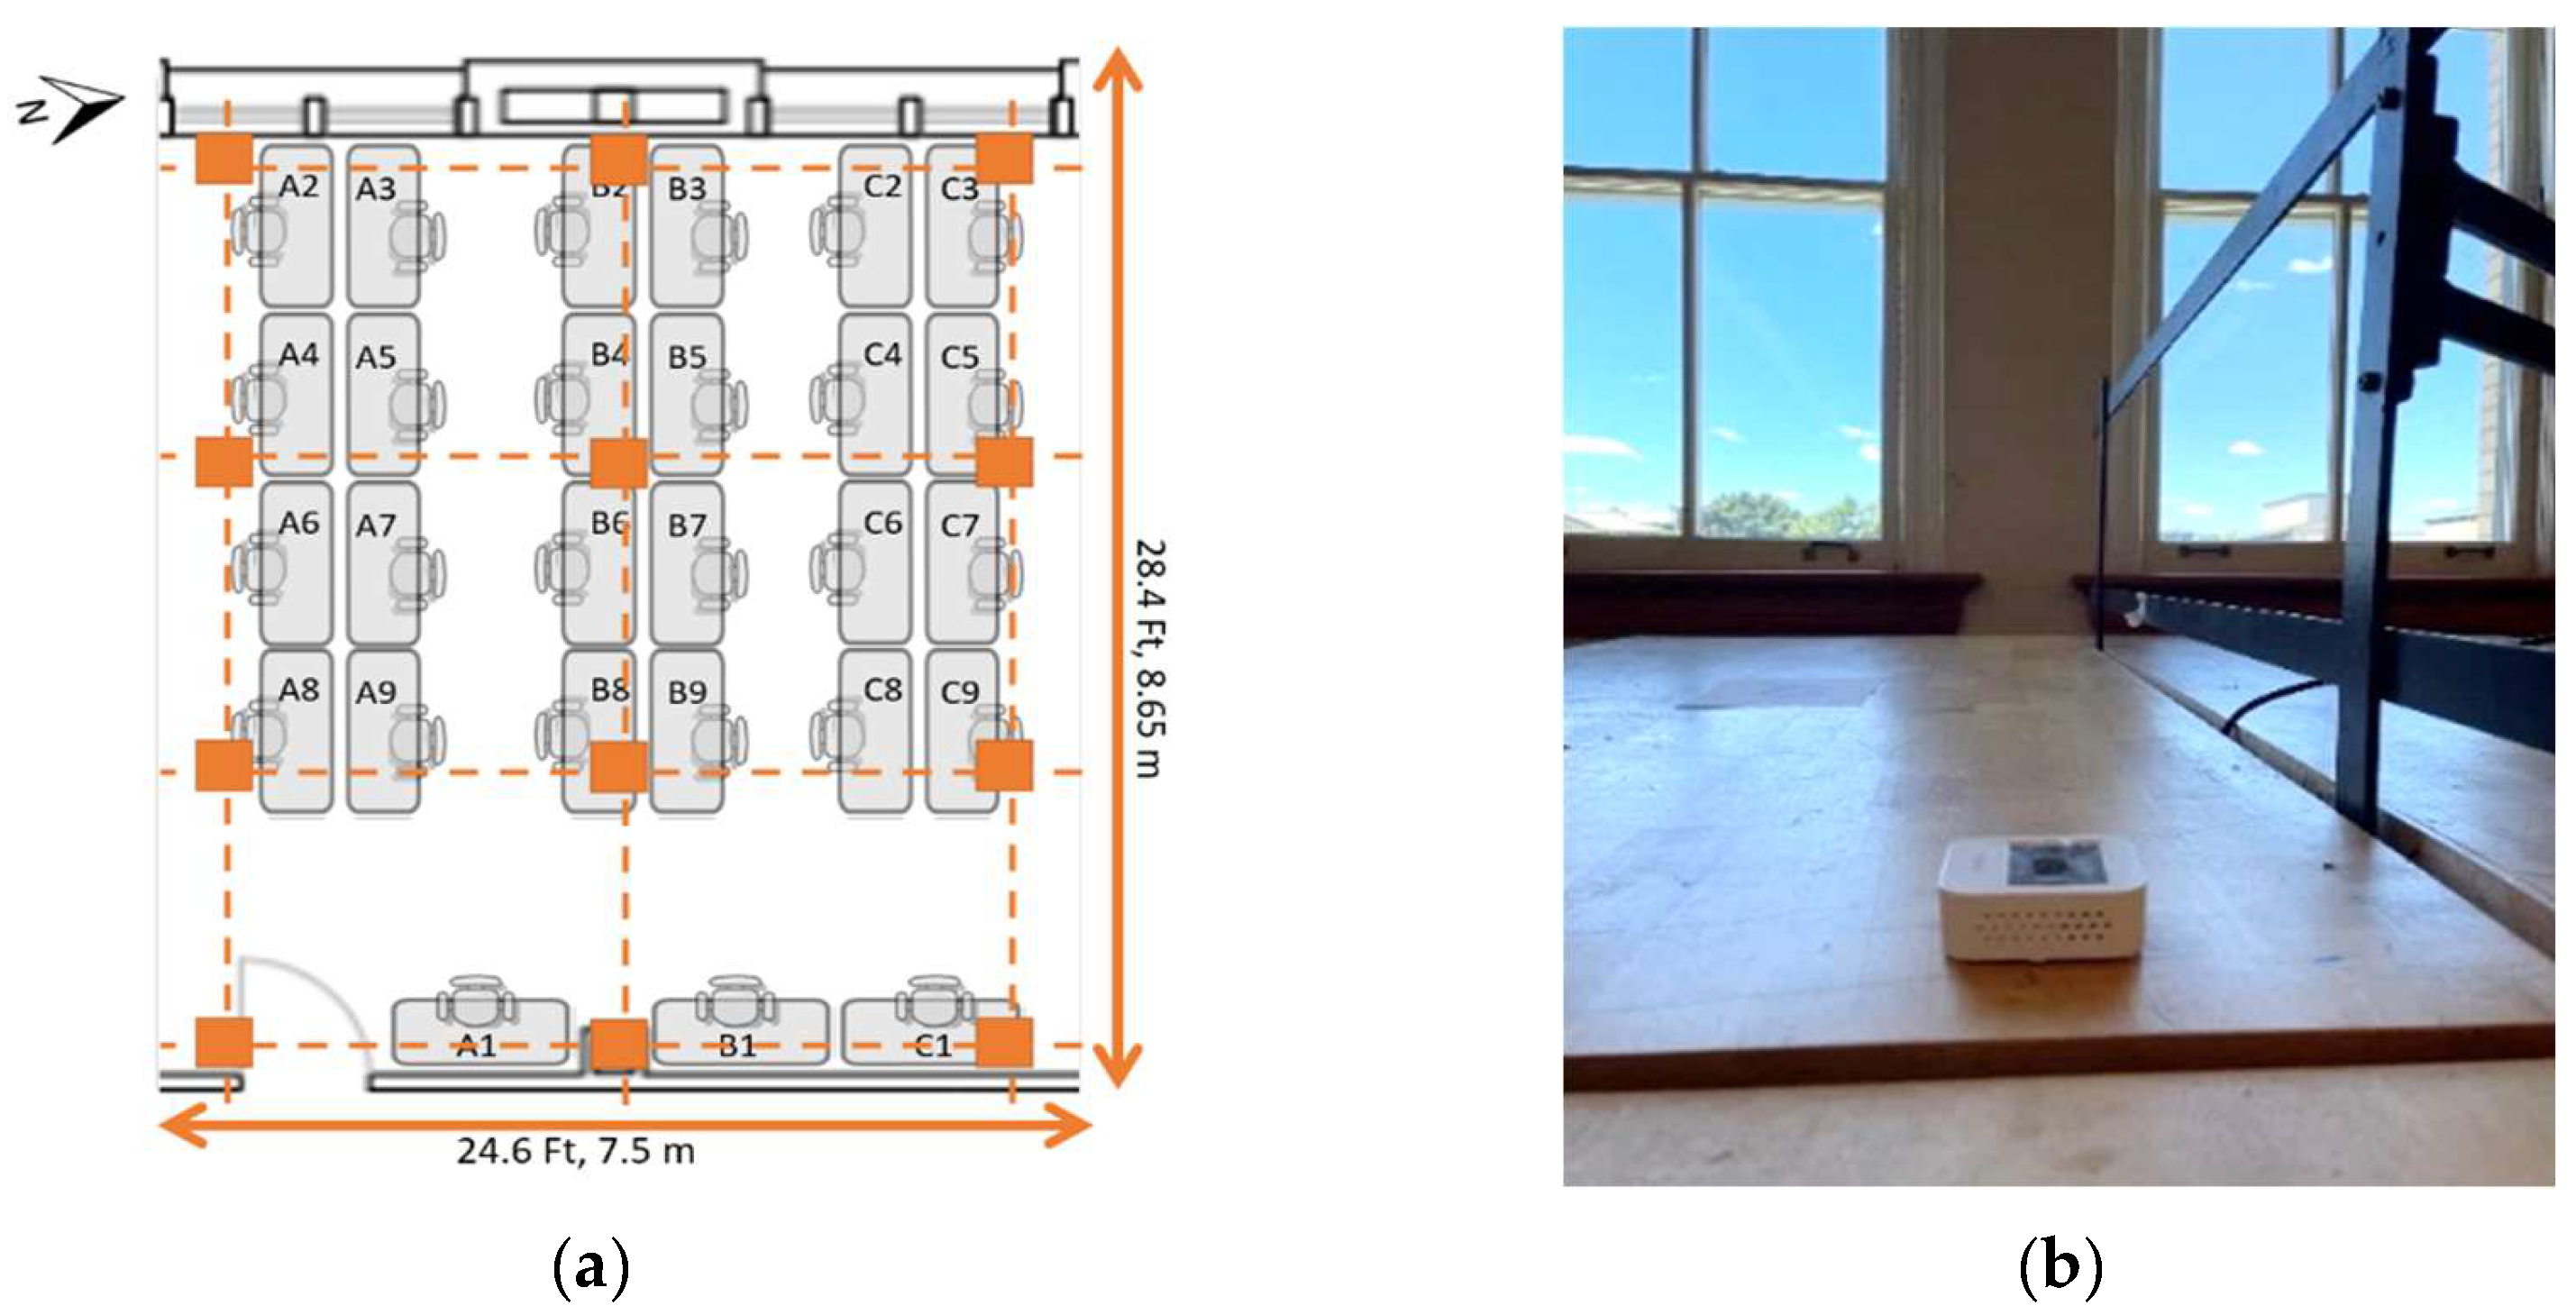
2.1.1. Step 1: Sensor Placement

As stated earlier, in this paper, we focused on temperature as the primary factor in occupants’ thermal comfort. To gather this information, a grid of smart thermometers was placed at the site. After performing pre-occupancy manual temperature measurements of the area, microclimates were identified. Subsequently, twelve sensors were installed along the edges and in the center of the room to capture live indoor temperatures (Figure 3). Sensors were either wall-mounted or placed on the desks and formed the node of a grid as illustrated in Figure 3. Both wall-mounted and desk-mounted sensors were placed at a vertical height of 90 cm (2.95 ft) above the ground to match the height of the occupants’ desks. Each sensor relayed temperature data to a LoRaWan-enabled hub, which in turn relayed that information to a cloud service.

2.1.2. Step 2: Automated Live Sensor Data Retrieval and Storage

The sensors were configured to send a customized alert at a minimum of fifteen-minute intervals. Each sensor alert shared its temperature data. An Application Programming Interface (API) of the temperature sensor service was used to access and retrieve the resources [38], and a cloud service was utilized to trigger storage in response to the alert. Temperature information was automatically imported into a cloud-based platform and stored for subsequent processing as described in Section 2.1.3. A set of existing services, API integrations, and platforms [39] were utilized to automatically add a row containing the latest data of each sensor to the cloud-based platform whenever a sensor alert was detected.

2.1.3. Step 3: Creating a Digital Twin User Interface (UI)

The visualization and user interface was designed with Python libraries and Plotly [40]. The Google Colab platform was used to create the dashboard UI [41]. Google Sheets, storing the sensor data, was linked to the Google Colab platform as a data source. This allows the latest temperature sensor data to be immediately imported into the dashboard as new rows are uploaded to Google Sheets. Finally, the floorplan of the workspace is shown overlaid with the latest temperature of the microclimates measured at each sensor (Figure 4). The process for developing this visualization is next described.

2.1.4. Step 4: Dynamic Thermal Map of the Live Temperature Data

Plotly’s 2D contour plot was used to visualize the sensor grid as a color-coded thermal map. Since this 2D contour plot shows the contour lines of a 2D numerical array, the data were organized as NumPy.ndarray of the sensor grid. The numeric values for the sensor grid’s NumPy.ndarray were prepared as a transformation of the raw sensor data. To improve the smoothness of visualization, the detail of the grid was increased by interpolating between the sensor values of a pair of adjacent grid nodes (Figure 4a). Creating microclimate maps for indoor environments can be difficult due to factors like temporal variability resulting from building design, occupancy patterns, and more [42]. To ensure that the spatial interpolation challenge was addressed, two main approaches were adopted. Firstly, the number of sensors was increased strategically to minimize large spatial gaps between them, thus preventing temperature variations between sensor nodes. Secondly, before sensor placement, physical measurements were conducted across all indoor areas to identify specific locations requiring temperature sensors, ensuring comprehensive coverage.

2.1.5. Step 5: Animation of the Historical Data

The focus of this work is on providing real-time data visualization to guide occupant decision-making and interaction with the building’s workplace. This work also offers a wealth of historical data by storing the temperature data for later analysis. The exploration of historical data served as a resource for understanding the change in microclimates and indoor thermal conditions over time. Using these data, a sequential animation was created to depict the changes throughout a specific period. The animation feature was added to the public display, alongside the current view of the indoor microclimates (as depicted in Figure 4), to visualize how the indoor thermal map had changed over the last 8 h. Plotly’s Express functions were utilized to create animated thermal map figures based on the array of sensor data stored. “Play” and pause button, along with an interactive timeline is provided for the occupants to (re)run, review, and scrub through the animation as needed (Figure 4b).

2.1.6. Step 6: UI Enrichment with Analytical Diagrams

To enhance occupants’ understanding of daily changes in the space, the dashboard includes two live analytical diagrams. The first diagram displays the minimum and maximum temperatures within the space throughout the day. The second diagram shows the differences between the maximum and minimum temperatures recorded by all sensors over the same period. These diagrams help occupants comprehend extreme temperature variations in the microclimates over time (Figure 5). Figure 5 illustrates indoor temperature fluctuations at the case study location from 1:53 p.m. to 8:23 p.m. on 11 August 2022. It demonstrates that within this space, the temperature gap between the maximum and minimum readings widened to 19 °F (10.5 °C) around 5:23 p.m. Consequently, occupants may experience a range of temperatures, from 68 °F to 87 °F (20 °C to 30.5 °C), simultaneously within this single area.
Figure 6a illustrates the interface of the OCDT’s display interface on 11 August 2022 at 6:53 p.m. (Figure 6a). The display was placed immediately inside the entrance to the case study instrumented study space location (Figure 6b). The digital twin interface, presented on a large touchscreen TV, enables occupants to interact with the system, exploring historical data animations and insights. The interface, rendered as a webpage and displayed in full-screen kiosk mode, automatically updates with new data without requiring users to refresh the page. This study represents the first phase of an ongoing project to enrich the OCDT display with occupants’ collective feedback in a shared workspace. Opting for a large shared screen rather than personal devices aims to encourage communication and collaboration among occupants, enhancing their collective engagement. This choice gains even more importance in future phases where multiple users will concurrently use the system.
The dynamic thermal map and data-driven charts allow occupants to perceive the spatiotemporal features of the indoor microclimate. By visualizing temperature distribution on the floor plan throughout the day, occupants can see how external factors like direct solar radiation significantly impact indoor microclimates, especially near windows. Internal heat loads, such as people, equipment, and lighting, had less effect during this study.

2.2. Occupant Study Methodology

As described in the previous Sections, the OCDT approach is designed to provide a visual interface for improvised human–building interaction [43], and specifically to increase occupancy agency and decision-making toward improved thermal comfort and satisfaction. To explore the efficacy of this approach, a mixed-methods user study was conducted to assess occupants’ interaction with and understanding of the real-time display and how it affected the decision-making and perception of thermal comfort and satisfaction in the space. Additionally, this study explored occupants’ experience of interacting with the OCDT display to understand challenges and opportunities for improvement in future real-time interfaces of indoor environmental conditions.

2.2.1. Occupant Study Experiment Design

To study the system and its effect on occupancy behavior, an in-person assessment was conducted, and individual evaluations were administered in the augmented workplace mentioned in the previous Section. The required approvals were obtained from Carnegie Mellon University’s Institutional Review Board (IRB), which is a common part of similar user studies [44]. As the experiment was conducted individually, the experiment was exclusively carried out on sunny days between 4:30 p.m. and 6:30 p.m., considering that sunset occurred around 8:30 p.m. The experiment spanned from the first week of August 2022 through mid-August 2022 to accommodate all participants. This timeframe was chosen to control for experimental and environmental factors that could impact occupant perception. Specifically, the aim was to mitigate the influence of confounding variables such as the time of day on both the visualized indoor microclimate map and participants’ perceptions of thermal comfort within the study design. This ensured all participants experienced indoor microclimate conditions as well as other environmental factors (lighting conditions, etc.) as similarly as possible while participating in the experiment.
The study was organized into two rounds. User perception surveys were administered after both rounds in order to gather comparative measures of perceived thermal comfort. The survey details are discussed in Section 2.2.3. In the first round, participants were not provided with any information about the microclimates in the space. Participants were asked to select any seating location within the space that they would desire to sit at. At each desk, Quick Response (QR) codes were used to provide access to the complete survey. The QR code was also used to uniquely identify the desk location selected. The perception survey prompted them with questions about their perceived thermal comfort at their occupied location. In the second round, participants were invited to review with the OCDT display. They were provided with a brief summary and introduction to the OCDT display and the real-time information about the indoor microclimates and the spatiotemporal characteristics it offered. Participants were offered the opportunity to interact with the OCDT UI, its live information, and animations should they so choose. This provided them an opportunity to learn about temperature differentials within the space, and they could review this information at their leisure. Once they had finished exploring the OCDT, they were asked again which seating location they would choose to occupy. They were free to return to their original location or choose a new location. Once seated, they used a QR code to complete another user perception survey.
Both rounds occurred consecutively on the same day. Participants were allocated 25 to 30 min in each round to acclimate to the temperature of their chosen seats before taking the survey, resulting in a total duration of approximately fifty-five minutes for both tasks [45]. Once both rounds of the study were completed, participants were asked to provide both quantitative and qualitative feedback about their experiences interacting with the OCDT display. The feedback was gathered using standard user experience surveys and supported with short exit interviews. Exit interviews were audio-recorded and transcribed for later analysis. Participants were allowed to pause the experiment at any point during the process. Additionally, they were welcome to provide optional verbal feedback—for example, to articulate their decision regarding desk selection—throughout the study. In this case, their comments were quietly observed and noted.

2.2.2. Participant Recruitment Methods

Considering the main research question of this user study, the required sample size was determined via an a priori power analysis using G*Power in version 3.1.9.7. G*Power analysis, a statistical tool employed to ascertain the requisite sample size in research designs, particularly proves invaluable in experiments utilizing specific statistical methods such as t-tests. In this study, a dual-phase approach with identical participants dictated the application of a ‘paired, one-tailed t-test’ for statistical analysis. Employing G*Power analysis, realistic input parameters were configured, encompassing a power of 0.8, an alpha level of 0.05, and a medium effect size. The analysis yielded that, to achieve a power of 0.8 at an alpha level of 0.05, 27 participants are recommended to detect the anticipated medium effect size in the context of a paired, one-tailed t-test.
Twenty-seven participants were recruited through the university campus email list. Participants were required to be at least 18 years of age and located on campus. No other inclusion or exclusion criteria were applied to gain as broad a sample as possible. A paper-based consent form was given to participants, which had a brief description of the study and all information that they would need to know before accepting to participate. Participants were offered USD 5 at the end of the experiment. They could withdraw at any moment without providing reasons and without any adverse consequences of any kind.

2.2.3. Data Collection Methods

In this experiment, each participant was assigned a number, which was used instead of their name in recording any data collected during the study. A mixed-method approach was employed. Quantitative data were collected from two types of questionnaires (user perception surveys and user experience surveys). Additionally, qualitative insights were gained through interviews. Hence, the data collection methods can be listed as follows:
  • User perception survey in two rounds;
  • User experience survey;
  • Open feedback interview.
In the context of user perception surveys aimed at measuring participants’ perceived thermal comfort, a questionnaire was designed to gather self-reported satisfaction levels with thermal comfort. This questionnaire focuses on the subjective perception of comfort in terms of indoor temperatures. It builds on two standardized approaches: Georgia Institute of Technology’s “Thermal Comfort Verification Survey” [46] and the Building Green LEEd User’s “Thermal Comfort Survey” [47], which were used as the core survey questions (Appendix B, Questions 1–6). In both rounds of the study, participants were asked to provide their seat number (Q1), subjective perception of thermal comfort (Q2), and their thermal satisfaction level (Q3). Both ratings were on a seven-point Likert scale. In case they were not satisfied, they were asked follow-up questions regarding their source of discomfort (Q4–5). Participants responded to the questionnaire while at the location they selected [45]. In the second round of the study, the OCDT display was introduced to participants. In this case, the user perception survey included additional questions that explored the effect of the OCDT display on their choice of location, the usefulness and effectiveness of OCDT, and changes in their understanding of the indoor microclimate (Q7–15). Appendix B presents the user perception survey questions used in the second round, with Q1 to Q6 shared with the first round.
In the context of user experience survey, a post-task questionnaire was administered to collect quantitative data about each participant’s experience of interacting with the OCDT display [48]. The User Experience Questionnaire (UEQ) [49] was used to assess usability. The UEQ captures the impressions of an end-user toward a software product, in this case, the OCDT display prototype [50]. The UEQ consists of 26 questions organized as pairs of contrasting attributes on a 7-point semantic differential scale (e.g., complicated □□□□□ x □ easy). Note that during data coding, this scale was converted to a range from −3 to +3. The 26 items are organized into 6 groups, briefly summarized as follows: Attractiveness (e.g., Do users like or dislike the product); Stimulation (e.g., Is it exciting and motivating to use the product); Novelty (e.g., Is the product innovative and creative); Perspicuity (e.g., Is it easy to learn how to use the product); Efficiency (e.g., Can users solve their tasks without unnecessary effort); Dependability (e.g., Does the user feel in control of the interaction [51]. Attractiveness is assessed on valence. Stimulation and Novelty capture hedonic quality (non-goal-directed), while Perspicuity, Efficiency, and Dependability examine pragmatic (goal-directed) quality components [52]. To supplement the UEQ survey, demographic and background information on the participants was captured using this survey, which took approximately five minutes to complete.
The study ended with short exit interviews aimed at gathering open feedback from participants regarding their experiences with the space and the OCDT. These semi-structured interviews, as described in [44], included follow-up questions to gather additional context on decision-making processes, interpretation of real-time data, and feedback on visualization and interaction strategies, among others, as outlined in [48]. Prompts included questions about participants’ first impressions of the OCDT display, the usefulness of existing information, liked or disliked features, desired additions for future versions, and more. Exit interviews for most participants were brief, typically lasting 5 min. However, some participants chose to give extensive feedback, taking 20–30 min.
Before the study, the workspace and study site were equipped with temperature sensors, and the OCDT display updated every fifteen minutes. Digital surveys were made with Google Forms [53], and QR codes [54] were assigned to each desk for user perception surveys (rounds one and two) and the user experience survey. Each seating location was labeled with a unique identifying number (Figure 7). Face-to-face interviews conducted by the first author were audio-recorded and transcribed for analysis, ensuring de-identification.

2.2.4. Data Analysis Methods

For the surveys, both descriptive and inferential statistical approaches were utilized to analyze the results. Descriptive statistics were used for the initial exploratory analysis of results. As inferential statistics, a t-test [55] was utilized to estimate the probability of either a single value (one-sample t-test) or the difference between two paired values (Paired t-test). A one-tailed t-test was specifically employed to address the main research question of this user study: the relationship between visualizing real-time indoor microclimate data and a change in occupants’ thermal comfort satisfaction. Generally, for both the user perception survey and the UEQ survey, 95 percent confidence intervals were utilized to make inferences about the population means of each item.
For the interviews, first, all feedback was transcribed verbatim. Each interview transcription was read several times to gain familiarity and a complete understanding of the content [56]. After that, a bottom-up open coding approach was followed. Codes were grouped into clusters for further analysis (using Miro, an online collaborative tool [57]), and emergent themes were derived from the data. The overall process was iterative.

3. Results

In this Section, the results of the occupants’ study will be discussed in detail. Initially, attention will be directed toward examining how OCDT information would appear when occupants interact with it. Figure 8 depicts the changes in temperate distribution within the space on 11 August 2022 at 9:53 a.m., 3:53 p.m., 5:53 p.m., 6:53 p.m., and 7:53 p.m. Before noon—and since windows do not receive direct sunlight as they do in the afternoon—a more homogeneous temperature distribution is experienced within the space. However, during the afternoon and as the sun sets, windows facing west begin receiving more sunlight. This in turn makes nearby areas increasingly warm (Figure 8). This information is in real time and does not remain consistent throughout the entire summer days; however, Figure 8 provides a sense of a typical sunny day in the summer. When interacting with the OCDT UI, occupants will receive this information once the “PLAY” button is pressed. The following Section delves into the actual results of the occupant study in detail.

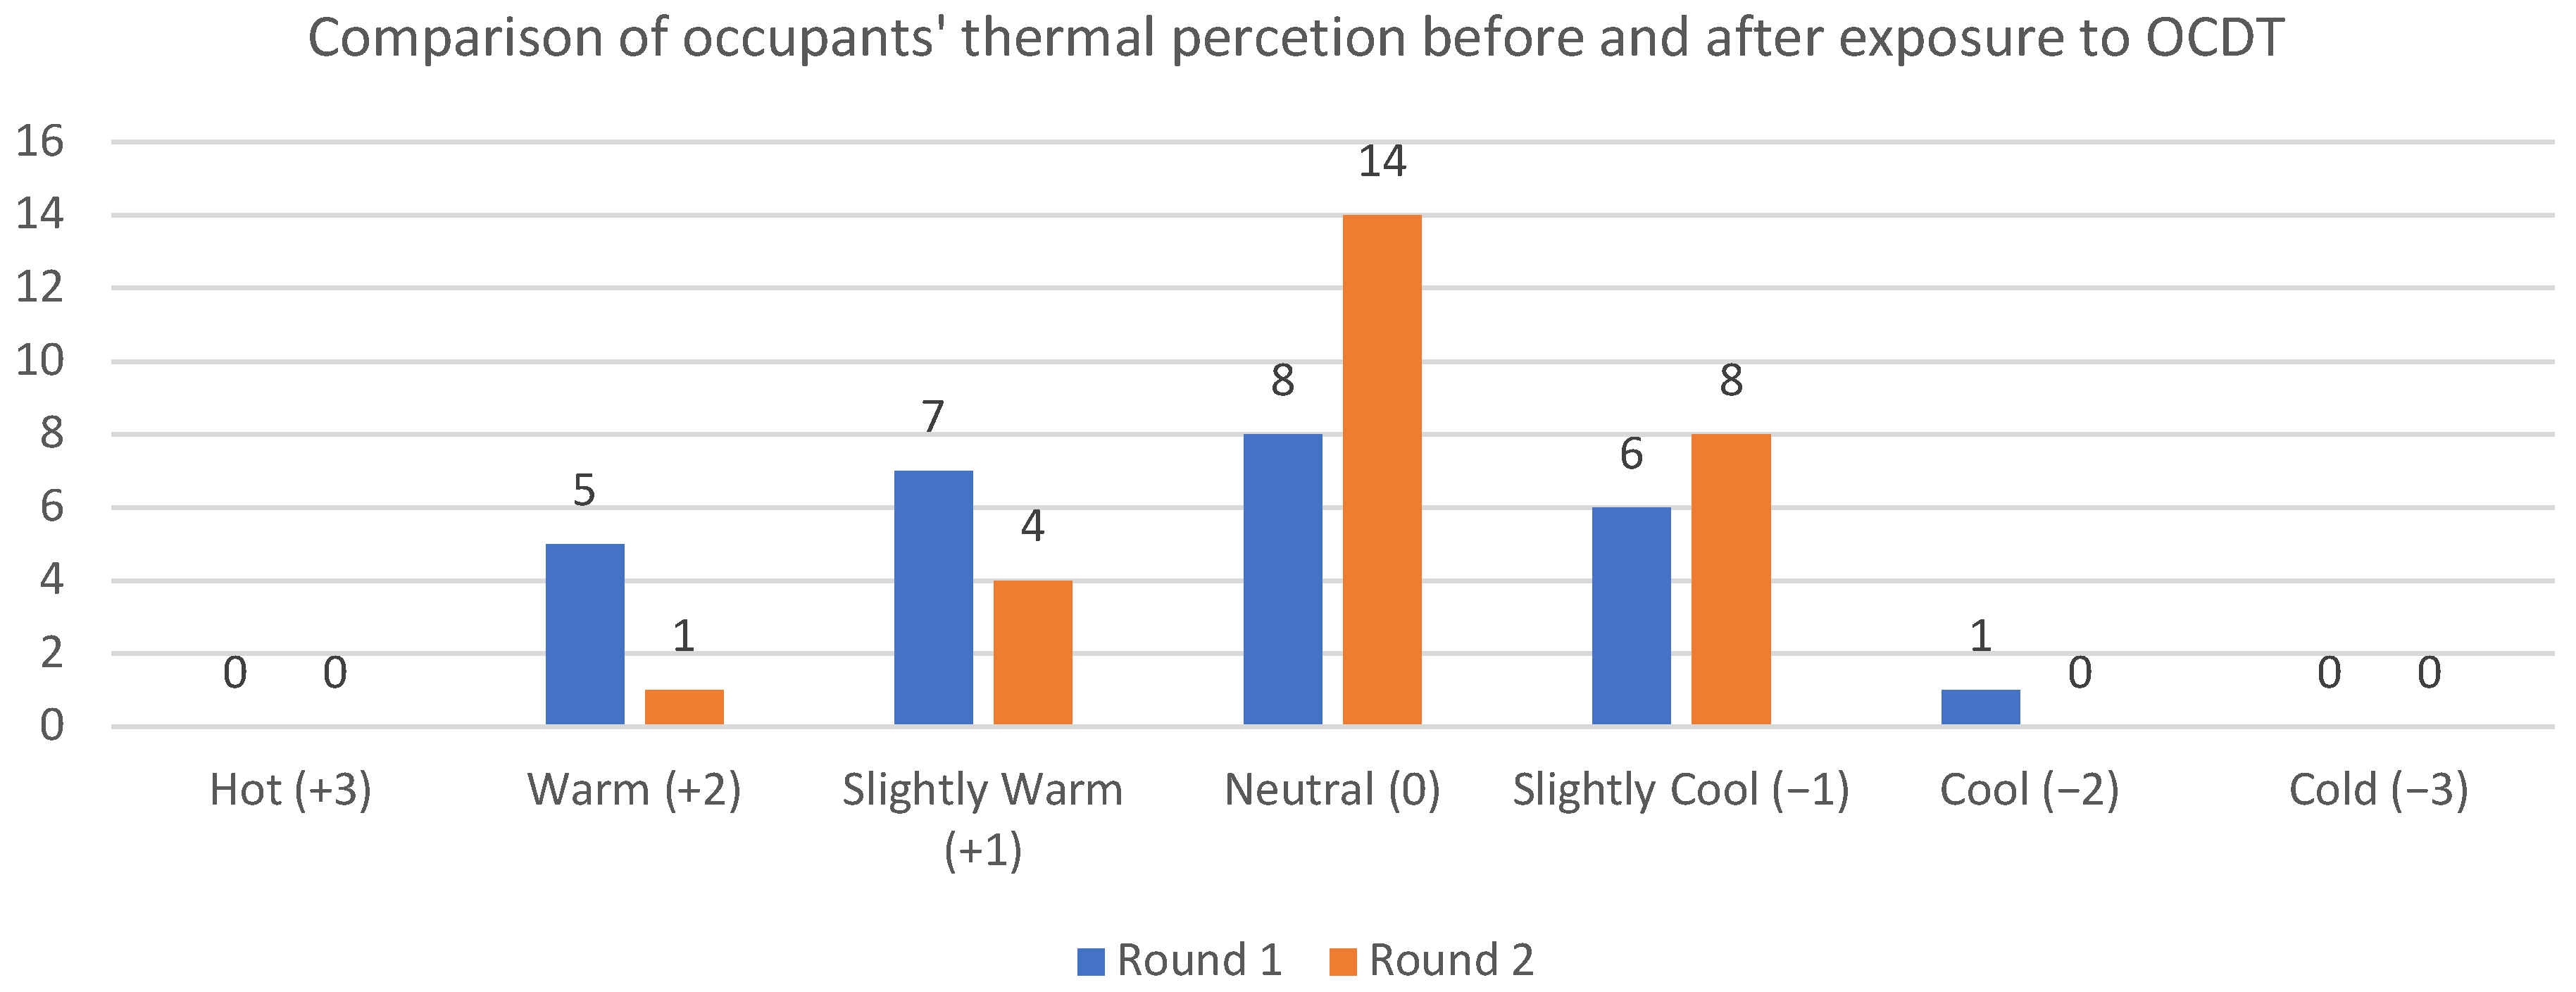
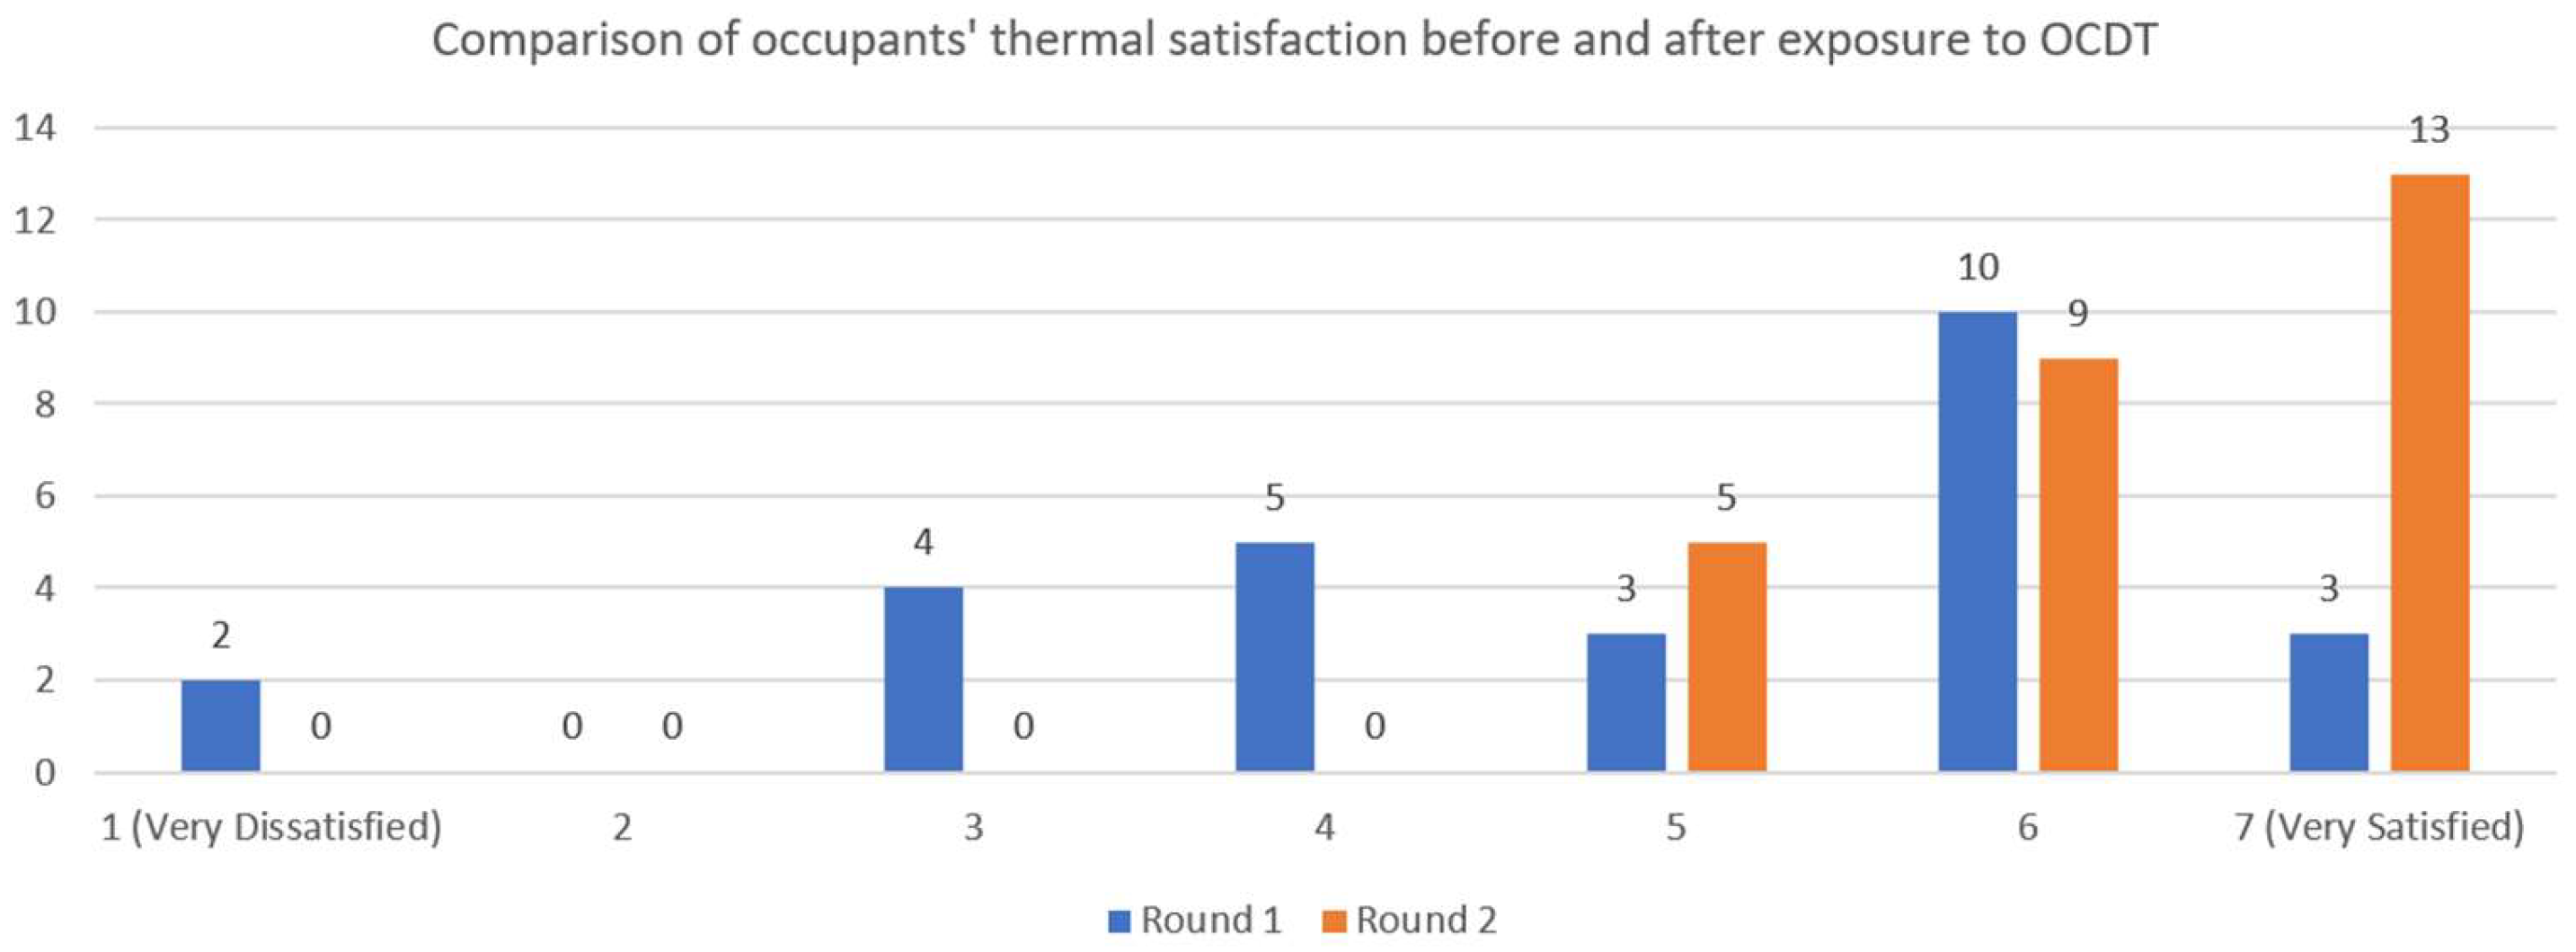
3.1. User Perception Survey

To ensure the reliability of test results from a statistical perspective, data were collected randomly from the entire target group. Moreover, the collected information was independent and not influenced by any prior data. Additionally, the entire study group’s distribution conforms to a standard bell-shaped pattern, indicating a normal distribution [55]. Prior to commencing formal statistical analyses, Exploratory Data Analysis (EDA) was initiated. The participants (N = 27) varied in age from 18 to 48 (Mean = 24, Standard Deviation = 5.99), comprising 13 males and 12 females, with 2 individuals choosing not to disclose their sex.
Initially, a comparison was made regarding the differences in selected seat numbers across the two rounds (Q1). Following participants’ exploration of available options and selection of seats in the first round, 20 out of 27 participants altered their seat locations in the second round upon being presented with the OCDT display (Sample Mean = 0.74) (Figure 9a). Interestingly, seat A1 emerged as the most selected seat in round 2. Six out of the 20 participants who changed seats opted for seat A1 in the second round of the experiment (Figure 9b). This choice correlated with the microclimate map, which indicated that the area surrounding seat A1 maintained the lowest temperature throughout the day (see Figure 6a). This preference for cooler areas coincided with the participants’ inclination toward cooler spots on a sunny summer day.
To statistically investigate the generalizability of the sample results regarding whether the OCDT display would influence the population of occupants’ decision-making, a one-sample t-test hypothesis testing was conducted. One-sample t-test compares the mean of a sample to a known value to determine if the sample is significantly different from that value. In this study, occupants who changed their seats were coded as one, while those who did not were coded as zero. Utilizing a one-sample t-test a hypothesis simulation determined whether the population mean would exceed zero [37]. The results indicated a statistically significant difference between seat locations in rounds 1 and 2 (t = 8.6189, df = 26, p-value = 4.253 × 10⁻⁹), as the p-value is below 0.05. With a 95% confidence interval (0.56, 0.91), the statistical hypothesis testing simulation suggests that between 56% and 91% of occupants interacting with the OCDT display would change their seats.
Next, the effect of the OCDT display on occupants’ thermal perception (Q2), thermal satisfaction (Q3), their awareness of indoor microclimate (Q9–Q10), and its spatiotemporal characteristics (Q11–Q12) was investigated. Not only were exploratory data analyses (EDAs) employed, visualized in the form of bar charts in this paper, but statistical hypothesis testing was also utilized to examine the probability of the sample participants’ results representing a broader population. For the statistical hypothesis testing, one-tailed paired-sample t-tests (with null hypothesis Ho: Mean Difference (μd) ≤ 0 and alternative hypothesis Ha: μd > 0) were conducted to compare the sample means of round 1 and 2 survey responses for each of these four groups of questions. The purpose of conducting these tests was to determine whether there were statistically significant differences between the responses given in the first round of surveys compared to those given in the second round, within each of the four groups of questions.
Figure 10 illustrates the shift in occupants’ thermal perception across both rounds following their seat changes subsequent to exposure to the OCDT (Figure 10). In round 2, a higher number of responses were concentrated around ‘Neutral (0)’, which is generally regarded as a comfortable level. Regarding the results of the one-tailed paired-sample t-test comparing the occupants’ thermal perception in two rounds, a p-value of 0.09654 suggests that there is not a statistically significant difference between the thermal perceptions of occupants in the two rounds (t = 1.7242, df = 26, p-value = 0.09654). The 95% confidence interval of (−0.09, 1.05) indicates the range within which the true mean difference between the two rounds is likely to fall for the broader population. This result appears reasonable considering individual differences and thermal preferences among occupants. Despite the experiment taking place in summer and participants generally choosing cooler areas, some still preferred warmer locations. This diversity in preferences may contribute to the lack of a significant difference in thermal perception between rounds.
Figure 11 shows the variation in occupants’ thermal satisfaction across both rounds after their seat changes, following exposure to the OCDT (Figure 11). In round 1, responses spanning various levels of thermal satisfaction were observed. However, in round 2, following occupants’ decisions to change their seats based on the visualized information from the OCDT, it was noticed that no responses fell within the lower satisfaction levels. Instead, all responses in round 2 were above the rating of five out of seven, the ‘very satisfied’ level. This suggests a considerable increase in thermal satisfaction among the sampled occupants in the second round. To ascertain the generalizability of these findings to a wider population, statistical hypothesis testing was conducted. The results of one-tailed paired-sample t-tests revealed a statistically significant difference between rounds 1 and 2 (t = −5.1066, df = 26, p-value = 1.269 × 10⁻⁵), as the p-value of 1.269 × 10⁻⁵ is below the threshold of 0.05. The satisfaction level in the second round was found to be at least 0.64 higher than in the first, with a 95% confidence interval. Hence, the statistical analysis provides confidence in the reliability of the observed increase in satisfaction levels among occupants.
Regarding occupants’ awareness of indoor microclimate phenomena and its spatiotemporal characteristics, only 8 out of 27 participants were initially aware of the phenomenon before exposure to the visualized information from the OCDT. Among these eight participants, only six were aware of its spatiotemporal characteristics. However, in round 2, after exposure to real-time and historical data visualization from the OCDT, 23 out of 27 participants reported that the OCDT fully enhanced their awareness and perception of the live indoor microclimate of their occupied space, including its spatiotemporal characteristics (Figure 12). To extend the results to a broader population, statistical hypothesis testing was employed. One-tailed paired-sample t-tests were conducted. In these tests, occupants who responded ‘yes’ to the awareness questions were coded as one, while those who did not were coded as zero. The means of occupants’ responses were compared before and after exposure to the OCDT. The results showed statistically significant differences in occupants’ awareness of indoor microclimates (t = −7.2837, df = 26, p-value = 4.902 × 10⁻⁸) and their awareness of spatiotemporal characteristics (t = −7.4339, df = 26, p-value = 3.404 × 10⁻⁸) following interaction with the OCDT display. The 95% confidence intervals for occupants’ awareness were (-Inf, −0.5020436) and (-Inf, −0.5194166) for indoor microclimates and spatiotemporal characteristics, respectively. Since none of these confidence intervals encompass zero, it implies that exposure to the OCDT display likely led to a notable increase in awareness scores for both indoor microclimates and spatiotemporal characteristics among the broader population of occupants, with a high level of confidence.
In Q4–Q5, qualitative data regarding the sources of thermal dissatisfaction among participants were collected, comparing responses from both rounds. In round 1 Q4 responses, five participants noted “Temperature too hot/cold”, while five participants flagged “Air movement too low” at their initially selected seats. These numbers changed in the second round after participants were introduced to and interacted with the OCDT display. In the second round, the overall number of temperature dissatisfaction responses for Q4–Q5 decreased to zero; no participants expressed dissatisfaction with temperature. However, four participant responses highlighted dissatisfaction with air movement being too low.
The study aimed to minimize the influence of activity levels on thermal comfort perceptions [30]. In Q6, participants’ activity levels before completing the questionnaire were addressed to ensure sufficient relaxation time within the allocated 25 to 30 min before each round. These measures were taken to ensure the reliability and validity of feedback responses, particularly regarding thermal comfort questions. Among 27 participants, 10 indicated “Seated Quiet”, 8 reported “Standing Relaxed”, and 5 stated “Light Activity, Standing”, with consistent responses across both rounds. Notably, no participants reported high activity levels, confirming optimal conditions for reliable feedback collection on thermal comfort regarding activity.
As with Q1, one-sample one-tailed t-tests were employed to analyze the results of Q7 and Q8. The results indicated that the OCDT display significantly helped at least 83% of occupants find a seating location that is more thermally comfortable for them (t = 18.028, df = 26, p-value < 2.2 × 10⁻¹⁶, 95% confidence). Additionally, the animation presented on the OCDT display was found to be useful, with at least 71% of participants reporting that it helped them make decisions about where to sit in this space for the day (t = 11.802, df = 26, p-value = 3.028 × 10⁻¹², 95% confidence). At the end of the second round, Q13–Q15 asked participants to express their opinions about OCDT using a seven-point Likert scale. Participants generally indicated that providing visual information about indoor microclimates alongside the ability to select seats based on this information would increase their thermal comfort (Mean (M) = 6, Standard Deviation (SD) = 0.93). The mean response for Q13 falls within the 95 percent confidence interval of (5.66, 6.4). Participants also showed a positive inclination toward having the OCDT display in their normal workspaces (M = 6, SD = 0.60). The 95 percent confidence interval for question Q14 is (5.91, 6.38). Finally, the OCDT display received an overall high score (M = 6, SD = 1.01) from participants via Q15, with a 95 percent confidence interval of (5.19, 5.99).

3.2. User Experience Survey

Table 1 displays the analysis results of the UEQ survey, comprising six main scales with 26 items.
Mean values and 95 percent confidence intervals were calculated for each scale. A mean > 0.8 indicates a positive evaluation, values between −0.8 and 0.8 represent a neutral evaluation, and values < −0.8 signify a negative evaluation of the corresponding scale [58]. All six scales of the UEQ survey for the OCDT display received positive evaluations, with the maximum mean value of 1.77 for the perspicuity scale, and the minimum mean value of 0.97 for the novelty scale. Notably, one participant’s response was excluded from the analysis.
Figure 13 illustrates the measured scale means in comparison with existing benchmark values derived from a dataset containing data from 21,175 individuals across 468 studies involving various products (business software, web pages, web shops, social networks) [58]. When compared with the benchmark values, the OCDT display is evaluated as “Good” in terms of Attractiveness, Perspicuity, and Stimulation scales, and “Above Average” in terms of Efficiency, Dependability, and Novelty scales. Furthermore, an analysis of the distribution of answers per item revealed that the OCDT display is rated very positively for learnability (M = 2.1) and efficiency (M = 1.9), while receiving neutral ratings for novelty (M = 0.3) and predictability (M = 0.8) categories.

3.3. Open Feedback Interview

Participants’ open feedback was gathered about their experiences with and perceptions of the display. The following subsections offer categorized presentations of occupants’ thoughts, expressed in their own words, organized around common emerging themes.

3.3.1. Recognizing the Value of Visualizing Environmental Information

Generally, participants saw value in visualizing live environmental information to help with their decision-making and comfort. The following feedback from occupants is presented exactly as quoted. The number accompanying the letter ‘P’ indicates the participant number; for instance, P5 signifies that participant number 5 provided the quoted statement.
P5: “…actually really like it. So I suffer a lot from overheating really easily. So knowing where is the cooler spot [of] the room, especially in [an] older building like this, was actually very interesting to me. Because then I could be like oh well if that section [of the room] is gonna be hot, I’ll just learn to avoid it more often…”
P19: “…I think it’s helpful information that would help me to choose a workspace that would be comfortable…”

3.3.2. Desired Types of Information for Informed Occupancy Decisions

More than half of the participants stated that they want to be informed about different types of indoor environmental conditions to make comprehensive decisions about how they occupy the space. They emphasized that while temperature is a primary factor in their thermal comfort decisions, additional information about indoor daylighting, humidity, air movement, occupancy, or even social factors is necessary in the long term.
P19: “…but I do think it’s only like one factor that I considered. I don’t like cluster of people coming [occupancy level], so I’d like to be more free. So I have to really consider pros and cons like how crowded is it. Because I might prefer to be hot and free than cooler and more restricted. That would be ideal to see both temperature and volume of people …”
P11: “…[I] don’t know if you’re measuring the light levels. closing blinds or shades would change the temperature but it might make the light level less ideal. For me, I like natural light a lot…”
P24: “…so just kind of knowing like the air movement more, like what kind of work I’d be doing here. Just knowing more about the situation than just temperature…”

3.3.3. Critique of Specific Information Presentation on the OCDT

Five participants stated that some information displayed on the OCDT does not add value to the display, such as the graph showing absolute maximum and minimum temperature values. They emphasized that the statistical graph showing the difference between max and min values, in addition to the live thermal map, sufficiently conveys the indoor microclimate information.
P18: “…at first glance, I didn’t know what does this graph [the bottom statistical graph showing the absolute min and max values of temperature] represents. After you described I understood. But not sure what it adds [to UI]. That one [the top statistical graph showing differences between min and max] is really good….”

4. Discussion

Digital twins of buildings serve as a source of live operational information, primarily utilized by building managers to inform data-driven decisions. However, as argued, this approach leaves occupants, the main end-users of buildings, out of the decision-making loop. In order to explore opportunities for occupant-centric building operation decisions, the concept of an occupant-centric digital twin (OCDT) was developed and tested in this research. In this paper, OCDT refers to a user interface designed specifically for occupants, providing live operational information to inform their decision-making on how they occupy the space. The initial prototype focuses on indoor temperature management to enhance occupants’ thermal comfort, a crucial aspect that requires the direct involvement of occupants in data-driven decisions. As discussed earlier, building occupants can have different thermal perceptions and preferences due to their individual differences [31]. However, due to the indoor microclimate phenomenon, a space can also have varying temperatures in its different locations at any time. Therefore, occupants were provided with live information on the indoor microclimate and its spatiotemporal characteristics through the OCDT display. The system demonstrated that multiple IoT sensors are effective at capturing live indoor microclimate data, and the captured data can be visualized in the form of a dynamic thermal map in a UI specifically dedicated to occupants. Occupants could interact with the OCDT display to familiarize themselves with the temperature differentials within the space and how they alter throughout a specific time.
Additionally, there appears to be a positive effect among occupants for this approach. Based on qualitative interview results, participants generally expressed a positive attitude toward their interaction with the digital twin display. However, the user interface designed for the OCDT display has room for further improvements in interactions with users, as mentioned by a few participants (Section 3.3). This approach requires no intervention from FMs to be effective—it is entirely about the agency of individuals to choose their seat—hence, it can augment existing organizational strategies without the need for integration. The OCDT display is scalable to different types of buildings, including office buildings, conference rooms, factory workplaces, commercial buildings, libraries, K–12 schools, or any other types of shared spaces. For example, in conference rooms with collective users, the fast and effective inclusion of users in temperature decision-making processes via an occupant-centric digital twin would be of high potential. Collective users can have different thermal preferences, diverse clothing, and dissimilar activity levels, which also change throughout the year. As another example, in school classrooms, users can have different thermal satisfaction, clothing, or activity levels throughout the year, and the occupants themselves change each semester. Thus, past semesters’ occupants’ preferred temperature data for HVAC control systems cannot be used to realistically predict the future semesters’ completely new occupants’ temperature preferences. This aligns with previous studies’ findings regarding the importance of real-time data in occupant feedback [59] and decision-making processes [60].
Results from user thermal perception surveys administered before and after an introduction to the OCDT display supported this paper’s preliminary assumptions. They also demonstrated a significant effect of visualized indoor microclimate information through the OCDT display on participants’ decisions about how to occupy the space; 20 out of 27 people changed their chosen seating location after being provided with access to the OCDT display. Hypothesis testing results also showed that with 95 percent confidence, 56 to 91 percent of occupants who interacted with the OCDT display would change their seats. These results emphasize that to meet occupants’ temperature preferences in shared spaces, an important step before directly collecting occupants’ feedback data for temperature adjustments is to inform them about the diverse conditions of their surrounding environment. This approach aligns with the strategy of making data available to office inhabitants, as described by New et al. [61].
The findings of this study did not reveal a significant effect of the change in location affected by the information in the OCDT display on occupants’ thermal perception. One possible explanation for this is the individual differences in perception and preferences relating to thermal comfort among users. For example, some occupants selected a warmer area while others had the opposite preference. Even though the study was conducted in the summer season, it cannot be concluded that the thermal information displayed on the OCDT would necessarily increase or decrease how occupants perceive the temperature in the space. This result confirms the challenges associated with meeting collective thermal comfort in shared spaces due to the subjective aspect of individual thermal perception, which is the primary discussion of this paper and is supported by previous studies [62,63].
Moreover, the findings identified a significant effect of visualized live information via the OCDT display on occupants’ thermal satisfaction. Satisfaction levels among occupants reliably increased in the second round, consistent with this paper’s main hypothesis. By displaying information to occupants and empowering them to make an informed selection about their desired seating location, their thermal satisfaction increased by at least 0.64 with 95 percent confidence. Similarly, positive and significant effects of the OCDT display were found on occupants’ awareness of the indoor microclimate phenomenon and its spatiotemporal characteristics. Taking all these results into consideration, the OCDT display can offer valuable managerial insights into flexible thermal comfort strategies in shared workspaces, such as ‘hot desking’. ‘Hot desking’ is an inclusion policy widely accepted as a practice of allocating desks to workers as required or on a rotation, rather than assigning each worker their desk [61]. ‘Hot desking’ offers various visual attributes to occupants through different seating options, which has been demonstrated to significantly influence how they utilize and navigate the workspace [64]. Consequently, the selection of a seat becomes a crucial decision that influences occupants’ behavior in the office space, highlighting the need for a mindful choice rather than a blind decision. The live microclimate information provided through the OCDT display serves as a grounding factor in informing occupants and implementing these managerial-level implications and policies in the real world.
For future research directions, this paper’s ongoing investigation will progress beyond the pilot phase, which presently concentrates solely on real-time temperature distribution data within the OCDT display. Subsequent phases will enrich the OCDT by integrating a wider array of data types, including live occupant feedback encompassing real-time thermal satisfaction and thermal perception feedback spatially visualized in the format of a 2D live thermal feedback map. While the current experiment focuses on individual thermal comfort, it is recognized that workplace comfort is a collective concern. These expanded studies will engage a larger participant pool, diverse occupant demographics encompassing various age groups and demographic factors, and real-world tasks to assess the effectiveness of the OCDT approach on a collective scale. The aim is to explore how the OCDT display influences interactions, communications, and social dynamics among co-occupants, crucial in making collective decisions regarding thermal comfort. Furthermore, future plans involve conducting experiments in diverse workspace locations to evaluate the scalability of the proposed workflow across different shared workspaces. Future considerations may include developing the OCDT for personal devices based on occupant feedback, though the current focus is on content development. Additionally, given the extensive IoT data collected in this research, another future consideration is incorporating AI technology [65,66] to provide predictive recommendations for occupants, offering suggestions and information about the energy consequences of their interactions with the environment.

5. Conclusions

This paper aimed to engage occupants in data-driven decision-making concerning their thermal comfort. At this stage of the ongoing research, the focus was on occupants’ temperature-oriented preferences as the primary determinant of their thermal comfort. Occupants were provided with a platform to discover existing microclimates in indoor spaces that align with their thermal preferences. To achieve this, the OCDT display was proposed, which integrates accurate and reliable data collected through IoT sensors with real-time data modeling. This combination creates a thermal map of microclimates and a live UI to convey this information to occupants. Through an occupant study involving 27 participants in two rounds, it was explored how the OCDT display influences occupants’ choices in occupying open-plan workspaces to match individual thermal preferences. The occupant study found that participants’ thermal satisfaction increased in the second round due to informed seating decisions, driven by their awareness of live indoor temperature information through OCDT. Numerically, the second-round satisfaction ratings were at least 0.64 higher, with a 95% confidence interval. Many participants expressed a desire for additional live information, such as indoor humidity, daylighting, and air movement, to further enhance their decision-making process. Furthermore, future papers will delve into the sociotechnical aspect of thermal comfort in shared workspaces.

Author Contributions

Conceptualization, S.S., A.O.S. and D.B.; methodology, S.S., A.O.S. and D.B.; software, S.S.; validation, S.S., A.O.S. and D.B.; formal analysis, S.S., A.O.S. and D.B.; investigation, S.S., A.O.S. and D.B.; resources, S.S., A.O.S. and D.B.; data curation, S.S.; writing—original draft preparation, S.S.; writing—review and editing, S.S., A.O.S. and D.B.; visualization, S.S., A.O.S. and D.B.; supervision, S.S., A.O.S. and D.B.; project administration, S.S., A.O.S. and D.B. All authors have read and agreed to the published version of the manuscript.

Funding

This research received no external funding.

Institutional Review Board Statement

The study was conducted in accordance with the Declaration of Helsinki and approved by the Institutional Review Board (or Ethics Committee) of Carnegie Mellon University (protocol code, STUDY2022_00000227 and date of approval, 28 June 2022).

Informed Consent Statement

Informed consent was obtained from all subjects involved in the study.

Data Availability Statement

The raw data supporting the conclusions of this article will be made available by the authors on request.

Acknowledgments

The authors express their appreciation to the School of Architecture at Carnegie Mellon University for providing funding for this research project. Additionally, the authors would like to acknowledge the support from the Office of Graduate and Postdoctoral Affairs at Carnegie Mellon University, specifically through the Graduate Small Project Help (GuSH) Research Grant, which contributed to the experimental phase of this research project.

Conflicts of Interest

The authors declare no conflicts of interest.

Appendix A

Table A1 presents a list of abbreviations used in this paper.
Table A1. Abbreviations List.
AbbreviationMeaning
APIapplication programming interface
BIMbuilding information modeling
EDAexploratory data analysis
FMfacility management
FMsfacility managers
HVACheating, ventilation, and air conditioning
IRBinstitutional review board
IoTInternet of Things
Mmean
μDmean difference
OCDToccupant-centric digital twin
O&Moperations and maintenance
QRquick response
SDstandard deviation
UEQuser experience questionnaire
UIuser interface

Appendix B

Table A2 is the table displaying the user perception survey questions.
Table A2. User perception survey.
User Perception Survey QuestionnaireAnswer Choices
Q1: Which seat are you occupying right now? Write the seat number.
Q2: How do you feel at this moment in terms of temperature?
(a)
Hot (+3),
(b)
Warm (+2),
(c)
Slightly Warm (+1),
(d)
Neutral (0),
(e)
Slightly Cool (−1),
(f)
Cool (−2),
(g)
Cold (−3)
Q3: How satisfied are you with the temperature of the area you are in within the space?Very Dissatisfied □□□□□□□ Very Satisfied
Q4: If you are NOT satisfied, how would you best describe the source of your discomfort? (Check all that apply)
(a)
Temperature too hot/cold,
(b)
Humidity too high/low,
(c)
Air movement too high/low,
(d)
Incoming sun,
(e)
Hot/Cold surrounding surfaces (floor, ceiling, walls, or windows),
(f)
Heat from office equipment, other.
Q5: If you are NOT satisfied, which of the following would you adjust or control in this room to increase your thermal satisfaction? (Check any that apply)
(a)
Window blinds or shades,
(b)
Thermostat,
(c)
Portable heater,
(d)
Room air-conditioning unit,
(e)
Portable fan,
(f)
Opening/closing Windows, other.
Q6: How would you describe your activity level just before completing this survey?
(a)
Reclining,
(b)
Seated Quiet,
(c)
Standing Relaxed,
(d)
Light Activity, Standing,
(e)
Medium Activity, Standing,
(f)
High Activity, other.
Q7: Did the display help you find a seating location that was more comfortable for you?
(a)
Yes,
(b)
No
Q8: Did the animation help you make informed deicides about where you would like to sit in this space for the rest of the day if you had to occupy this space for a long time?
(a)
Yes,
(b)
No
Q9: Before this study, were you aware of the indoor microclimate phenomenon?
(a)
Yes,
(b)
No
Q10: Did the display of a real-time map make you fully understand/perceive the indoor microclimate in this space right now?
(a)
Yes,
(b)
No
Q11: Before this study, were you aware of the spatiotemporal aspect of the indoor microclimate phenomenon?
(a)
Yes,
(b)
No
Q12: Did the animation make you fully understand/perceive the spatiotemporal aspect of indoor microclimate throughout the day?
(a)
Yes,
(b)
No
Q13: Do you think providing information about indoor microclimate within a space, and giving the ability to select seats based on that, would increase your thermal comfort? It would not increase at all □□□□□□□ It would increase
Q14: Would you like to have this display be developed for spaces you occupy in your normal life, and displayed to you when you enter those spaces? I would not like it at all □□□□□□□ I would like
Q15: If review the display with a score out of 7, what score would you give?1 □□□□□□□ 7

References

  1. Adegbenro, A.; Short, M.; Angione, C. An integrated approach to adaptive control and supervisory optimisation of hvac control systems for demand response applications. Energies 2021, 14, 2078. [Google Scholar] [CrossRef]
  2. Marocco, M.; Garofolo, I. Integrating disruptive technologies with facilities management: A literature review and future research directions. Autom. Constr. 2021, 131, 103917. [Google Scholar] [CrossRef]
  3. Almasri, R.A.; Alshitawi, M.S. Electricity consumption indicators and energy efficiency in residential buildings in GCC countries: Extensive review. Energy Build. 2022, 255, 111664. [Google Scholar] [CrossRef]
  4. Atmaca, N.; Atmaca, A.; Özçetin, A.İ. The impacts of restoration and reconstruction of a heritage building on life cycle energy consumption and related carbon dioxide emissions. Energy Build. 2021, 253, 111507. [Google Scholar] [CrossRef]
  5. Singh, J.; Singh, G.; Muskan; Aggarwal, G. Inclusion of aerial computing in internet of things: Prospects and applications. In Proceedings of the 2022 Third International Conference on Intelligent Computing Instrumentation and Control Technologies (ICICICT), Kannur, India, 11–12 August 2022; pp. 1664–1669. [Google Scholar] [CrossRef]
  6. Paul, S.; Naik, B.; Bagal, D.K. Enabling technologies of IoT and challenges in various field of construction industry in the 5G era: A review. IOP Conf. Ser. Mater. Sci. Eng. 2020, 970, 12019. [Google Scholar] [CrossRef]
  7. Mannino, A.; Dejaco, M.C.; Re Cecconi, F. Building information modelling and internet of things integration for facility management—Literature review and future needs. Appl. Sci. 2021, 11, 3062. [Google Scholar] [CrossRef]
  8. Pan, Y.; Zhang, L. A BIM-data mining integrated digital twin framework for advanced project management. Autom. Constr. 2021, 124, 103564. [Google Scholar] [CrossRef]
  9. Bashir, M.R.; Gill, A.Q. Towards an IoT big data analytics framework: Smart buildings systems. In Proceedings of the 2016 IEEE 18th International Conference on High Performance Computing and Communications; IEEE 14th International Conference on Smart City; IEEE 2nd International Conference on Data Science and Systems (HPCC/SmartCity/DSS), Sydney, NSW, Australia, 12–14 December 2016; pp. 1325–1332. [Google Scholar] [CrossRef]
  10. Katal, A.; Wazid, M.; Goudar, R.H. Big data: Issues, challenges, tools and good practices. In Proceedings of the 2013 Sixth International Conference on Contemporary Computing (IC3), Noida, India, 8–10 August 2013; pp. 404–409. [Google Scholar] [CrossRef]
  11. Hong, T.; Kim, J.; Lee, M. Integrated task performance score for the building occupants based on the CO2 concentration and indoor climate factors changes. Appl. Energy 2018, 228, 1707–1713. [Google Scholar] [CrossRef]
  12. Finnigan, S.M.; Clear, A.K. ‘No powers, man!’: A Student Perspective on Designing University Smart Building Interactions. In Proceedings of the 2020 CHI Conference on Human Factors in Computing Systems, Honolulu, HI, USA, 25–30 April 2020; pp. 1–14. [Google Scholar] [CrossRef]
  13. Al-Ali, A.R.; Gupta, R.; Batool, T.Z.; Landolsi, T.; Aloul, F.; Al Nabulsi, A. Digital twin conceptual model within the context of internet of things. Future Internet 2020, 12, 163. [Google Scholar] [CrossRef]
  14. El Marai, O.; Taleb, T.; Song, J. Roads infrastructure digital twin: A step toward smarter cities realization. IEEE Netw. 2020, 35, 136–143. [Google Scholar] [CrossRef]
  15. Fathy, Y.; Jaber, M.; Nadeem, Z. Digital twin-driven decision making and planning for energy consumption. J. Sens. Actuator Netw. 2021, 10, 37. [Google Scholar] [CrossRef]
  16. Lu, V.Q.; Parlikad, A.K.; Woodall, P.; Ranasinghe, G.D.; Heaton, J. Developing a dynamic digital twin at a building level: Using Cambridge campus as case study. In International Conference on Smart Infrastructure and Construction 2019 (ICSIC) Driving Data-Informed Decision-Making; ICE Publishing: Leeds, UK, 2019; pp. 67–75. [Google Scholar] [CrossRef]
  17. Lu, Q.; Parlikad, A.K.; Woodall, P.; Don Ranasinghe, G.; Xie, X.; Liang, Z.; Konstantinou, E.; Heaton, J.; Schooling, J. Developing a digital twin at building and city levels: Case study of West Cambridge campus. J. Manag. Eng. 2020, 36, 5020004. [Google Scholar] [CrossRef]
  18. Grieves, M.W. Virtually Intelligent Product Systems: Digital and Physical Twins; American Institute of Aeronautics and Astronautics: Reston, VA, USA, 2019. [Google Scholar]
  19. Khajavi, S.H.; Motlagh, N.H.; Jaribion, A.; Werner, L.C.; Holmstrom, J. Digital Twin: Vision, benefits, boundaries, and creation for buildings. IEEE Access 2019, 7, 147406–147419. [Google Scholar] [CrossRef]
  20. Dublon, G.; Pardue, L.S.; Mayton, B.; Swartz, N.; Joliat, N.; Hurst, P.; Paradiso, J.A. Doppellab: Tools for exploring and harnessing multimodal sensor network data. In Proceedings of the SENSORS, 2011 IEEE, Limerick, Ireland, 28–31 October 2011; pp. 1612–1615. [Google Scholar] [CrossRef]
  21. Huynh, D.; Nguyen-Ky, S. Engaging building automation data visualisation using building information modelling and progressive web application. Open Eng. 2020, 10, 434–442. [Google Scholar] [CrossRef]
  22. Saadatifar, S.; Surapaneni, A.; Lee, K.; VanderSluis, B.; Williams, J.G. Visualizing Automated HVAC Performance Analysis on Floor Plans for Meaningful Insights. ASHRAE Trans. 2023, 129, 25–33. [Google Scholar]
  23. Hosamo, H.H.; Svennevig, P.R.; Svidt, K.; Han, D.; Nielsen, H.K. A Digital Twin predictive maintenance framework of air handling units based on automatic fault detection and diagnostics. Energy Build. 2022, 261, 111988. [Google Scholar] [CrossRef]
  24. Hosamo, H.H.; Nielsen, H.K.; Kraniotis, D.; Svennevig, P.R.; Svidt, K. Improving building occupant comfort through a digital twin approach: A Bayesian network model and predictive maintenance method. Energy Build. 2023, 288, 112992. [Google Scholar] [CrossRef]
  25. Peng, Y.; Zhang, M.; Yu, F.; Xu, J.; Gao, S. Digital twin hospital buildings: An exemplary case study through continuous lifecycle integration. Adv. Civ. Eng. 2020, 2020, 8846667. [Google Scholar] [CrossRef]
  26. Shahinmoghadam, M.; Natephra, W.; Motamedi, A. BIM- and IoT-based virtual reality tool for real-time thermal comfort assessment in building enclosures. Build. Environ. 2021, 199, 107905. [Google Scholar] [CrossRef]
  27. Parkinson, T.; Parkinson, A.; de Dear, R. Introducing the SAMBA indoor environmental quality monitoring system. In Proceedings of the 49th International Conference of the Architectural Science Association, Melbourne, VIC, Australia, 2–4 December 2015; pp. 1139–1148. [Google Scholar]
  28. Tagliabue, L.C.; Cecconi, F.R.; Maltese, S.; Rinaldi, S.; Ciribini, A.L.C.; Flammini, A. Leveraging digital twin for sustainability assessment of an educational building. Sustainability 2021, 13, 480. [Google Scholar] [CrossRef]
  29. Gray, F.M.; Dibowski, H.; Gall, J.; Braun, S. Occupant Feedback and Context Awareness: On the Application of Building Information Modeling and Semantic Technologies for Improved Complaint Management in Commercial Buildings. In Proceedings of the 2020 25th IEEE International Conference on Emerging Technologies and Factory Automation (ETFA), Vienna, Austria, 8–11 September 2020; Volume 2020, pp. 101–108. [Google Scholar] [CrossRef]
  30. HSE. “The Six Basic Factors”, HSE Health and Safety Executive. 2021. Available online: https://www.hse.gov.uk/temperature/thermal/factors.htm (accessed on 24 October 2021).
  31. Park, J.; Loftness, V.; Aziz, A. Post-occupancy evaluation and IEQ measurements from 64 office buildings: Critical factors and thresholds for user satisfaction on thermal quality. Buildings 2018, 8, 156. [Google Scholar] [CrossRef]
  32. Papadopoulos, S.; Kontokosta, C.E.; Vlachokostas, A.; Azar, E. Rethinking HVAC temperature setpoints in commercial buildings: The potential for zero-cost energy savings and comfort improvement in different climates. Build. Environ. 2019, 155, 350–359. [Google Scholar] [CrossRef]
  33. Liu, X.; Lee, S.; Bilionis, I.; Karava, P.; Joe, J.; Sadeghi, S.A. A user-interactive system for smart thermal environment control in office buildings. Appl. Energy 2021, 298, 117005. [Google Scholar] [CrossRef]
  34. Foster, D.; Lawson, S.; Wardman, J.; Blythe, M.; Linehan, C. ‘Watts in it for me?’ design implications for implementing effective energy interventions in organisations. In Proceedings of the SIGCHI Conference on Human Factors in Computing Systems, Austin, TX, USA, 5–10 May 2012; pp. 2357–2366. [Google Scholar] [CrossRef]
  35. Avdikos, V.; Merkel, J. Supporting open, shared and collaborative workspaces and hubs: Recent transformations and policy implications. Urban Res. Pract. 2020, 13, 348–357. [Google Scholar] [CrossRef]
  36. Saadatifar, S.; Sawyer, A.O.; Byrne, D.J.; Zhang, Y. Balancing Thermal Comfort with Energy Consumption in Buildings Using Digital Twins, IoT Sensors, and Real-time Dashboards to Inform Occupant Decision Making. ASHRAE Trans. 2023, 129, 720–729. [Google Scholar]
  37. YoLink. Temperature & Humidity Sensor. 2022. Available online: https://www.yosmart.com/product/temperature-humidity-sensor.html (accessed on 31 July 2022).
  38. Integromat. Educational Consultant. ID Analyzer Integration Using APIs. 2021. Available online: https://www.lessons24x7.com/usage/id-analyzer-integration-using-apis-integromat/ (accessed on 31 July 2022).
  39. Integromat Expert. Integromat HTTP Module. 2020. Available online: https://www.lessons24x7.com/usage/integromat-http-module/ (accessed on 31 July 2022).
  40. Plotly. Low-Code Data Apps. 2022. Available online: https://plotly.com/ (accessed on 31 July 2022).
  41. Mueller, J.P.; Massaron, L. What is Google Colaboratory? 2019. Available online: https://www.dummies.com/article/technology/programming-web-design/python/what-is-google-colaboratory-262675/ (accessed on 31 July 2022).
  42. Mujan, I.; Licina, D.; Kljajić, M.; Čulić, A.; Anđelković, A.S. Development of indoor environmental quality index using a low-cost monitoring platform. J. Clean. Prod. 2021, 312, 127846. [Google Scholar] [CrossRef]
  43. Alavi, H.S.; Churchill, E.F.; Wiberg, M.; Lalanne, D.; Dalsgaard, P.; Schieck, A.F.G.; Rogers, Y. Introduction to human-building interaction (hbi) interfacing hci with architecture and urban design. ACM Trans. Comput. Hum. Interact. TOCHI 2019, 26, 1–10. [Google Scholar] [CrossRef]
  44. Lei, W.; Fan, M.; Thang, J. ‘I Shake The Package To Check If It’s Mine’ A Study of Package Fetching Practices and Challenges of Blind and Low Vision People in China. In Proceedings of the 2022 CHI Conference on Human Factors in Computing Systems, New Orleans, LA, USA, 29 April–5 May 2022; pp. 1–15. [Google Scholar] [CrossRef]
  45. Günther, S.; Rasch, J.; Schön, D.; Müller, F.; Schmitz, M.; Riemann, J.; Matviienko, A.; Mühlhäuser, M. Smooth as steel wool: Effects of visual stimuli on the haptic perception of roughness in virtual reality. In Proceedings of the 2022 CHI Conference on Human Factors in Computing Systems, New Orleans, LA, USA, 29 April–5 May 2022; pp. 1–17. [Google Scholar] [CrossRef]
  46. Work Green Program. Thermal Comfort Verification Survey. Georgia Institute of Technology. 2004. Available online: https://sustain.gatech.edu/sites/default/files/documents/thermal-comfort-survey.pdf (accessed on 6 September 2022).
  47. LEEDuser. Sample Thermal Comfort Survey. BuildingGreen. 2015. Available online: https://view.officeapps.live.com/op/view.aspx?src=https%3A%2F%2Fleeduser.buildinggreen.com%2Fsites%2Fdefault%2Ffiles%2Fcredit_documentation%2FSample%2520Thermal%2520Comfort%2520Survey_schools.doc&wdOrigin=BROWSELINK (accessed on 6 September 2022).
  48. Colley, M.; Bajrovic, E.; Rukzio, E. Effects of pedestrian behavior, time pressure, and repeated exposure on crossing decisions in front of automated vehicles equipped with external communication. In Proceedings of the 2022 CHI Conference on Human Factors in Computing Systems, New Orleans, LA, USA, 29 April–5 May 2022; pp. 1–11. [Google Scholar] [CrossRef]
  49. Hinderks, A.; Schrepp, M.; Thomaschewski, J. User Experience Questionnaire. UEQ Team. 2022. Available online: https://www.ueq-online.org/ (accessed on 6 September 2022).
  50. Schrepp, M. User Experience Questionnaire Handbook Version 8. No. September 2015. 2019, pp. 1–15. Available online: https://www.res.net/publication/303880829_User_Experience_Questionnaire_Handbook_Version_2 (accessed on 2 February 2017).
  51. Rodriguez, F.S.; Saleem, K.; Spilski, J.; Lachmann, T. Performance differences between instructions on paper vs digital glasses for a simple assembly task. Appl. Ergon. 2021, 94, 103423. [Google Scholar] [CrossRef]
  52. Marcus, A. Design, User Experience, and Usability: Theories, Methods, and Tools for Designing the User Experience. In Proceedings of the Third International Conference, DUXU 2014, Held as Part of the HCI International 2014, Heraklion, Crete, Greece, 22–27 June 2014; Proceedings, Part I. Springer: Berlin/Heidelberg, Germany, 2014; Volume 8517. [Google Scholar]
  53. Google. Google Forms: Online Form Creator|Google Workspace. Google. 2022. Available online: https://www.google.com/forms/about/ (accessed on 6 September 2022).
  54. QR Code Generator. QR.io. QR Code Generator. 2022. Available online: https://qr.io/ (accessed on 6 September 2022).
  55. JMP. The One-Sample t-Test. JMP Statistical Discovery LLC. 2022. Available online: https://www.jmp.com/en_us/statistics-knowledge-portal/t-test/one-sample-t-test.html (accessed on 6 September 2022).
  56. Dunn, N.J.; Dingus, T.A.; Soccolich, S.; Horrey, W.J. Investigating the impact of driving automation systems on distracted driving behaviors. Accid. Anal. Prev. 2021, 156, 106152. [Google Scholar] [CrossRef]
  57. Miro. The Visual Collaboration Platform for Every Team|Miro. Miro. 2022. Available online: https://miro.com (accessed on 6 September 2022).
  58. UEQ Team. Short_UEQ_Data_Analysis_Tool. UEQ Team. 2022. Available online: https://docs.google.com/spreadsheets/d/1y8fdIPWu2TEJ3rQzL93RO_ElNcUYXMT44e7f-cNmkZ8/edit#gid=406704170 (accessed on 6 September 2022).
  59. Yang, B.; Li, X.; Hou, Y.; Meier, A.; Cheng, X.; Choi, J.-H.; Wang, F.; Wang, H.; Wagner, A.; Yan, D.; et al. Non-invasive (non-contact) measurements of human thermal physiology signals and thermal comfort/discomfort poses—A review. Energy Build. 2020, 224, 110261. [Google Scholar] [CrossRef]
  60. Ghahramani, A.; Galicia, P.; Lehrer, D.; Varghese, Z.; Wang, Z.; Pandit, Y. Artificial intelligence for efficient thermal comfort systems: Requirements, current applications and future directions. Front. Built Environ. 2020, 6, 49. [Google Scholar] [CrossRef]
  61. New, K.; Gormally, A.; Friday, A.; Hazas, M. ‘We Can Send A Man To The Moon But We Can’t Control The Temperature In Our office’; A Considerate Approach To Workplace Thermal Comfort by Older Women. In Proceedings of the 2021 CHI Conference on Human Factors in Computing Systems, Yokohama, Japan, 8–13 May 2021; pp. 1–14. [Google Scholar] [CrossRef]
  62. Snow, S.; Auffenberg, F.; Schraefel, M.C. Log it while it’s hot: Designing human interaction with smart thermostats for shared work environments. In Proceedings of the 2017 CHI Conference on Human Factors in Computing Systems, Denver, CO, USA, 6–11 May 2017; pp. 1595–1606. [Google Scholar] [CrossRef]
  63. Clear, A.K.; Finnigan, S.M.; Olivier, P.; Comber, R. ThermoKiosk: Investigating roles for digital surveys of thermal experience in workplace comfort management. In Proceedings of the 2018 CHI Conference on Human Factors in Computing Systems, Montreal, QC, Canada, 21–26 April 2018; pp. 1–12. [Google Scholar] [CrossRef]
  64. Alavi, H.S.; Verma, H.; Mlynar, J.; Lalanne, D. The hide and seek of workspace: Towards human-centric sustainable architecture. In Proceedings of the 2018 CHI Conference on Human Factors in Computing Systems, Montreal, QC, Canada, 21–26 April 2018; pp. 1–12. [Google Scholar] [CrossRef]
  65. Al-Khazraji, H.; Nasser, A.R.; Hasan, A.M.; Al Mhdawi, A.K.; Al-Raweshidy, H.; Humaidi, A.J. Aircraft engines remaining useful life prediction based on a hybrid model of autoencoder and deep belief network. IEEE Access 2022, 10, 82156–82163. [Google Scholar] [CrossRef]
  66. Hadi, R.H.; Hady, H.N.; Hasan, A.M.; Al-Jodah, A.; Humaidi, A.J. Improved fault classification for predictive maintenance in industrial IoT based on AutoML: A case study of ball-bearing faults. Processes 2023, 11, 1507. [Google Scholar] [CrossRef]
Figure 1. Essential components of a building digital twin [19].
Architecture 04 00022 g001
Figure 2. Essential components of the digital twin in this study: (a) The physical building; (b) Its digital/virtual replica; (c) Temperature sensors as the connection between the two.
Architecture 04 00022 g002
Figure 3. Sensor distribution in case study location: (a) Sensor grid; (b) An example of sensor placement on a desk.
Architecture 04 00022 g003
Figure 4. Indoor microclimate visualization: (a) Live data thermal map; (b) Addition of “Play” and pause button, along with an interactive timeline for historical data animation purposes.
Architecture 04 00022 g004
Figure 5. Real-time analytical diagrams for OCDT display.
Architecture 04 00022 g005
Figure 6. OCDT display: (a) A screenshot of the live UI dashboard; (b) An occupant interacts with the display at the case study location.
Architecture 04 00022 g006
Figure 7. Case study location setup with the OCDT display, seat numbers, and QR codes.
Architecture 04 00022 g007
Figure 8. Different temperature distributions at five different times a day, on 11 August 2022.
Architecture 04 00022 g008
Figure 9. Influence of OCDT-displayed information on seating choices of sample occupants: (a) Round 2 seat-change percentages among all 27 participants; (b) Round 2 preferred seats among occupants who changed their seats.
Architecture 04 00022 g009
Figure 10. Thermal perception of sample occupants before and after their seat changes in round 2, prompted by exposure to the OCDT.
Architecture 04 00022 g010
Figure 11. Thermal satisfaction of sample occupants before and after their seat changes in round 2, prompted by exposure to the OCDT.
Architecture 04 00022 g011
Figure 12. Influence of OCDT-displayed info on occupants’ awareness of (a) Indoor microclimate phenomena; and (b) Its spatiotemporal characteristics.
Architecture 04 00022 g012
Figure 13. Measured scale means in comparison with the existing benchmark values.
Architecture 04 00022 g013
Table 1. Analysis results of the UEQ survey for its main six scales.
ScaleMeanConfidence IntervalComparison to BenchmarkInterpretation
Attractiveness1.601.241.97Good10% of results better, 75% of results worse
Perspicuity1.771.372.16Good10% of results better, 75% of results worse
Efficiency1.481.121.85Above Average25% of results better, 50% of results worse
Dependability1.411.131.68Above Average25% of results better, 50% of results worse
Stimulation1.381.091.66Good10% of results better, 75% of results worse
Novelty0.970.491.44Above Average25% of results better, 50% of results worse
Disclaimer/Publisher’s Note: The statements, opinions and data contained in all publications are solely those of the individual author(s) and contributor(s) and not of MDPI and/or the editor(s). MDPI and/or the editor(s) disclaim responsibility for any injury to people or property resulting from any ideas, methods, instructions or products referred to in the content.

