Abstract
The accurate monitoring and early warning of coal and rock dynamic disasters become challenging in complex geological environments. Mostly, the signal information contains interferences, which misguides the technician, and thus leads to inaccurate monitoring results. To reduce the influence of interference signals, the synchronous response of the acoustic emission (AE) and electromagnetic emission (EME) signals before the failure of coal specimens during uniaxial loading was investigated in this study. Additionally, the coupling relationship between M value, AE energy/AE ringing count per unit time, and the damage of coal is established, and the early warning index of AE and EME (R value) was computed and verified through the field investigations. The results show that a strong synchronization of the acoustoelectric signals occurs only after the specimen enters the strain strengthening area. The analysis of the obtained results showed that the M value of the AE-EME synchronous response signal represents a strong degree of damage occurring in the coal body, however, this is still subject to false alarms. In contrast, the analysis of the R value accurately helped in determining the damage evaluation, thus, it can be regarded as one of the precursors of the imminent failure of coal. With R > 1, the specimen is closed to the failure state, thereby dangerous regions are identified with a dense concentration of R > 1 events. The obtained R value index through on-site AE and EME monitoring corresponds closely with the stress distribution cloud map of the roadway. It is inferred that the anti-interference ability and the reliability of the R value index are stronger than the routine early warning indicators of the single-AE or EME energy.
1. Introduction
Coal and rock dynamic disasters has been among the most serious dynamic disasters widely reported in worldwide case studies, including China, and it usually results in severe destruction, economic losses, and occasional fatalities. Due to the increasing mining depth and intensity, the probability of coal and rock dynamic disaster occurrence significantly increases, ultimately threatening the safety of coal mine production in China [1]. Therefore, accurate monitoring and early warning of coal and rock dynamic disaster are of great significance to coal and rock dynamic disaster prevention and underground mine safety. At present, there exists two main prediction methods for coal and rock dynamic disasters, namely the use of conventional methods, such as drilling cuttings, stress, and deformation observation [2], and the applications of geophysical methods. Geophysical methods have been proved to be effective remote technologies, among which acoustic emission (AE) and electromagnetic emission (EME) are used as real-time methods. The geophysical monitoring methods have been widely practiced in earthquake prediction, rock mass structure stability monitoring, coal rock dynamic disaster monitoring and early warning, and other fields [3,4,5,6,7,8].
Experimental studies have shown that the AE and EME signals are representative of the fracture of the specimen [9]. The AE signal is an elastic wave caused by the rapid release of energy in the material. Although, in addition to significant efforts made, compared with the AE, the generation mechanism of the EME is relatively complex and still lacks an in-depth explanation. At present, the research on the mechanism of EME is mainly carried out from two aspects: the generation of electric charges and the movement of electric charges. Nitsan proposed that the electromagnetic radiation of coal and rock damage is caused by piezoelectric effect [10]. Alekseev et al. [11] studied the EME phenomenon before the occurrence of an earthquake and deduced that the dislocation slip occurred on both sides of the rock mass failure interface, resulting in triboelectric electrification and then the EME phenomenon. Furthermore, O’Keefe et al. [12] proposed a capacitor model, stating that with the onset of crack propagation, opposite charges are formed on both sides of the crack, similar to the capacitor structure. With further propagation of the crack, the charging and discharging of the capacitors result in the generation of EME. Frid et al. [13,14,15] proposed a surface oscillatory dipole model showing that the oscillatory dipoles generated by collective motion in the form of surface waves on both sides of the crack are the source of EME. Wang et al. [16] believed that the mechanism of EME generation is due to the non-uniform deformation of coal and rock mass, which causes its internal free charge-induced polarization and the variable-speed motion of charged particles.
In addition to the general findings on the explanation of EME generation, a number of efforts have been made worldwide on the precursor indicators of AE and EME for predicting rock burst hazards. Frid [17,18] measured the EME under various mining and geological conditions and used the EME pulse index to predict the coal-rock dynamic hazards risk in front of the working face; He et al. [19,20,21] used EME intensity, variation range, energy, and pulse indicators as early warning indicators of shock danger. Song et al. [22,23] constructed a time-frequency two-dimensional early warning method of EME for coal and rock dynamic disasters with successful field applications. Similarly, a rock burst warning index was proposed by Wang et al. [24] based on the main frequency entropy of AE.
The prediction of disaster risk through AE and EME becomes challenging because of the mining conditions and the respective interference of the signals. Numerous authors have made efforts in eliminating the influence of interference patterns through the synchronous monitoring of sound and electricity, according to the different generation mechanisms of AE and EME. The spectrum analysis and energy analysis of full-wave AE-EME data show that both acoustic emission and electromagnetic radiation have a significant positive correlation with stress drop, and the time-series distributions of the two are synchronized [25,26,27]. Wang et al. proposed the acoustic-electrical collaborative monitoring technology, which uses anomalous amplitudes of acoustic and electrical signals for the coal-rock dynamic disasters monitoring and prediction and comprehends the true integration and complementary advantages of AE and EME technologies [28].
Despite the above and some other important progress made in predictions and early warning of coal-rock dynamic disasters through AE and EME technologies, most of the precursor early warning indicators used in the current acoustic and electrical synchronous response typically include energy, pulse, and other dimensional indicators. Equally, it is quite challenging to unify the thresholds of mines and coal seams under different geological and mining conditions, and a unified dimensionless index for the fusion of AE and EME has not been established, and the early warning results are easily affected by interference. With the above motive, the uniaxial loading failure test is carried out on the samples of the mine with coal and rock dynamic disasters. For this purpose, real-time AE and EME signals were monitored synchronously and their signal characteristics and synchronization were analyzed. A unified dimensionless index of acoustic-electrical fusion was established and verification was made through field applications.
2. Materials and Methods
2.1. Materials and Specimens
In this paper, coal samples from Tashan coalmine in Datong, Shanxi, coal samples from Kuangou coalmine in Urumqi, Xinjiang and coal samples from Jinjia coalmine in Panjiang, Guizhou were selected for uniaxial compression failure acoustic and electrical experiments. Kuangou coalmine lies in seismically active region where number of rock burst accidents have been reported. The Tashan coalmine is proven for increased rock pressure occurrence, however, geologically stable coal seams have been reported. The Jinjia coal mine has high gas pressure and complex geological structure, and there is a risk of coal and rock dynamic disasters. The coal samples used were in accordance with the standards of International Society for Rock Mechanics (ISRM). The large pieces of raw coal were extracted from the borehole for sealing preservation. Samples with standard sizes of ϕ50 × 100 mm from a same large piece of coal were obtained after being cut, cored, and grounded. All of the flatness error of each end face for the sample was less than 0.02 mm.
2.2. Experimental Set-Up
The experimental system is mainly composed of an electromagnetic shielding system, a loading control system, an acoustic and electrical monitoring system, and a data acquisition system. The schematic diagram is shown in Figure 1.
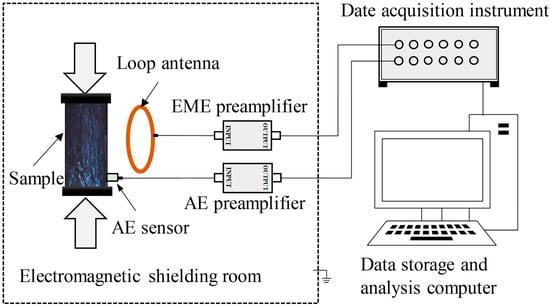
Figure 1.
The experimental system schematic diagram.
The electromagnetic shielding system adopts GP1A detachable electromagnetic shielding room. The shielding room is grounded as a whole with the loading control system and the acoustic and electrical monitoring system. The shielding effectiveness can be achieved as follows: 14 kHz ≥ 75 dB, 100 kHz ≥ 95 dB, 200 kHz ≥ 100 dB, and 50–103 MHz ≥ 110 dB.
The experiment was conducted by first carrying out the loading process through a YAW-600 microcomputer-controlled electro-hydraulic servo pressure testing machine. According to the standard parameters of the microcomputer-controlled machine for the current study, the maximum test force is 600 kN, the load resolution is 3 N, and the displacement resolution is 0.3 μm.
The acoustic and electrical monitoring system is mainly composed of a RS-2A acoustic emission sensor, a SAS-560 loop electromagnetic antenna, and a corresponding signal amplifier. The response frequencies are 50~400 kHz for the acoustic emission sensor and 20 Hz~2 MHz for the electromagnetic antenna. The amplification factors of acoustic emissions and electromagnetic signals are, respectively, set to 20 dB and 64 dB.
The system is mainly composed of high-speed data acquisition instrument and computer server for the data storage and analysis. The acquisition instrument is comprised of 12 data acquisition channels. The highest acquisition frequency is 10 MHz and the A/D conversion accuracy is 16-bits. The AE, EME, and load signals can be performed with the real-time full waveform analysis.
3. Experimental Results and Analysis
3.1. Stress-Deformation Characteristics of the Uniaxial Compression Damage Process of Coal Samples
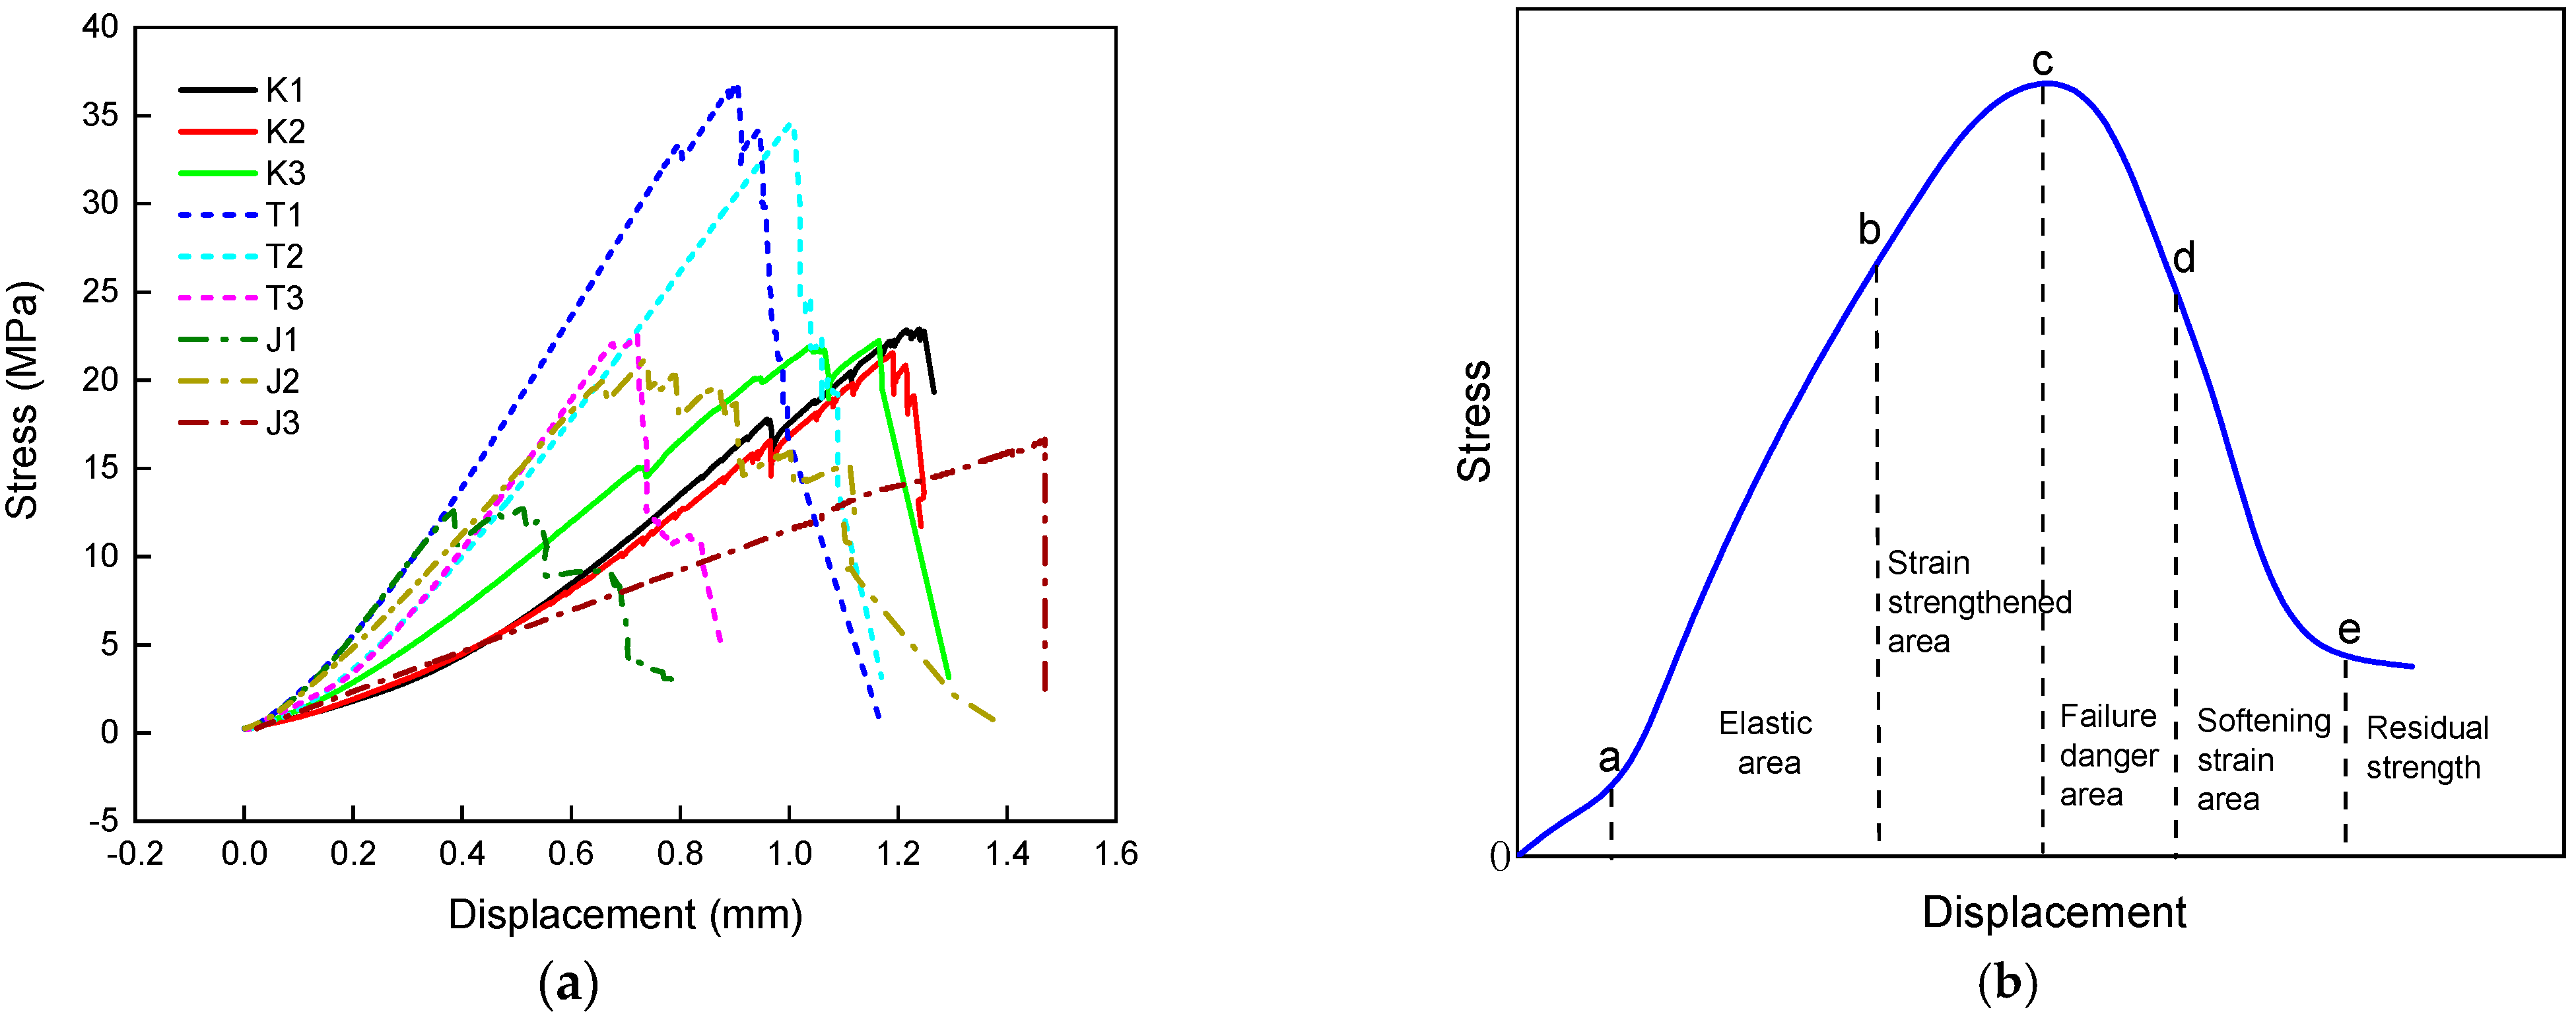
In this paper, three groups of coal samples from Wudong coal mine, Kuangou coal mine, and Jinjia coal mine are selected for research. Physical and mechanical parameters of coal samples are shown in Table 1. Three coal samples are selected from each of the three groups for analysis, and the stress–strain curve is shown in Figure 2a. During the loading failure of coal, the obtained stress–strain curve is shown in Figure 2b. The entire process is divided into elastic area, strain strengthening area, failure danger area, softening strain area, and residual strength that are based on the deformation and failure characteristics of the coal. During the loading process, it is deduced that the failure of the coal occurred in the post-stress peak stage. It is found that within the smaller region, the samples failure was comparatively more severe. It can be seen that after the stress peak of Kuangou coal sample and Tashan coal sample, the failure risk area is shorter, and the sample damage is more severe. After the stress peak of Jinjia coal sample, the failure risk area is longer and the sample damage is more moderate.

Table 1.
Basic physical and mechanical parameters of the coal samples.
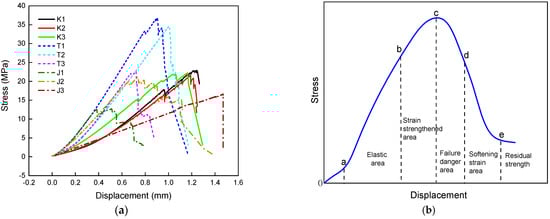
Figure 2.
Stress–strain curves (a) of different coal samples and schematic stress–strain curves (b).
3.2. AE and EME Response of Coal Samples during Uniaxial Compression Failure
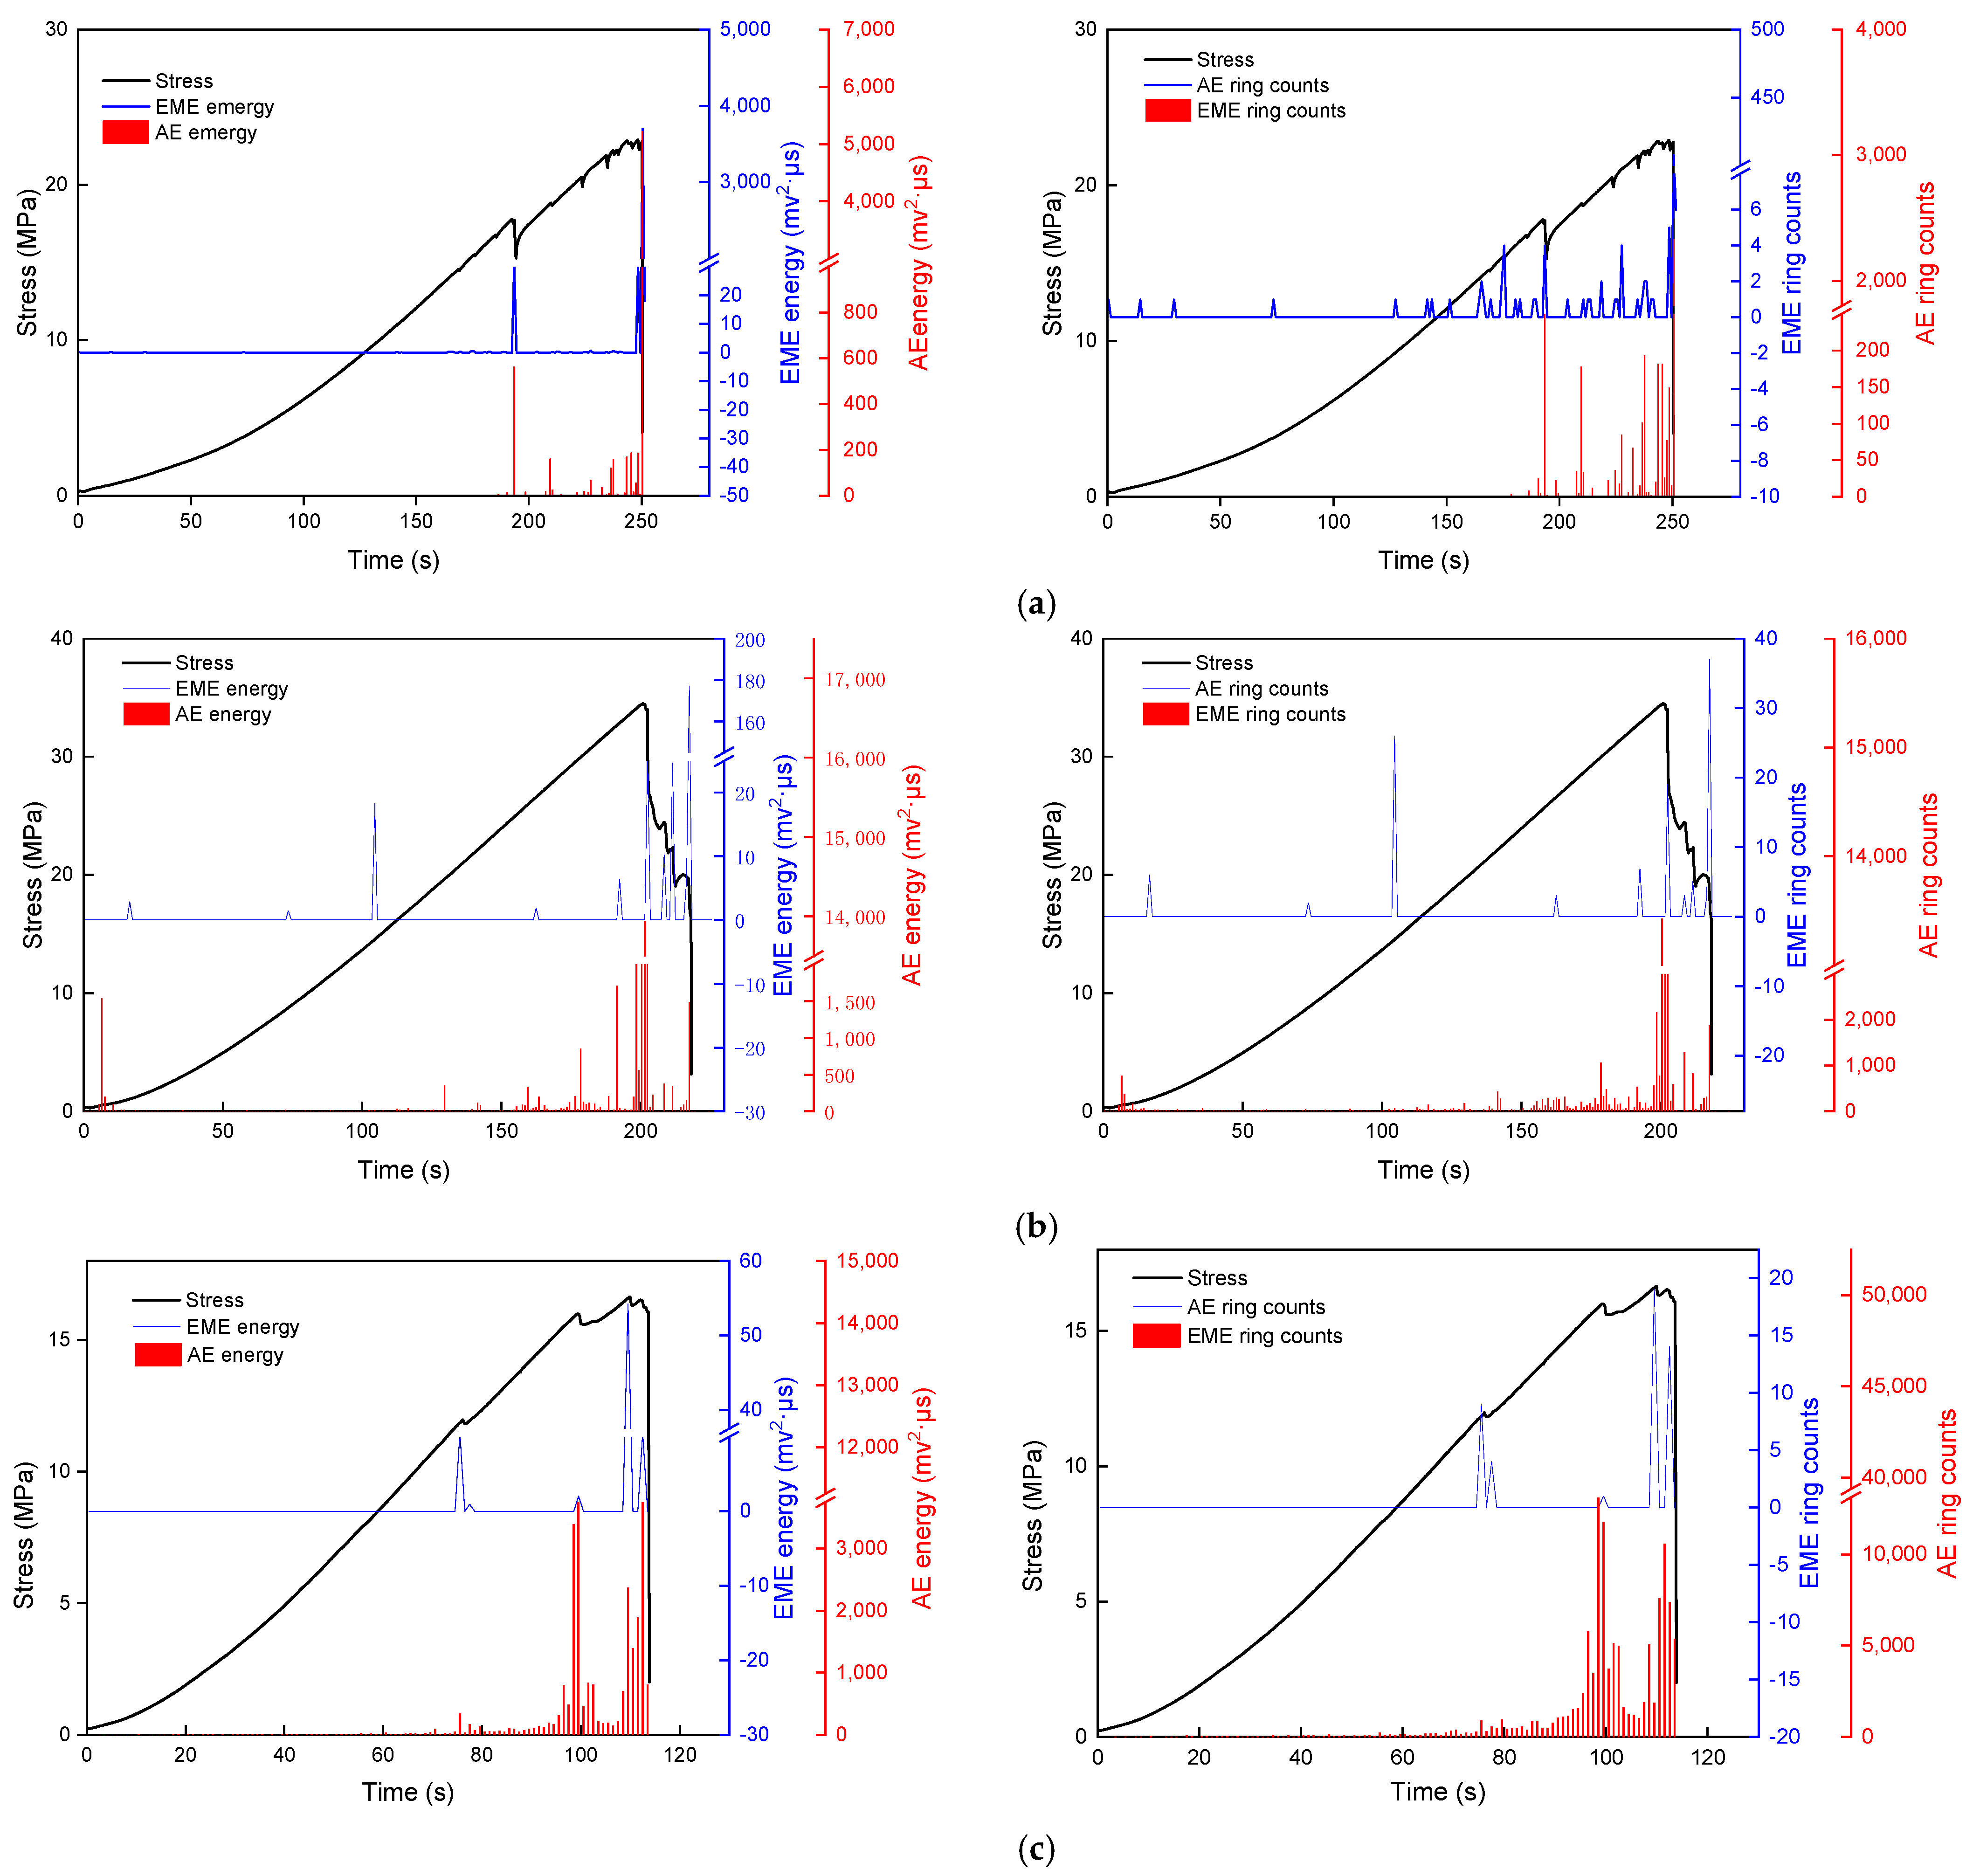
AE and EME can directly reflect the internal damage evolution law of the sample subjected to load. Energy represents the magnitude of internal energy release, while the count represents the internal crack propagation frequency. Taking the K1 sample of Kuangou mine, T2 sample of Tashan mine, and J3 sample of Jinjia mine as examples, respectively, the AE and EME response characteristics of the samples under load in different geological conditions are explained for ease of understanding. The AE and EME energy, counting, and stress curves during the whole loading process are shown in Figure 3a–c.
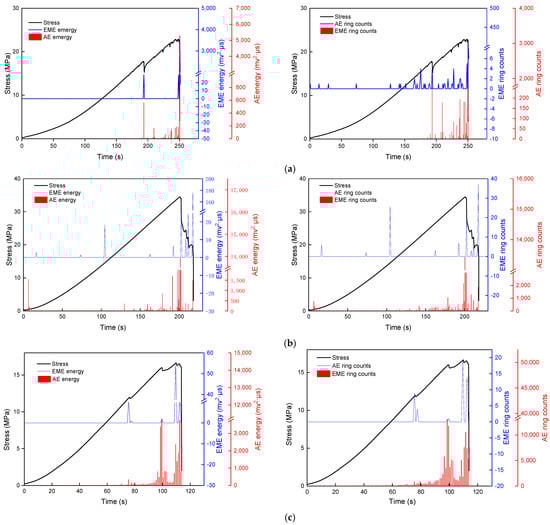
Figure 3.
AE and EME energy and ringing counts variation (a) for K1, (b) for T2, and (c) for J3.
Approximately, before and after 190 s of the loading, the K1 sample entered the strain strengthening region with the initiation of a large number of microcracks in the sample. Then, rapidly expanded and penetrated within 250 s, and, finally, the sample was rapidly damaged. After entering the strain strengthened area, with the increase in stress, the AE signal enters the active period, and the AE energy and ringing count increase significantly. The EME signal also enters the active period before and after entering the strain strengthening area, nevertheless, the overall energy magnitude and ring count are much lower than those of the AE. After the T2 and J3 coal samples were loaded for 150 s and 90 s, respectively, the amplitude and ringing count of AE and EME began to gradually increase, indicating that they entered the strain strengthening area. T2 and J3 coal samples enter the failure danger area at 200 s and 110 s, respectively. The AE and EME response are significantly more active before and after entering the failure zone, however, the energy and pulse are not always high. For different types of mines, it is difficult to determine a unified threshold for the energy and ringing count of AE and EME signals due to different buried depths, geological conditions, and physical and mechanical properties of coal.
The internal structure of coal is complex and cracks are developed. Under the action of load, the evolution of primary and secondary cracks will cause more abundant micro and macro cracks in the coal and release energy in the form of elastic wave and electromagnetic energy. AE and EME signals are “Homologous and anomaly” phenomena caused by the destruction of samples, and their mechanisms are different. Compared with EME signals, AE signals are more abundant. AE and EME signals are not completely synchronized. During the whole process of coal sample from loading to failure, only a small amount of obvious EME signals are generated. AE and EME signals have strong synchronization before and after stress drop and load peak.
3.3. Relationship between Coal Rock Body Failure and M Value
Hall [29] and Byun [30] have shown that the ratio of the total number of AE events to the cumulative AE energy can better reflect the damage degree of coal and rock mass. The smaller the ratio, the more intensive the large-energy events and the greater the possibility of large damage. This index avoids huge data processing work, however, it can easily give rise to errors in the identification process of the number of AE events.
Therefore, based on the calculation principle of the above indicators, the average pulse energy can be reflected by calculating the ratio of signal energy to count per unit time to study its relationship with coal rock damage. The calculation formula is as follows (1):
where Et is the energy per unit time, Nt is the count per unit time, and i is A or E, representing AE and EME, respectively.
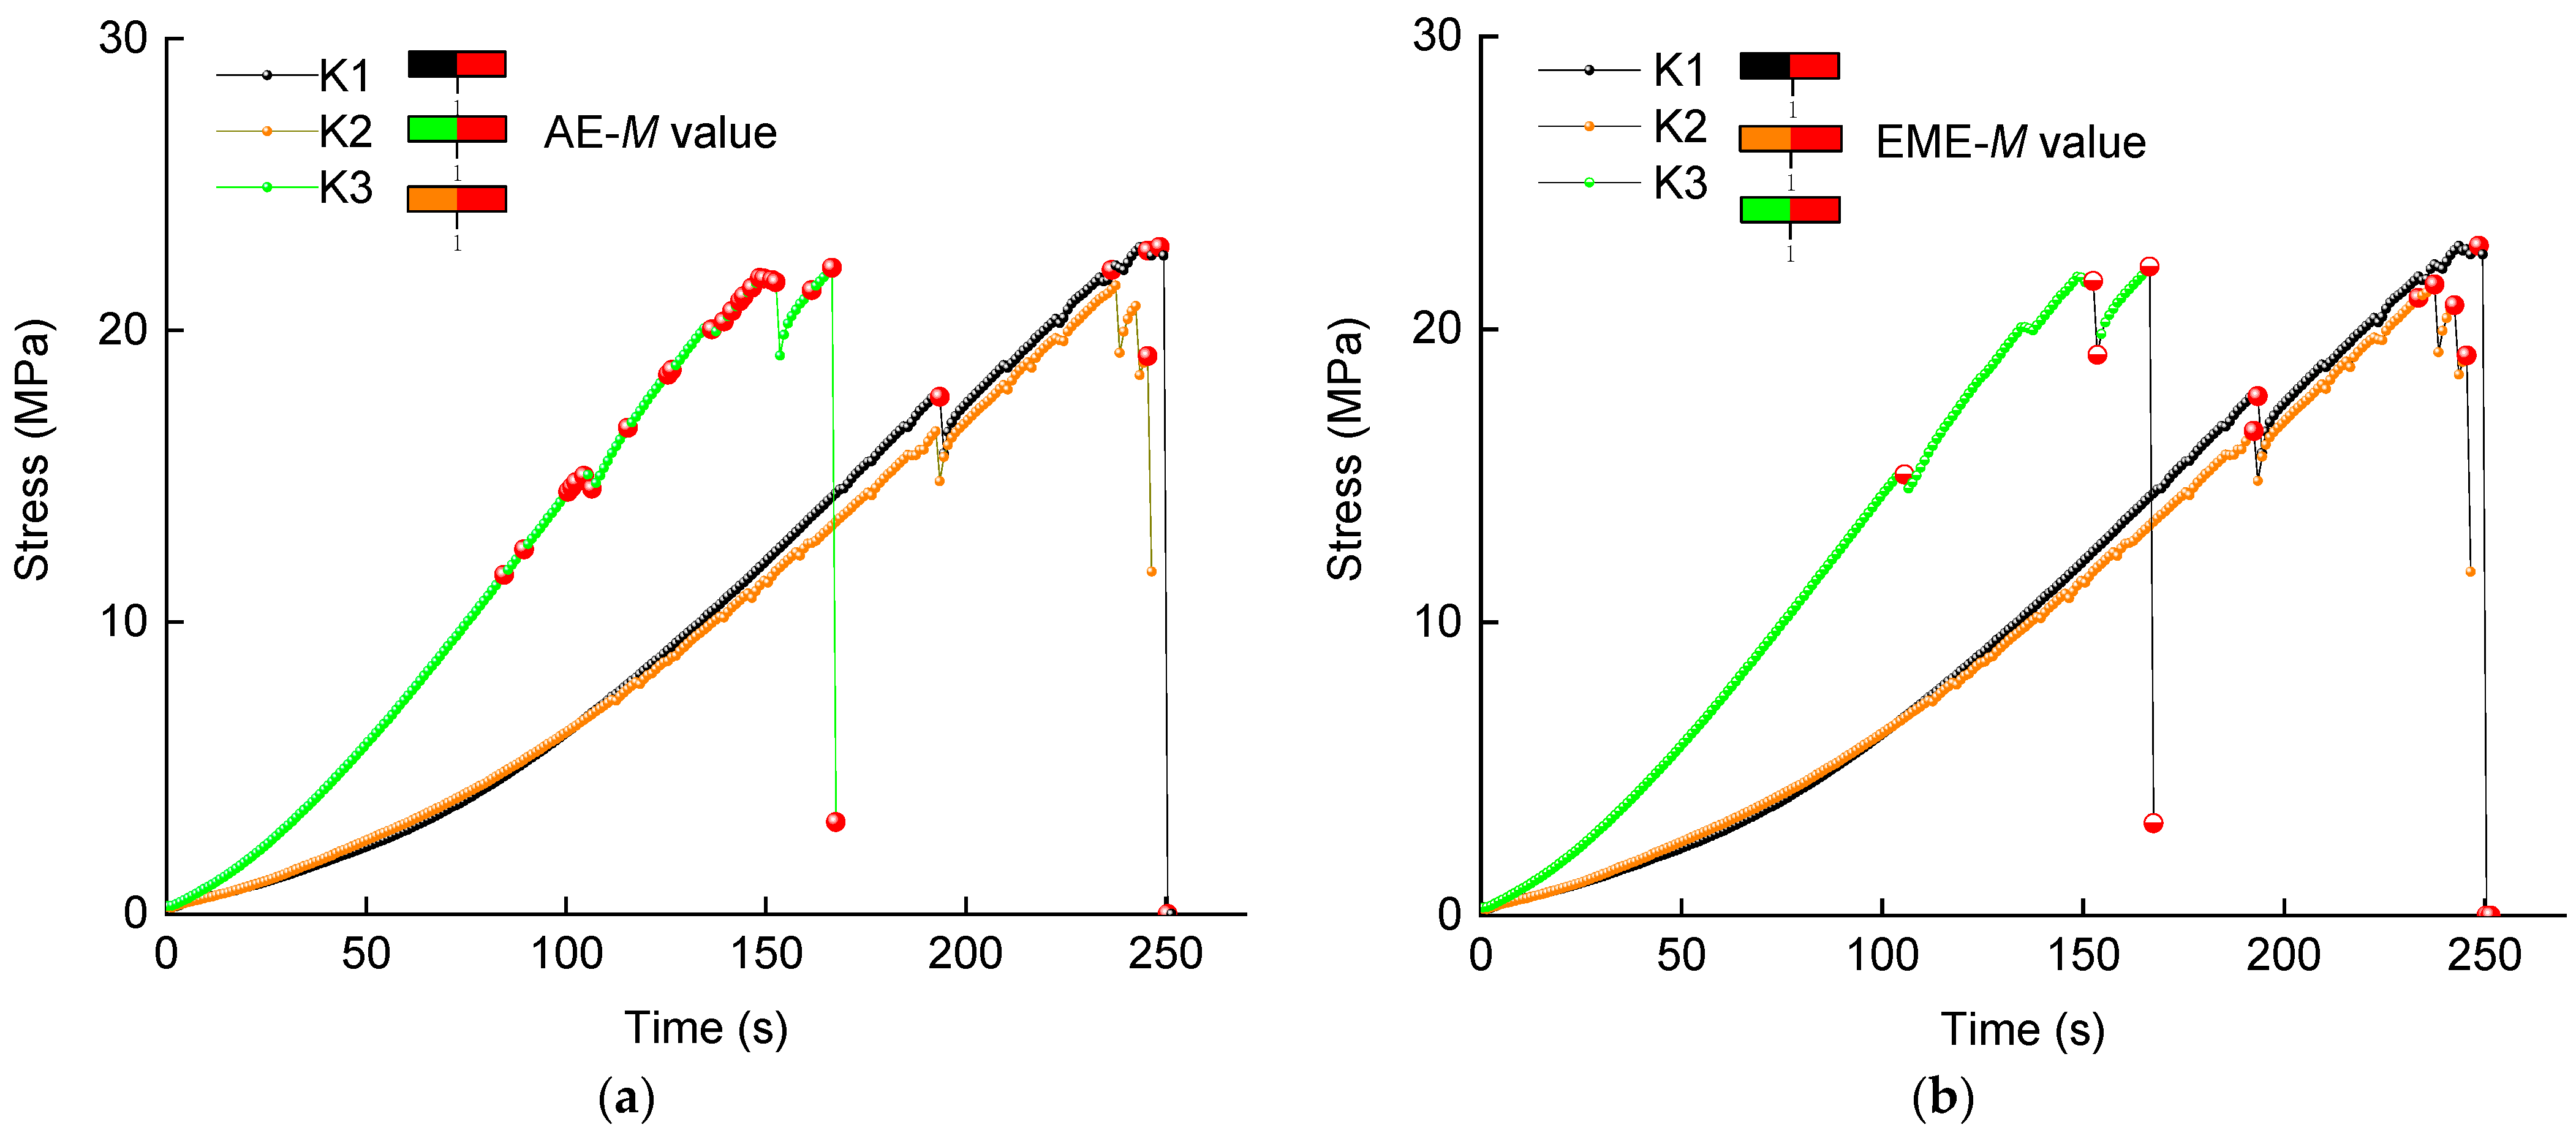
Figure 4a,b, respectively, show the M value variation of AE and EME under different stresses during the loading process for the coal samples of Kuangou mine, and Figure 4c,d, respectively, reflect the M value for the coal samples of Tashan mine, and Figure 4e,f, respectively, reflect the M value for the coal samples of Jinjia mine. In addition, in order to clearly show and analyze the relationship between M value and the failure of coal mass, it is represented by red dots when M > 1. It can be seen that when the loading stress is low, the MA value is basically less than 1, and the events of MA > 1 gradually increase as the stress increases. When with an obvious stress drop, the MA value exceeds 1. Whereas near the stress peak, the events with MA > 1 are concentrated. It was found that the ME value follows a similar pattern of change. Therefore, both MA and ME can reflect the failure state of coal. When the M > 1, it indicates that the coal mass is about to enter or has entered the failure danger area. The more concentrated the events with M > 1, the more the possibility of coal mass entering the failure danger area.
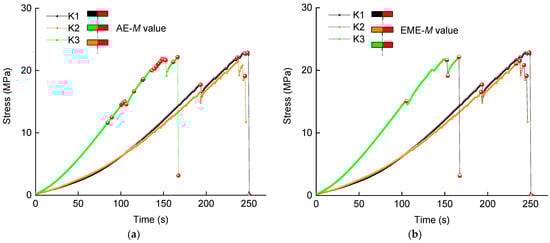
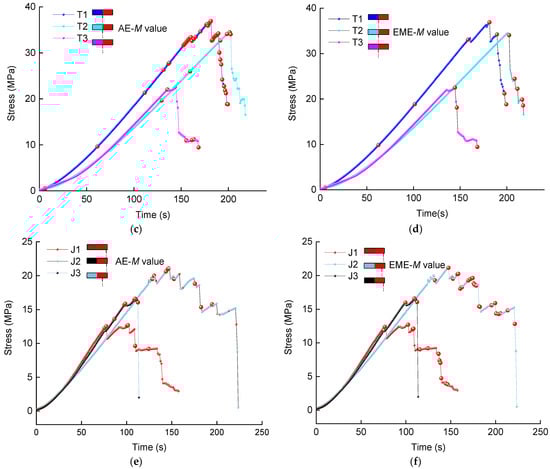
Figure 4.
Stress–time variation curve and AE and EME M value variation (a,b) for K1~K3, (c,d) for T1~T3, and (e,f) for J1~J3.
3.4. AE and EME Synchronous Response Analysis and Early Warning R Index
With the on-site application of the AE and EME monitoring equipment, the monitoring data are affected by electromagnetic fields, such as electromechanical equipment, cables, and operation vibration, leading to early warning miscalculations occurring (false alarm). At present, wavelet transform and empirical mode decomposition are mainly used to effectively identify and filter the interference signals that change in the time domain and overlap in the frequency domain. However, the above methods need to collect full-waveform signals. However, in the field of underground engineering, due to environmental constraints, network bandwidth, data volume, and other factors, it is still unable to collect full-waveform data when the AE and EME equipment is used on site.
Due to the different generation mechanisms of AE and EME signals, it is difficult for sources to interfere with both at the same time. Therefore, the analysis of the signal of simultaneous acoustic and electrical response can avoid, to a greater extent, the influence of interference signals on the early warning of the occurrence of coal and rock dynamic disasters. The above experimental results show that the AE and EME signals can be received synchronously during the process of coal and rock failure. With a large stress drop in the strain strengthened area and before and after entering the failure danger area, the synchronization of the AE and EME signal is the best. Based on the above, the AE and EME synchronous response signal and M value during the loading failure process of coal and rock are analyzed to establish a unified dimensionless index of AE and EME fusion for early warning of coal and rock burst. In this paper, the harmonic mean calculation method is used to merge MA and ME, and the calculation formula is as follows:
where ME is the M value of synchronous response event EME, and MA is the M value of synchronous response event AE.
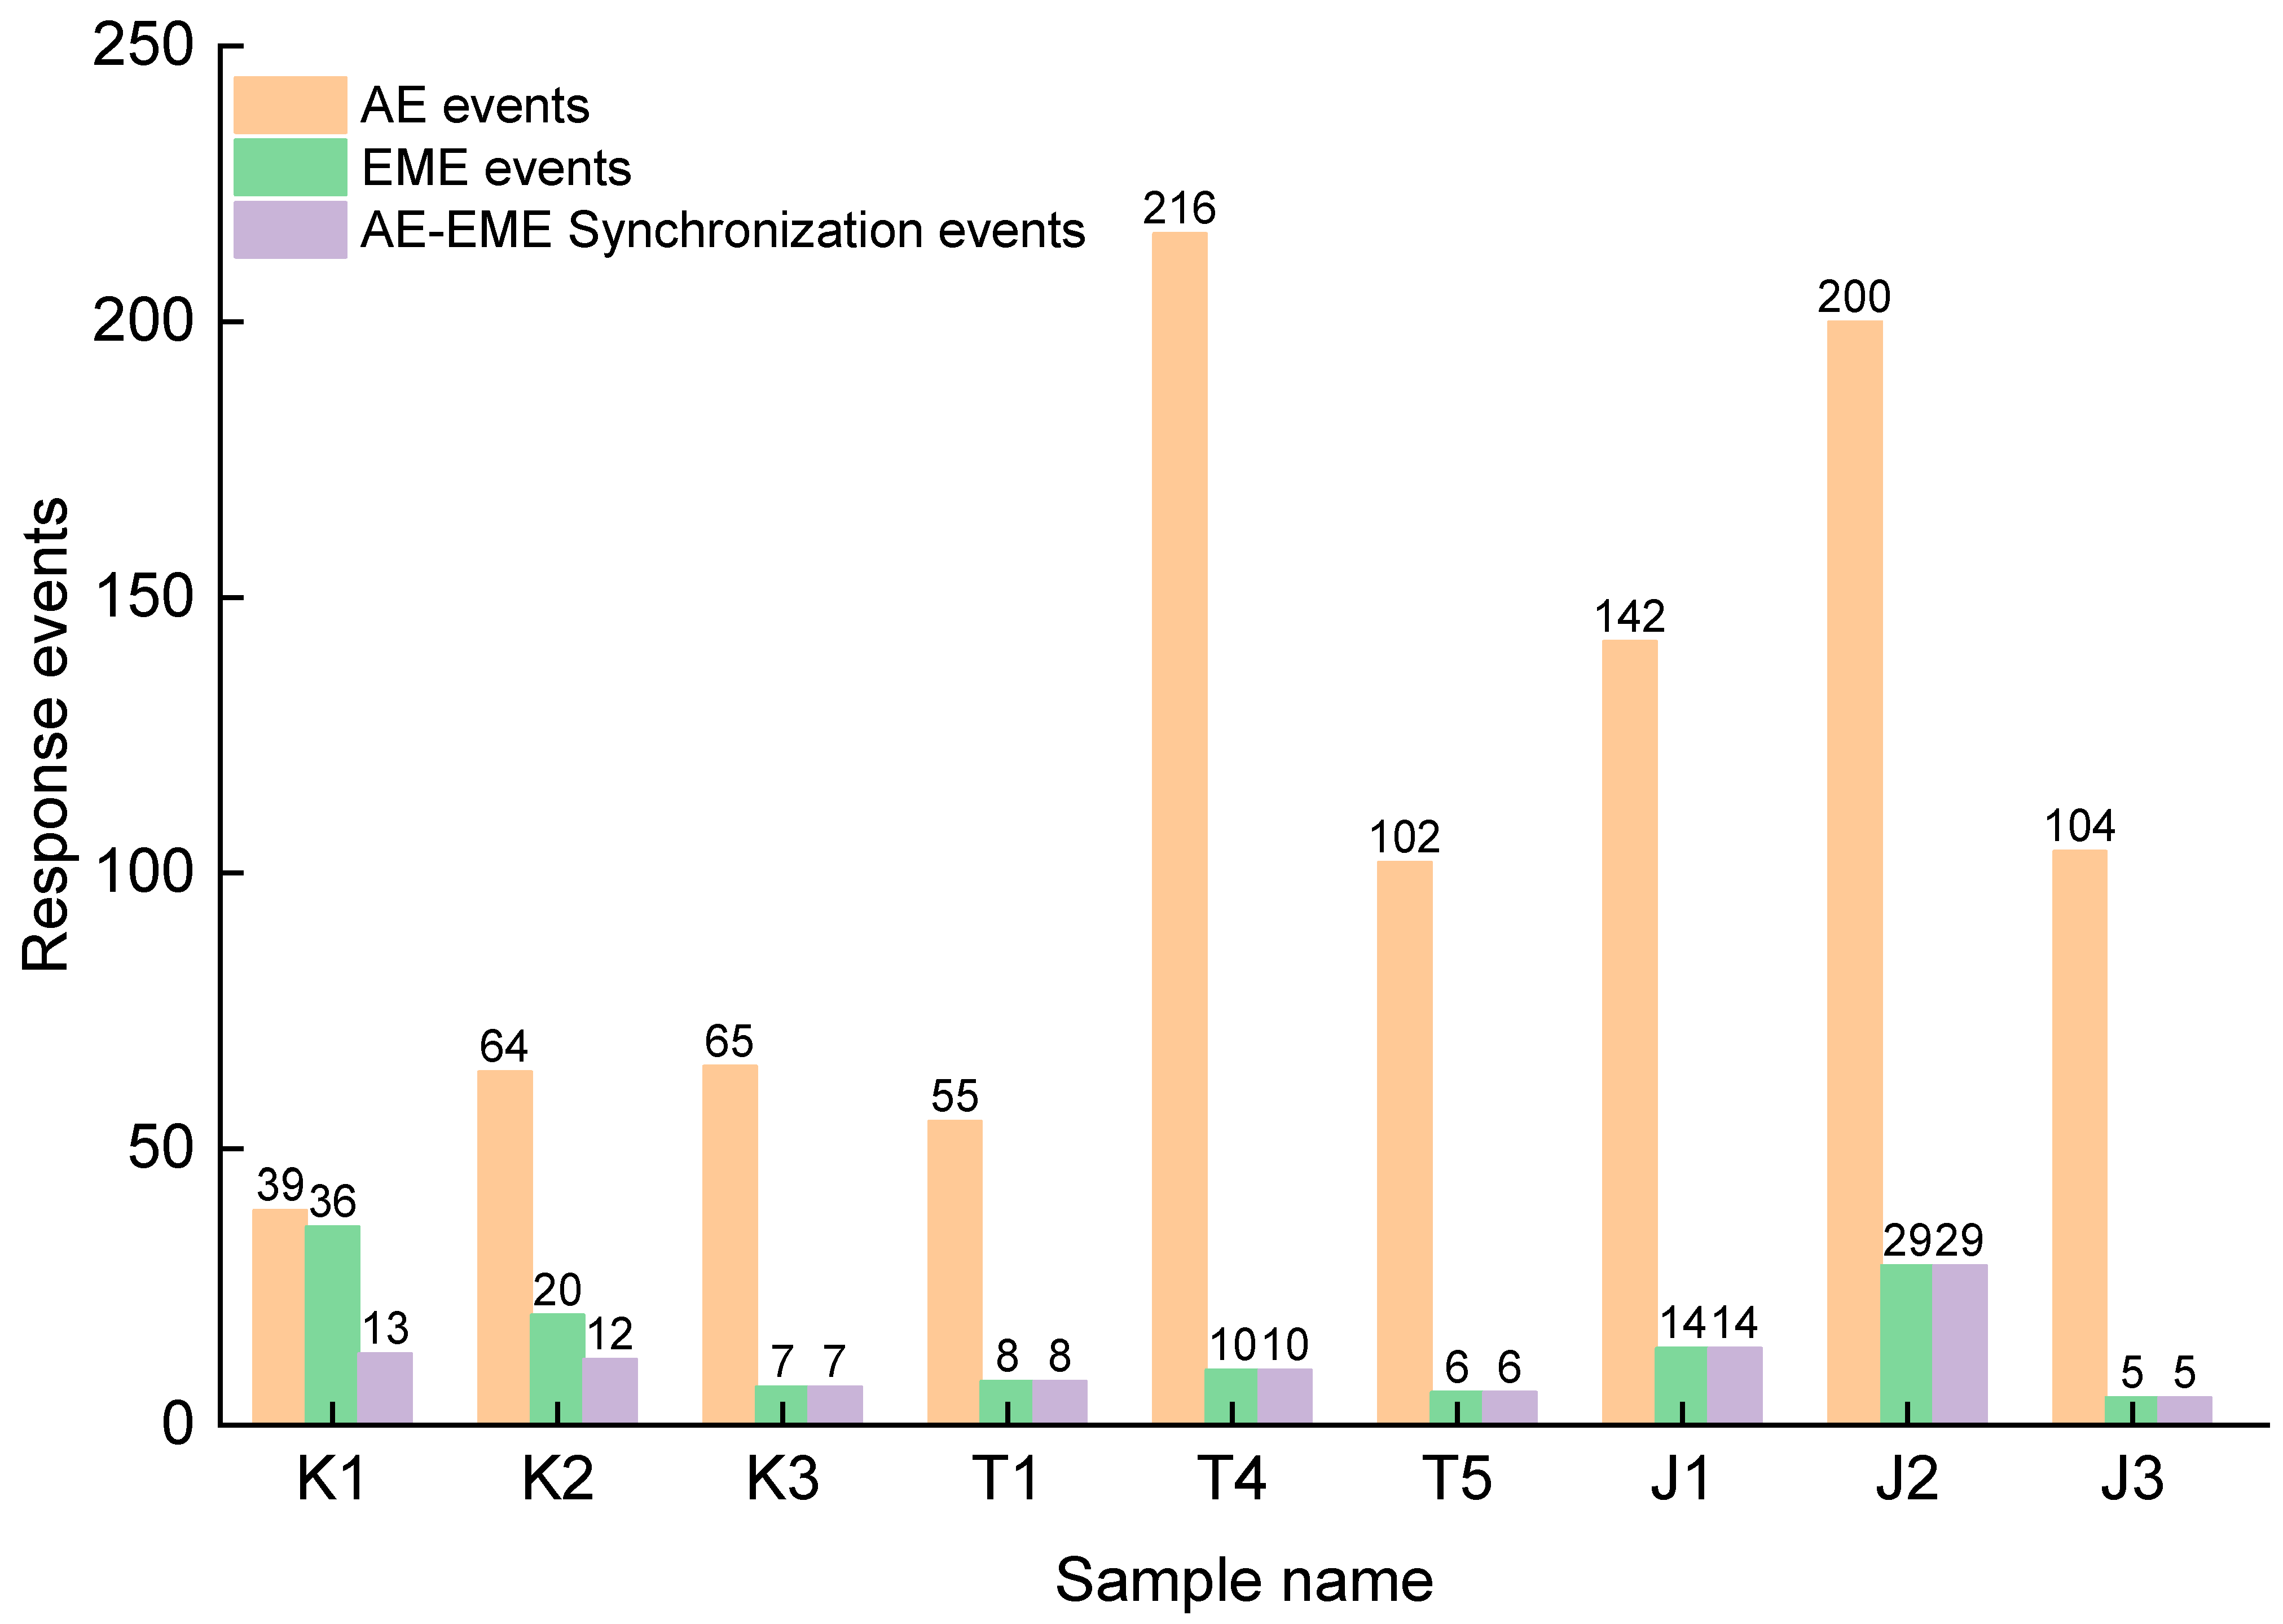
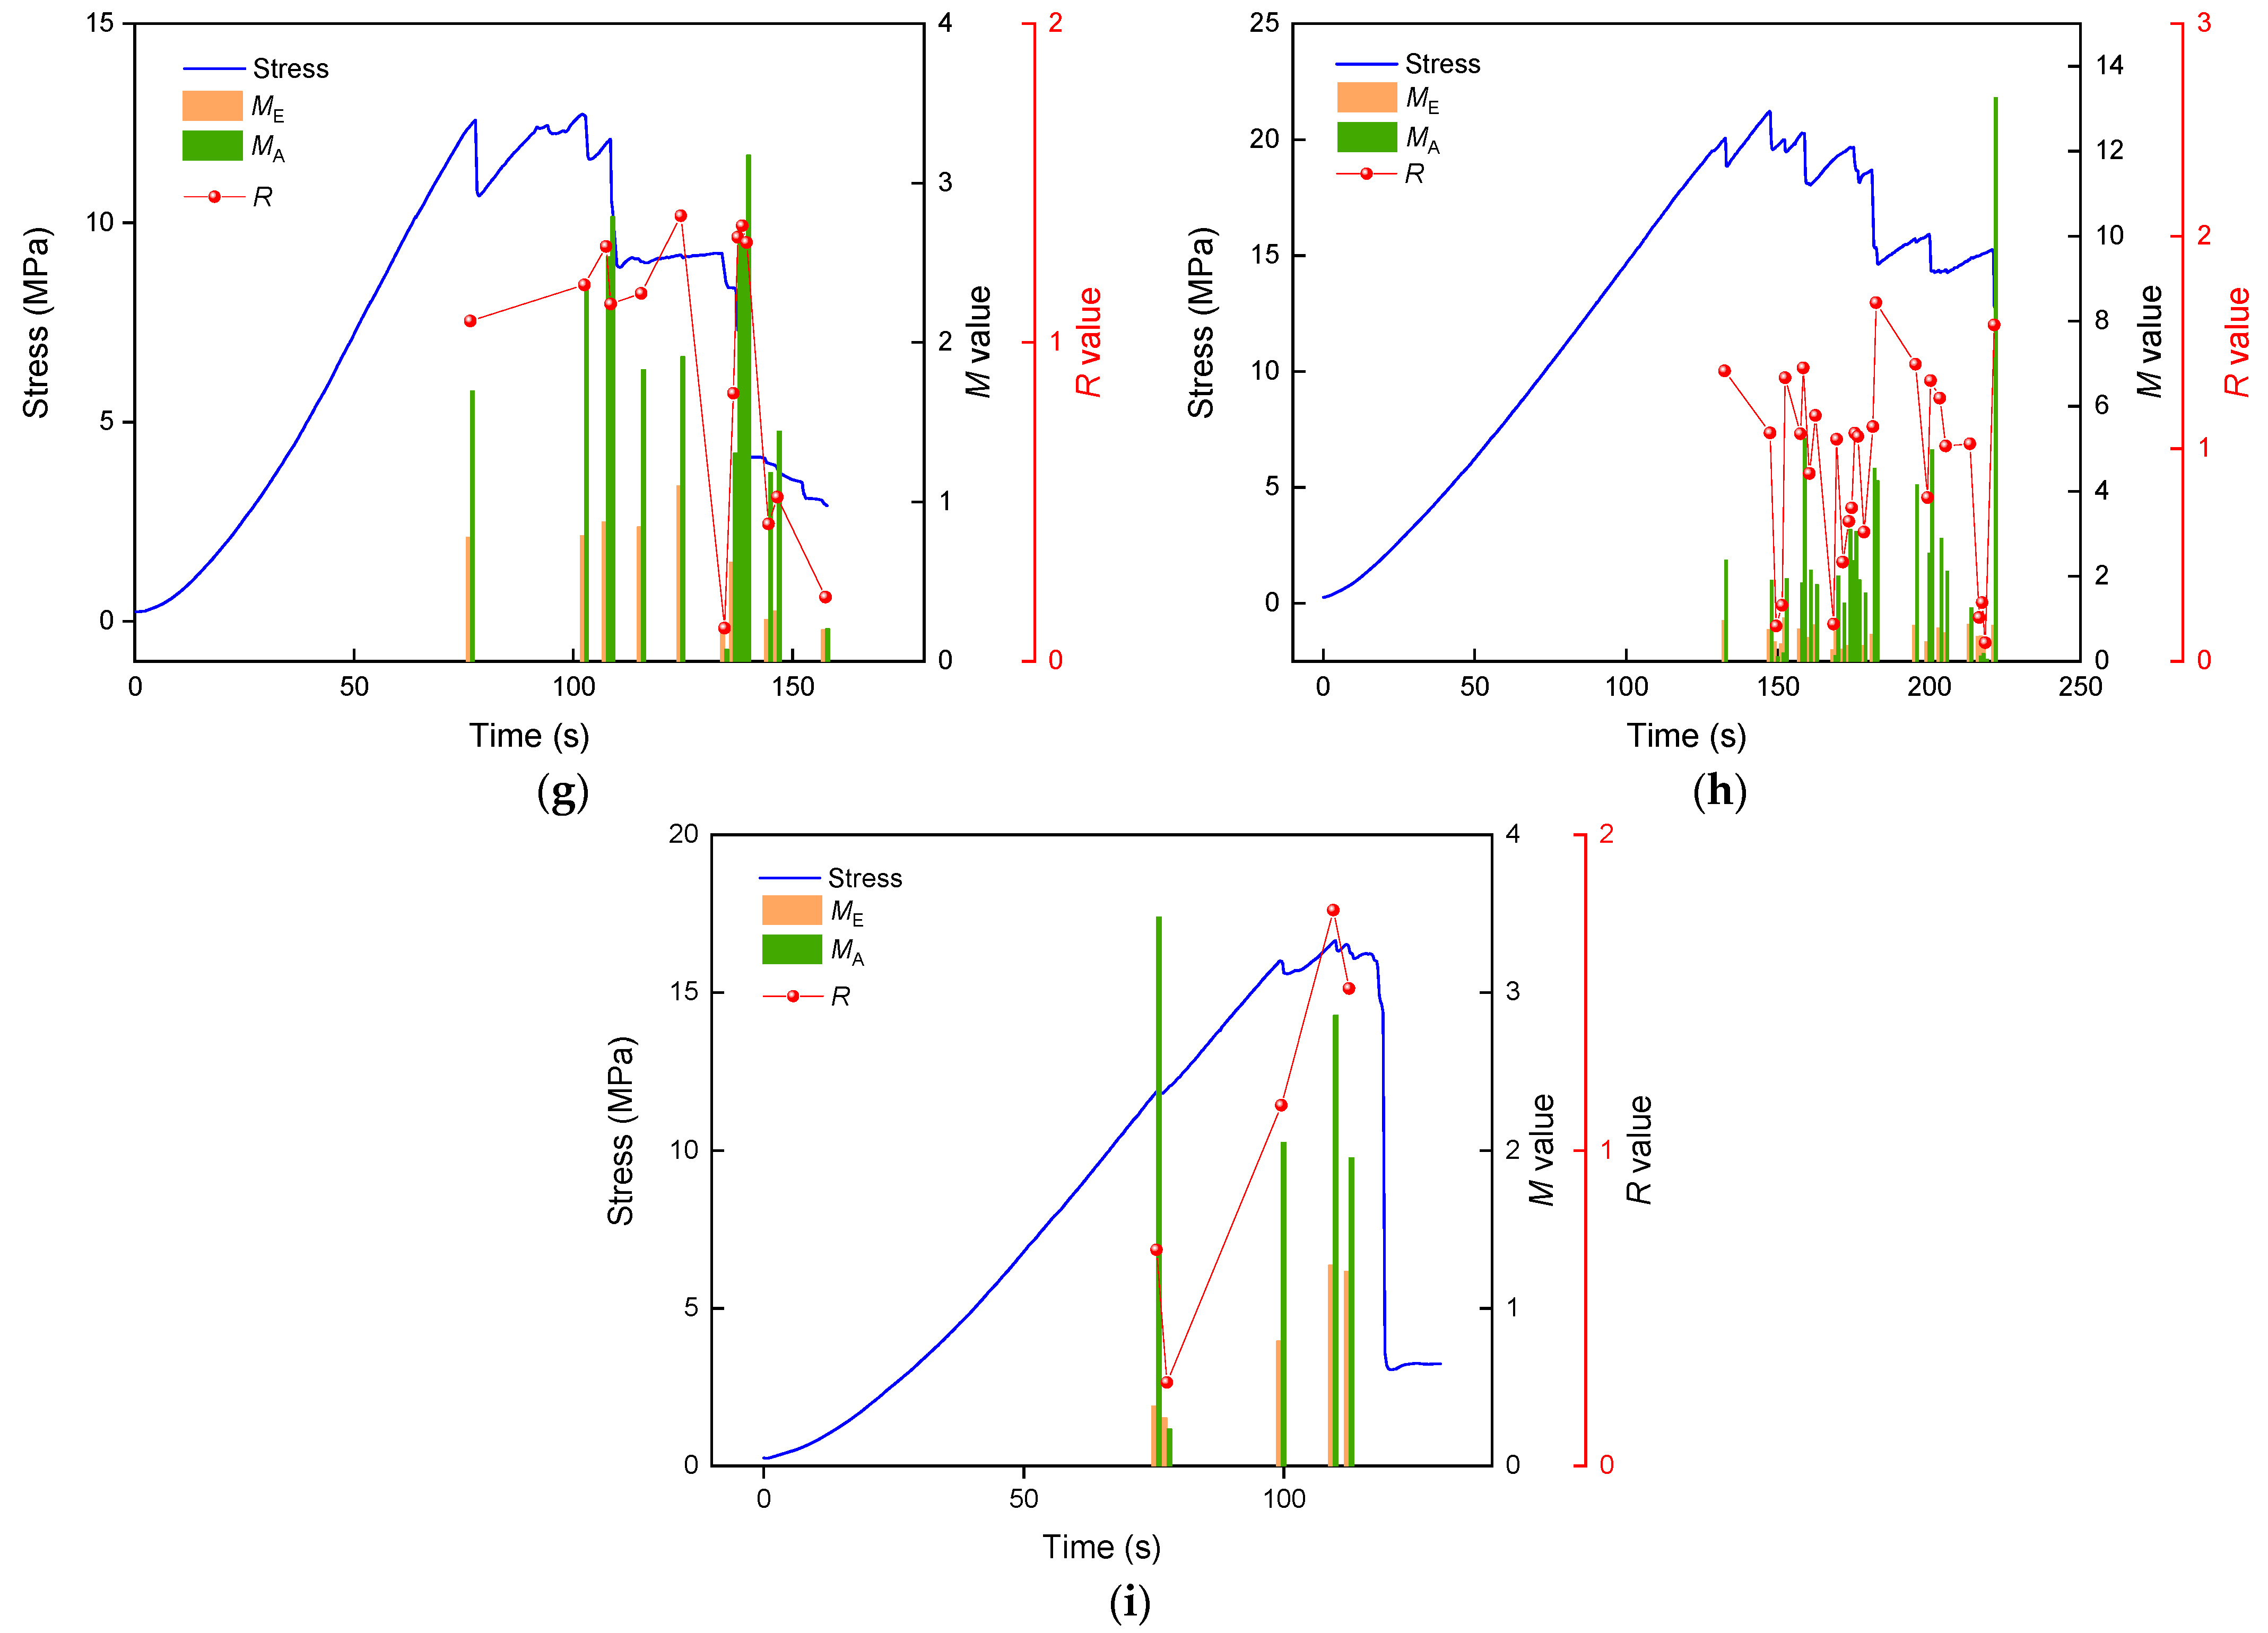
The number of AE and EME events and synchronous responses during the whole loading process of coal samples is shown in Figure 5. During the whole loading process of K1-J3 samples, the number of AE and EME synchronous response events is relatively small. The variation of M and R value of AE and EME synchronous response during sample failure is shown in Figure 6. When there is a significant stress reduction in the strain strengthened area and before and after entering the failure danger area, one of the MA and ME must be greater than 1. Although the value of synchronous response signal M can better reflect the large degree of damage to the coal sample, it will also occur a false early warning when M > 1 under a low-stress state.
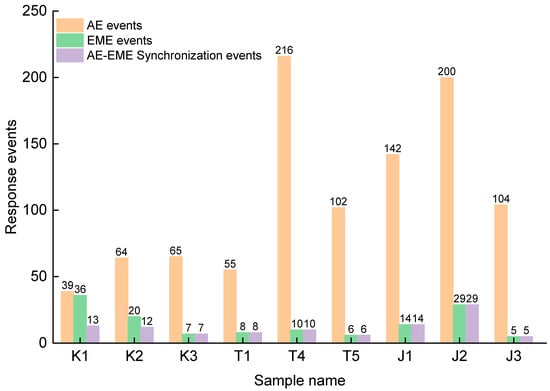
Figure 5.
Number of AE and EME synchronous and asynchronous response events.
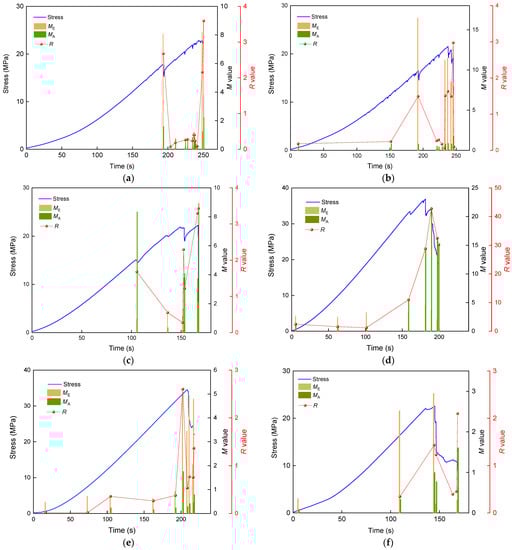
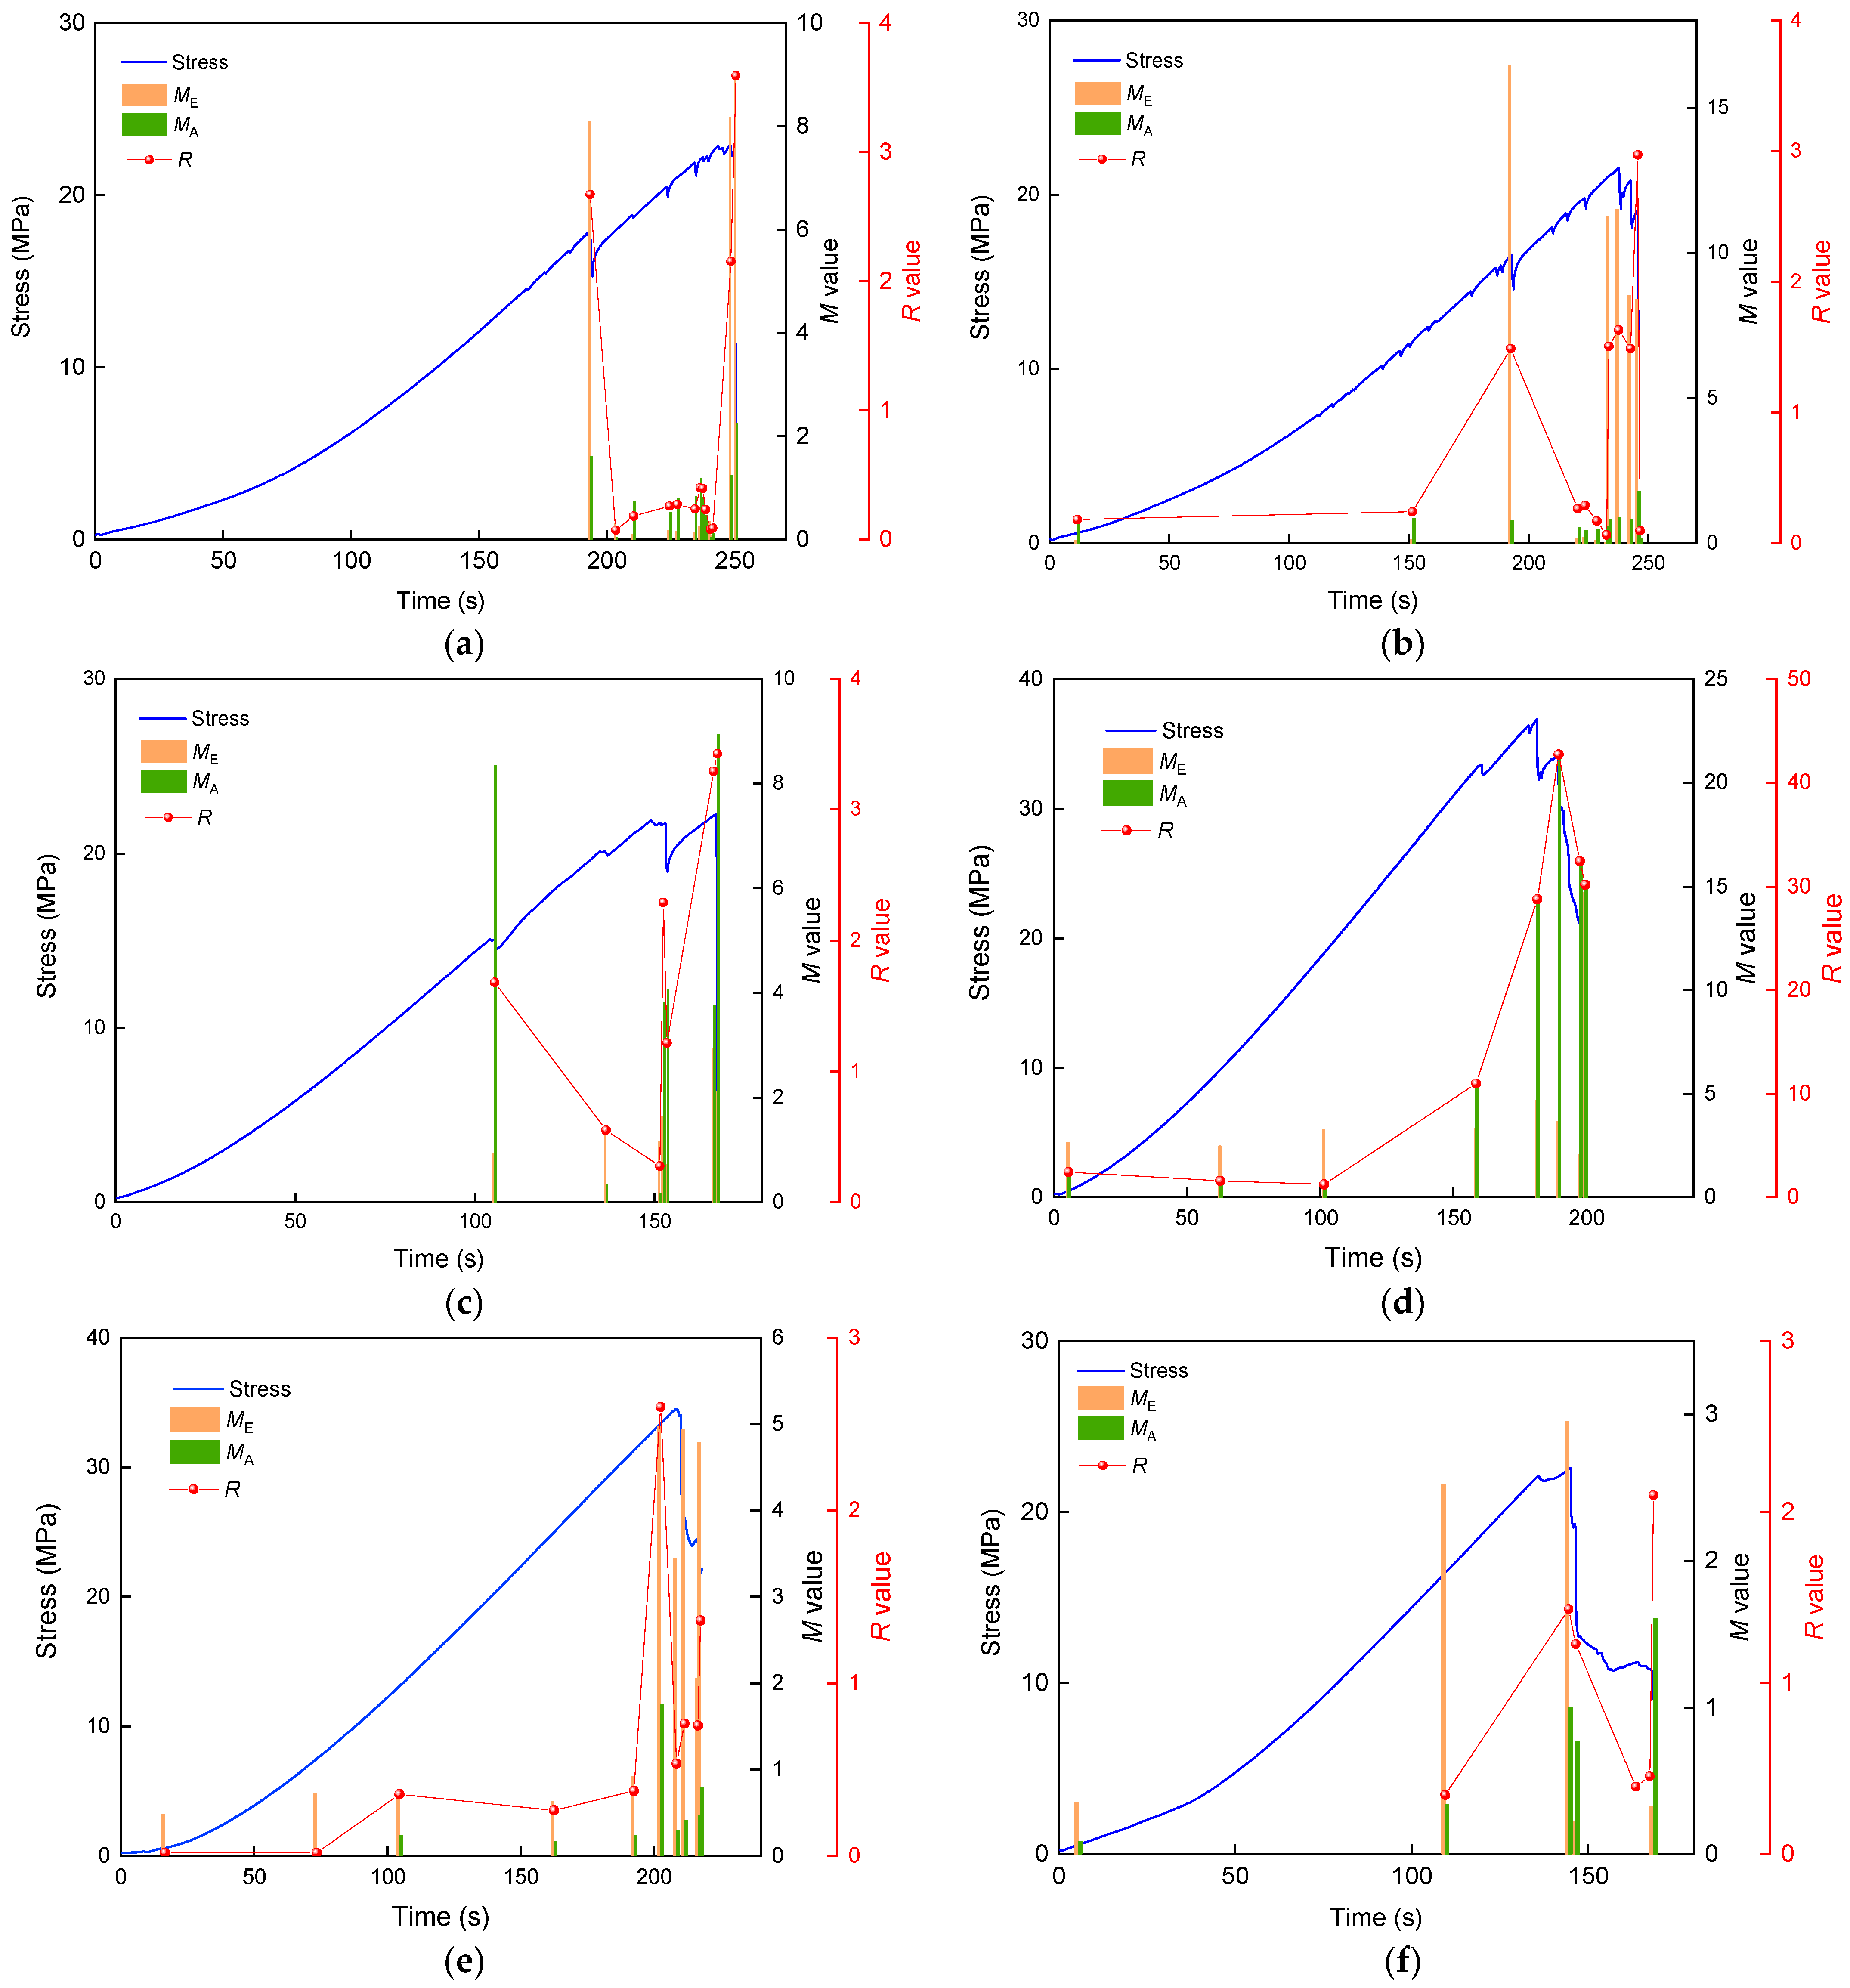
Figure 6.
AE and EME synchronous response M and R value variation (a–c) for K1~K3, (d–f) for T1~T3, and (g–i) for J1~J3.
From the comparison of M value and R value in Figure 6, it can be seen that R value can better reflect the overall change of M value of the acoustic electric signal. When R > 1, there are obvious stress drops, coal rock damage, or high coal rock stress. Therefore, R > 1 is taken as the threshold of coal and rock bursting early warning.
4. Field Application and Validation
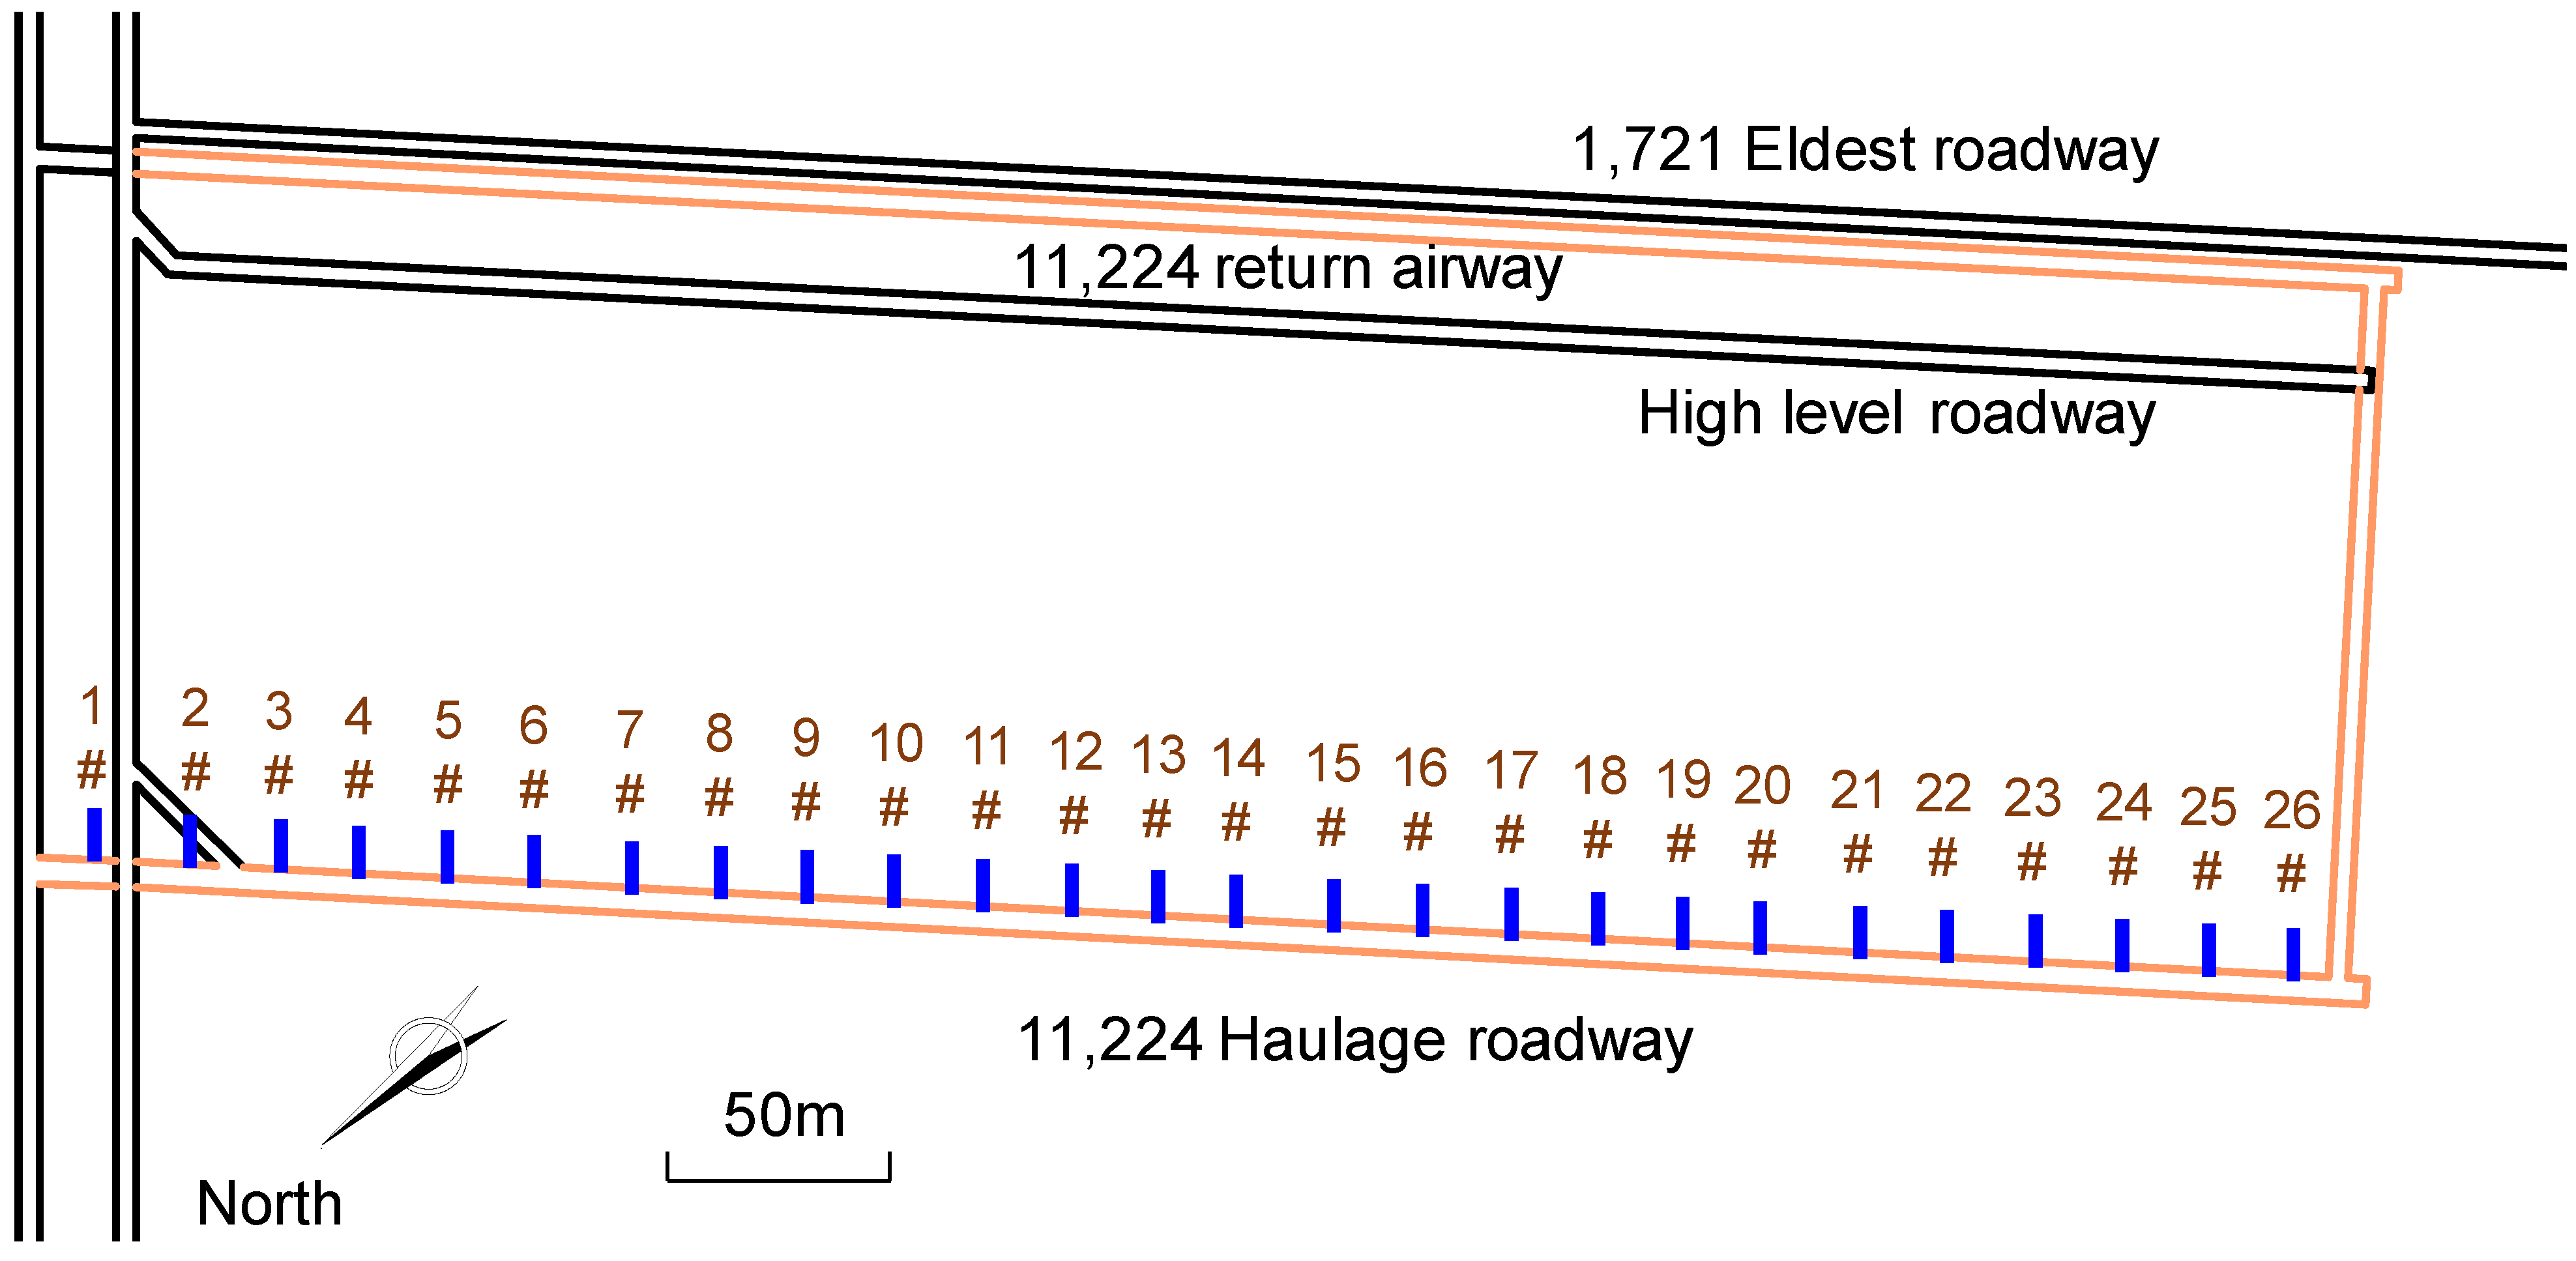
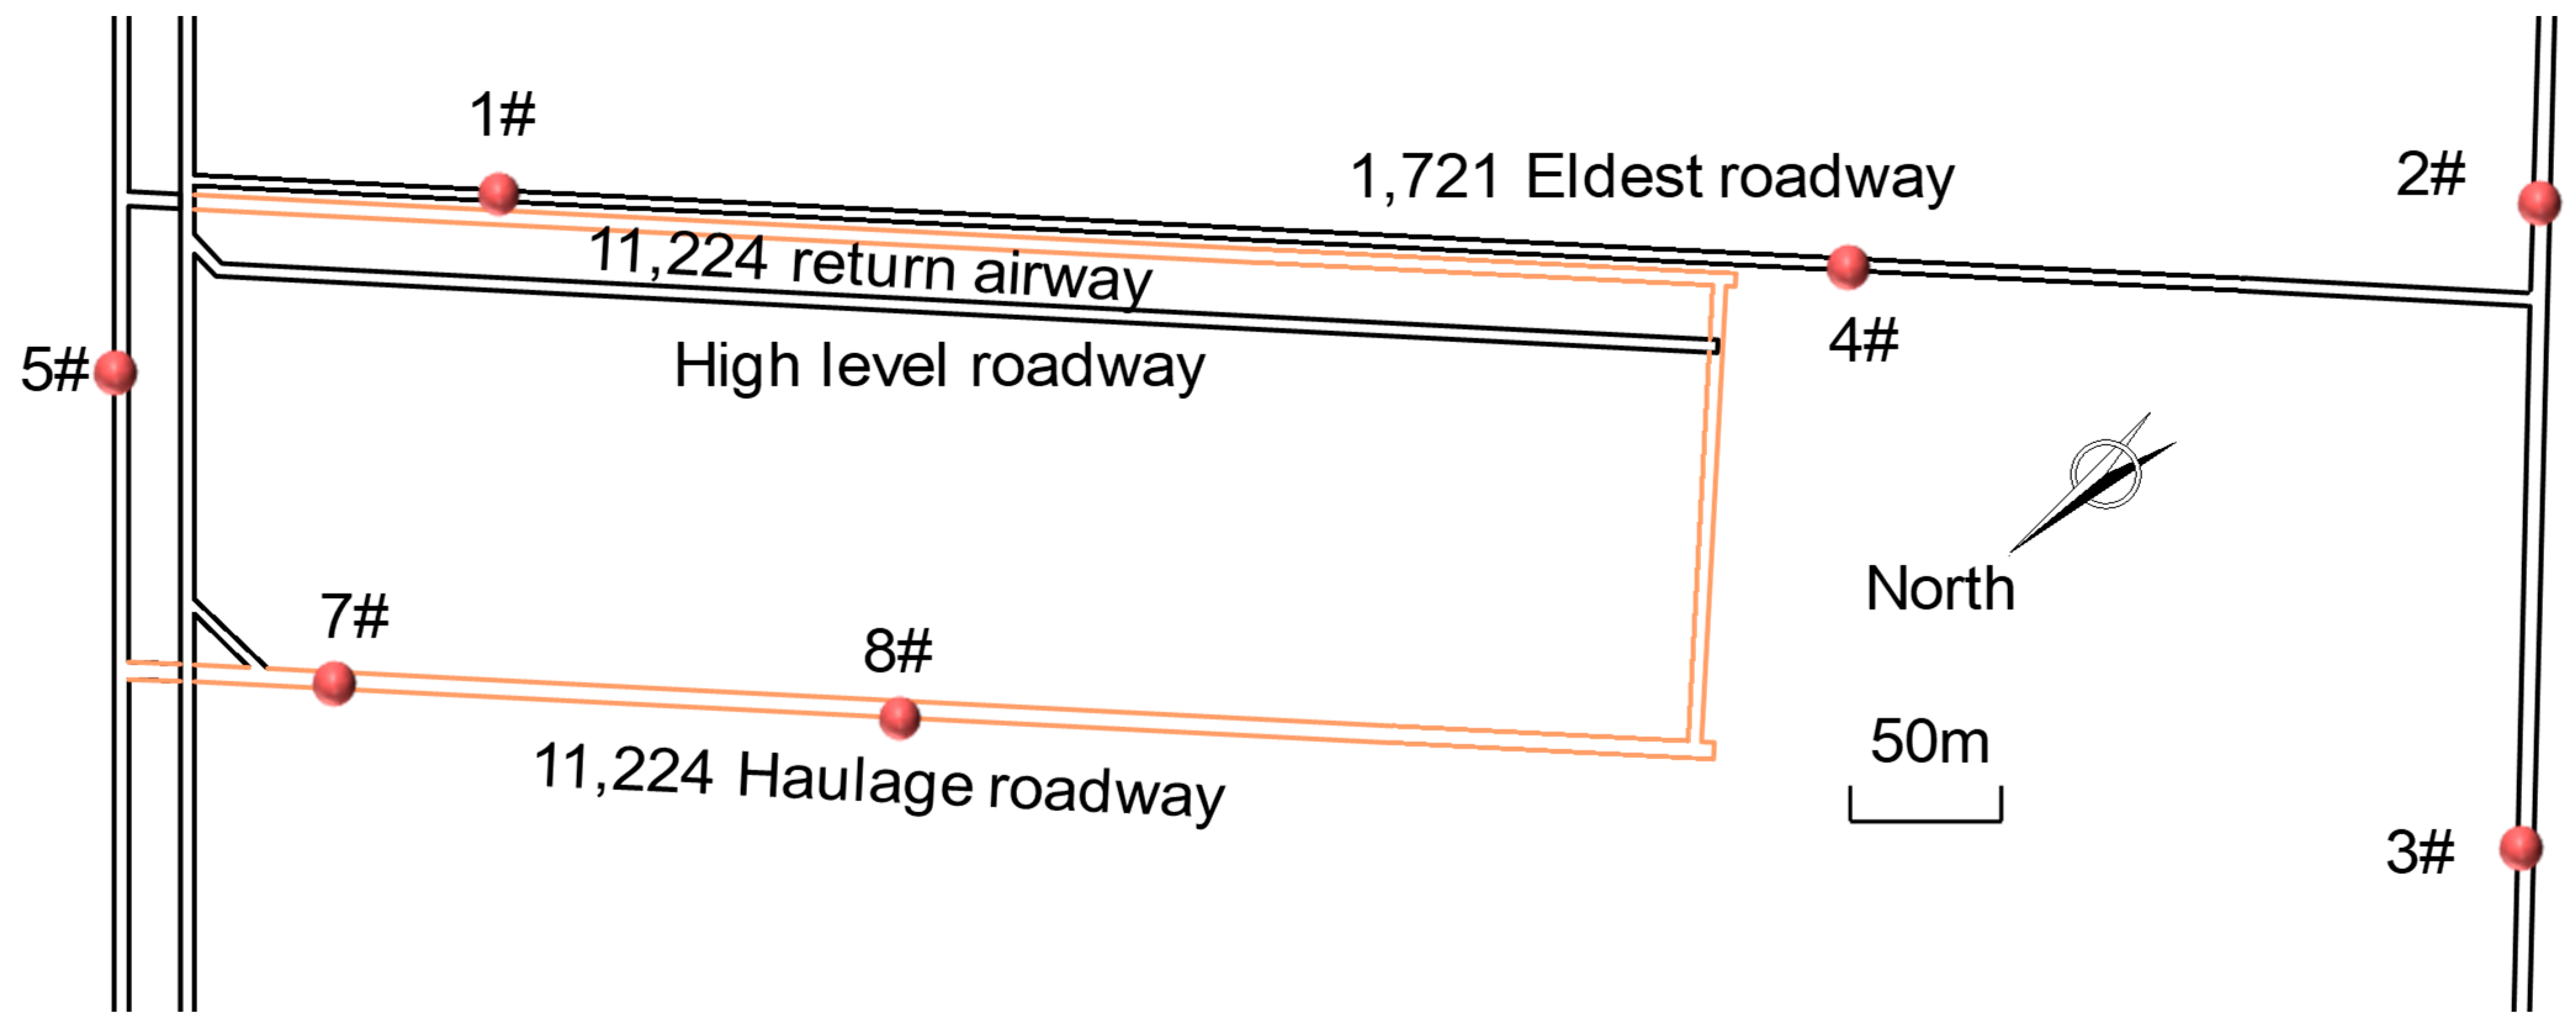
The presented workflow in this research has been verified through the field application for the purpose of validation. In order to verify the validity of the R-value characterization of coal rock damage and the local monitoring and early warning of coal rock dynamic hazards, an on-site test was carried out in 11,224 haulage roadway of Jinjia coal mine in Guizhou, China. The KBD5 portable coal rock dynamic disaster acoustic and electrical monitor has been used for field acoustic-electric monitoring. This includes components, such as an electromagnetic directional receiver antenna, acoustic emission probe, host, and specialized software. The physical schematic diagram of the equipment and site probe installation is shown in Figure 7. Electromagnetic radiation and acoustic emission signals were measured at 26 stations in the 11,224 haulage roadway, each measurement point being spaced 20 m apart for a measurement time of 90 s, as shown in Figure 8.
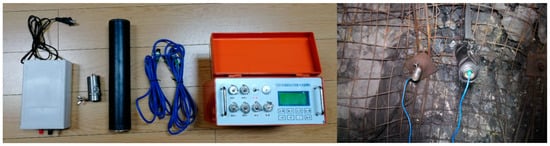
Figure 7.
Portable coal and rock dynamic disaster acoustic and electrical monitor and field acoustic and electrical probe installation diagram.
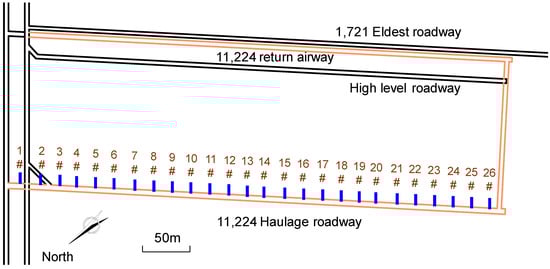
Figure 8.
Arrangement of acoustic-electric measurement points in 11,224 haulage roadway.
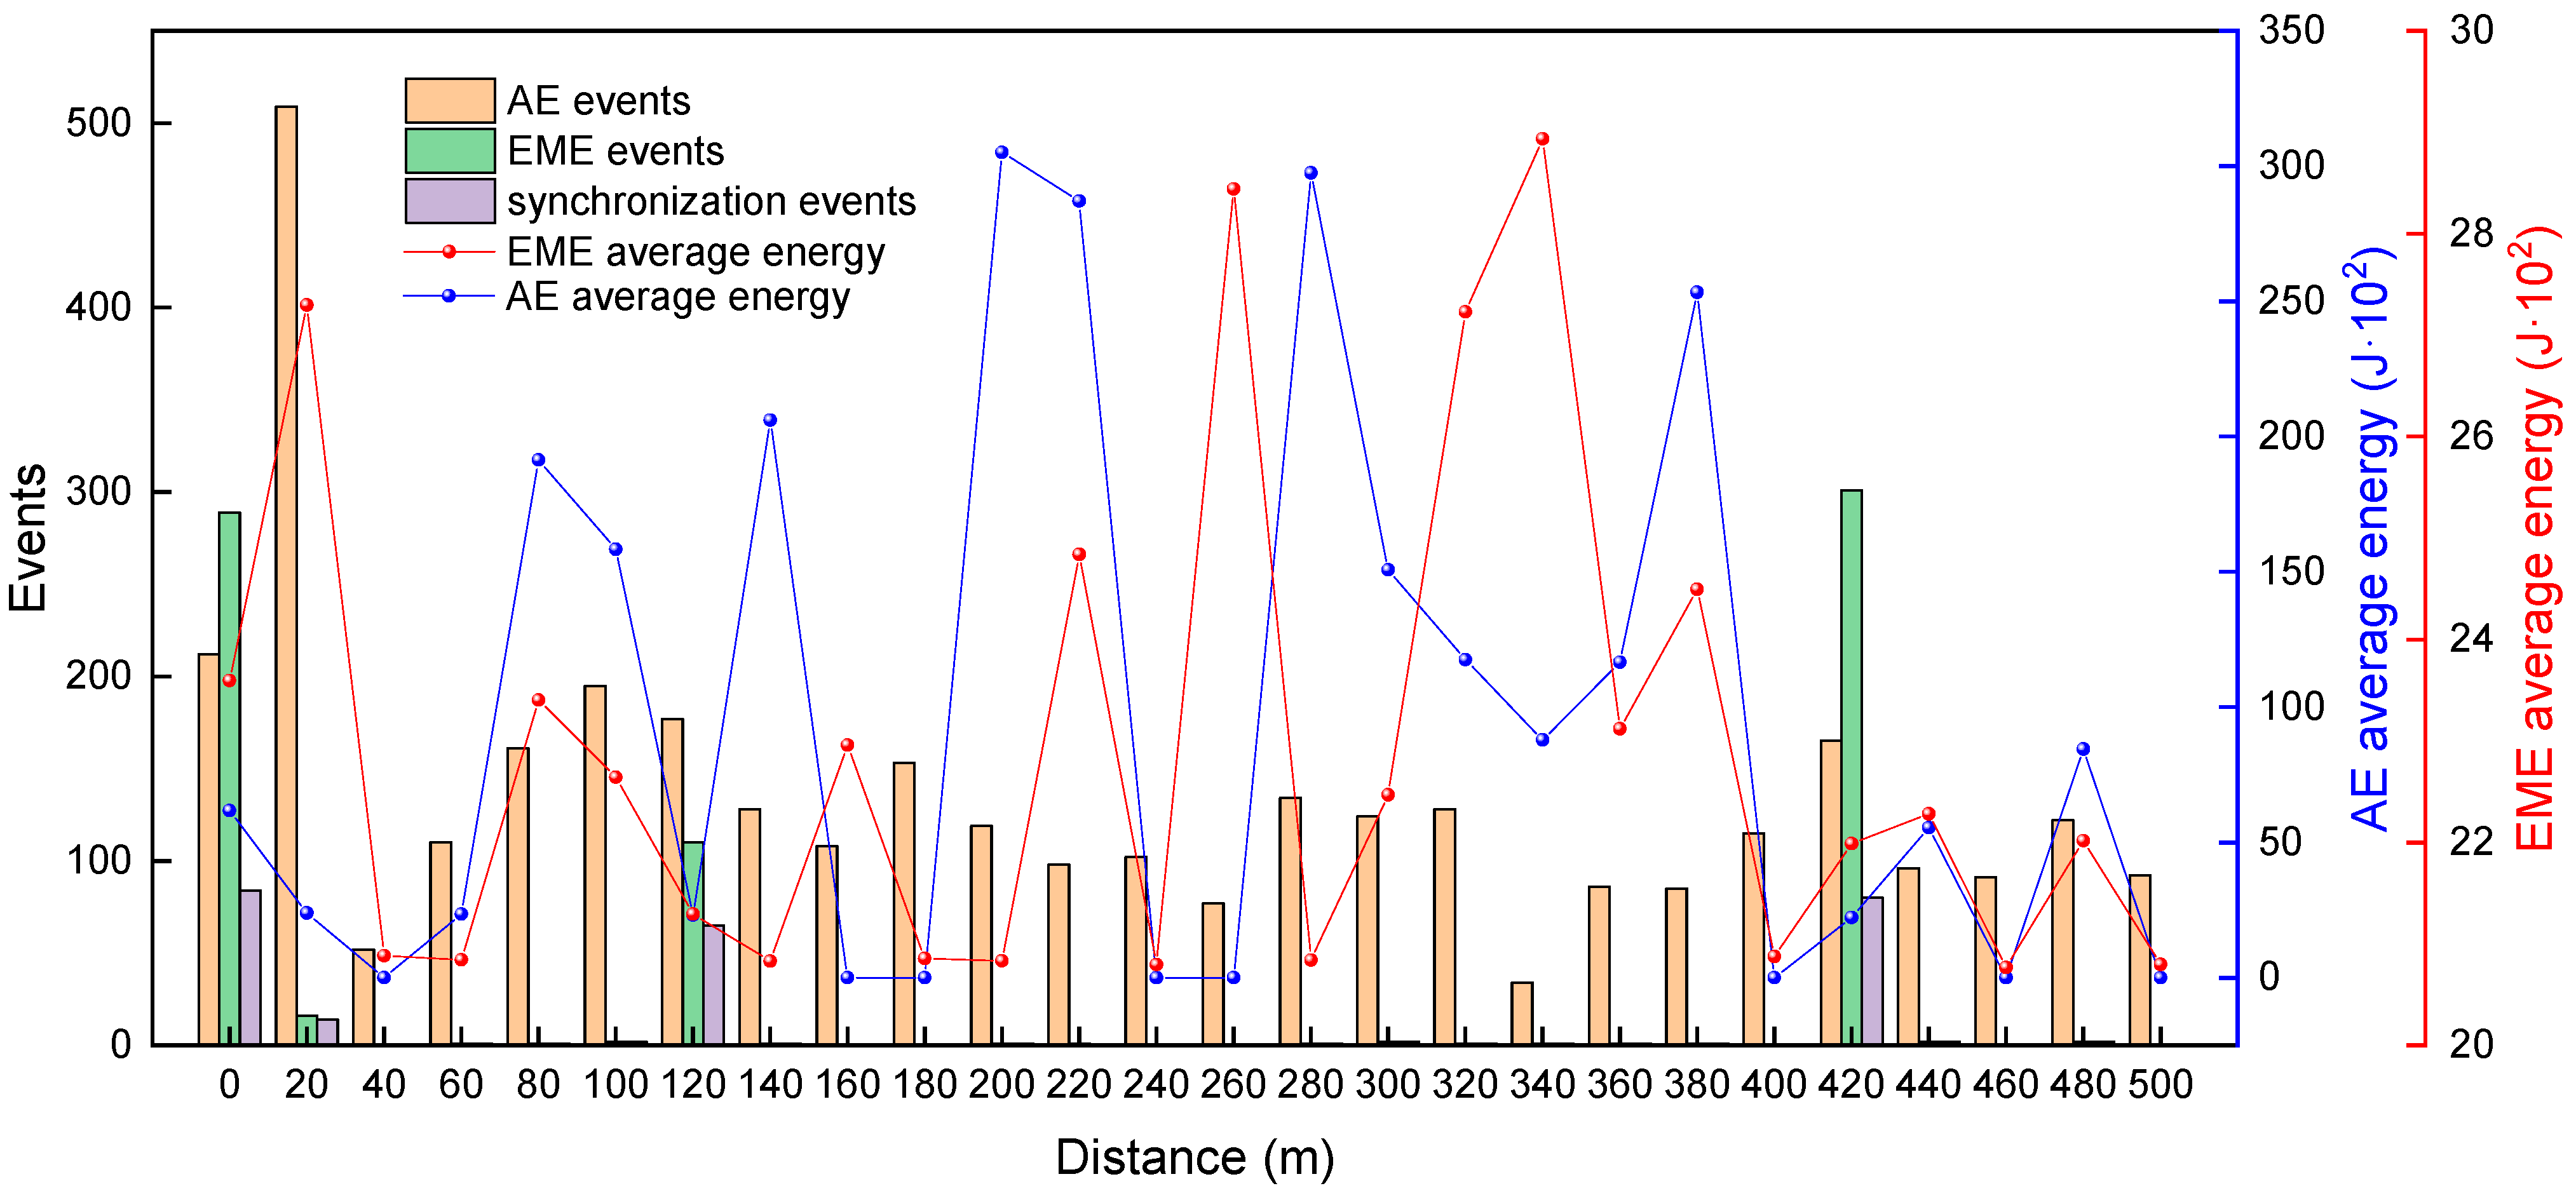
The measured acoustic and emission response events and their average energy at each measuring point are shown in Figure 9. It is evident that more AE events and relatively fewer EME events are monitored at each measurement point in the field. By comparing the average acoustical energy of each site, it is found that the acoustic energy fluctuates greatly, and the AE and EME do not increase synchronously. Thereby, predicting the dynamic disaster of coal and rock becomes quite difficult. The acoustic-electric synchronous response events occurred at 84, 14, 65, and 80 times at 0, 20, 120, and 420 m, respectively, while the number of simultaneous acoustic-electric responses at the remaining points ranged from zero to two. The results show that the coal rock acoustic synchronous signal mainly occurs before and after the rapid crack propagation and failure of the specimen, and it is preliminarily determined that it is dangerous near 0, 20, 120, and 420 m.
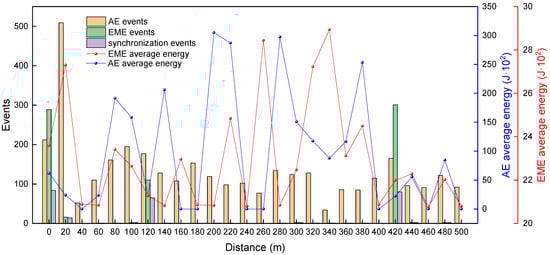
Figure 9.
Acoustic-electric response events and average energy.
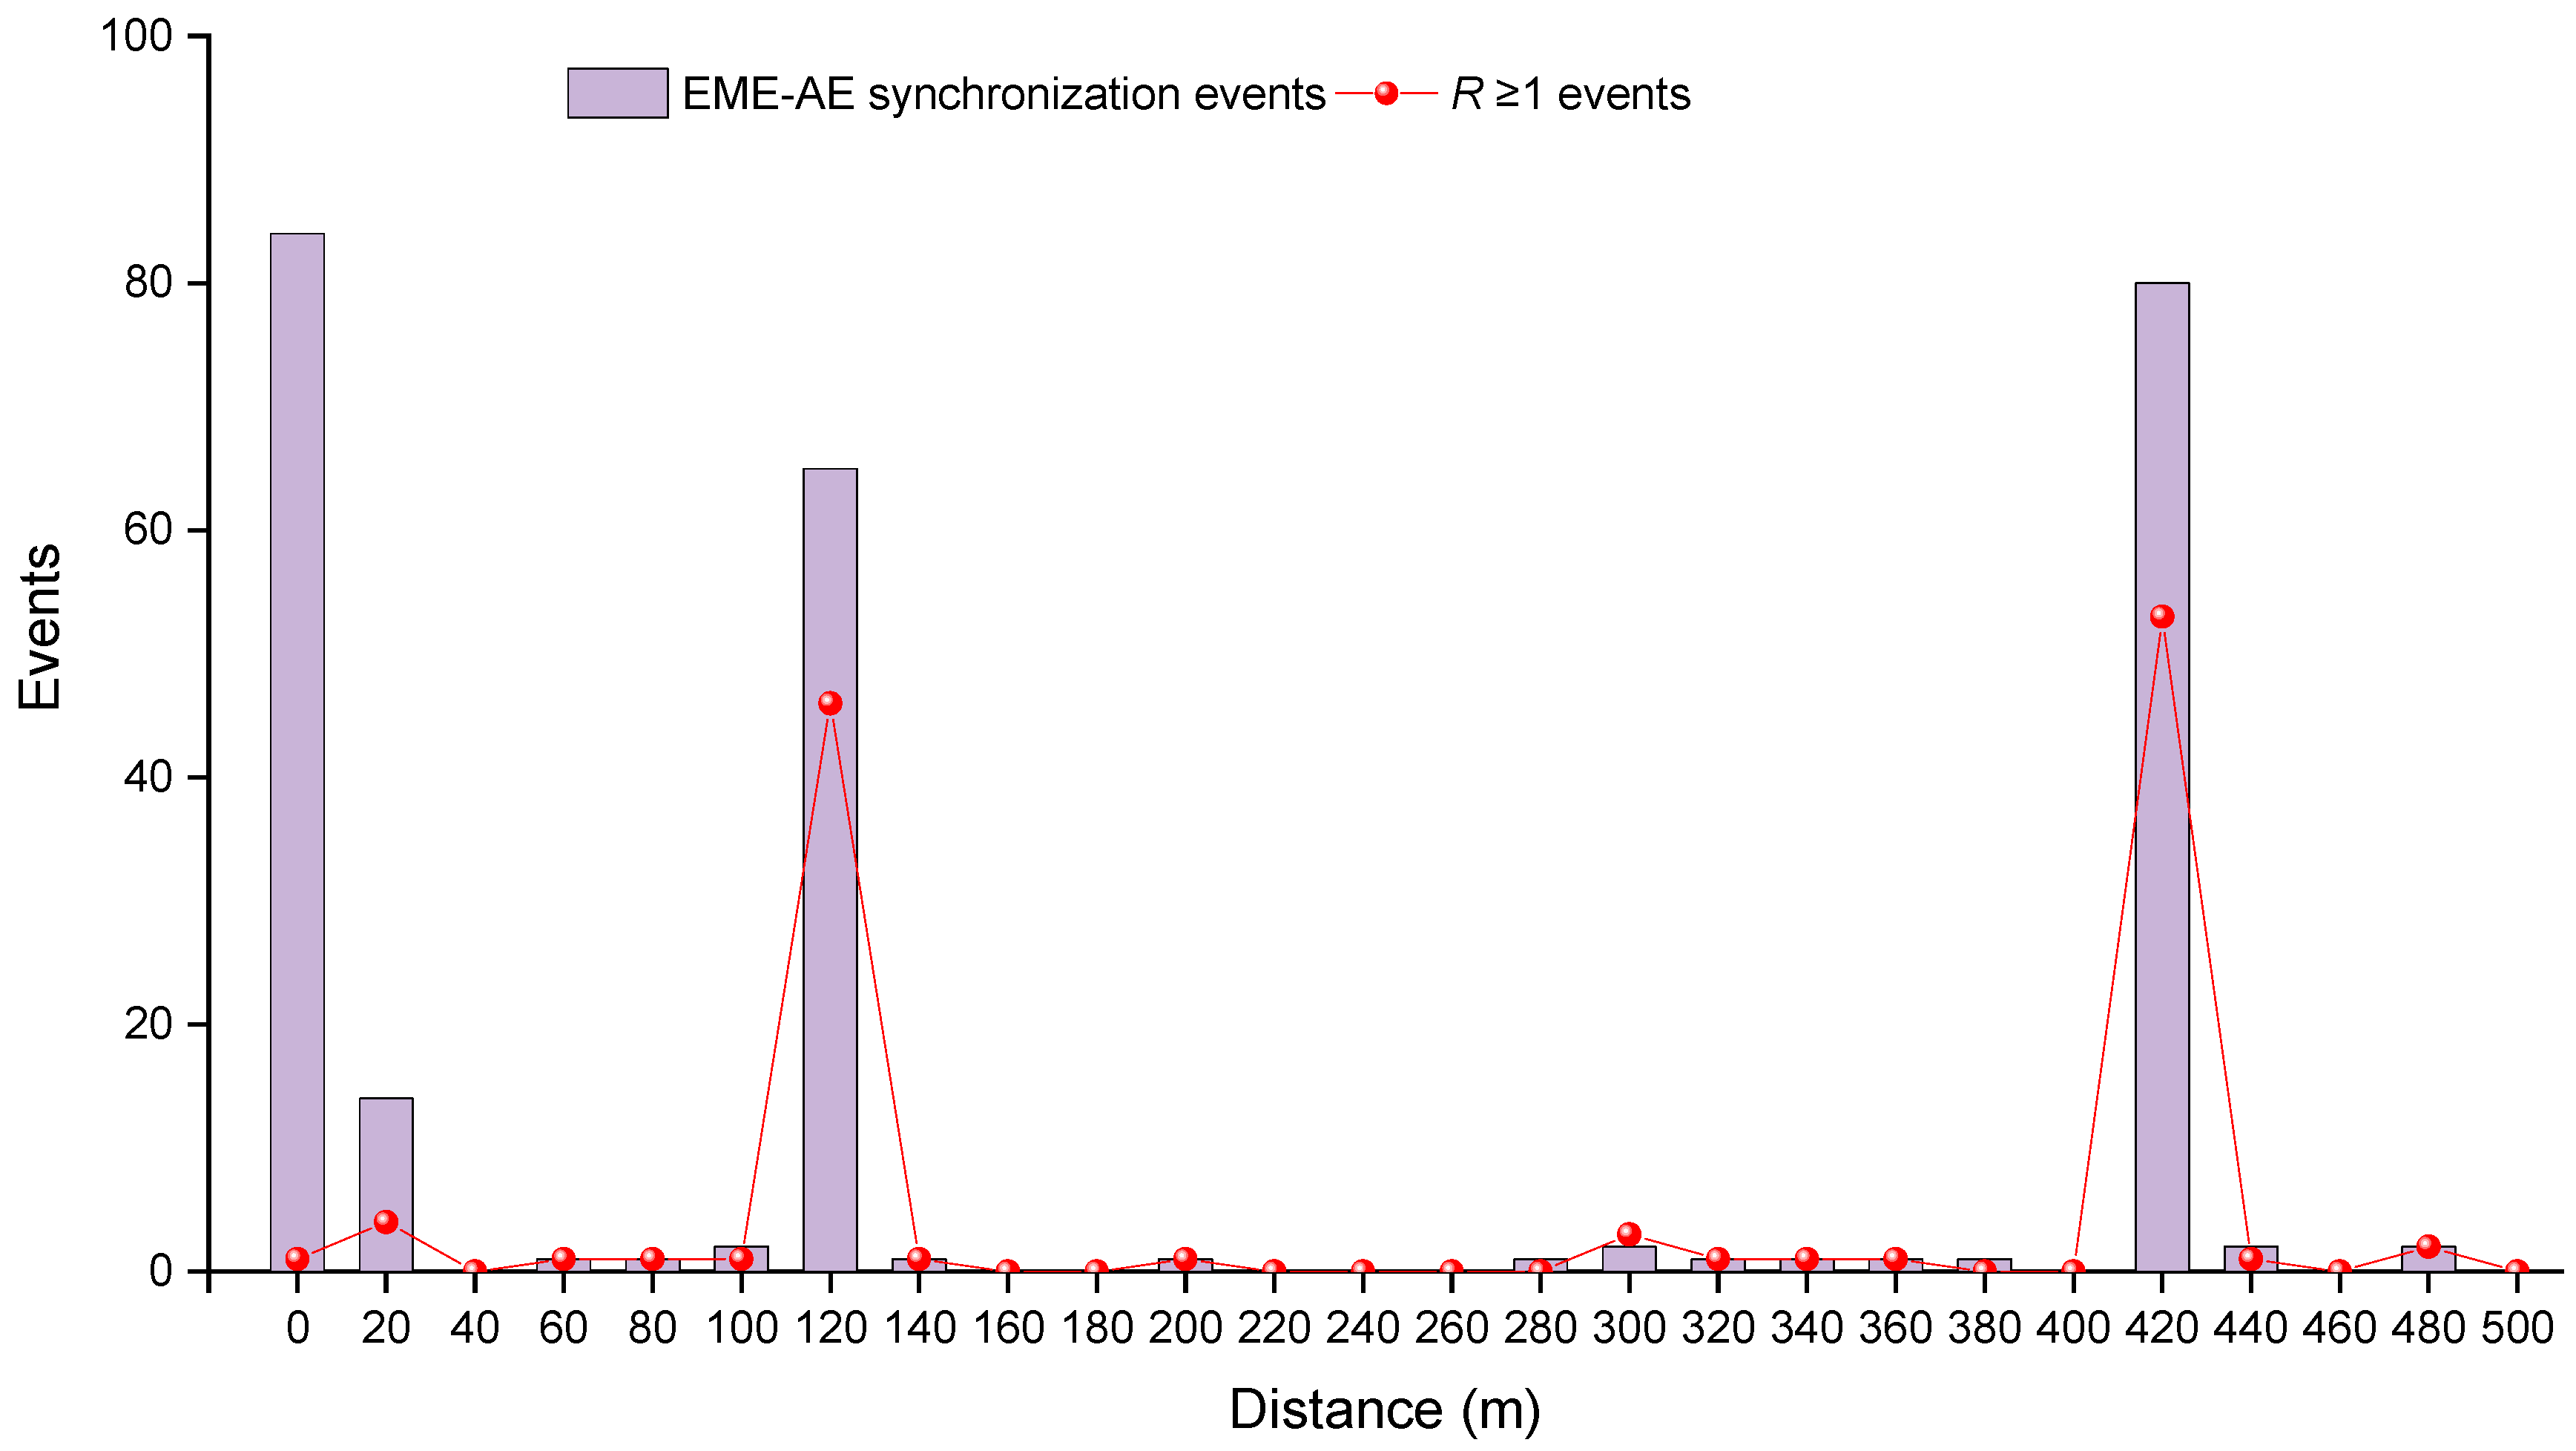
Based on R exponential analysis, the statistical results of R > 1 events at each point are shown in Figure 10. Within the 90 s, the number of R > 1 events at 120 m and 420 m exceeded 40. However, at 0 m and 20 m, while there were more acoustic and electrical synchronization events, there were fewer R > 1 event, which may have been caused by fan cables and fan vibration interference at the entrance to the tunnel. Therefore, the risks of 0 and 20 m were ruled out. In conclusion, the dynamic disaster risk of coal and rock at 120 m and 420 m on tunnel 11,224 was determined by using the acoustic-electric synchronization response time R value.
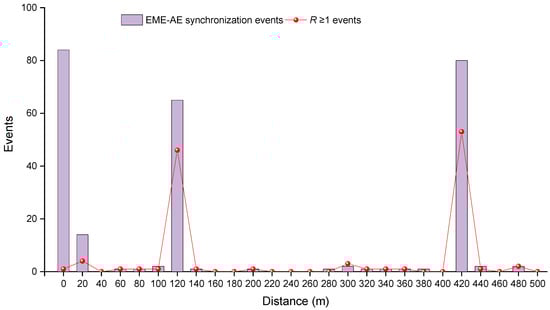
Figure 10.
Acoustic-electric synchronous response time and R > 1 value event.
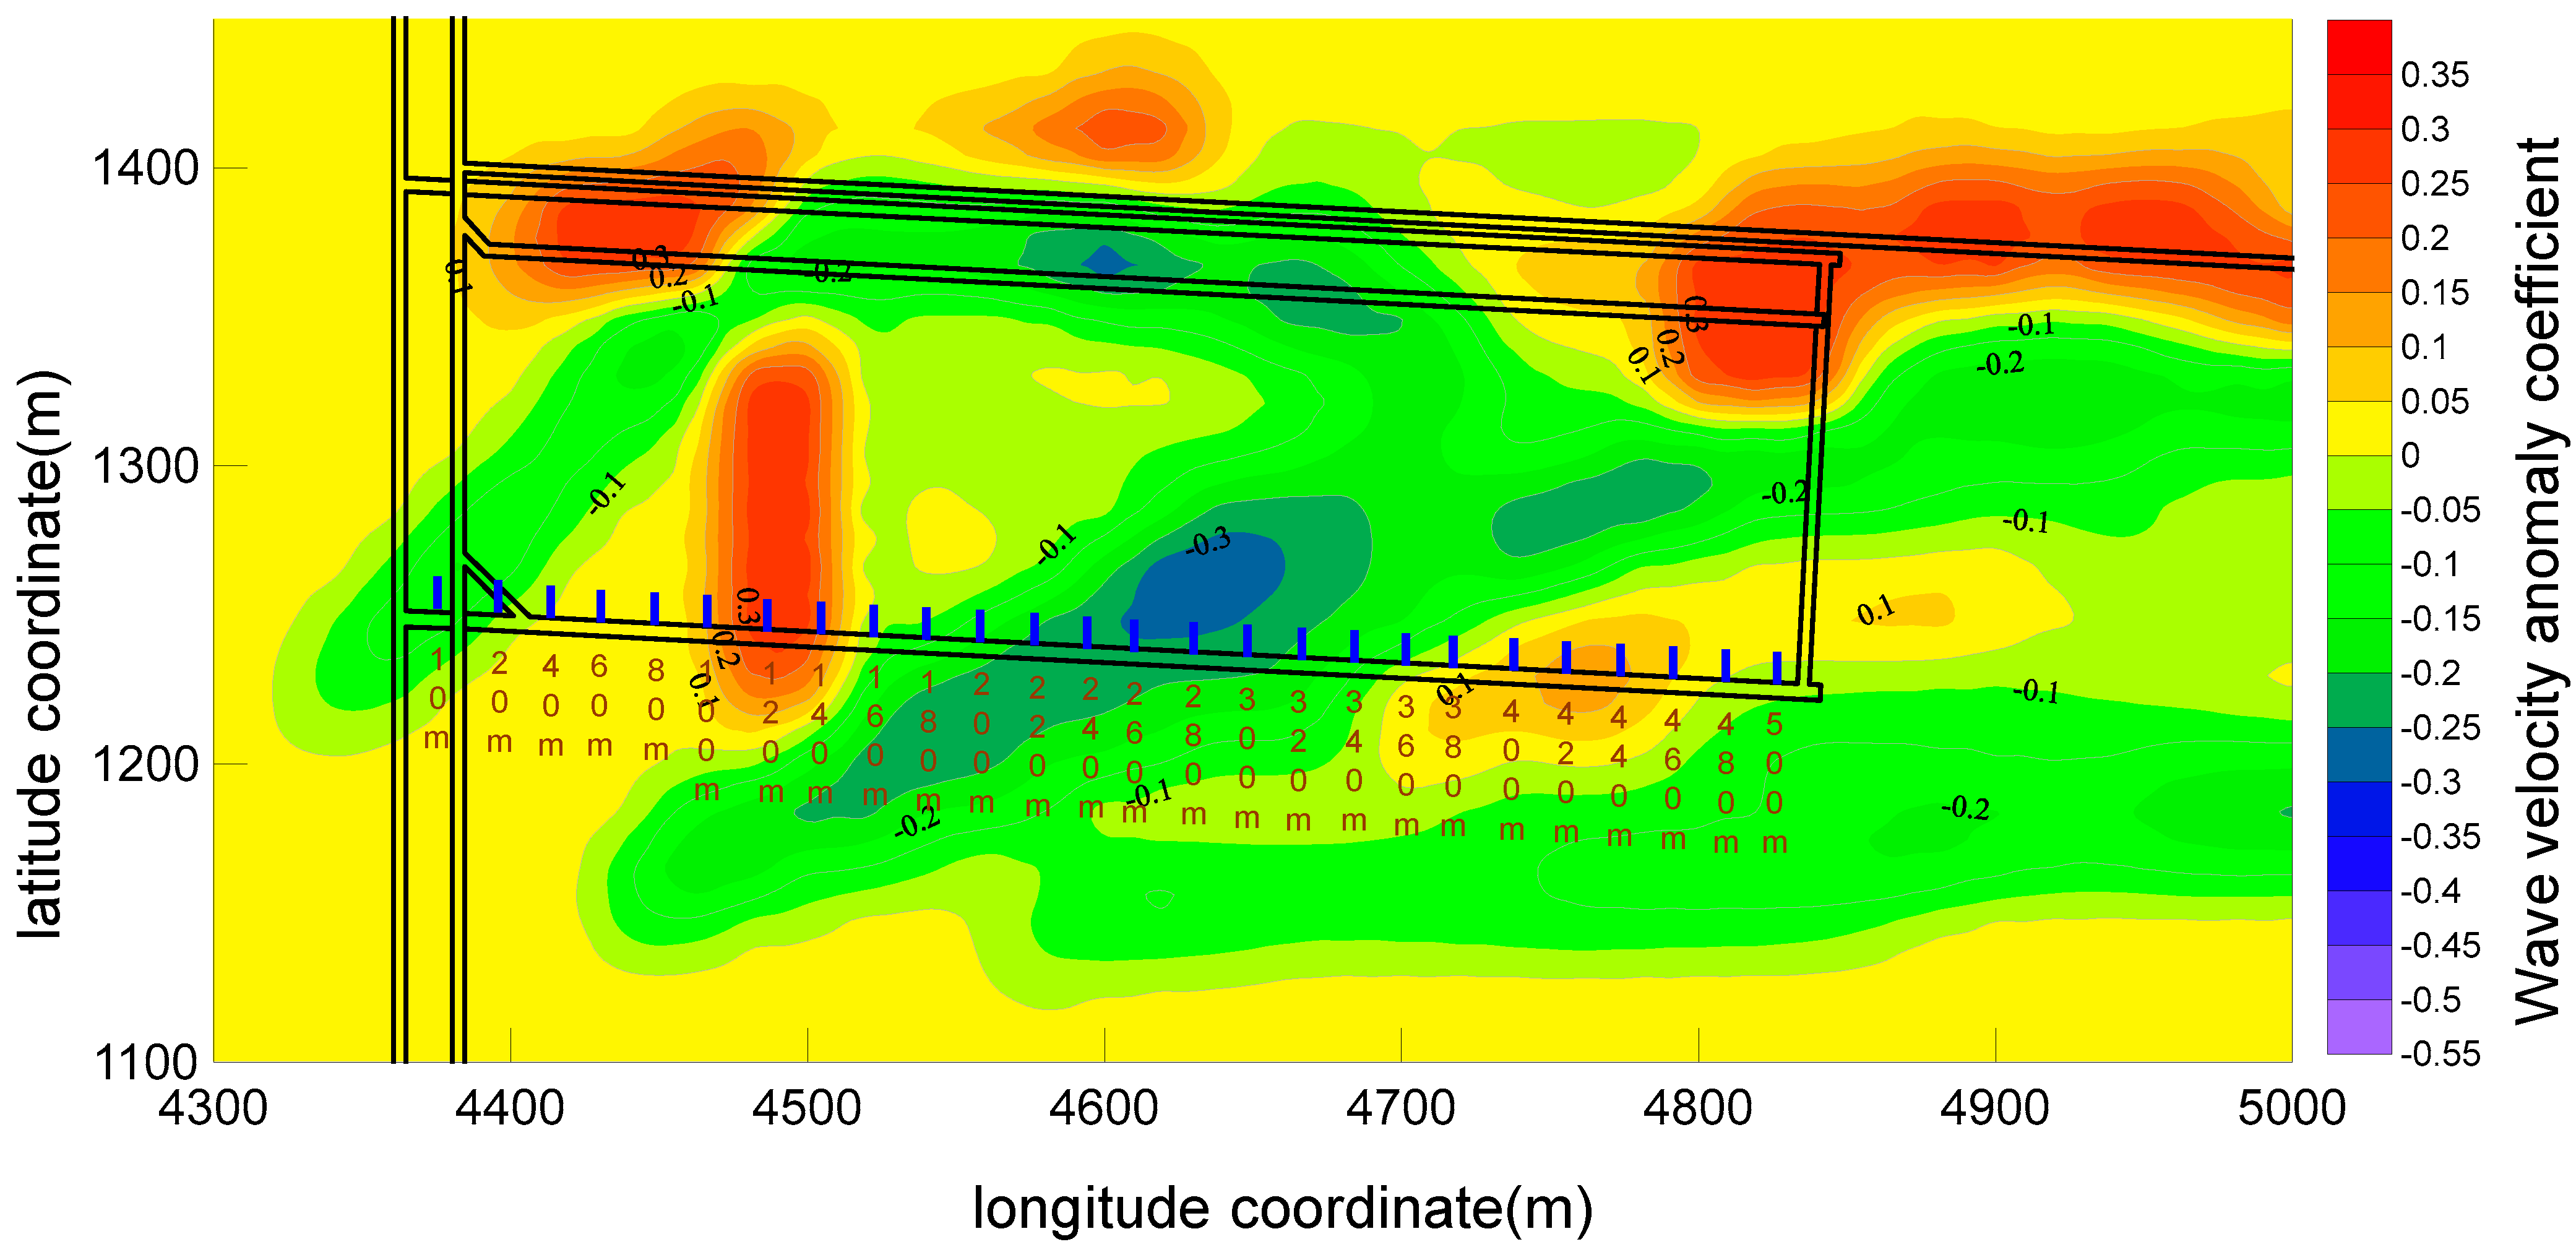
In order to verify the accuracy of this indicator used in the field, the microseismic data monitored at the 11,224 working face were used to back-calculate the distribution of coal seam vibration wave velocity field, and the areas with abnormally high vibration wave velocity have higher stress and risk of coal rock dynamic disaster occurrence [31,32]. Microseism pickups near the 11,224 working face are arranged as shown in Figure 11, and the probe can cover the working face completely to ensure the microseism monitoring data and wave velocity back-calculation. The accuracy of microseism monitoring data and wave velocity inverse calculation is guaranteed. The results of wave velocity anomaly inversion calculation are shown in Figure 12. The results show that the wave velocity anomaly increases by more than 10% in two areas between 100~140 m and 390~440 m in the haulage roadway of 11,224 working face.

Figure 11.
Microseism probe arrangement diagram.
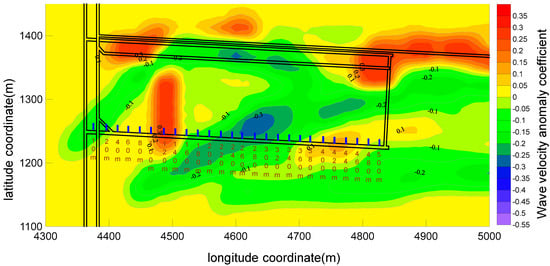
Figure 12.
Wave velocity anomaly cloud chart and acoustic-electric measurement points.
In order to obtain a clearer picture of the associated anomalies, the comparison of the relationship between the wave velocity anomalies and the R value is shown in Figure 13. It can be observed that the number of R > 1 events were more than 40 in regions with abnormally high wave velocity, indicating that there is obvious coal and rock stress concentration in this area. However, the number of R > 1 events were between zero and two in regions with normal or low wave velocity, which indicates that there is no stress concentration or that the coal and rock mass have been broken in areas with abnormal wave velocity. Compared with a single index, such as acoustic and electric energy, the corresponding relationship between R-value index and stress concentration is stronger. This is mainly because the energy indicators are more susceptible to field interference, and the R index of synchronous acoustic and electrical response signals can effectively avoid the interference of field operation vibration and cable magnetic field to an acoustic signal and integrate the acoustic index to realize unified warning. At the same time, compared with the region of abnormally high wave velocity, the region of supercritical R value is significantly higher and the region of the frequency is smaller. This also explains the advantages of acoustic and electrical equipment in the accurate monitoring of regional-scale studies. The synchronous acoustic-electric warning can reduce the warning range efficiently so that more accurate disaster prevention and mitigation measures can be taken.
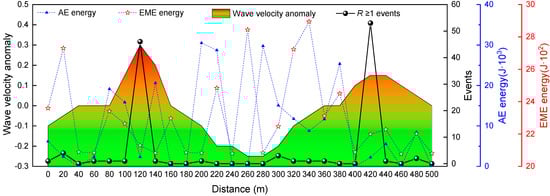
Figure 13.
Comparison of the number of R > 1 events and the average acoustic-electric energy, corresponding to the wave velocity at different measurement points.
5. Conclusions
In this paper, uniaxial compression tests were carried out on coal samples of coal mines with the risk of coal and rock dynamic disasters, and the AE and EME signal characteristics of different coal and rock dynamic disaster mine samples were analyzed. The R value, which is a dimensionless early warning index of AE and EME was proposed for local hazard warning of power disasters and verified through the on-site application. The main conclusions are as follows.
- (1)
- During uniaxial loading, the AE and EME signals increase significantly and appear strongly synchronized after entering strain strengthening area. With a significant reduction in the load in the strain-reinforced zone and before and after entering the damaged zone, the synchronization of the AE and EME signal is the strongest. At this stage, it can accurately reflect the coal mass entering the damage danger zone.
- (2)
- The R value, the fusion unified dimensionless index of AE and EME, can well reflect whether the coal mass entered the damage danger zone and can be regarded as one of the precursors of the imminent failure of coal and rock. When R > 1, it indicates that the specimen is about to enter or has entered the failure danger zone, and the more concentrated the R > 1 event, the greater the danger.
- (3)
- On-site verification shows that the stress distribution of the roadway has a good correspondence with the number of the R > 1 events. In areas with abnormally increased roadway stress, the number of the R > 1 events in 90 s is greater than 40. In areas with normal or reduced roadway stress, the number of the R > 1 events in 90 s is between zero and two. Compared with the index of AE or EME energy signal, the unified R value index of AE and EME fusion can better reduce the influence of interference factors and can reflect the danger of localized coal and rock dynamic disaster clearly and accurately.
Author Contributions
Y.Z.: Conceptualization, Formal analysis, Investigation, Validation, Writing—original draft. D.S.: Methodology, Conceptualization, Writing—review and editing, Funding acquisition, Supervision. M.W.: Writing—review and editing, Supervision. M.K.: Writing—review and editing. Z.L.: Methodology, Funding acquisition, Writing—review and editing. L.Q.: Funding acquisition, Writing—review and editing. S.Y.: Software, Investigation. All authors have read and agreed to the published version of the manuscript.
Funding
This research was funded by [National Natural Science Foundation] grant number [52174162, 51904019] and [Fundamental Research Funds for the Central Universities] grant number [FRF-TP-20-002A3].
Institutional Review Board Statement
Not applicable.
Informed Consent Statement
Not applicable.
Data Availability Statement
The source data is in our closed database. The corresponding author can provide partial upon request.
Conflicts of Interest
The authors declare no conflict of interest.
References
- Dou, L.; He, X. Theory and Technology of Rock Burst Prevention; China University of Mining and Technology Press: Xuzhou, China, 2001. [Google Scholar]
- Lu, C.; Liu, Y.; Liu, G.; Zhao, T. Stress evolution caused by hard roof fracturing and associated multi-parameter precursors. Tunn. Undergr. Space Technol. 2019, 84, 295–305. [Google Scholar] [CrossRef]
- Qiu, L.; Wang, E.; Song, D.; Liu, Z.; Shen, R.; Lv, G.; Xu, Z. Measurement of the stress field of a tunnel through its rock EMR. J. Geophys. Eng. 2017, 14, 949–959. [Google Scholar] [CrossRef]
- Liu, X.; Wang, E. Study on characteristics of EMR signals induced from fracture of rock samples and their application in rockburst prediction in copper mine. J. Geophys. Eng. 2018, 15, 909–920. [Google Scholar] [CrossRef]
- Contoyiannis, Y.; Potirakis, S. Signatures of the symmetry breaking phenomenon in pre-seismic electromagnetic emissions. J. Stat. Mech. 2018, 2018, 083208. [Google Scholar] [CrossRef]
- Carpinteri, A.; Borla, O. Acoustic, electromagnetic, and neutron emissions as seismic precursors: The lunar periodicity of low-magnitude seismic swarms. Eng. Fract. Mech. 2019, 210, 29–41. [Google Scholar] [CrossRef]
- Frid, V.; Rabinovitch, A.; Bahat, D. Seismic moment estimation based on fracture induced electromagnetic radiation. Eng. Geol. 2020, 274, 105692. [Google Scholar] [CrossRef]
- Potirakis, S.M.; Contoyiannis, Y.; Schekotov, A.; Eftaxias, K.; Hayakawa, M. Evidence of critical dynamics in various electromagnetic precursors. Eur. Phys. J. Spec. Top. 2021, 230, 151–177. [Google Scholar] [CrossRef]
- Tsutsumi, A.; Shirai, N. Electromagnetic signals associated with stick–slip of quartz-free rocks. Tectonophysics 2008, 450, 79–84. [Google Scholar] [CrossRef]
- Nitsan, U. Electromagnetic emission accompanying fracture of quartz-bearing rocks. Geophys. Res. Lett. 1977, 4, 333–336. [Google Scholar] [CrossRef]
- Alekseev, D.V.; Egorov, P.V.; Ivanov, V.V. Mechanisms of electrification of cracks and electromagnetic precursors of rock fracture. J. Min. Sci. 1993, 28, 515–519. [Google Scholar] [CrossRef]
- O’Keefe, S.G.; Thiel, D.V. A mechanism for the production of electromagnetic radiation during fracture of brittle materials. Phys. Earth Planet. Inter. 1995, 89, 127–135. [Google Scholar] [CrossRef]
- Frid, V.; Rabinovitch, A.; Bahat, D. Fracture induced electromagnetic radiation. J. Phys. D Appl. Phys. 2003, 36, 1620. [Google Scholar] [CrossRef]
- Rabinovitch, A.; Frid, V.; Bahat, D. Surface oscillations—A possible source of fracture induced electromagnetic radiation. Tectonophysics 2007, 431, 15–21. [Google Scholar] [CrossRef]
- Rabinovitch, A.; Frid, V.; Bahat, D. Directionality of electromagnetic radiation from fractures. Int. J. Fract. 2017, 204, 239–244. [Google Scholar] [CrossRef]
- Wang, E.Y.; He, X.Q. An experimental study of the electromagnetic emission during the deformation and fracture of coal or rock. Chin. J. Geophys. 2000, 43, 134–140. [Google Scholar] [CrossRef]
- Frid, V. Rockburst hazard forecast by electromagnetic radiation excited by rock fracture. Rock Mech. Rock Eng. 1997, 30, 229–236. [Google Scholar] [CrossRef]
- Frid, V. Electromagnetic radiation method for rock and gas outburst forecast. J. Appl. Geophys. 1997, 38, 97–104. [Google Scholar] [CrossRef]
- He, X.; Nie, B.; Chen, W.; Wang, E.; Dou, L.; Wang, Y.; Liu, M.; Hani, M. Research progress on electromagnetic radiation in gas-containing coal and rock fracture and its applications. Saf. Sci. 2012, 50, 728–735. [Google Scholar] [CrossRef]
- He, X.; Dou, L.; Mu, Z.; Gong, S.; Cao, A.; He, J. Continuous monitoring and warning theory and technology of rock burst dynamic disaster of coal. J. China Coal Soc. 2014, 39, 1485–1491. [Google Scholar]
- He, X.; Chen, W.; Nie, B.; Mitri, H. Electromagnetic emission theory and its application to dynamic phenomena in coal-rock. Int. J. Rock Mech. Min. 2011, 48, 1352–1358. [Google Scholar] [CrossRef]
- Song, D.; Wang, E.; Song, X.; Jin, P.; Qiu, L. Changes in frequency of electromagnetic radiation from loaded coal rock. Rock Mech. Rock Eng. 2016, 49, 291–302. [Google Scholar] [CrossRef]
- Song, D.; Wang, E.; He, X.; Jia, H.; Qiu, L.; Chen, P.; Wang, S. Use of electromagnetic radiation from fractures for mining-induced stress field assessment. J. Geophys. Eng. 2018, 15, 1093–1103. [Google Scholar] [CrossRef]
- Wang, C.L.; Chen, Z.; Liao, Z.F.; Hou, X.L.; Li, H.T.; Wang, A.W.; Li, C.Z.; Qian, P.F.; Li, G.S.; Lu, H. Experimental investigation on predicting precursory changes in entropy for dominant frequency of rockburst. J. Cent. South Univ. 2020, 27, 2834–2848. [Google Scholar] [CrossRef]
- Lacidogna, G.; Carpinteri, A.; Manuello, A.; Durin, G.; Schiavi, A.; Niccolini, G.; Agosto, A. Acoustic and electromagnetic emissions as precursor phenomena in failure processes. Strain 2011, 47, 144–152. [Google Scholar] [CrossRef]
- Lou, Q.; Song, D.; He, X.; Li, Z.; Qiu, L.; Wei, M.; He, S. Correlations between acoustic and electromagnetic emissions and stress drop induced by burst-prone coal and rock fracture. Saf. Sci. 2019, 115, 310–319. [Google Scholar] [CrossRef]
- Wei, M.; Song, D.; He, X.; Li, Z.; Qiu, L.; Lou, Q. Effect of rock properties on electromagnetic radiation characteristics generated by rock fracture during uniaxial compression. Rock Mech. Rock Eng. 2020, 53, 5223–5238. [Google Scholar] [CrossRef]
- Wang, E.Y.; Liu, X.F.; He, X.Q.; Li, Z.L. Acoustic emission and electromagnetic radiation synchronized monitoring technology and early-warning application for coal and rock dynamic disaster. J. China Univ. Min. Technol. 2018, 47, 942–948. [Google Scholar]
- Hall, S.A.; Sanctis, F.; Viggiani, G. Monitoring fracture propagation in a soft rock (Neapolitan Tuff) using acoustic emissions and digital images. Pure Appl. Geophys. 2006, 163, 2171–2204. [Google Scholar] [CrossRef]
- Byun, Y.S.; Sagong, M.; Kim, S.C.; Chun, B.S.; Park, S.Y.; Jung, H.S. A study on using acoustic emission in rock slope with difficult ground—Focused on rainfall. Geosci. J. 2012, 16, 435–445. [Google Scholar] [CrossRef]
- Zhao, Y.; Song, D.; Qiu, L.; Wang, A. Research on seismic wave CT technology application in stress field detection of outburst coal seam. J. Chin. Sci. Pap. 2021, 16, 82–90. [Google Scholar]
- Dou, L.; Cai, W.; Gong, S.; Han, R.; Liu, J. Dynamic risk assessment of rock burst based on the technology of seismic computed tomography detection. J. Coal 2014, 39, 238–244. [Google Scholar]


Publisher’s Note: MDPI stays neutral with regard to jurisdictional claims in published maps and institutional affiliations. |
© 2022 by the authors. Licensee MDPI, Basel, Switzerland. This article is an open access article distributed under the terms and conditions of the Creative Commons Attribution (CC BY) license (https://creativecommons.org/licenses/by/4.0/).