
Using Machine Learning to Improve Vector Control, Public Health and Reduce Fragmentation of Urban Water Management


Abstract
1. Introduction
2. Materials and Methods
2.1. Statistics Analysis
2.2. Regression Trees
3. Results
3.1. Water Supply and Sanitary Wastewater Service Indicators
3.1.1. Characterization of the Sample and Descriptive Statistics
3.1.2. Water Supply and Wastewater Indicators—AEIN
3.1.3. Regression Trees
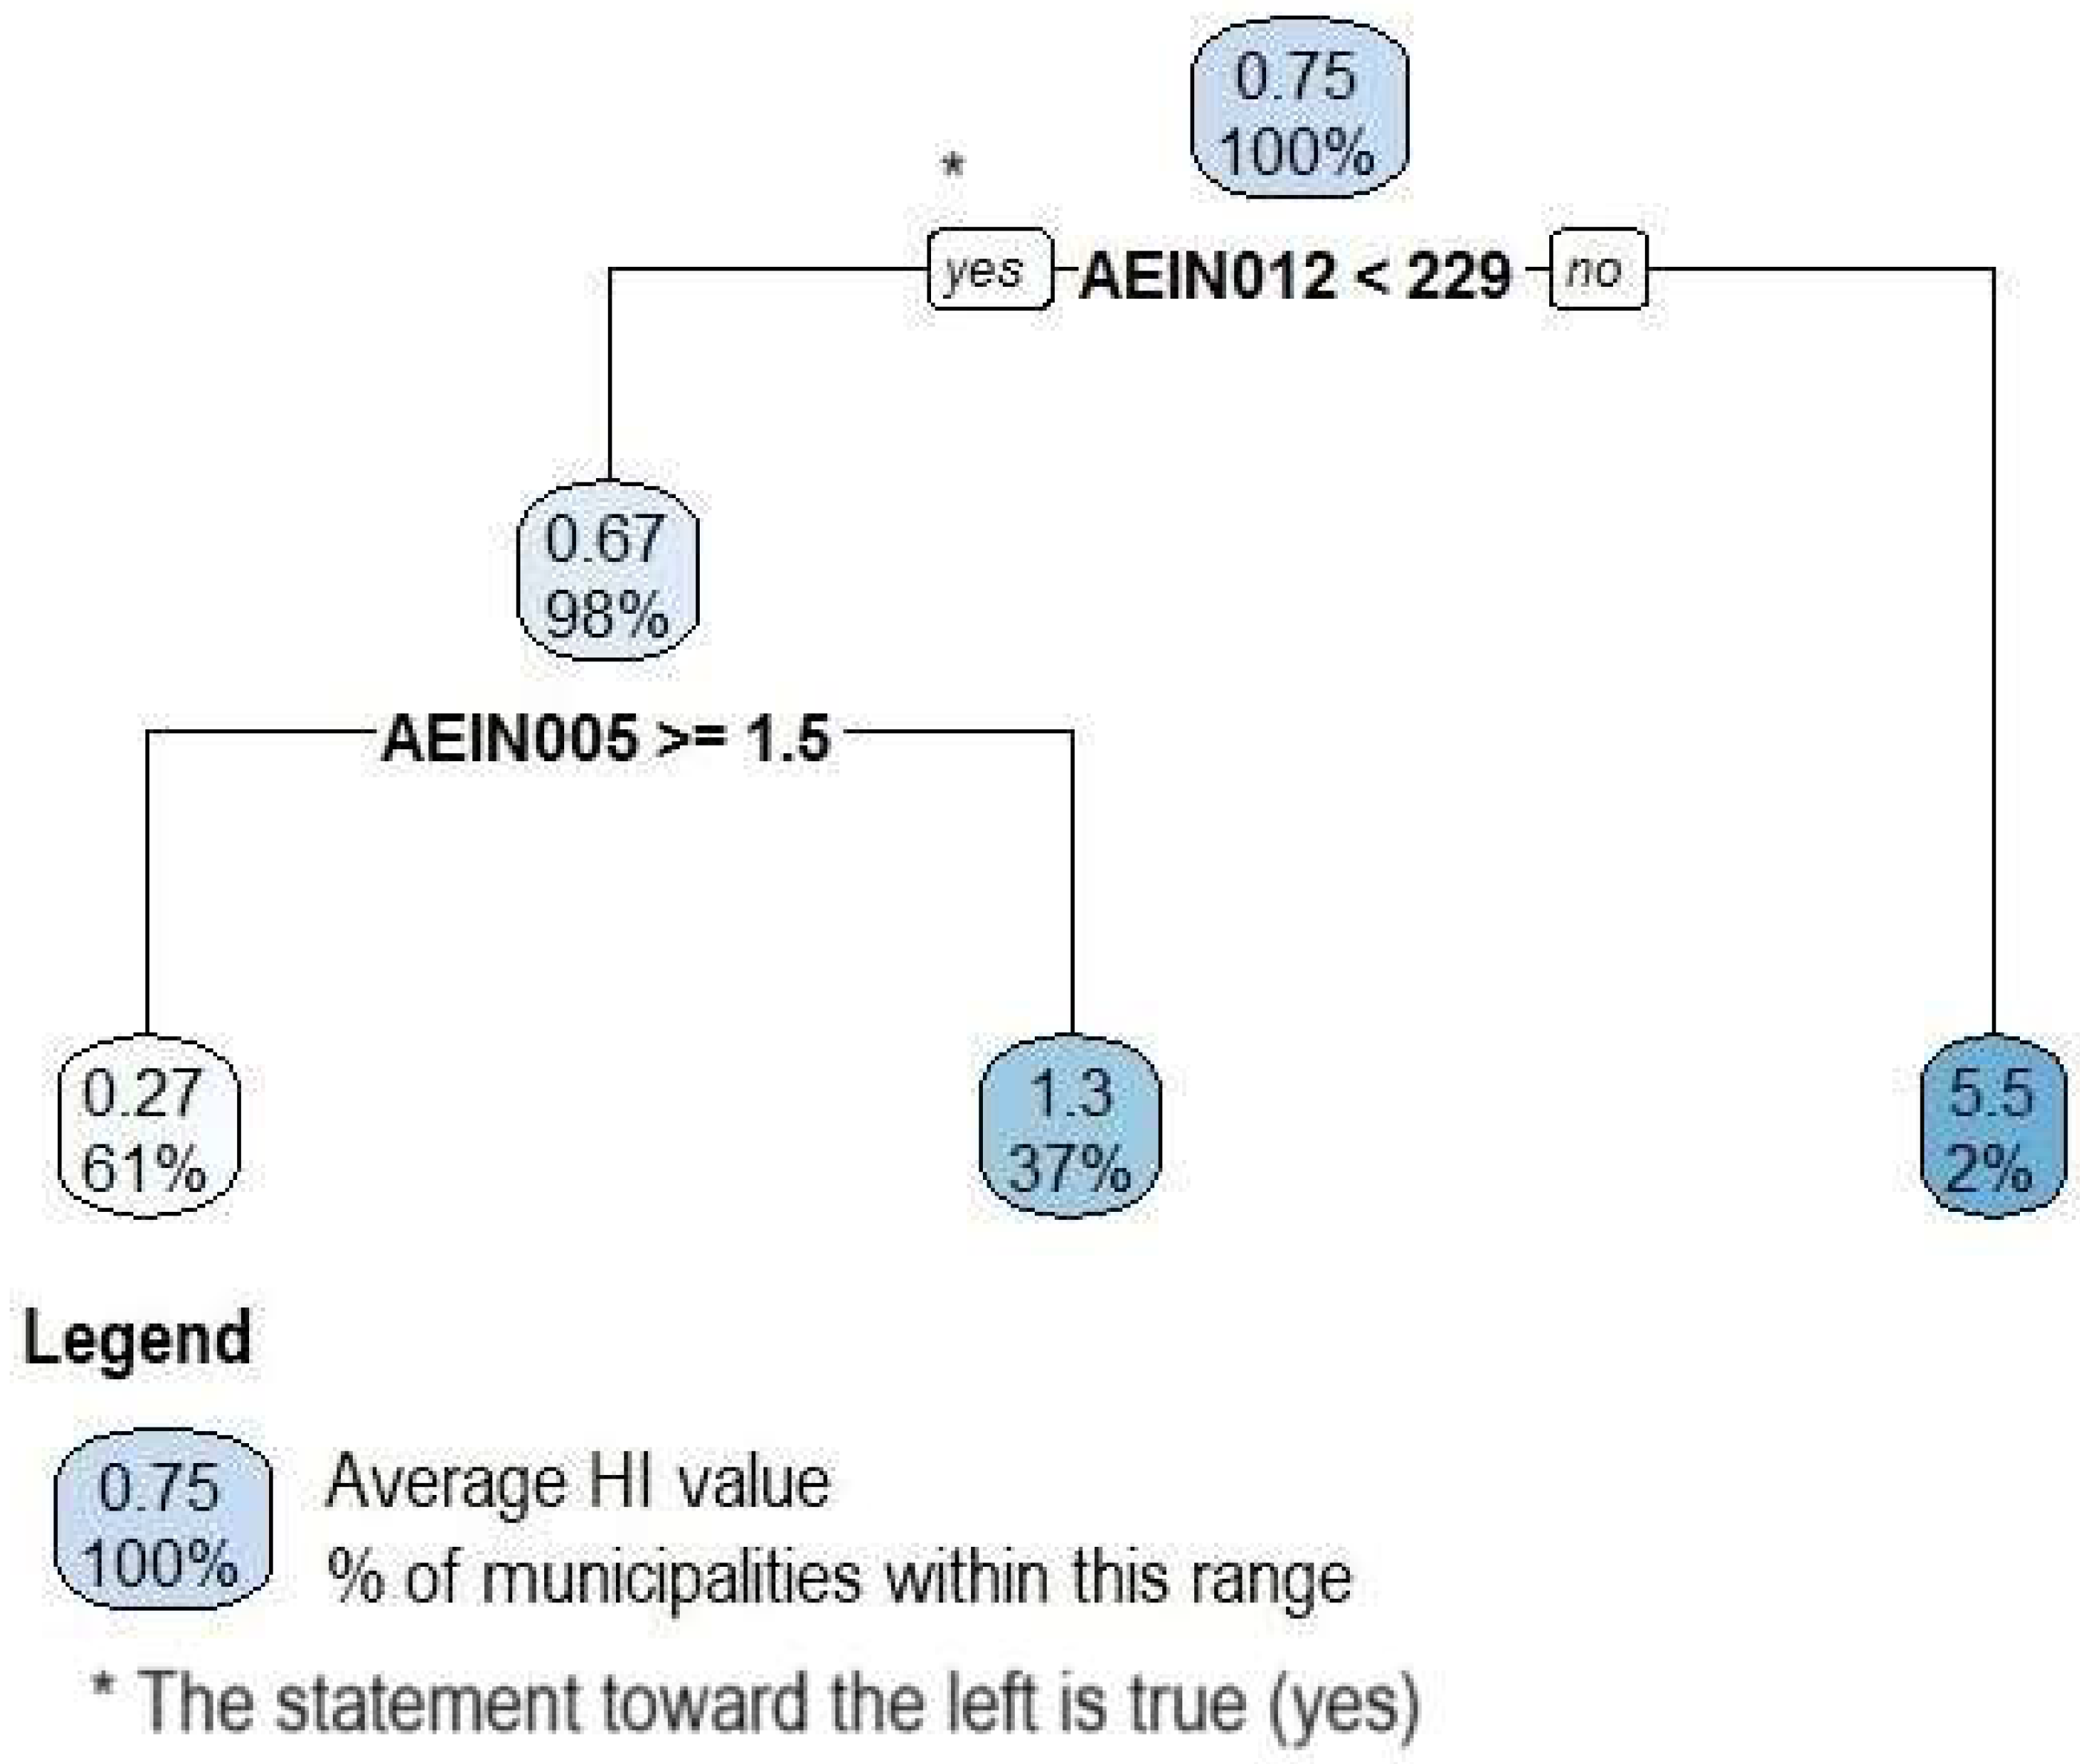
Midwestern Region
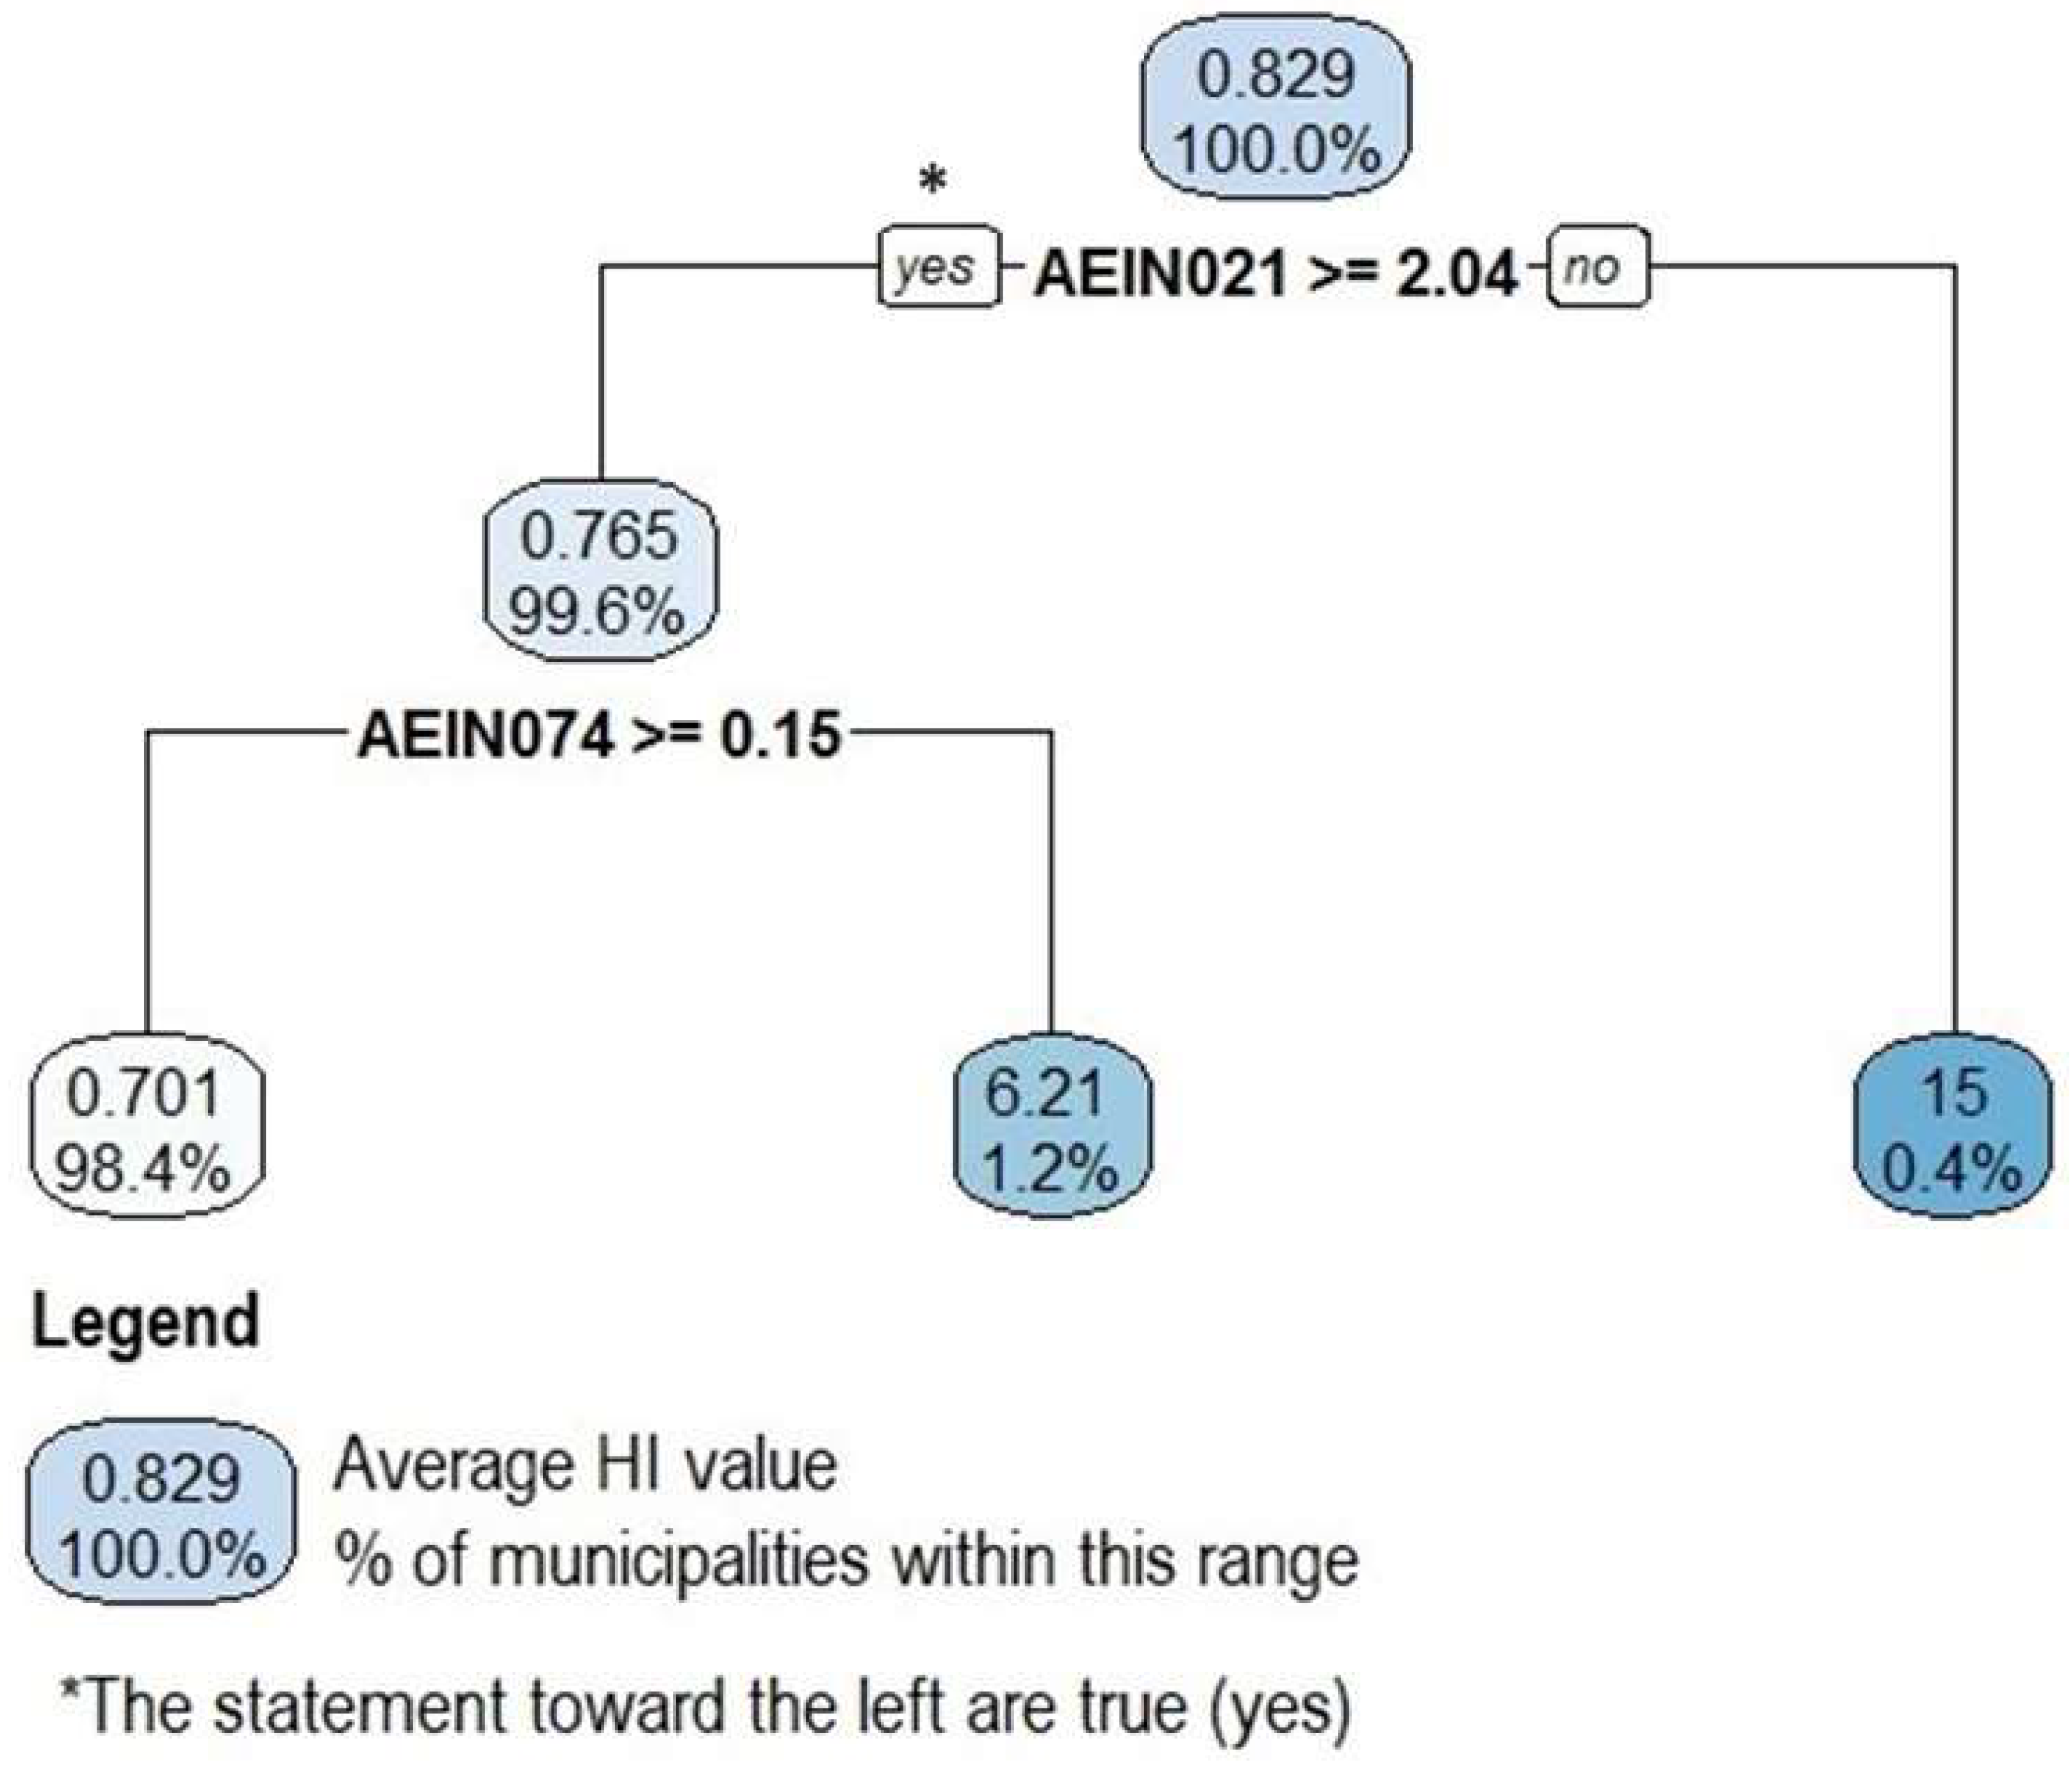
Northeastern Region
Northern Region
Southeastern Region
Southern Region
Comparison of Regional Results
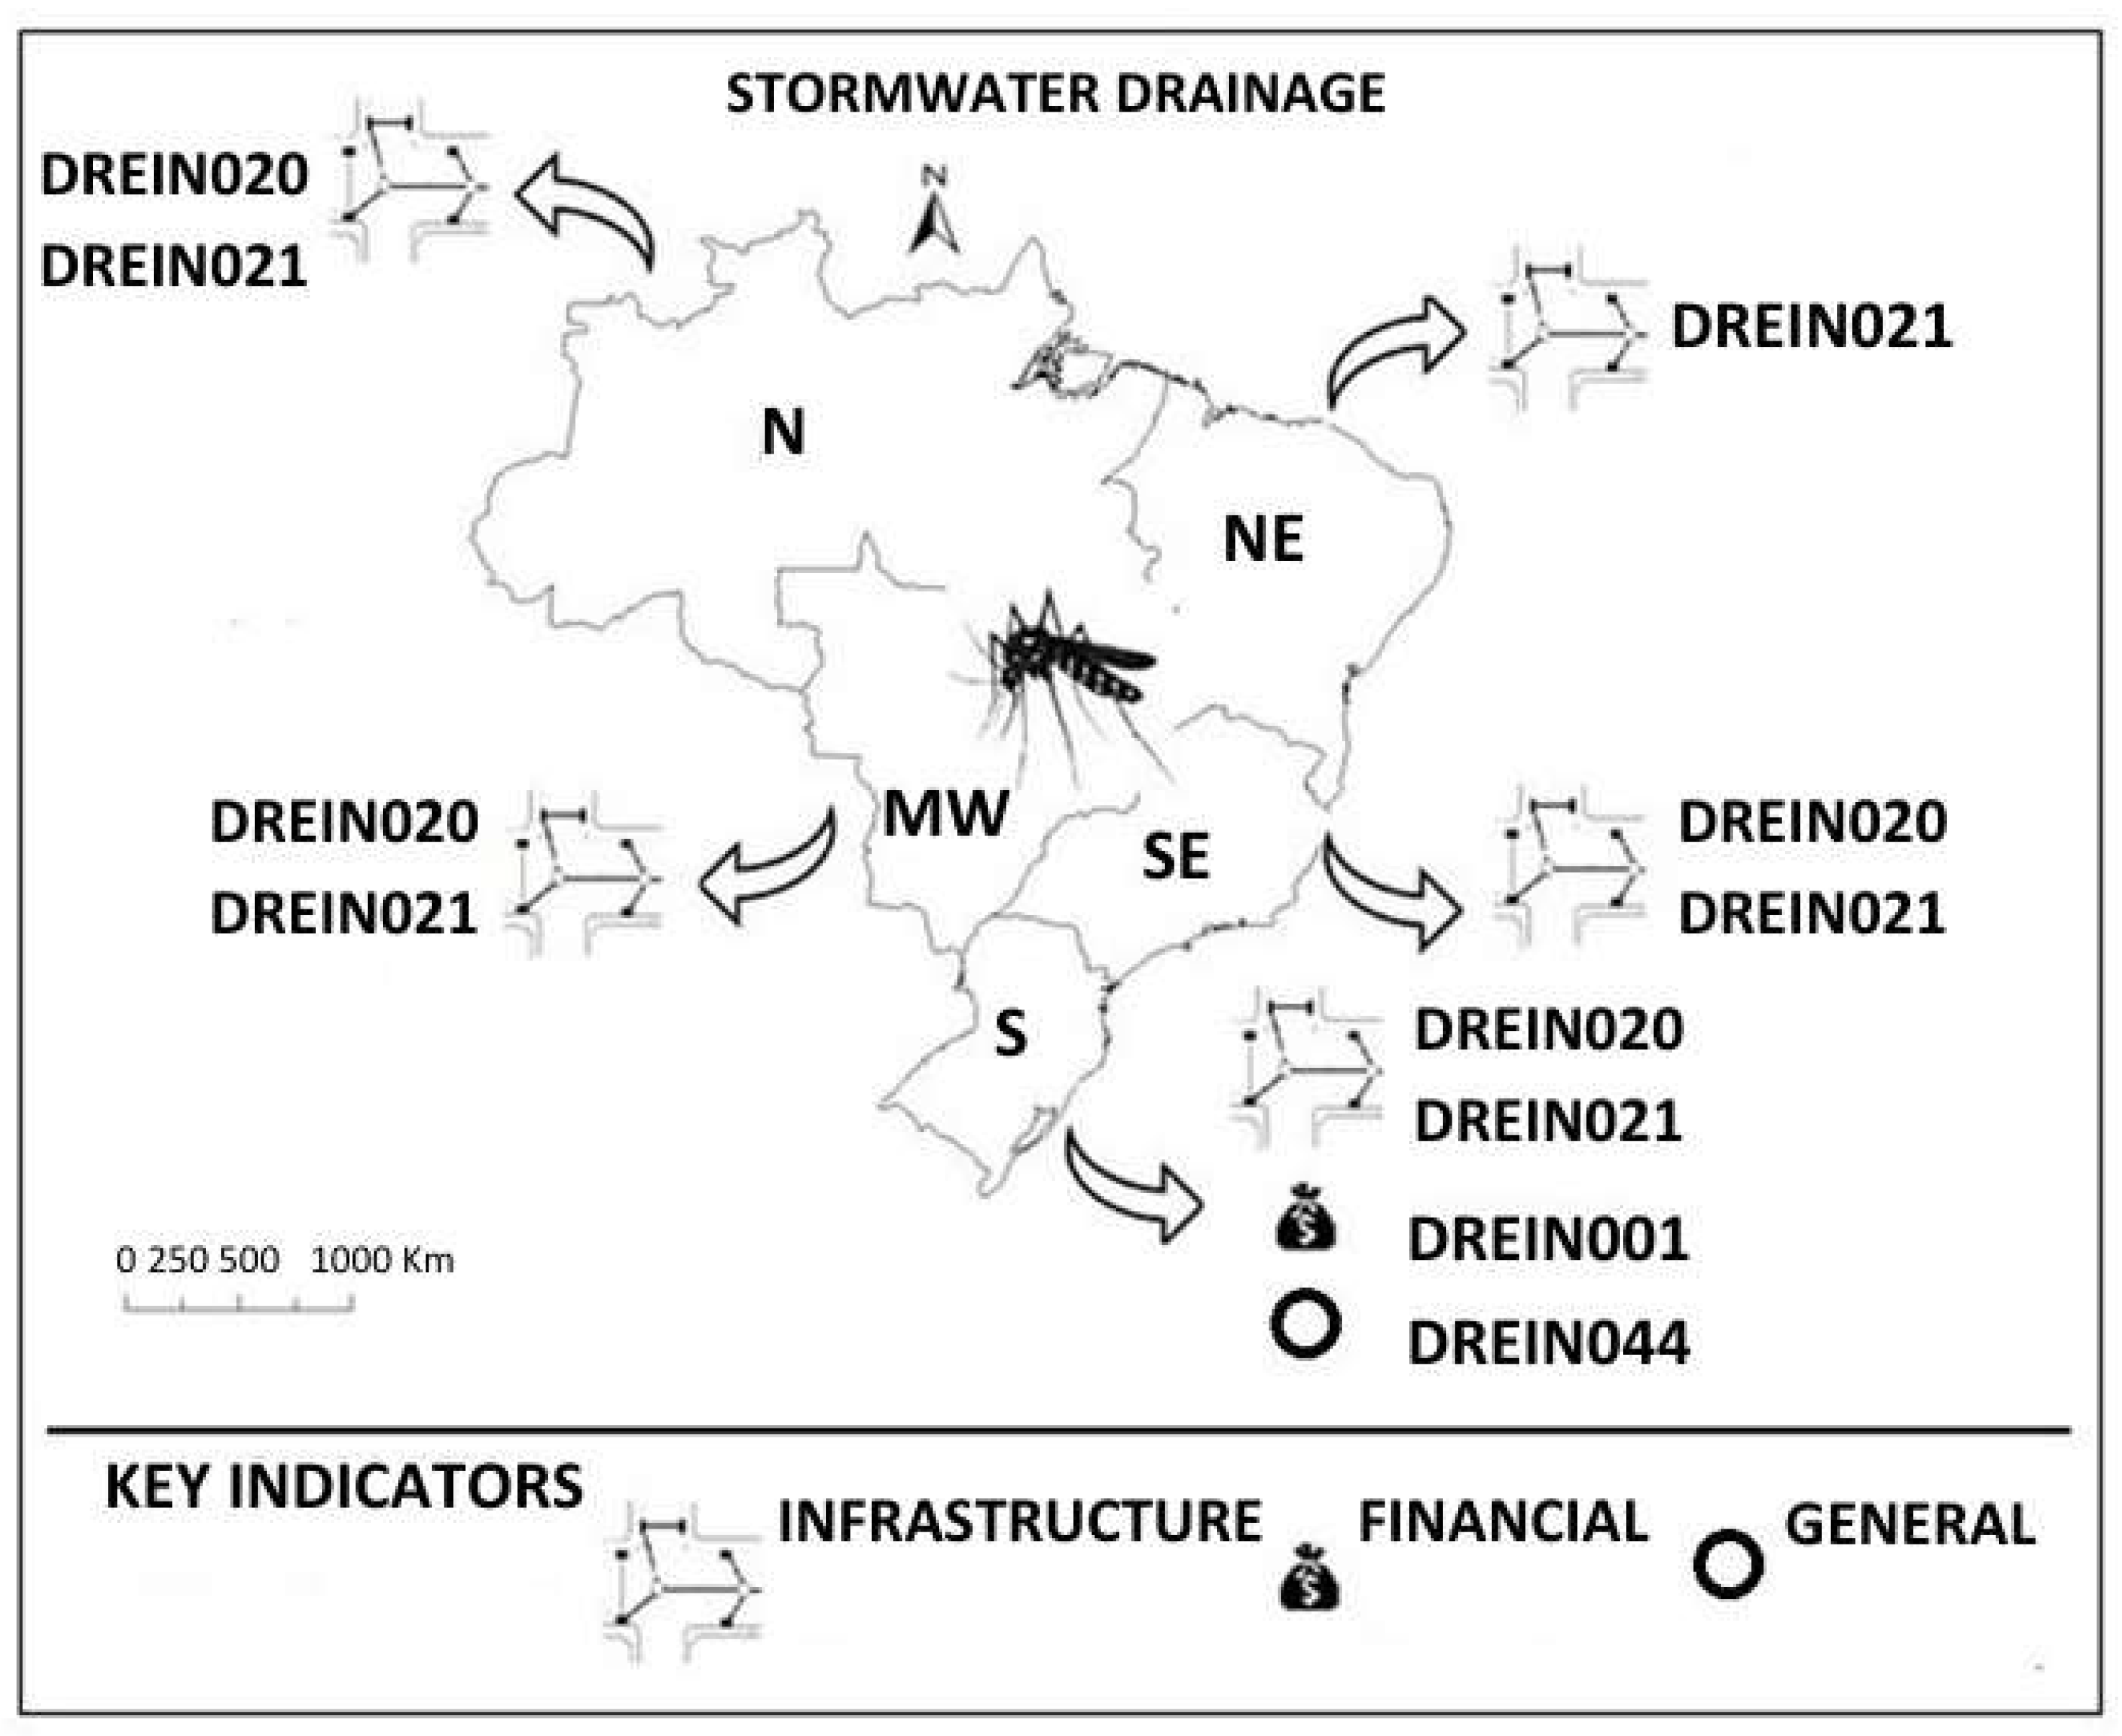
3.2. Stormwater Management Indicators
3.2.1. Descriptive Statistics
3.2.2. Variable Selection
3.2.3. Regression Trees
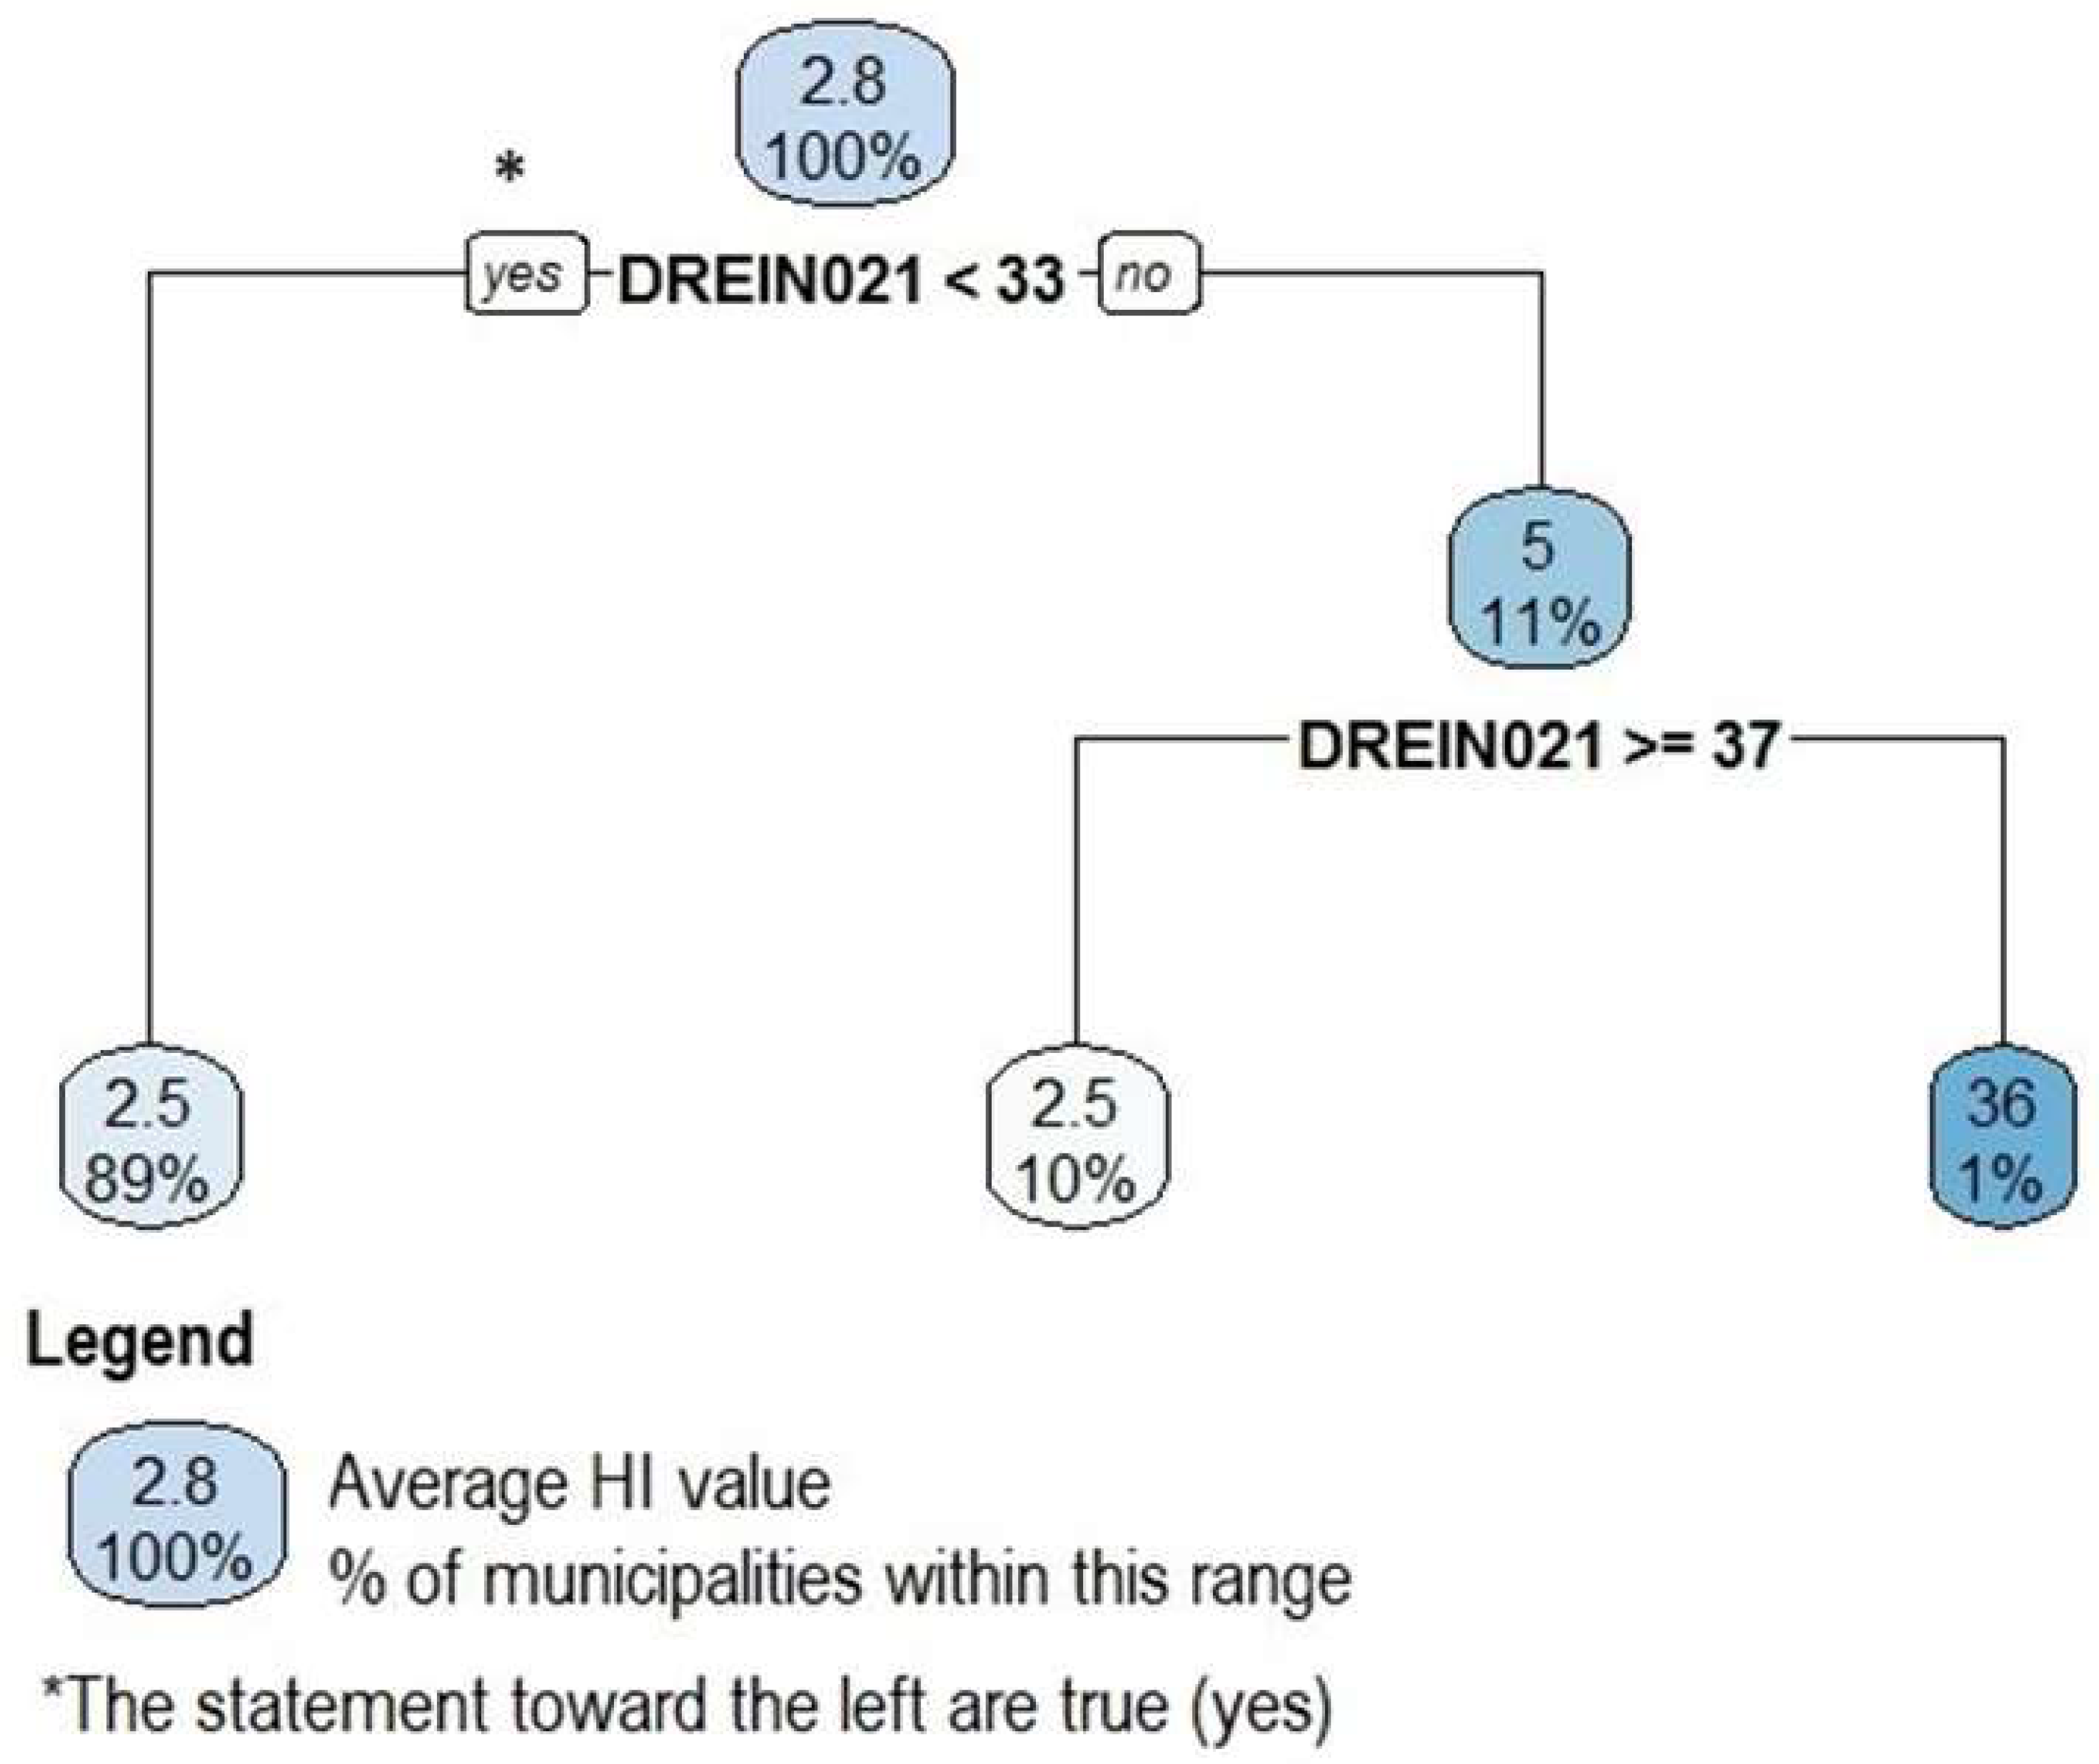
Midwestern Region
Northeastern Region
Northern Region
Southeastern Region
Southern Region
3.2.4. Regional Errors
3.2.5. Inter-Regional Comparisons
4. Discussion
5. Conclusions
Author Contributions
Funding
Informed Consent Statement
Data Availability Statement
Conflicts of Interest
References
- Carmon, N.; Shamir, U. Water-sensitive planning: Integrating water considerations into urban and regional planning. Water Environ. J. 2010, 24, 181–191. [Google Scholar] [CrossRef]
- Klafke, F.; Barros, V.G.; Henning, E. Solid waste management and Aedes aegypti infestation interconnections: A regression tree application. Waste Manag. Res. 2023, 41, 1684–1696. [Google Scholar] [CrossRef] [PubMed]
- Celis-Ramírez, M.; Quintero-Angel, M.; Varela-M, R.E. Control of invasive alien species: The Giant African snail (Lissachatina fulica) a difficult urban public management challenge. J. Environ. Manag. 2022, 322, 116159. [Google Scholar] [CrossRef]
- Martínez, L.; Short, J.R. The Pandemic City: Urban Issues in the Time of COVID-19. Sustainability 2021, 13, 3295. [Google Scholar] [CrossRef]
- World Health Organization; UN-Habitat. Integrating Health in Urban and Territorial Planning: A Sourcebook; WHO: Geneva, Switzerland; UN-Habitat: Nairobi, Kenya, 2020. [Google Scholar]
- WHO—World Health Organization. Guidelines on Sanitation and Health; WHO: Geneva, Switzerland, 2018. [Google Scholar]
- Welle, K.; Walnycki, A. Water Supply and Sanitation. In International Encyclopedia of Housing and Home; Smith, S.J., Ed.; Elsevier Science: Cambridge, MA, USA, 2012; pp. 255–260. [Google Scholar]
- Ministério do Desenvolvimento Regional; Secretaria Nacional de Saneamento—SNS. Sistema Nacional de Informações Sobre Saneamento: Diagnóstico dos Serviços de Água e Esgoto; SNS: Brasília, Brazil; MDR: Brasília, Brazil, 2018. [Google Scholar]
- Oneda, T.M.S.; Barros, V.G. On stormwater management master plans: Comparing developed and developing cities. Hydrol. Sci. J. 2021, 66, 1–11. [Google Scholar] [CrossRef]
- Wilke, A.B.B.; Medeiros-Sousa, A.R.; Ceretti-Junior, W.; Marrelli, M.T. Mosquito populations dynamics associated with climate variations. Acta Trop. 2017, 166, 343–350. [Google Scholar] [CrossRef] [PubMed]
- OPAS—Organização Pan-Americana da Saúde. Dengue nas Américas Atinge o Maior Número de Casos já Registrado. 2019. Available online: https://www.paho.org/bra/index.php?option=com_content&view=article&id=6059:dengue-nas-americas-atinge-o-maior-numero-de-casos-ja-registrado&Itemid=812 (accessed on 20 January 2021).
- Chaves, L.F.; Friberg, M.; Moji, K. Synchrony of globally invasive Aedes spp. immature mosquitoes along an urban altitudinal gradient in their native range. Sci. Total Environ. 2020, 734, 139365. [Google Scholar] [CrossRef]
- Trájer, A.J.; Sebestyén, V.; Domokos, E.; Abonyi, J. Indicators for climate change-driven urban health impact assessment. J. Environ. Manag. 2022, 323, 116165. [Google Scholar] [CrossRef]
- Nishijima, M.; Rocha, F.F. An economic investigation of the dengue incidence as a result of a tailings dam accident in Brazil. J. Environ. Manag. 2020, 253, 109748. [Google Scholar] [CrossRef]
- Chen, Y.; Yang, Z.; Jing, Q.; Huang, J.; Guo, C.; Yang, K.; Chen, A.; Lu, J. Effects of natural and socioeconomic factors on dengue transmission in two cities of China from 2006 to 2017. Sci. Total Environ. 2020, 724, 138200. [Google Scholar] [CrossRef]
- Martins, V.E.P.; de Alencar, C.H.M.; Facó, P.E.G.; Dutra, R.F.; Alves, C.R.; Pontes, R.J.S.; Guedes, M.I.F. Spatial distribution and characteristics of Aedes albopictus and Aedes aegypti breeders in Fortaleza, the state of Ceará. Rev. Soc. Bras. Med. Trop. Uberaba 2010, 43, 73–77. [Google Scholar] [CrossRef] [PubMed][Green Version]
- Carvalho, M.S.; Freitas, L.P.; Cruz, O.G.; Brasil, P.; Bastos, L.S. Association of past dengue fever epidemics with the risk of Zika microcephaly at the population level in Brazil. Sci. Rep. 2020, 10, 1752. [Google Scholar] [CrossRef]
- Health Ministry—MS Health Portal. Epidemiological Status: Data. 2017. Available online: http://portalsaude.saude.gov.br/index.php/situacao-epidemiologica-dados-dengue (accessed on 18 September 2020).
- de Sousa, S.C.; Carneiro, M.; Eiras, Á.E.; Bezerra, J.M.T.; Barbosa, D.S. Factors associated with the occurrence of dengue epidemics in Brazil: A systematic review. Rev. Panam. De Salud Pública 2021, 45, e84. [Google Scholar] [CrossRef] [PubMed]
- Nguyen, L.T.; Le, H.X.; Nguyen, D.T.; Ho, H.Q.; Chuang, T.-W. Impact of Climate Variability and Abundance of Mosquitoes on Dengue Transmission in Central Vietnam. Int. J. Environ. Res. Public Health 2020, 17, 2453. [Google Scholar] [CrossRef]
- Estallo, E.L.; Ludueña-Almeida, F.F.; Visintin, A.M.; Scavuzzo, C.M.; Lamfri, M.A.; Introini, M.V.; Zaidenberg, M.; Almirón, W.R. Effectiveness of normalized difference water index in modelling Aedes aegypti house index. Int. J. Remote Sens. 2012, 33, 4254–4265. [Google Scholar] [CrossRef]
- Abdalmagid, M.A.; Alhusein, S.H. Entomological investigation of Aedes aegypti in Kassala and Elgadarief states, Sudan. Sudan. J. Public Health 2008, 3, 77–80. [Google Scholar]
- Ferede, G.; Tiruneh, M.; Abate, E.; Kassa, W.J.; Wondimeneh, Y.; Damtie, D.; Tessema, B. Distribution and larval breeding habitats of Aedes mosquito species in residential areas of northwest Ethiopia. Epidemiol. Health 2018, 40, e2018015. [Google Scholar] [CrossRef]
- Linster, M. OECD Environmental Indicators: Development, Measurement and Use; Organisation for Economic Co-Operation and Development: Paris, France, 2003; Available online: http://www.oecd.org/environment/indicators-modelling-outlooks/24993546.pdf (accessed on 20 January 2021).
- EEA—European Environment Agency. Environmental Terminology and Discovery Service; European Environment Agency: Copenhagen, Denmark, 2016. Available online: http://glossary.eea.europa.eu/EEAGlossary/search_html (accessed on 23 January 2021).
- Cervantes, D.E.T.; Martínez, A.L.; Hernández, M.C.; de Cortázar, A.L.G. Using indicators as a tool to evaluate municipal solid waste management: A critical review. Waste Manag. 2018, 80, 51–63. [Google Scholar] [CrossRef]
- Cervantes, D.E.T.; Romero, E.O.; del Consuelo Hernández Berriel, M.; Martínez, A.L.; del Consuelo Mañón Salas, M.; Lobo, A. Assessment of some governance aspects in waste management systems A case study in Mexican municipalities. Waste Manag. 2021, 278, 123320. [Google Scholar] [CrossRef]
- Silva, L.; Prietto, P.D.M.; Korf, E.P. Sustainability indicators for urban solid waste management in large and medium-sized worldwide cities. J. Clean. Prod. 2019, 237, 117802. [Google Scholar] [CrossRef]
- Loh, W.-Y. Classification and regression trees. Rev. Data Min. Knowl. Discov. 2011, 1, 14–23. [Google Scholar] [CrossRef]
- Kraemer, M.U.; Sinka, M.E.; Duda, K.A.; Mylne, A.; Shearer, F.M.; Barker, C.M.; Moore, C.G.; Carvalho, R.G.; Coelho, G.E.; Van Bortel, W.; et al. The global distribution of the arbovirus vectors aedes aegypti and ae. Albopictus. Elife 2015, 4, e08347. [Google Scholar] [CrossRef] [PubMed]
- IBGE. Census. 2023. Available online: https://censo2022.ibge.gov.br/panorama/?utm_source=ibge&utm_medium=home&utm_campaign=portal (accessed on 10 July 2023).
- Breiman, L. Classification and Regression Trees, 1st ed.; Chapman & Hall/CRC: New York, NY, USA, 1984; 368p. [Google Scholar]
- Pianucci, M.N.; Pitombo, C.S. Uso de árvore de decisão para previsão de geração de viagens comoalternativa ao método de classificação cruzada. Rev. Engenharia Civil. 2019, 56, 5–13. Available online: https://www.civil.uminho.pt/revista/artigos/n56/Pag.5-13.pdf (accessed on 8 January 2023).
- Strobl, C.; Malley, J.; Tutz, G. An introduction to recursive partitioning: Rationale, application and characteristics of classification and regression trees, bagging and random forests. Psychol. Methods 2009, 14, 323–348. [Google Scholar] [CrossRef]
- Schikowski, A.B. Estimating the Volume and Shape of the Shaft Utilizing Machine Learning Techniques. Master’s Thesis, Paraná Federal University, Curitiba, Brazil, 2016. Available online: https://acervodigital.ufpr.br/bitstream/handle/1884/47400/R%20-%20D%20-%20ANA%20BEATRIZ%20SCHIKOWSKI.pdf?sequence=1&isAllowed=y (accessed on 15 May 2021).
- Moreno-Fernández, D.; Cañellas, I.; Barbeito, I.; Sánchez-González, M.; Ledo, A. Alternative approaches to assessing the natural regeneration of Scots pine in a Mediterranean forest. Ann. Forest Sci. 2015, 72, 569–583. [Google Scholar] [CrossRef]
- R CORE TEAM. R: A Language and Environment for Statistical Computing; R Foundation for Statistical Computing: Vienna, Austria, 2020; Available online: https://www.R-project.org/ (accessed on 10 December 2020).
- Therneau, T.; Atkinson, B. rpart: Recursive Partitioning and Regression Trees. R package Version 4.1-15. 2019. Available online: https://CRAN.R-project.org/package=rpart (accessed on 10 December 2020).
- Milborrow, S. rpart.plot: Plot ‘rpart’ Models: An Enhanced Version of ‘plot.rpart’. R Package Version 3.0.8. 2019. Available online: https://cran.r-project.org/web/packages/rpart.plot/index.html (accessed on 18 December 2020).
- Petelet-Giraud, E.; Cary, L.; Cary, P.; Bertrand, G.; Giglio-Jacquemot, A.; Hirata, R.; Aquilina, L.; Alves, L.M.; Martins, V.; Melo, A.M.; et al. Multi-layered water resources, management, and uses under the impacts of global changes in a southern coastal metropolis: When will it be already too late? Crossed analysis in Recife, NE Brazil. Sci. Total Environ. 2018, 618, 645–657. [Google Scholar] [CrossRef] [PubMed]
- Mendonça, F.A.; Souza, A.V.; Dutra, D.A. Saúde pública, urbanização e dengue no Brasil. Soc. Nat. 2009, 21, 257–269. [Google Scholar] [CrossRef]
- Da Silva, R.A.; Barbosa, J.R.d.A. As arboviroses e o saneamento básico: Uma análise dos casos de Dengue, Chikungunya e Zyca em Natal/RN. Soc. E Territ. 2020, 32, 9–29. [Google Scholar] [CrossRef]
- Dorsa, A.C.; Pereira, M.A.D.S.; Magalhães Filho, F.J.C. Indicators of water supply and domestic outdoor services in the Latin American integration Route. Scielo 2019, 20, 17. [Google Scholar]
- Da Silva, J.C.B.; Machado, C.J.S. Associations Between Dengue and socio-environmental variables in capitals of the Brazilian northeast by Cluster Analysis. Ambient. Soc. 2019, 21. [Google Scholar] [CrossRef]
- Galaitsi, S.; Russell, R.; Bishara, A.; Durant, J.L.; Bogle, J.; Huber-Lee, A. Intermittent Domestic Water Supply: A Critical Review and Analysis of Causal-Consequential Pathways. Water 2016, 8, 274. [Google Scholar] [CrossRef]
- Cárcamo, A.; Arosteguí, J.; Coloma, J.; Harris, E.; Ledogar, R.J.; Andersson, N. Informed community mobilization for dengue prevention in households with and without a regular water supply: Secondary analysis from the Camino Verde trial in Nicaragua. BMC Public Health 2017, 395, 17. [Google Scholar] [CrossRef]
- Valderrama, A.B.; Guerrero, T.A.; Artur, C. Cities with Mosquitoes: A Political Ecology of Aedes aegypti’s Habitats. Water Altern. 2020, 14, 70–87. Available online: http://www.wateralternatives.org/index.php/alldoc/articles/vol14/v14issue1/609-a14-1-4/file (accessed on 2 February 2020).
- Shaheed, A.; Orgill, J.; Montgomery, M.A.; Jeuland, M.A.; Brownd, J. Why “improved” water sources are not always safe. Bull World Health Organ. 2014, 92, 283–289. Available online: https://www.scielosp.org/article/bwho/2014.v92n4/283-289/# (accessed on 2 February 2020). [CrossRef] [PubMed]
- Ministério do Desenvolvimento Regional; Secretaria Nacional de Saneamento—SNS. Sistema Nacional de Informações Sobre Saneamento: 25º Diagnóstico dos Serviços de Água e Esgotos—2019; SNS: Brasília, Brazil; MDR: Brasília, Brazil, 2020; 183p. Available online: http://www.snis.gov.br/downloads/diagnosticos/ae/2019/Diagn%C3%B3stico_SNIS_AE_2019_Republicacao_31032021.pdf (accessed on 19 February 2020).
- Kengne, I.M.; Brissaud, F.; Akoa, A.; Eteme, R.A.; Nya, J.; Ndikefor, A.; Fonkou, T. Mosquito development in a macrophyte-based wastewater treatment plant in Cameroon (Central Africa). Ecol. Eng. 2003, 21, 53–61. [Google Scholar] [CrossRef]
- Leoneti, A.B.; Prado, E.L.D.; Oliveira, S.V.W.B.D. Saneamento básico no Brasil: Considerações sobre investimentos e sustentabilidade para o século XXI. Rev. De Adm. Pública 2011, 45, 331–348. [Google Scholar] [CrossRef]
- Lagrotta, M.T.F.; Silva, W.D.C.; Santos, R.S. Identificação de áreas chave para o controle de Aedes aegypti por meio de geoprocessamento em Nova Iguaçu, Estado do Rio de Janeiro, Brasil. Caderno de Saúde Pública. Rio Jan. 2008, 24, 70–80. [Google Scholar] [CrossRef]
- Dieng, H.; Satho, T.; Meli, N.K.K.B.; Abang, F.; Nolasco-Hipolito, C.; Hakim, H.; Miake, F.; Zuharah, W.F.; Kassim, N.F.A.; Ab Majid, A.H.; et al. Occurrence of sweet refuse at disposal sites: Rainwater retention capacity and potential breeding opportunities for Aedes aegypti. Environ. Sci. Pollut. Res. 2018, 25, 13833–13843. [Google Scholar] [CrossRef]
- Bellini, R.; Puggioli, A.; Balestrino, F.; Brunelli, P.; Medici, A.; Urbanelli, S.; Carrieri, M. Sugar administration to newly emerged Aedes albopictus males increases their survival probability and mating performance. Acta Trop. 2014, 132, S116–S123. [Google Scholar] [CrossRef] [PubMed]
- Heinisch, M.R.S.; Diaz-Quijano, F.A.; Chiaravalloti-Neto, F.; Pancetti, F.G.M.; Coelho, R.R.; Andrade, P.D.S.; Urbinatti, P.R.; de Almeida, R.M.M.S.; Lima-Camara, T.N. Seasonal and spatial distribution of Aedes aegypti and Aedes albopictus in a municipal urban park in São Paulo, SP, Brazil. Acta Trop. 2019, 189, 104–113. [Google Scholar] [CrossRef]
- Zhu, D.; Chang, Y.J. Urban water security assessment in the context of sustainability and urban water management transitions: An empirical study in Shanghai. J. Clean. Prod. 2020, 275, 122968. [Google Scholar] [CrossRef]
- Nguyen, T.T.; Ngo, H.H.; Guo, W.; Wang, X.C.; Ren, N.; Li, G.; Ding, J.; Liang, H. Implementation of a specific urban water management-Sponge City. Sci. Total Environ. 2019, 652, 147–162. [Google Scholar] [CrossRef] [PubMed]
- Eirini, A.; Banias, G.; Lampridi, M.; Vasileiadis, G.; Anagnostis, A.; Papageorgiou, E.; Bochtis, D. Smart Technologies for Sustainable Water Management: An Urban Analysis. Sustainability 2021, 13, 13940. [Google Scholar] [CrossRef]
- Zahed Filho, K.; Martins, J.R.S.; Porto, M.F.D.A. Coleção Águas Urbanas. Planos Diretores de Drenagem Urbana; Escola Politécnica da Universidade de São Paulo: São Paulo, Brazil, 2013. [Google Scholar]
- Villanueva, A.O.N.; Tassi, R.; Piccilli, D.G.A.; Da Costa Bemfica, D.; Tucci, C.E.M. Gestão da drenagem urbana, da formulação à implementação. Revista de Gestão de Água da América Latina. Porto Alegre 2011, 8. [Google Scholar] [CrossRef]
- Lourenço, R. Sistemas Urbanos de Drenagem Sustentáveis. Master’s Thesis, Instituto Superior de Engenharia de Coimbra, Instituto Politécnico de Coimbra, Coimbra, Portugal, 2014. Available online: https://files.isec.pt/DOCUMENTOS/SERVICOS/BIBLIO/Teses/Tese_Mest_RossanaLourenco.pdf (accessed on 9 April 2021).
- Magalhães, G.B.; Zanella, M.E. Comportamento espacial da dengue e sua relação com o clima na região metropolitana de Fortaleza, CE, Brasil. Revista Brasileira de Climatologia. Fortaleza 2015, 12, 2015. [Google Scholar]
- Sohn, W.; Brody, S.D.; Kim, J.; Li, M. How effective are drainage systems in mitigating flood losses? Cities 2020, 107, 102917. [Google Scholar] [CrossRef]
- Desjardins, M.R.; Eastin, M.D.; Paul, R.; Casas, I.; Delmelle, E.M. Space-Time Conditional Autoregressive Modeling to Estimate Neighborhood-Level Risks for Dengue Fever in Cali, Colombia. Am. J. Trop. Med. Hyg. 2020, 103, 2040–2053. [Google Scholar] [CrossRef] [PubMed]
- Surendran, S.N.; Jayadas, T.T.P.; Sivabalakrishnan, K.; Santhirasegaram, S.; Karvannan, K.; Weerarathne, T.C.; Karunaratne, S.H.P.P.; Ramasamy, R. Development of the major arboviral vector Aedes aegypti in urban drain-water and associated pyrethroid insecticide resistance is a potential global health challenge. Parasites Vectors 2019, 12, 8. [Google Scholar] [CrossRef] [PubMed]
- Fendrich, R. Manual de Utilização das Águas Pluviais (100 Maneiras Práticas), 2nd ed.; Roberto Fendrich: Curitiba, Brazil, 2009; 190p. [Google Scholar]
- Tucci, C.E.M. Gestão da Drenagem Urbana; CEPAL. Escritório no Brasil/IPEA: Brasília, Brazil, 2012; 50p, Available online: https://repositorio.cepal.org/server/api/core/bitstreams/0202366b-45a3-4786-aedb-81da9c5c5231/content (accessed on 10 March 2021).
- Paploski, I.A.D.; Rodrigues, M.S.; Mugabe, V.A.; Kikuti, M.; Tavares, A.S.; Reis, M.G.; Kitron, U.; Ribeiro, G.S. Storm drains as larval development and adult resting sites for Aedes aegypti and Aedes albopictus in Salvador, Brazil. Parasites Vectors 2016, 419, 9. [Google Scholar] [CrossRef]
- Bertolino, S.; Vimercati, G.; Paoloni, D.; Martinoli, A.; Wauters, L.A.; Genovesi, P.; La Morgia, V. Restricted access to private properties limits management of invasive alien species: A literature review and case studies. J. Environ. Manag. 2021, 297, 113318. [Google Scholar] [CrossRef]
- Wilke, A.B.B.; Vasquez, C.; Carvajal, A.; Medina, J.; Chase, C.; Cardenas, G.; Mutebi, J.-P.; Petrie, W.D.; Beier, J.C. Proliferation of Aedes aegypti in urban environments mediated by the availability of key aquatic habitats. Sci. Rep. 2020, 10, 12925. [Google Scholar] [CrossRef]
- Seidahmed, O.M.E.; Eltahir, E.A.B.A. Sequence of Flushing and Drying of Breeding Habitats of Aedes aegypti (L.) Prior to the Low Dengue Season in Singapore. PLoS Neglected Trop. Dis. 2016. [Google Scholar] [CrossRef]
- Seidahmed, O.; Lu, D.; Chong, C.S.; Ng, L.C.; Eltahir, E. Patterns of Urban Housing Shape Dengue Distribution in Singapore at Neighborhood and Country Scales. GeoHealth 2018, 2, 54–67. [Google Scholar] [CrossRef]
- Zhang, K.; Bach, P.M.; Mathios, J.; Dotto, C.B.; Deletic, A. Quantifying the benefits of stormwater harvesting for pollution mitigation. Water Res. 2020, 171, 115395. [Google Scholar] [CrossRef]
- Biswal, B.K.; Bolan, N.; Zhu, Y.G.; Balasubramanian, R. Nature-based Systems (NbS) for mitigation of stormwater and air pollution in urban areas: A review. Resour. Conserv. Recycl. 2022, 186, 106578. [Google Scholar] [CrossRef]
- Molné, F.; Donati, G.F.; Bolliger, J.; Fischer, M.; Maurer, M.; Bach, P.M. Supporting the planning of urban blue-green infrastructure for biodiversity: A multi-scale prioritisation framework. J. Environ. Manag. 2023, 342, 118069. [Google Scholar] [CrossRef]


| N | Minimum | First Quartile | Median | Average | Third Quartile | Maximum | Standard Deviation | |
|---|---|---|---|---|---|---|---|---|
| Brazil Region | 5482 | 0.00 | 0.00 | 0.40 | 1.415 | 1.60 | 100.00 | 4.550 |
| Midwest | 454 | 0.00 | 0.00 | 0.20 | 0.787 | 0.80 | 34.40 | 2.038 |
| Northeast | 1783 | 0.00 | 0.40 | 1.40 | 2.574 | 3.20 | 100.00 | 5.925 |
| North | 433 | 0.00 | 0.00 | 0.30 | 1.349 | 1.60 | 100.00 | 5.113 |
| Southeast | 1636 | 0.00 | 0.00 | 0.30 | 0.816 | 0.80 | 100.00 | 4.414 |
| South | 1176 | 0.00 | 0.00 | 0.00 | 0.756 | 1.00 | 9.00 | 1.371 |
| Indicator Group | Code | Indicator Description | Unit |
|---|---|---|---|
| AEIN005 | Average water tariff | USD/m3 | |
| AEIN006 | Average wastewater tariff | USD/m3 | |
| ECONOMIC/FINANCIAL AND ADMINISTRATIVE | AEIN007 | Incidence of personnel and third-party services costs in the service total expenditure | % |
| AEIN008 | Average annual expenditure per employee | USD/employee | |
| AEIN012 | Financial performance index | % | |
| AEIN018 | Equivalent amount of personnel | employee | |
| AEIN029 | Revenue evasion index | % | |
| AEIN041 | Wastewater direct operational revenue participation in total operational revenue | USD/inhabitants/year | |
| AEIN048 | Productivity index: own employees per 1000 connections of water and wastewater | employees/1000 connections | |
| AEIN001 | Water economy density per connection | economy/connection | |
| WATER OPERATIONS | AEIN009 | Hydrometric Index | % |
| AEIN010 | Index of micro-metering related to available consumption | % | |
| AEIN020 | Extension of water network per connection | meters/connection | |
| AEIN022 | Average water consumption per capita | liters/inhabitants/day | |
| AEIN023 | Urban water supply index | % | |
| AEIN043 | Residential water consumer units’ participation in total water units | % | |
| AEIN044 | Index of micro-metering related to consumption | % | |
| AEIN052 | Water consumption index | % | |
| AEIN053 | Average consumption of water per economy | m3/month/economy | |
| AEIN055 | Total water supply index | % | |
| AEIN021 | Extension of sewerage network per connection | meters/connection | |
| SEWERAGE OPERATIONS | AEIN046 | Index of treated wastewater related to water consumption | % |
| AEIN047 | Urban sewerage supply index on the attended municipalities | % | |
| AEIN072 * | Average duration of interruptions in water supply | hours/interruptions | |
| QUALITY—WATER AND WASTEWATER | AEIN074 * | Average duration of intermittence | hours/intermittence |
| AEIN077 | Average duration of wastewater overflow repair | hours/overflows |
| Metrics | ME | RMSE | MAE |
|---|---|---|---|
| Midwest | 0.077 | 1.827 | 0.755 |
| Northeast | −0.051 | 5.607 | 2.320 |
| North | −0.152 | 4.777 | 1.567 |
| Southeast | −0.001 | 4.220 | 0.983 |
| South | −0.240 | 1.744 | 1.153 |
| Region | Regional Results |
|---|---|
| Midwest | A higher income itself does not reduce HI. A continuous water supply is necessary to end improper storage and avoid mosquito development based on these results. |
| Northeast | Intermittences in the public network contribute to mosquito proliferation. Insufficient sanitary sewer services contribute to the increase in HI. |
| Northern | More effective maintenance in the network decreases HI. |
| Southeast | More effective network maintenance combined with the sewerage network extension and the number of connections of wastewater decreased HI. |
| South | Water storage and physical loss that occur in the extension of networks contribute to increased HI. |
| N | Minimum | First Quartile | Median | Average | Third Quartile | Maximum | Standard Deviation | |
|---|---|---|---|---|---|---|---|---|
| Brazil Region | 3667 | 0.00 | 0.00 | 0.40 | 1.224 | 1.40 | 100.00 | 3.848 |
| Midwest | 329 | 0.00 | 0.00 | 0.20 | 0.827 | 0.90 | 34.40 | 2.260 |
| Northeast | 822 | 0.00 | 0.40 | 1.50 | 2.544 | 3.20 | 100.00 | 4.511 |
| North | 219 | 0.00 | 0.00 | 0.30 | 1.215 | 1.70 | 16.70 | 2.069 |
| Southeast | 1.291 | 0.00 | 0.00 | 0.30 | 0.854 | 0.80 | 100.00 | 4.920 |
| South | 1.006 | 0.00 | 0.00 | 0.00 | 0.761 | 1.00 | 9.80 | 1.362 |
| INDICATOR GROUP | CODE | INDICATOR DESCRIPTION | UNIT |
|---|---|---|---|
| GENERAL DATA | DREIN044 | Housing density in urban areas | Houses/hectares |
| DREIN001 | Participation of company employees among all employees (including third-party) in urban stormwater management and drainage services | % | |
| FINANCIAL DATA | DREIN010 | Participation of the total expense in urban stormwater management and drainage services in the municipality’s total expenses | % |
| DREIN053 | Investment disbursement per capita | USD/inhabitants/year | |
| DREIN054 | Total investment disbursement in relation to the total investment retained | USD/inhabitants/year | |
| DREIN020 | Ratio of paving and curb coverage in the municipality’s urban areas | % | |
| INFRASTRUCTURE DATA | DREIN021 | Ratio of public streets covered by stormwater drainage underground networks in urban areas | % |
| DREIN027 | Percentage of perennial streams in storm drain tunnels | % |
| Region | ME | RMSE | MAE |
|---|---|---|---|
| Midwestern | −5.196 × 10⁻¹⁷ | 2.191 | 0.916 |
| Northeastern | −1.812 × 10⁻¹⁵ | 8.649 | 2.700 |
| Northern | −4.312 × 10⁻¹⁶ | 1.777 | 1.145 |
| Southeastern | −2.164 × 10⁻¹⁶ | 4.698 | 1.008 |
| Southern | −1.23 × 10⁻¹⁷ | 1.269 | 0.893 |
| REGIONS | DESCRIPTION OF REGIONAL INDICATORS IMPACTING HI |
|---|---|
| Midwestern | A full urban stormwater drainage system contributes to decreased proliferation of Aedes aegypti. |
| Northeastern | A stormwater pipe system is not enough to reduce the HI. There is a need for a complete system to improve this index. |
| Northern and Southeastern | A full urban stormwater drainage system contributes to decreased proliferation of Aedes aegypti. |
| Southern | A complete urban stormwater drainage system contributes to decreased proliferation of Aedes aegypti. Also, the population density and the participation of company employees among all employees in stormwater drainage services contribute to mosquito proliferation. |
Disclaimer/Publisher’s Note: The statements, opinions and data contained in all publications are solely those of the individual author(s) and contributor(s) and not of MDPI and/or the editor(s). MDPI and/or the editor(s) disclaim responsibility for any injury to people or property resulting from any ideas, methods, instructions or products referred to in the content. |
© 2024 by the authors. Licensee MDPI, Basel, Switzerland. This article is an open access article distributed under the terms and conditions of the Creative Commons Attribution (CC BY) license (https://creativecommons.org/licenses/by/4.0/).
Share and Cite
Klafke, F.; Henning, E.; Barros, V.G. Using Machine Learning to Improve Vector Control, Public Health and Reduce Fragmentation of Urban Water Management. Hygiene 2024, 4, 49-75. https://doi.org/10.3390/hygiene4010004
Klafke F, Henning E, Barros VG. Using Machine Learning to Improve Vector Control, Public Health and Reduce Fragmentation of Urban Water Management. Hygiene. 2024; 4(1):49-75. https://doi.org/10.3390/hygiene4010004
Chicago/Turabian StyleKlafke, Fernanda, Elisa Henning, and Virginia Grace Barros. 2024. "Using Machine Learning to Improve Vector Control, Public Health and Reduce Fragmentation of Urban Water Management" Hygiene 4, no. 1: 49-75. https://doi.org/10.3390/hygiene4010004
APA StyleKlafke, F., Henning, E., & Barros, V. G. (2024). Using Machine Learning to Improve Vector Control, Public Health and Reduce Fragmentation of Urban Water Management. Hygiene, 4(1), 49-75. https://doi.org/10.3390/hygiene4010004