Abstract
Environmental monitoring (EM) is the cornerstone for the assurance of sterility during aseptic manufacturing. In this study, the EM quality aspects in the radiopharmaceutical cleanrooms of the University Medical Center Groningen (UMCG), The Netherlands, were evaluated. Hereto, data obtained from EM over the period 2010–2022 were analyzed. The data were sorted according to the Good Manufacturing Practice (GMP) classification of the respective premises with their corresponding limits, and frequencies of excursions were determined per location. The frequency of conducted measurements gradually increased between the start and end of the assessed period. There was a trend of increased action limit excursions observed between 2010–2022. We found that EM in grade A areas appeared to be significantly less compliant with GMP specifications than the combined data from all sampled premises at the facility (p < 0.00001; two-sided Fisher’s exact test). A trend was found for reduced action limit excursions for passive air sampling and particle counting, suggesting improved GMP compliance over time for this specific type of EM. The contamination recovery rate (CRR) found for cleanroom conditions, around 10%, was considered sufficient. From this comprehensive data analysis, we learn that, in order to be fully compliant with the requirements set in the recent revision of EU (European Union)-GMP Annex 1 ‘Manufacture of sterile medicinal products’ (in force as of 25 August 2023), strategies to further improve product protection are justified. For example, improved cleaning and disinfection procedures, more efficient working methods as well as optimization of the conditions under which aseptic manufacturing is performed are to be considered.
1. Introduction
To guarantee the quality of pharmaceutical products as well as patient safety, their manufacturing must comply with strict regulations as set by governments and professionals. Application of the Good Manufacturing Practices (GMP) guidelines is the global standard in this respect [1,2,3].
At the Department of Nuclear Medicine and Molecular Imaging (NMMI) of the University Medical Center Groningen (UMCG), The Netherlands, annually circa 1500 batches of radiopharmaceuticals for diagnostic (positron emission tomography (PET), single-photon emission computed tomography (SPECT)), and therapeutic purposes are produced in cleanroom facilities under GMP conditions. These products are not only used in the UMCG itself, but also distributed to other hospitals in the Netherlands. For the manufacturing of radiopharmaceuticals, especially GMP Annex 1 (‘Manufacturing of sterile medicinal products’) [4] and its recently revised version [5] as well as Annex 3 (‘Manufacturing of radiopharmaceuticals’) [6] are important.
To assess and assure quality and compliance with GMP, environmental monitoring (EM) is a keystone in the protection against microbiological contamination in the manufacturing premises [7]. Radiopharmaceuticals are mostly administered parenterally and due to their short shelf life, microbiological contamination can only be detected after the product has been administered to the patient [8]. Radiopharmaceuticals are therefore, as described in Annex 17 ‘Real time release testing and parametric release’, released conditionally (without microbiological testing) by the qualified person (QP), based on full control of the production process and documented results of EM [9]. Another challenging issue is the radiation safety requirements such as under-pressure (regularly minus 10 Pa) instead of over-pressure which may affect the microbiological situation in the cleanroom.
According to GMP, several methods of EM must be used. Although the frequencies may differ, regular monitoring schedules consist of active and passive monitoring, as well as RODAC sampling (contact plates), finger prints, and particle counting. Using the data of EM at the Department of NMMI collected over the period 2010–2022, it was our objective to assess the compliance with GMP and to critically evaluate the performance and quality of the manufacturing of radiopharmaceuticals. Over the years, trends and deviations of the EM of the cleanrooms were critically analyzed and discussed. This approach is useful as a self-reflection on the work at the Department of NMMI, to identify weak and strong points, and to support continuous improvement by means of the plan-do-check-act (PDCA) cycle. It may serve as an example for other GMP production units for radiopharmaceuticals with recommendations to further improve the quality of the products and to reduce the risk of microbial contamination.
As of 25 August 2023, all GMP-units (in hospitals, industry, etc.) must comply with the new and revised EU (European Union)-GMP Annex 1 [5]. The guidelines for microbiological monitoring have been tightened as compared to the former Annex 1 (in force until 25 August 2023) [4]. Since the production of radiopharmaceuticals at the Department of NMMI has now to be conformant with the revised Annex 1, the evaluation of the EM data of 2022 is performed based on the revised EU-GMP Annex 1 while the entire data set is mirrored to the former EU-GMP Annex 1.
2. Materials and Methods
2.1. Premises and General Description of Environmental Monitoring (EM) Procedures
Within the Department of Nuclear Medicine and Molecular Imaging (NMMI) of the University Medical Center Groningen (UMCG), The Netherlands, a Single-Photon Emission Computed Tomography (SPECT) section, a Positron Emission Tomography (PET) section (up until 2018), and a Quality Control (QC) lab are present, including premises that comply to GMP classes A, B, C, or D [1]. Throughout the years, EM was executed according to the (in house) Standard Operating Procedure (SOP) ‘Monitoring cleanrooms NMMI’ which is based on the former EU-GMP Annex 1 [4]. The SOP contains information regarding locations for sampling and sampling frequency. In total, 63 sampling locations are included.
During each preparation of a radiopharmaceutical, the indicated EM was executed according to protocol during operation. During each preparation session in a Grade A zone, this consisted of one passive settle plate placed on an indicated critical spot in the particular laminar air flow (LAF) hood or hot cell. All other procedures (active and contact plates) were performed separate from the preparation process. Appropriate agar plates obtained from active and passive air sampling and those from RODAC sampling (contact plates) were sent to the Department of Medical Microbiology (MMB) of the UMCG and incubated at 35 °C for 7 days, after which the total number of colony-forming units (cfus) and the species of the microorganisms were determined. Typically, Staphylococcus species (but no S. aureus), Micrococcus luteus, and Corynebacterium species have been identified from our cleanrooms. Data were sent back to the Department of NMMI, recorded, and critically assessed. Action was undertaken in case of an excursion. During the period 2010–2022 the former EU-GMP Annex 1 was used as a guideline [4], requiring that in grade A areas the average number of cfus found for EM tests should be below 1. An overview of all maximum action limits of particles and viable particle contamination according to EU-GMP Annex 1 [5] is presented in Table 1.

Table 1.
Overview of all maximum action limits of particles and viable particles according to the recently revised EU-GMP Annex 1 [5].
2.2. Active Air Sampling
Active air sampling was performed monthly by processing 1 m3 of air using an air sampler (Airsampler MAS 100 (MBV A.G., Stäfa, Switzerland) and ActiveCount 100H (Lighthouse Benelux B.V., Boven-Leeuwen, The Netherlands) in combination with tryptone soya agar (TSA) settle plates (diameter 90 mm, No. K123 P090CR, Biotrading, Mijdrecht, The Netherlands) at predetermined locations. The results were expressed as cfus/m3.
2.3. Passive Air Sampling
Passive air sampling was performed per production by placing settle plates (tryptone soya agar (TSA), diameter 90 mm, No. K123 P090CR, Biotrading, Mijdrecht, The Netherlands) at predetermined locations in hot cells and in the LAF cabinets. The results were expressed as cfus/4 h exposure time.
2.4. RODAC Sampling
LAF-cabinets and hot cells were sampled monthly by pressing convex RODAC plates onto the surfaces (RODAC plates, TSA, Tween and Lecithin, diameter 55 mm, No. K029R055CR, Biotrading, Mijdrecht, The Netherlands). The results were expressed as cfus/plate).
2.5. Particle Counting
Particle counting has been performed monthly from 2010–2020 and continuously from 2020 onwards at predetermined locations, compliant with the recommendation of daily monitoring for critical locations [10]. Particles of both of 0.5 µm and 5 µm (viable and non-viable) were counted by using particle counters (Lasair II 310B, Particle Measuring Systems, Boulder CO, USA; Kalibra particle counters, Delft, The Netherlands). The results were expressed as particles/m3. The Lasair II particle counters are operated for 4 min in cleanrooms class C and D and for 36 min in hot cell/LAF hoods in cleanrooms class A and B. The time difference relates to the different number of particles per air volume in the various classes of cleanrooms. The Kalibra particle counters count continuously (24 h/7 days).
2.6. Data Analysis
The obtained data were sorted according to the GMP classification of the respective premises with the corresponding limits [1], and frequencies were determined per location. The data were then grouped into one of the three categories: below the alert level (compliant), between the alert level and the action limit (alert), or above the action limit (excursion) [4,5]. The total number of measurements within each category was counted for each sampling location and each test, and frequency tests were performed to detect possible trends or outstanding results for different locations, GMP cleanroom classes, or seasons and years.
A statistical evaluation was performed using a two-sided Fisher’s exact test. A p-value < 0.05 was considered significant. With this test, the independence of two categories with each two variables can be calculated from the hypergeometric distribution, which is applicable for the data [11]. To create two subgroups for the Fisher’s exact test, the data that fell in the compliant category were compared to the data of the combined alert and excursion categories.
The contamination recovery rate (CRR) over time was calculated and analyzed for grade A areas for the results of the combined active air sampling, passive air sampling, and contact prints. The CRR is defined as the percentage of samples that show any microbial recovery, irrespective of the number of colony-forming units (cfus) [12] and calculated as follows:
CRR = (Number of samples with counts ≥ 0 cfu/Total number of samples collected) × 100%
Frequency measures were performed on all other data sets, the active air sampling, particle count data, and contact print data, allowing a comparison of the seasons, the years, and of different cleanroom classes.
3. Results
3.1. Combined Data for Premises
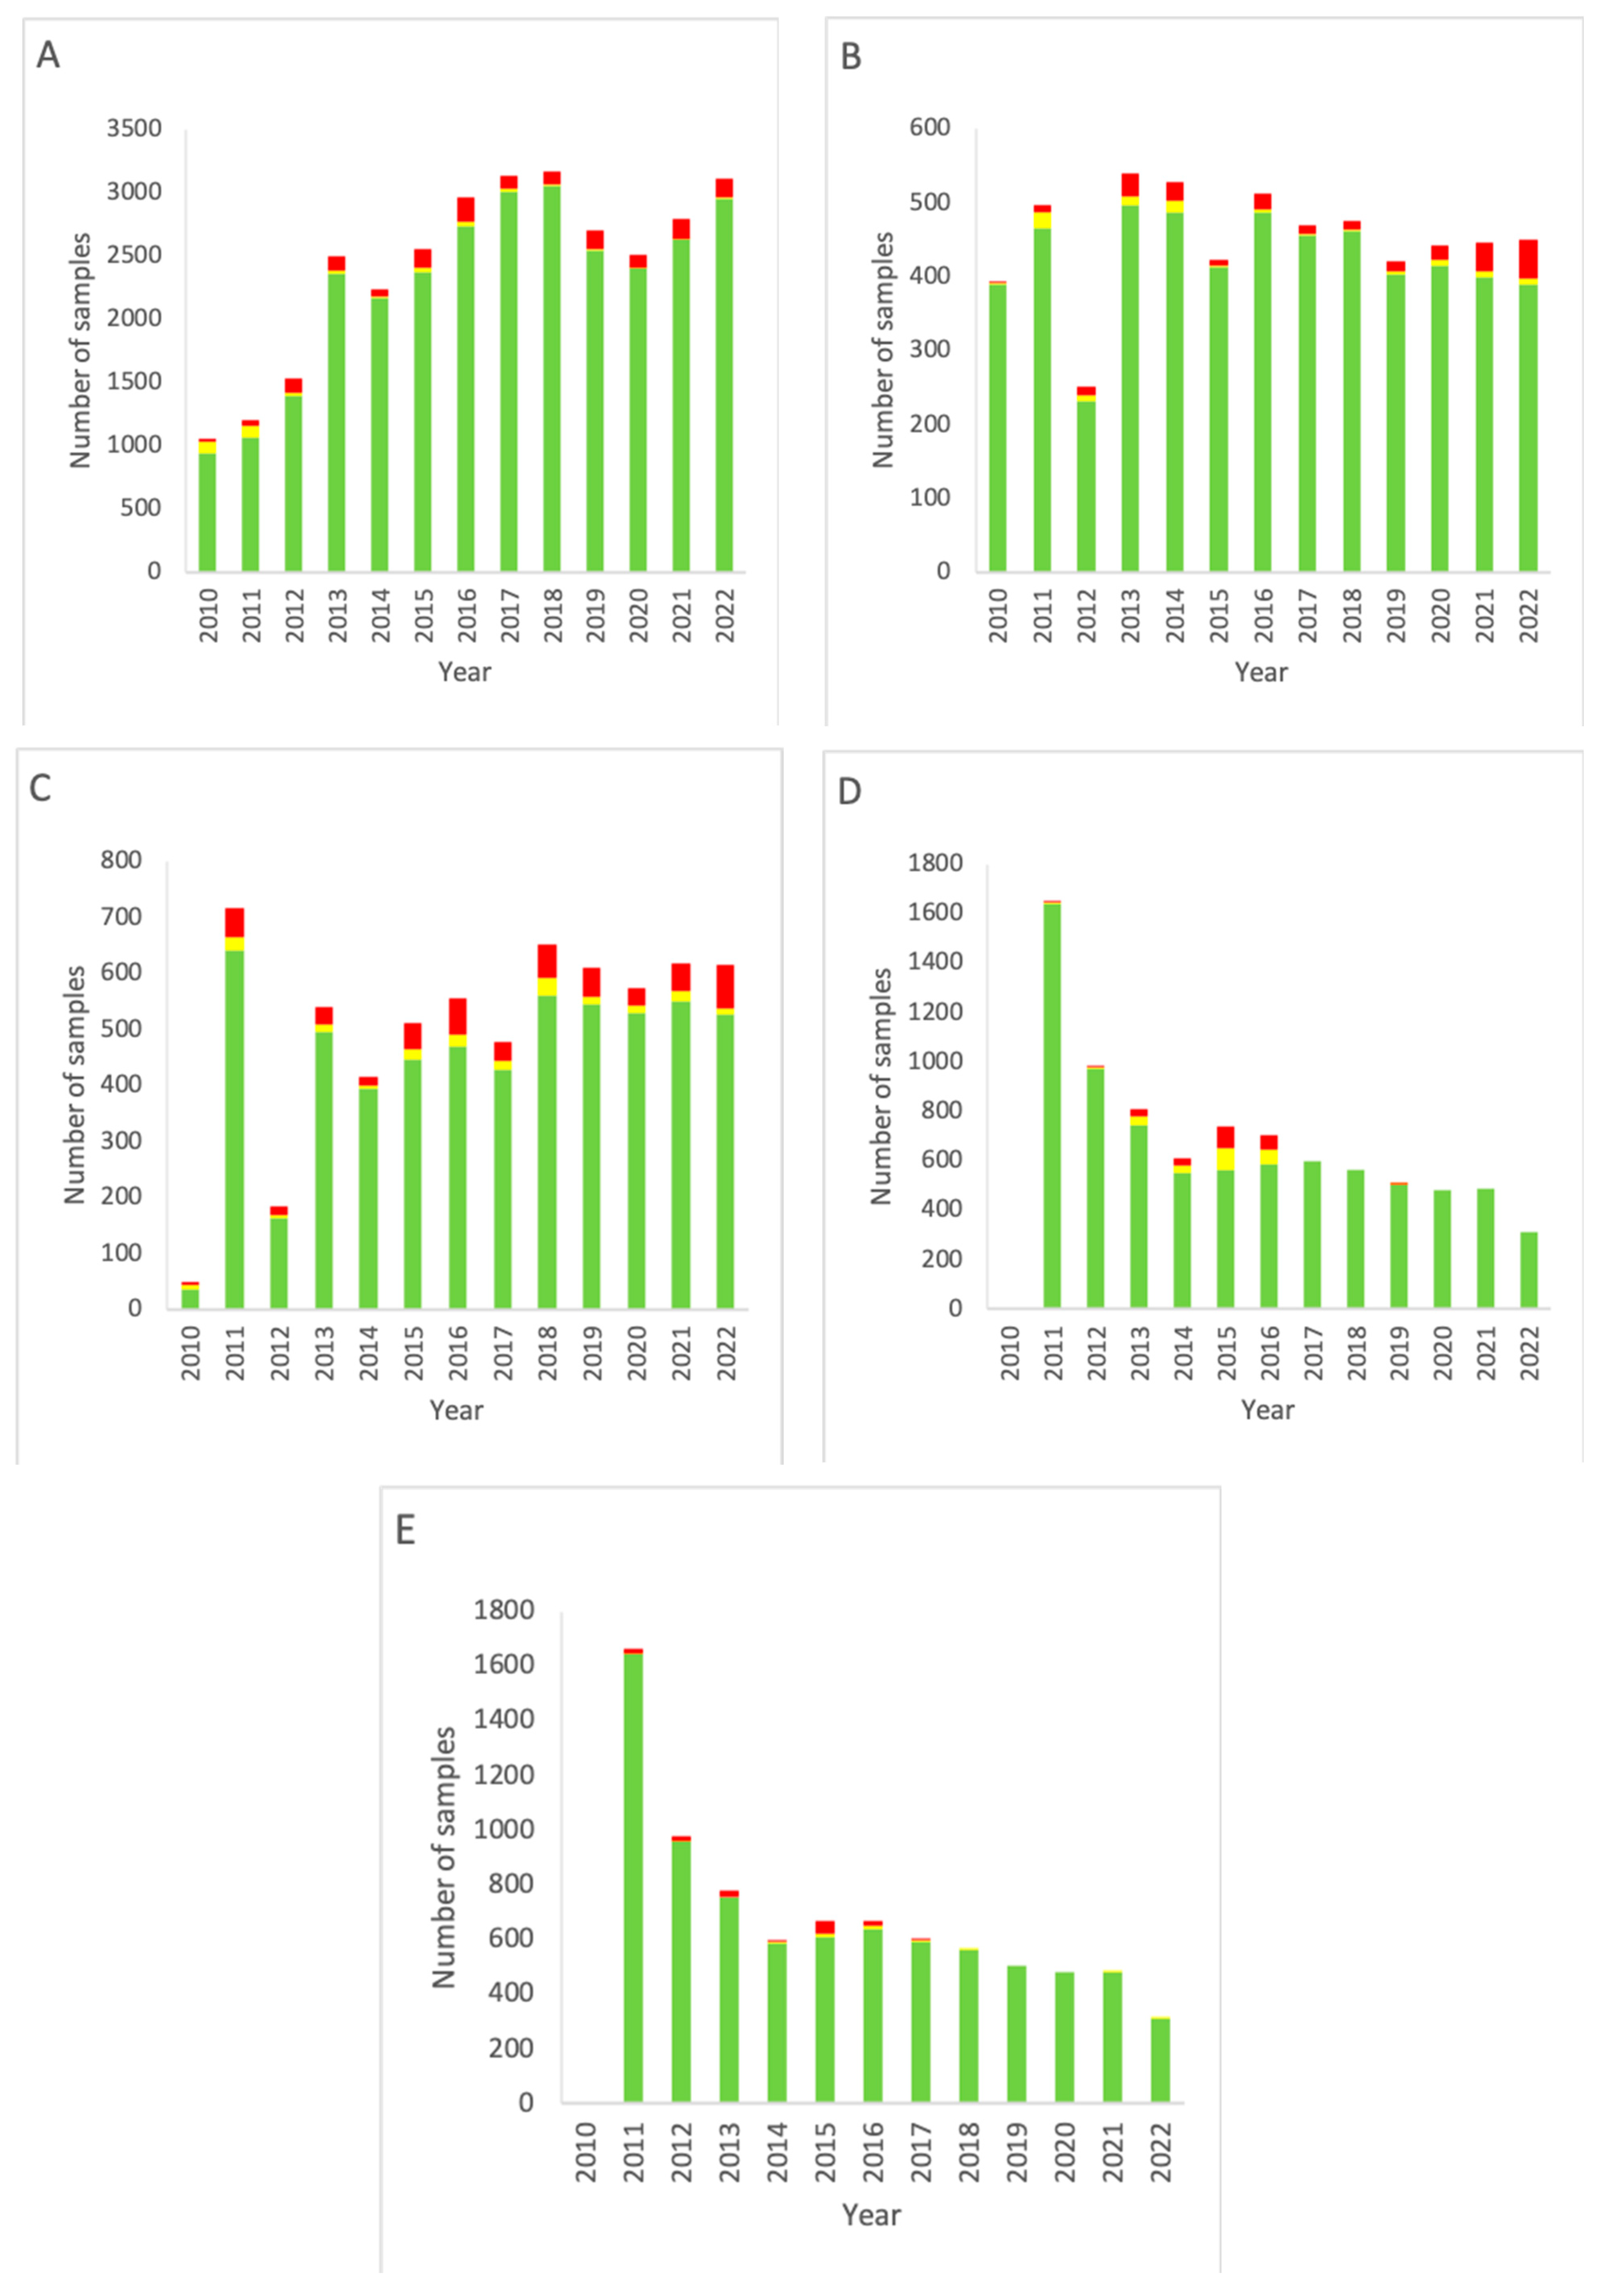
The combined EM data for all areas of the Department of NMMI facilities over the period 2010–2022 are shown in Figure 1.
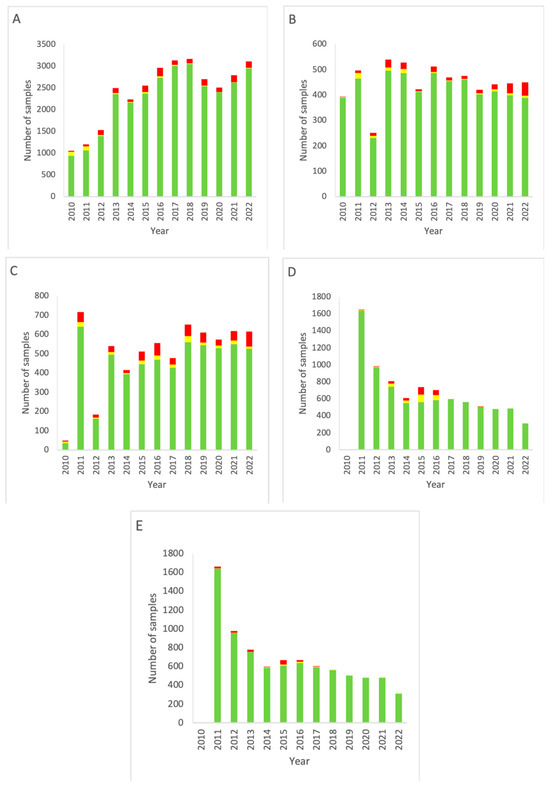
Figure 1.
Combined EM data for all rooms of the Department of NMMI over the period 2010–2022. (A) Results of active air sampling. (B) Results of passive air sampling. (C) Results of RODAC sampling (contact plates). (D) Results of particle counting (0.5 µm). (E) Results of particle counting (5 µm). Green: below the alert level (compliant). Yellow: between the alert level and the action limit (alert). Red: above the action limit (excursion).
For passive air sampling (Figure 1A), a trend of increasing testing frequency is seen from the introduction of measuring up to 2018. Then, a small dip follows in the period 2019–2021, with the measurement total of 2022 being similar to the level of 2018. A significant decrease (p < 0.05, two-sided Fisher’s exact test) in alert level outcomes is seen throughout the years (p < 0.00001). Between the years, excursions of the action limit varied in number (4–86) and as a percentage of the total measurements (2.8–6.4%, 4.5% on average). No significant trend of decrease or increase was found.
For active sampling (Figure 1B), an increase in the number of measurements is seen from 2010 up until 2013, with a dip in 2012. From 2013, however, a gradual decline in the monitoring frequency is visible. There is no up- or downward trend for alert excursions, but a significant increase in action limit excursions is seen in the most recent years, starting in 2018, with only little variation between the compliant measurements of these years (p < 0.00001).
The frequency of RODAC sampling (Figure 1C) increased gradually since the start of the data collection, with the exception of the year 2011 in which an increased number of measurements was carried out compared to the previous year. Both alert and action limit excursions strongly varied between the years, resulting in no significant trend in these data categories.
Particle counting (Figure 1D,E) started in 2011. Initially, the number of measurements was high but decreased as of 2014. Alert and action limits were only significantly overrun in 2015 and 2016. Action limit excursions for particle counting stayed at a low-end level and remained more or less constant from 2017 onward. There was no difference between 0.5 and 5 µm particles. The particle counting data as presented from 2021 onward are incomplete as from that date continuous particle count monitoring was performed. These data turned out to be far more complicated to compile in a report. The most important reason for this is the vast amount of available data points.
3.2. Data for Grade A Areas
Figure 2 depicts the data obtained from measurement locations that are graded class A according to the GMP. Comparison of the results of all grade A areas with other rooms (grade C and higher) yielded a p-value of 0.00001, indicating a significant difference between grade A and non-grade A areas.
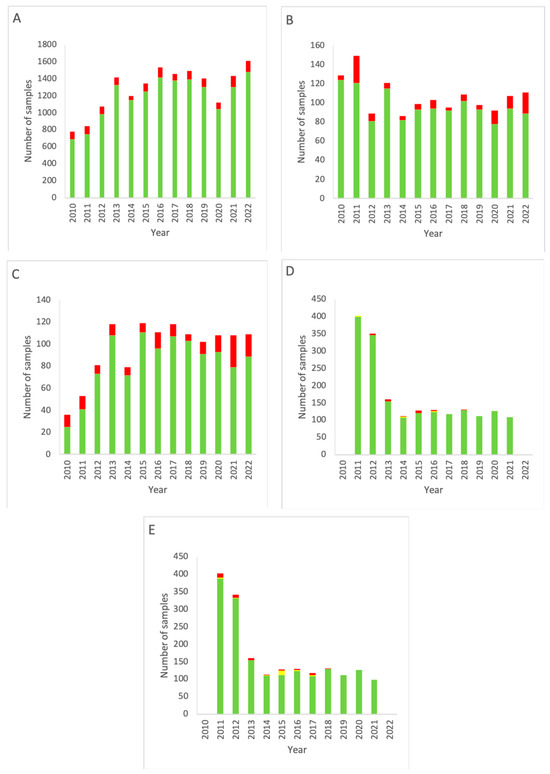
Figure 2.
EM data for all grade A cleanrooms of the NMMI department over the period 2010–2022. (A) Results of active air sampling. (B) Results of passive air sampling. (C) Results of RODAC (contact plates). (D) Results of particle counting (0.5 µm). (E) Results of particle counting (5 µm). Note that for both (D,E) data for 2022 are missing. Green: below the alert level (compliant). Yellow: between the alert level and the action limit (alert). Red: above the action limit (excursion).
Figure 2A shows a decrease in total measurements throughout the years in alignment with the data shown in Figure 1A, only having slightly higher percentages of alert excursions (range 2.76–6.35%, mean 4.54% for grade A cleanrooms versus range 4.26–11.19%, mean 7.65% for all locations).
The results for active air sampling in grade A areas (Figure 2B) show a similar trend as for active air sampling in all areas combined at the Department of NMMI (Figure 1). A decline in measurements is seen after 2011, but from 2014, a gradual increase is seen up to 2022, with a small dip from 2019–2020. Again, a trend is seen of increasing action limit excursions.
RODAC sampling in grade A areas (Figure 2C) shows an increase in measurements over time, as well as an increase in excursions of the action limit. Compared to RODAC sampling of all areas combined (Figure 1C), a more gradual development is seen in grade A areas (Figure 2C), while both show a decline in 2014.
Particle counting measurements for grade A rooms (Figure 2D,E) closely resemble those for the complete department (Figure 1D,E), having a fast and then gradual decline in measurements carried out. There was no difference between 0.5 and 5 µm particles.
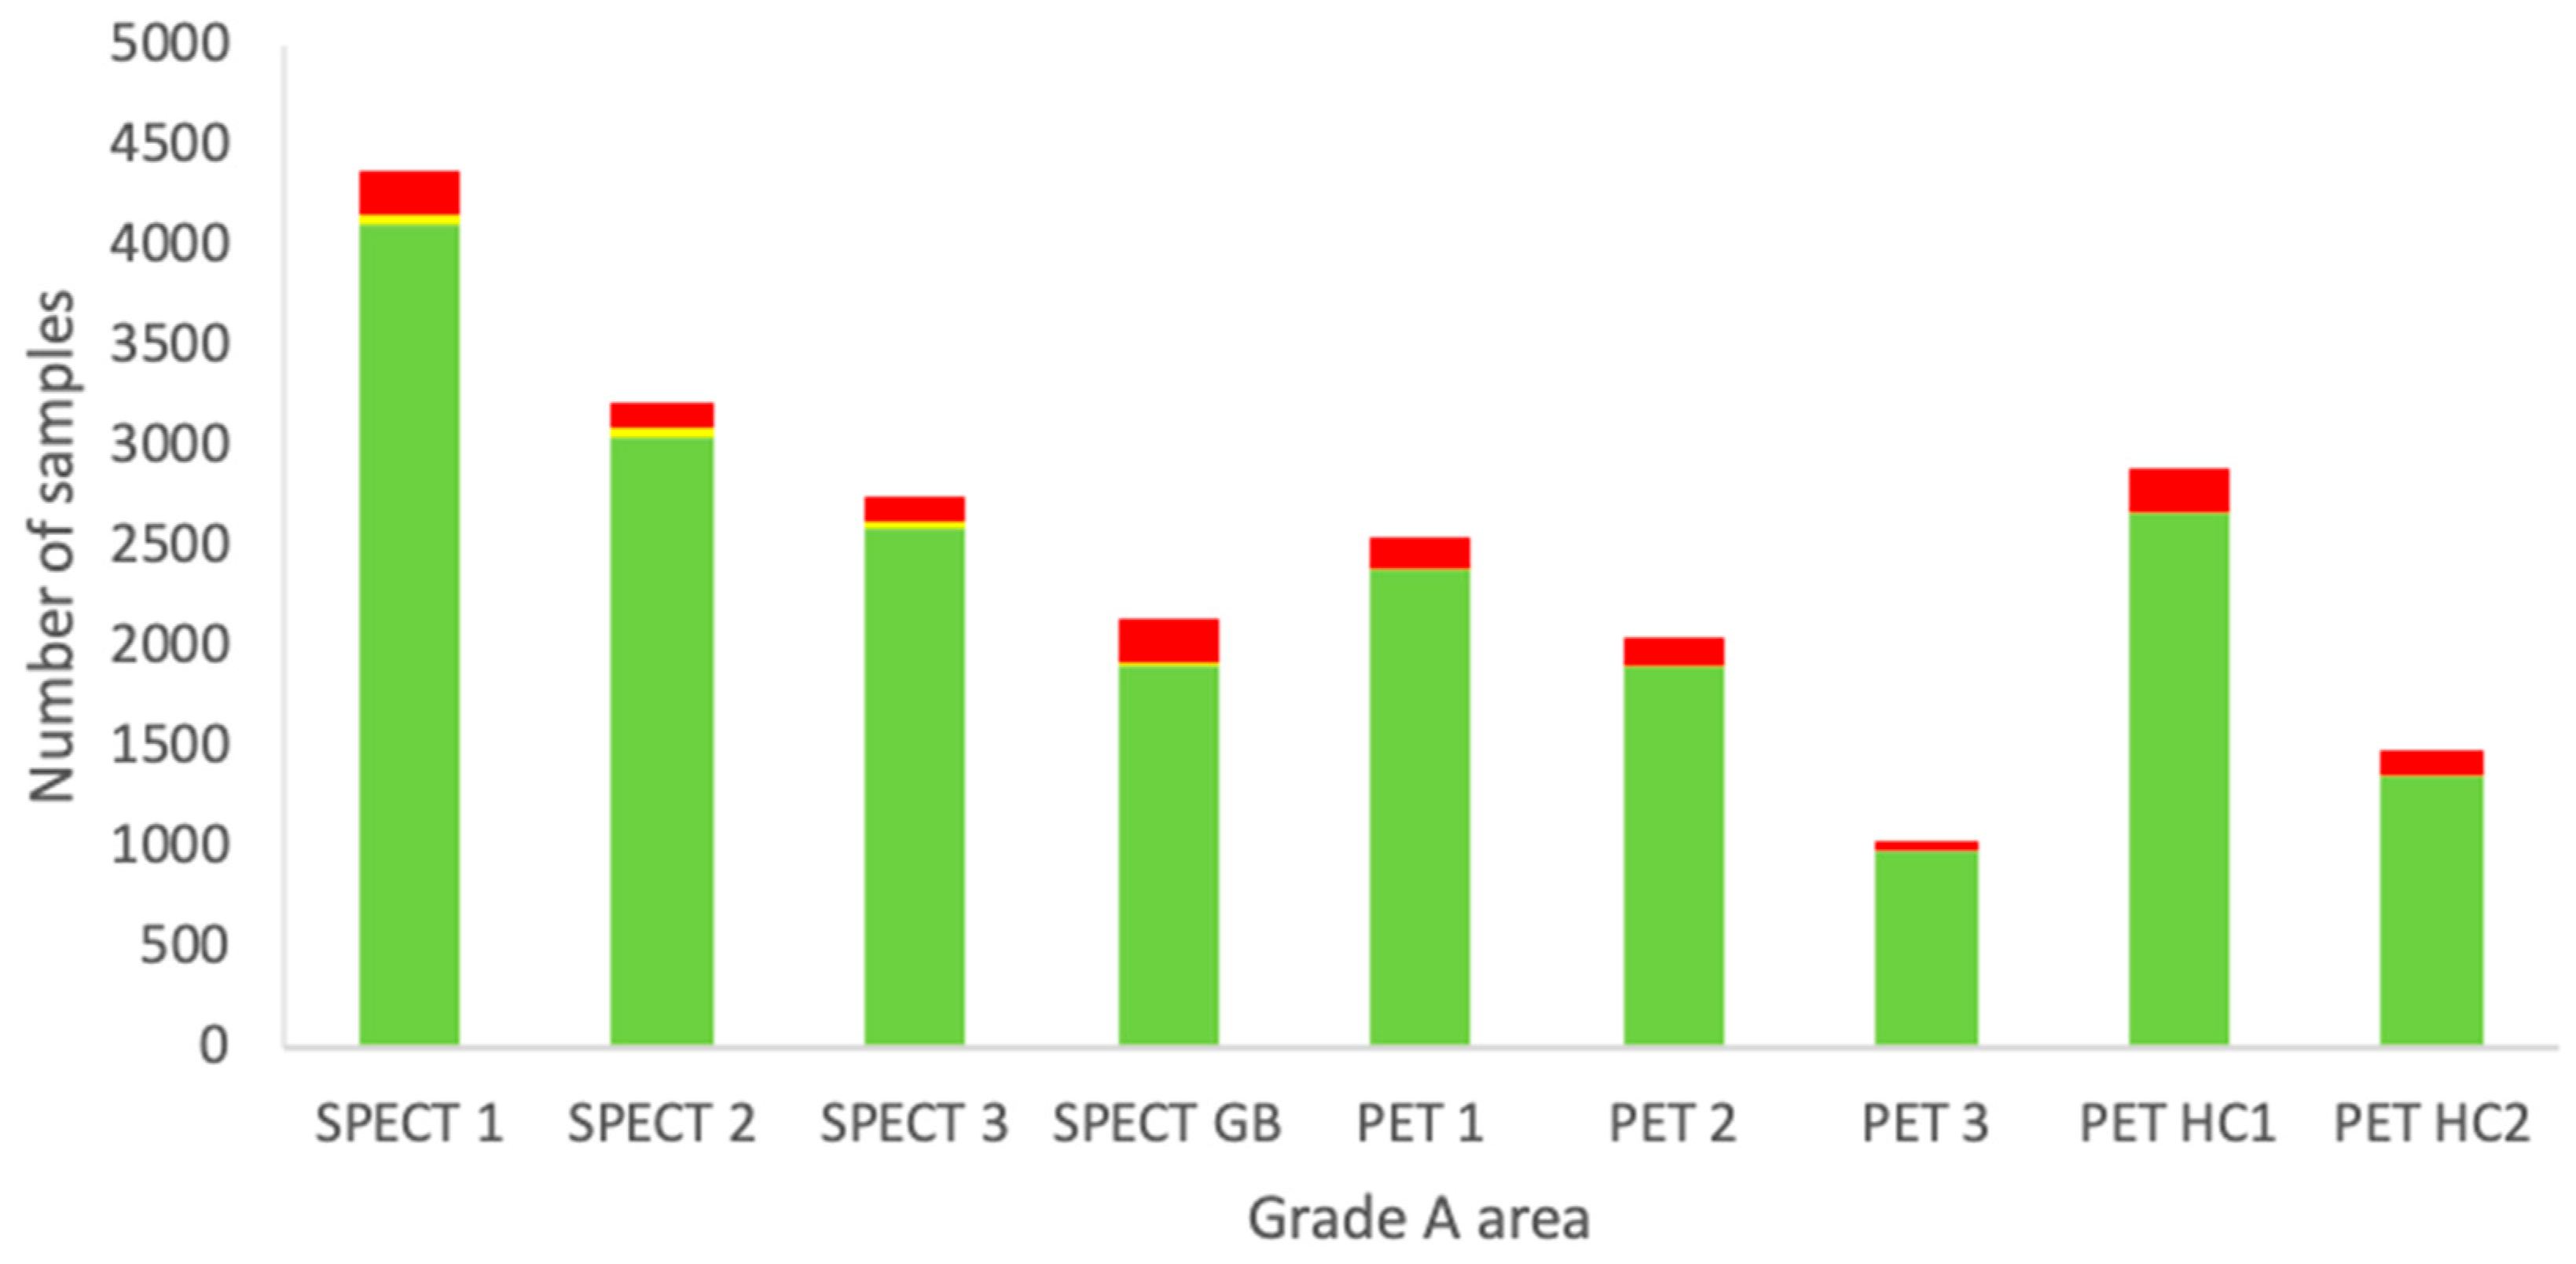
For each individual grade A area, all measurements available for the four types of EM from 2010–2022 were sorted and combined. These results are shown in Figure 3.
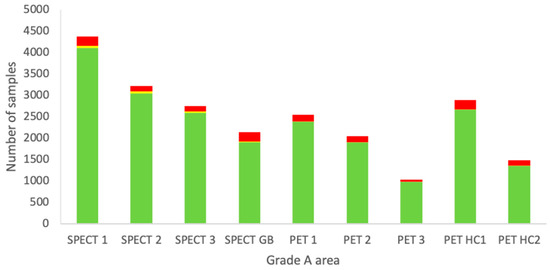
Figure 3.
Combined data of all EM sampling techniques from the period 2010–2022 of each individual grade A area at the Department of NMMI. Green: below the alert level (compliant). Yellow: between the alert level and the action limit (alert). Red: above the action limit (excursion).
Each area has a different purpose and it can be seen that some locations are used more extensively than others. For example, for grade A areas, the measurements are more or less proportional to the number of preparations due to passive air measurements being carried out during each manufacturing process. The other sampling types are routine and should not vary much between the locations. No clear trend is visible from Figure 4, but based on a Fisher’s exact test, the SPECT glovebox (GB) was found to significantly differ from all the other locations in terms of excessive excursions of the action limits. SPECT 1, SPECT 2, and SPECT 3 had the lowest number of excursions, being statistically significant compared to the other areas, except for PET 3.

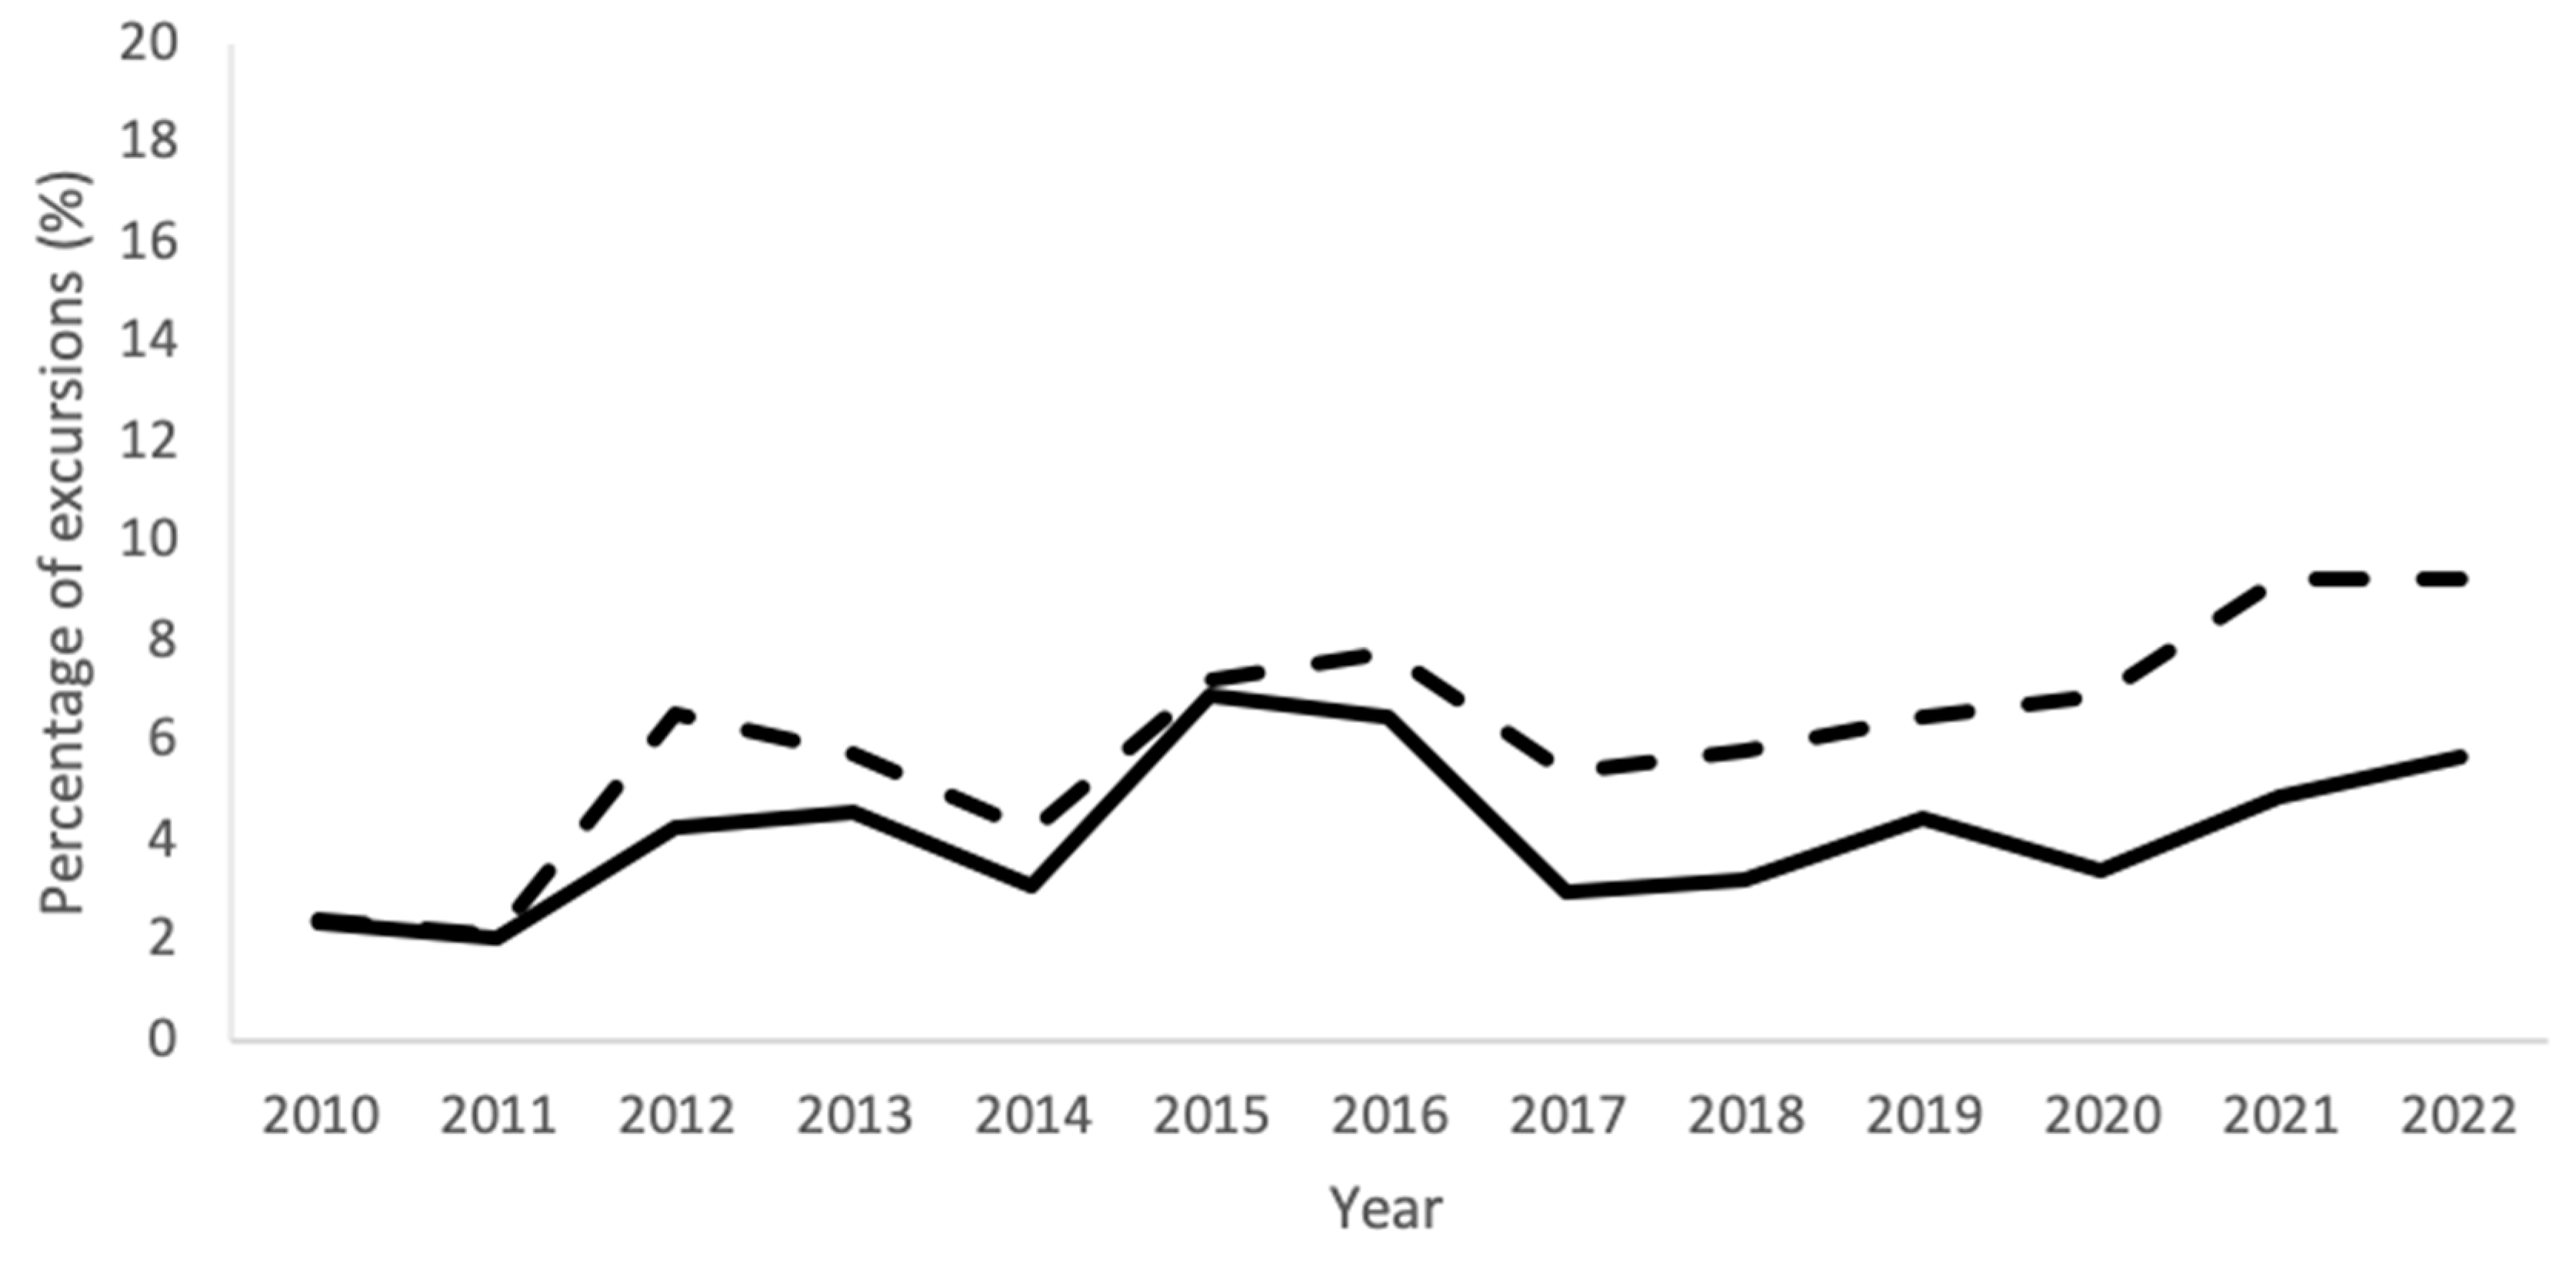
Figure 4.
Percentages of excursions of all EM sampling techniques combined for each year from 2010–2022 for the complete Department of NMMI (solid line) and for the EU-GMP grade A areas (dashed line).
Figure 4 shows the timeline of the mean percentage of excursions of the data of all EM techniques combined, for the entire Department of NMMI and the grade A areas separately. The percentage of excursions shows a similar trend for both with the exception of 2020–2022, in which grade A rooms had a higher relative occurrence of excursions.
3.3. Seasonal Variation
Data of the period 2010–2022 of the passive air sampling measurements were sorted according to the time of the year they were measured. The years were divided into four trimesters (Q1, Q2, Q3, and Q4) to assess any possible influence of the seasons on the outcomes of the passive air sampling. From Table 2, it appears that in proportion the data are similar (alert limit excursions 1.05–1.33%, action limit excursions 3.99–4.86%). The frequency of measuring was different, with Q2 having approximately 1000 fewer measurements than Q4. Only Q3 significantly differed from Q2 (p = 0.0058) and Q4 (p= 0.007). There were no further significant differences between trimesters.
Table 2.
Percentage of EM measurements below the alert level (compliant), between the alert level and action limit (alert), and above the action limit (excursion) per quarter over the period 2010–2022.
3.4. Contamination Recovery Rate
The contamination recovery rate (CRR) is the incidence rate of any level of microbiological contamination of the environmental samples taken and was used in addition to the frequency measurements. Because the revised EU-GMP Annex 1 does not allow any microbiological growth for locations with classification A (in contrast to the former version of the EU-GMP Annex 1), the CRR can be used as a measure for the current state and if improvements must be made to meet these requirements. From the Fisher’s exact test, it became clear that the observed differences in CRR for the different types of microbiological monitoring were significant (Table 3).
Table 3.
Contamination recovery rate (CRR) of areas with GMP classification A for combined active air sampling, passive air sampling, and contact prints over the period 2010–2022.
When comparing the CRR of grade A areas over the years 2010–2022, it becomes visible that the first two years (2010 and 2011) and the last two years (2021 and 2022) showed the highest percentage. Between those years, the CRR fluctuated between 4.6% and 8.6% with 2014 being significantly lower than all years except for 2013 and 2017 (Figure 5).
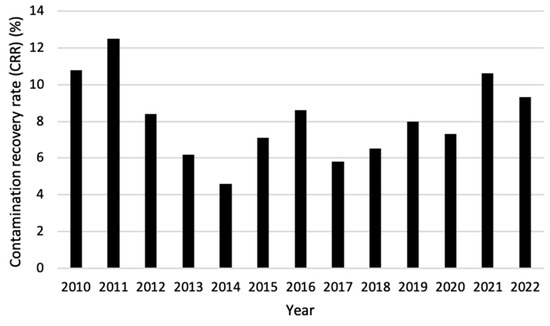
Figure 5.
Contamination recovery rate (CRR) per year for areas with GMP classification A for combined active air sampling, passive air sampling, and contact prints over the period 2010–2022.
4. Discussion
The production of radiopharmaceuticals at the Department of NMMI of the UMCG is performed under GMP conditions as legally required. The EU-GMP Annex 1 [4] and as of 23 August 2023 the revised version [5] is an important guideline that must be adhered to for aseptic handling and for minimizing microbial contamination. To assure the quality of the sterile environment, EM is routinely performed and the results are recorded and archived. According to GMP guidelines, corrective and preventive actions (CAPAs) are taken whenever necessary. This article analyzed the EM data collected over the period 2010–2022 to assess any trends and possible deviations, and to find out how compliance with GMP has influenced the quality of the conditions in the cleanrooms over the years.
The frequency of conducted EM gradually increased between the start and the end of the assessed period. There was a trend of increased action limit excursions observed between 2010–2022 for active air sampling and RODAC sampling.
Figure 1A shows a clear drop in the number of outcomes during 2020. This may be explained by the COVID-19 epidemic, causing an abatement in the number of scans. Therefore, radiopharmaceuticals were needed to a lesser extent which is reflected in decreased monitoring data [13].
Differences in numbers between the sampling techniques over the years can be explained by many factors, e.g., additional samples were taken at some locations and sometimes rooms fell out of use for GMP practices, which applies to the SPECT section from 2019 on.
The sample frequency of passive air sampling was influenced by the number of preparations, which varied between the years depending on the number of patients and scans to be carried out. Incidentally, measurements were not carried out (forgotten, human error, lack of staff) and were in most cases corrected by an extra measurement at the beginning of the following month. Sometimes, two measurements were taken close to each other, while a third would be measured far away from the second, resulting in a larger gap between these last two measurements and thus creating a period with no data. Both situations could be because the sampling dates differ per location. A practical solution would be to perform the measurements at a fixed time, e.g., the first day of each month; such a deviation could be prevented.
It appeared that the overall proportions between compliant outcomes and the excursions of the action limit were larger in the data of grade A area (Figure 2) than in the data of all rooms combined (Figure 1). Thus, the grade A areas complied significantly less with GMP specifications than the combined data from all sampled premises at the Department of NMMI (p < 0.00001; two-sided Fisher’s exact test). This cannot be explained by the seasonal conditions (Figure 5, Table 1). This is likely to be due to the stricter limits of GMP for grade A areas. Before 2023, one single cfu per, e.g., 2–3 months was regarded as a more or less regular excursion, as long as the average amount of cfus was far below 1. Furthermore, sampling was performed more frequently in grade A areas, e.g., passive air sampling outcomes for grade A area added up to about half of that passive air sampling of the entire department over the period investigated. In contrast, for grade C hot cells, the risk of microbial excursions is neglectable.
The glovebox A cabinet revealed more microbiological excursions than the other grade A areas (p < 0.0001; two-sided Fisher’s exact test) (Figure 3), which may be explained by the higher number and the complexity of manual activities performed in this cabinet during radiopharmaceutical production combined with a rather small working surface. Moreover, when many objects are placed on this surface, this will enhance the contamination risk.
As no structural adjustments were made in the procedures at the Department of NMMI during the period of 2010–2022, the only partial reason for the increase in relative excursions in recent years for active air sampling and contact plates (active monitoring) would be aging of the extensively used equipment. As the staff are known to be the largest source of microbial contamination, the most likely causes are suboptimal personnel gowning, room ventilation, and/or surface disinfection. All can be positively influenced by increasing the motivation and training of the personnel. The COVID-19 pandemic may also have had a negative influence on these matters due to shortages in disinfectants and gowning materials as a result of this outbreak [14]. This was, however, not seen for passive air monitoring. Theoretically, all sampling techniques monitor similar sources, e.g., contact plates and passive air sampling resemble each other to great extent, as both sample settling microorganisms. Due to the lower frequency of contact plates sampling and active air sampling, these methods only provide a snapshot compared to the more frequent passive air sampling. The increase in the number of contact plate sampling in 2011 may be explained by the ongoing cleanroom qualification of the new PET-GMP cleanroom in that year.
The most viable data are those obtained from passive air sampling because this was performed during every production, being considerably more frequent than for the other sampling methods. A rise in the number of measurements from 2010 to 2018 was seen, which is in accordance with the increasing number of radiopharmaceuticals that were produced during this period. There was a subsequent dip in the number of monitoring samples between 2019 and 2022. This may be attributed to replacement of an air filter in one of the LAF cabinets in 2019 that could therefore not be used for production and hence no monitoring was performed. Furthermore, the number of productions for 2021 and 2022 was lower than in previous years due to the decreased number of scans performed during the COVID-19 pandemic, causing a concomitant reduction in the number of monitoring samples.
A general trend visible for all EM methods was the decrease in the number of measurements between the alert level and action limit. A plausible explanation is that, since 2011, the rules within the Department of NMMI have been sharpened for locations with grade A areas. For the years 2012–2022 the action limit for active air sampling, passive air sampling, and contact plates in grade A was 1 cfu.
Figure 4 shows the percentage of total excursions in each year for all EM tests combined, for the complete Department of NMMI as well as for only the grade A areas. The data are comparable for both graphs, although grade A areas start to have slightly higher percentages of excursions from 2020 onwards, which resembles the increase in excursions shown in Figure 1B,C and Figure 2B,C. It is likely that the excursions in the grade A areas were due to the causes mentioned earlier.
Table 2 presents passive air monitoring data of the period 2010–2022 divided into four trimesters (Q1–Q4). Seasonal conditions are a major influence on the survival of airborne bacteria, though important factors as humidity and temperature need to be in certain ratios to one another for each specific species of bacterium or fungus to cause this survival [15]. Each trimester has its own specific temperature and humidity, resulting in different conditions for microorganisms to thrive. It appears that, even though the weather conditions of the respective trimesters differ [16], this is not reflected in major changes in excursions. A plausible reason for this is that the temperature and air humidity in the cleanroom during the year are kept constant.
The percentage of measurements containing microbiological contamination was the lowest for passive air sampling and the highest for the contact prints. This indicates that contamination may be caused by improper cleaning of the starting materials or by staff working sub optimally regarding aseptic handling. Another issue is that it becomes increasingly difficult to clean aging facilities and equipment. When the data of active air sampling, passive air sampling, and contact prints are compared to the overall data during 2010–2022, an increase in the CRR was noticed in 2021–2022.
The CRR is defined as the incidence of any microbial growth over time, indifferent of the number of cfus found. The United States Pharmacopeia (USP) requires a CRR less than 1% to be satisfactory for aseptic handling for ISO 5 cleanrooms, which can be compared to EU-GMP grade A. Less than 1% is however very hard to achieve in practice, and a CRR of less than 10% is reasonable according to Boom et al. [12]. When this is applied, the greater part of the recorded period 2010–2022 satisfies this demand, having only crossed this limit in the early years and once in 2021. This was mainly caused by an increased percentage of excursions for active air sampling and contact prints. The CRR of passive air sampling did not increase or decrease remarkably over the years. Therefore, not only contamination caused by an infected workbench, but also contamination from the air should be reduced for the coming years. It is difficult to say what exactly caused the increase in CRR, but to find this out more background data regarding the working method, materials used, including their contamination rate, the way staff are trained aseptically, the different radiopharmaceuticals that are produced, etc., need to be obtained.
Many pharmacy-associated concerns in Europe use either the GMP Annex 1 or a plan that is derived from these guidelines. The goal is to establish a highly effective quality assurance system [17]. The revision of Annex 1 has come with many changes, with some clarifying previously not well-defined subjects and statements, and some setting new demands for cleanrooms, disinfecting, and microbiological monitoring, whereby the revision came into effect from 25 August 2023. Also, in the United States the requirements for microbiological conditions in cleanrooms have recently been redefined in chapter <797> of the United States Pharmacopeia [18].
Due to the stricter requirements of the new version of Annex 1 of the EU-GMP, we needed to change the focus of this paper. Especially, the change in the grade A requirement of <1 cfu to =0 cfus for all microbial parameters has a great impact. Under the Annex 1 from 2008, this implied that an incidental excursion would not be that severe, but when contamination is encountered frequently, action should be undertaken. In contrast, in the revised version of the EU-GMP Annex 1 this is changed into no growth at all, implying a major additional task for quality assurance and cleanroom staff. When a cfu is found in a grade A area, an investigation regarding the cause should be started, taking up valuable time and resources. As aseptic handling is performed manually, contamination is possible, no matter what precautions are taken [12]. For complex aseptic preparations, a microbial shelf life of one week is acceptable [7]. As most radiopharmaceuticals have a considerable shorter physical and chemical shelf life, applying this guideline may lead to an overestimation of measures taken to mitigate risks of microbial contamination of a radiopharmaceutical preparation.
Future improvements may encompass the introduction of an automated process by, e.g., robots and modules as well as the prevention of direct human manipulation before, during, and after aseptic procedures in a grade A zone with B background. Furthermore, disinfection of all introduced materials in a grade A zone must be optimized and evaluated. Spraying methods should be replaced by mechanical surface cleaning using towels [19], while the use of sporicidal cleaning agents should prevent contamination with Bacillus species. Monitoring in class A areas is to be restricted to critical steps only (e.g., aseptic filling, sampling for sterility control, assembly of a sterile filter). Finally, systematic application of both glove and finger prints needs to be implemented. Up until now, this is only performed in the media fill setting.
EM is a necessary tool to constantly assure the quality of the radiopharmaceuticals produced. By evaluation of the results collected from 2010–2022, the weakest points were found and based on those results, improvements can be made for the coming years to further increase the quality of the products. With the revision of EU-GMP Annex 1, it is important that the number of excursions is further reduced to still fulfil the requirements.
Limited data and different regulations during the first years of the analyzed period (2010–2022) made it less easy to compare this with data of later years. Furthermore, some data were not recorded, like minor accidents or events that could have influenced the conditions in the different cleanrooms. This leads to the absence in causal links to some trends found in the data and resulting in no clear cause, making it impossible to recommend specific improvements for any found deterioration, especially for the early parts of the assessed period.
5. Conclusions
Based on the comprehensive retrospective analysis of the EM data, it is concluded that, in order to become fully compliant with the requirements set in the recent revision of EU-GMP Annex 1, strategies to further improve microbiology and thereby the quality of the radiopharmaceutical products at the department of NMMI of the UMCG are advisable. These include: improvement of cleaning and disinfection procedures; more efficient working methods and further automation; optimization of all conditions under which aseptic manufacturing is performed; broader application of glove and finger prints.
Our analysis offers good insight into the dynamics of microbiological hygiene in an aseptic production facility under the influence of (minor) adaptations in procedures and equipment, and reflects the current situation in relation to GMP requirements in a historical perspective. Based on this, it is easier to take well-balanced decisions for necessary adaptations with the aim to fully comply with current, stringent regulations.
Author Contributions
Conceptualization, H.H.B. and H.J.W.; methodology, H.T.T., M.M.W., D.G., and S.M.; formal analysis, T.W.T.P. and L.B.S.B.; writing—original draft preparation, H.H.B., M.M.W. and H.J.W.; writing—review and editing, All authors; visualization, T.W.T.P. and L.B.S.B.; supervision, H.H.B. and H.J.W. All authors have read and agreed to the published version of the manuscript.
Funding
This research received no external funding.
Institutional Review Board Statement
Not applicable.
Informed Consent Statement
Not applicable.
Data Availability Statement
The original contributions presented in the study are included in the article, further inquiries can be directed to the corresponding author.
Conflicts of Interest
The authors declare no conflicts of interest.
References
- European Commission. The Rules Governing Medicinal Products in the European Union. Volume 4. EU Guidelines for Good Manufacturing Practice for Medicinal Products for Human and Veterinary Use; Directorate-General for Health and Food Safety: Brussels, Belgium, 2022; Available online: https://health.ec.europa.eu/medicinal-products/eudralex/eudralex-volume-4_en (accessed on 17 May 2024).
- United States Food and Drugs Administration (US FDA). Current Good Manufacturing Practice (CGMP) Regulations. Available online: https://www.fda.gov/drugs/pharmaceutical-quality-resources/current-good-manufacturing-practice-cgmp-regulations (accessed on 17 May 2024).
- World Health Organization (WHO). Health Products Policy and Standards. Good Manufacturing Practices. Available online: https://www.who.int/teams/health-product-policy-and-standards/standards-and-specifications/gmp (accessed on 17 May 2024).
- European Commission. Annex 1. Manufacture of sterile medicinal products. In The Rules Governing Medicinal Products in the European Union. Volume 4. EU Guidelines for Good Manufacturing Practice for Medicinal Products for Human and Veterinary Use; Directorate-General for Health and Food Safety: Brussels, Belgium, 2008; Available online: https://health.ec.europa.eu/system/files/2016-11/2008_11_25_gmp-an1_en_0.pdf (accessed on 17 May 2024).
- European Commission. Annex 1. Manufacture of sterile medicinal products. In The Rules Governing Medicinal Products in the European Union. Volume 4. EU Guidelines for Good Manufacturing Practice for Medicinal Products for Human and Veterinary Use; Directorate-General for Health and Food Safety: Brussels, Belgium, 2022; Available online: https://health.ec.europa.eu/system/files/2022-08/20220825_gmp-an1_en_0.pdf (accessed on 17 May 2024).
- European Commission. Annex 3. Manufacture of radiopharmaceuticals. In The Rules Governing Medicinal Products in the European Union. Volume 4. EU Guidelines for Good Manufacturing Practice for Medicinal Products for Human and Veterinary Use; Directorate-General for Health and Food Safety: Brussels, Belgium, 2023; Available online: https://health.ec.europa.eu/system/files/2016-11/2008_09_annex3_en_0.pdf (accessed on 17 May 2024).
- Boom, F.; Beaney, A. Aseptic handling. Chapter 31. In Practical Pharmaceutics. An International Guideline for the Preparation, Care and Use of Medicinal Products, 2nd ed.; Le Brun, P., Crauste-Manciet, S., Krämer, I., Smith, J., Woerdenbag, H., Eds.; Springer Nature: Cham, Switzerland, 2023; pp. 749–765. [Google Scholar] [CrossRef]
- Lange, R.; Schreuder, N.; Hendrikse, H. Radiopharmaceuticals. Chapter 23. In Practical Pharmaceutics. An International Guideline for the Preparation, Care and Use of Medicinal Products, 2nd ed.; Le Brun, P., Crauste-Manciet, S., Krämer, I., Smith, J., Woerdenbag, H., Eds.; Springer Nature: Cham, Switzerland, 2023; pp. 531–550. [Google Scholar] [CrossRef]
- European Commission. Annex 17. Real time release testing and parametric release. In The Rules Governing Medicinal Products in the European Union. Volume 4. EU Guidelines for Good Manufacturing Practice for Medicinal Products for Human and Veterinary Use; Directorate-General for Health and Food Safety: Brussels, Belgium, 2018; Available online: https://health.ec.europa.eu/system/files/2018-06/2018_annex17_en_0.pdf (accessed on 17 May 2024).
- Beckman Coulter Life Sciences. GMP Cleanrooms Classification and Routine Environmental Monitoring. Available online: https://www.beckman.com/resources/reading-material/whitepapers/gmp-cleanrooms-classification-and-routine-environmental-monitoring#:~:text=Unlike%20Classification%2C%20Routine%20Cleanroom%20Monitoring,cleanroom%20contamination%20level%20over%20time (accessed on 23 March 2023).
- Kim, H.J. Statistical notes for clinical researchers: Chi-squared test and Fisher’s exact test. Restor. Dentist. Endod. 2017, 4, 152–155. [Google Scholar] [CrossRef] [PubMed]
- Boom, F.A.; Le Brun, P.P.H.; Boehringer, S.; Touw, D.J. Microbiological monitoring during aseptic handling: Methods, limits and interpretation of results. Eur. J. Pharm. Sci. 2020, 155, 105540. [Google Scholar] [CrossRef] [PubMed]
- Wong, W.L.; Ross, P.; Peters, K.; Frenz, M.; Hai, T.; Ridgeon, A.; Toop, R.; Strouhal, P.; Bomanji, J. The COVID-19 pandemic: Impact on NHS England PET-CT services and lessons learnt. Nucl. Med. Commun. 2021, 42, 127–137. [Google Scholar] [CrossRef] [PubMed]
- Kampf, G.; Scheithauer, S.; Lemmen, S.; Saliou, P.; Suchomel, M. COVID-19-associated shortage of alcohol-based hand rubs, face masks, medical gloves, and gowns: Proposal for a risk-adapted approach to ensure patient and healthcare worker safety. J. Hosp Infect. 2020, 105, 424–427. [Google Scholar] [CrossRef] [PubMed]
- Hoeksma, P.; Aarnink, A.; Ogink, N. Effect of Temperature and Relative Humidity on the Survival of Airborne Bacteria; Livestock Research, Livestock Research Report 864; University & Research Centre: Wageningen, The Netherlands, 2015. [Google Scholar]
- Climate Data. Klimaat Groningen (Koninkrijk der Nederlanden). Available online: https://nl.climate-data.org/europa/koninkrijk-der-nederlanden/groningen/groningen-930/ (accessed on 2 April 2023).
- Gapp, G.; Holzknecht, P. Risk analysis of sterile production plants: A new and simple, workable approach. PDA J. Pharm. Sci. Technol. 2011, 65, 217–226. [Google Scholar] [CrossRef] [PubMed]
- Summers, A. Advanced compounding; how to investigate microbiological excursions at a sterile compounding facility. Int. J. Pharm. Compd. 2023, 27, 114–121. [Google Scholar] [PubMed]
- Boom, F.A.; Le Brun, P.P.H.; Boehringer, S.; Kosterink, J.G.W.; Touw, D.J. Improving the aseptic transfer procedures in hospital pharmacies. Part B: Evaluation of disinfection methods for materials with a non-sterile surface. Eur. J. Hosp. Pharm. 2021, 28, 271–275. [Google Scholar] [CrossRef] [PubMed]


Disclaimer/Publisher’s Note: The statements, opinions and data contained in all publications are solely those of the individual author(s) and contributor(s) and not of MDPI and/or the editor(s). MDPI and/or the editor(s) disclaim responsibility for any injury to people or property resulting from any ideas, methods, instructions or products referred to in the content. |
© 2024 by the authors. Licensee MDPI, Basel, Switzerland. This article is an open access article distributed under the terms and conditions of the Creative Commons Attribution (CC BY) license (https://creativecommons.org/licenses/by/4.0/).