Article

Single-Cell Transcriptome Profiling of Scale Drop Disease Virus-Infected Asian Seabass (Lates calcarifer)

1
Singapore Immunology Network (SIgN), Agency for Science, Technology and Research (A*STAR), 8A Biomedical Grove, Immunos #03-06, Singapore 138648, Singapore
2
A*STAR Infectious Diseases Labs (A*STAR ID Labs), Agency for Science, Technology and Research (A*STAR), 8A Biomedical Grove, Immunos #05-13, Singapore 138648, Singapore
3
UVAXX Pte Ltd., Singapore 159546, Singapore
4
Lee Kong Chian School of Medicine, Nanyang Technological University, Singapore 636921, Singapore
5
School of Biological Sciences, Nanyang Technological University, Singapore 637551, Singapore
6
Immunology Translational Research Program, Department of Microbiology and Immunology, Yong Loo Lin School of Medicine, National University of Singapore, Singapore 117545, Singapore
7
Department of Immunology & Microbiology, Yong Loo Lin School of Medicine, National University of Singapore, Singapore 117597, Singapore
*
Author to whom correspondence should be addressed.
These authors contributed equally to this work.
Aquac. J. 2024, 4(2), 28-43; https://doi.org/10.3390/aquacj4020003
Submission received: 16 January 2024 / Revised: 19 March 2024 / Accepted: 30 March 2024 / Published: 7 April 2024

Abstract

:
The study aims to characterize the immune cell landscape in convalescent Asian seabass (Lates calcarifer) blood samples after exposure to scale-drop disease virus (SDDV). Traditional immunophenotyping approaches used in human and mouse studies are impractical for non-model organisms like the Asian seabass due to the lack of specific antibody-based reagents. To overcome this challenge, 10x Genomics single-cell RNA sequencing was employed. The analysis of blood samples revealed 24 distinct leukocyte clusters, with elevated proportions of B cells, granulocytes, and T cells in the convalescent group compared to the uninfected group. While distinguishing granulocyte and macrophage subsets was challenging, the analysis of differential gene expression in the macrophage population indicated that the upregulated genes were linked to inflammatory processes. Specific T cell clusters showed notable expressions of cd4-1, cd8a, perforin-1 and il-2rβ, suggesting the presence of CD4+ T helper (Th), CD8+ cytotoxic T (Tc) cells, immature T cells, and naive T cells. Attempts to categorize CD4+ T cells into Th subtypes lacked clear distinctions, while CD8+ T cells exhibited three clusters, predominantly Tc1 cells. Furthermore, comparisons between convalescent and uninfected groups revealed increased percentages of activated and antibody-secreting B cells in the convalescent group. This single-cell analysis provides vital insights into the immune cell dynamics in convalescent and uninfected Asian seabass, providing valuable information on potential immune responses to SDDV infection.

1. Introduction

Lates calcarifer, commonly referred to as the Asian seabass or barramundi, holds significant commercial value in the fishing industry. To meet the supply demand, the Asian seabass industry has been steadily expanding in the past decade. However, the emergence of infectious diseases has seriously impacted the survival of farmed livestock, posing a major threat to the economic sustainability of this industry [1,2,3,4,5,6]. This challenge is exacerbated by the absence of effective commercial vaccines.
Scale drop disease virus (SDDV) is a Megalocytivirus belonging to the Iridoviridae family that causes cumulative mortality ranging from 40% and 60% affecting in Asian seabass [1,2,7]. Initially reported in Singapore farms [1,2], SDDV outbreaks have spread to other parts of Southeast Asia, including Indonesia [2], Thailand [7], and Malaysia [7]. Interestingly, SDD has even been observed in Asian seabass cultivated in freshwater ponds in Thailand [8], where its occurrence is not confined to marine environments. Clinical manifestations in infected fish typically encompass darkened bodies, scale loss, fin and tail erosion, cloudy eyes and red bellies, accompanied by inflammation in the skin, muscles, and systemic vasculature, along with tissue necrosis in vital organs like the spleen and kidney [1,2,7,9]. Despite the regional impact, limited knowledge exists concerning the molecular mechanisms of immune defense against SDDV, underscoring an urgent need to enhance our understanding of host immunity to develop more effective vaccines for aquaculture.
The fish immune system encompasses a diverse array of host defense mechanisms involving various cell types. Advances in histology and flow cytometry have accelerated the classification of immune cells over time. While techniques like immunophenotyping via microscopy and flow cytometry are commonly used to identify and characterize immune cells in mammals through specific cell surface markers, these approaches are impractical for non-model organisms like the Asian seabass such as the lack of specific antibody-based reagents. The advent of single-cell RNA sequencing (scRNA-seq) has provided high-resolution data to explore immune cell composition, classification, and function at the individual cell level. Moreover, scRNA-seq has recently been applied in aquatic animals, including bony fishes [10,11,12,13,14,15,16,17], shellfish [18], and crustaceans [19], ushering in a new era for analyzing cellular heterogeneity in non-mammalian organisms.
The objective of this study is to delineate the landscape of immune cells in both uninfected and recovering Asian seabass previously infected by SDDV, also known as convalescent, using scRNA-seq. These fish samples were randomly collected from a Singaporean farm, providing insights into the immune responses of Asian seabass to natural SDDV infection.

2. Materials and Methods

2.1. Acquisition of SDDV-Infected and -Uninfected Healthy Asian Seabass and Sample Collection

Four uninfected and five SDDV-infected convalescent Asian seabass, measuring approximately 28 ± 10 cm, were obtained from a private commercial fish farm located in Singapore. The convalescent fishes were acquired three weeks after the SDDV outbreak, during which they exhibited evident clinical symptoms but showed resistance to SDDV mortality. These fishes were euthanized using clove oil at a concentration of 400 mg/L. Subsequently, the spleen samples were collected and preserved in RNAlaterTM reagent (Thermofisher Scientific, Waltham, MA, USA) for SDDV screening by polymerase chain reaction (PCR), and blood samples were collected from the caudal vein and transferred to heparinized tubes to prevent coagulation for scRNA sequencing.

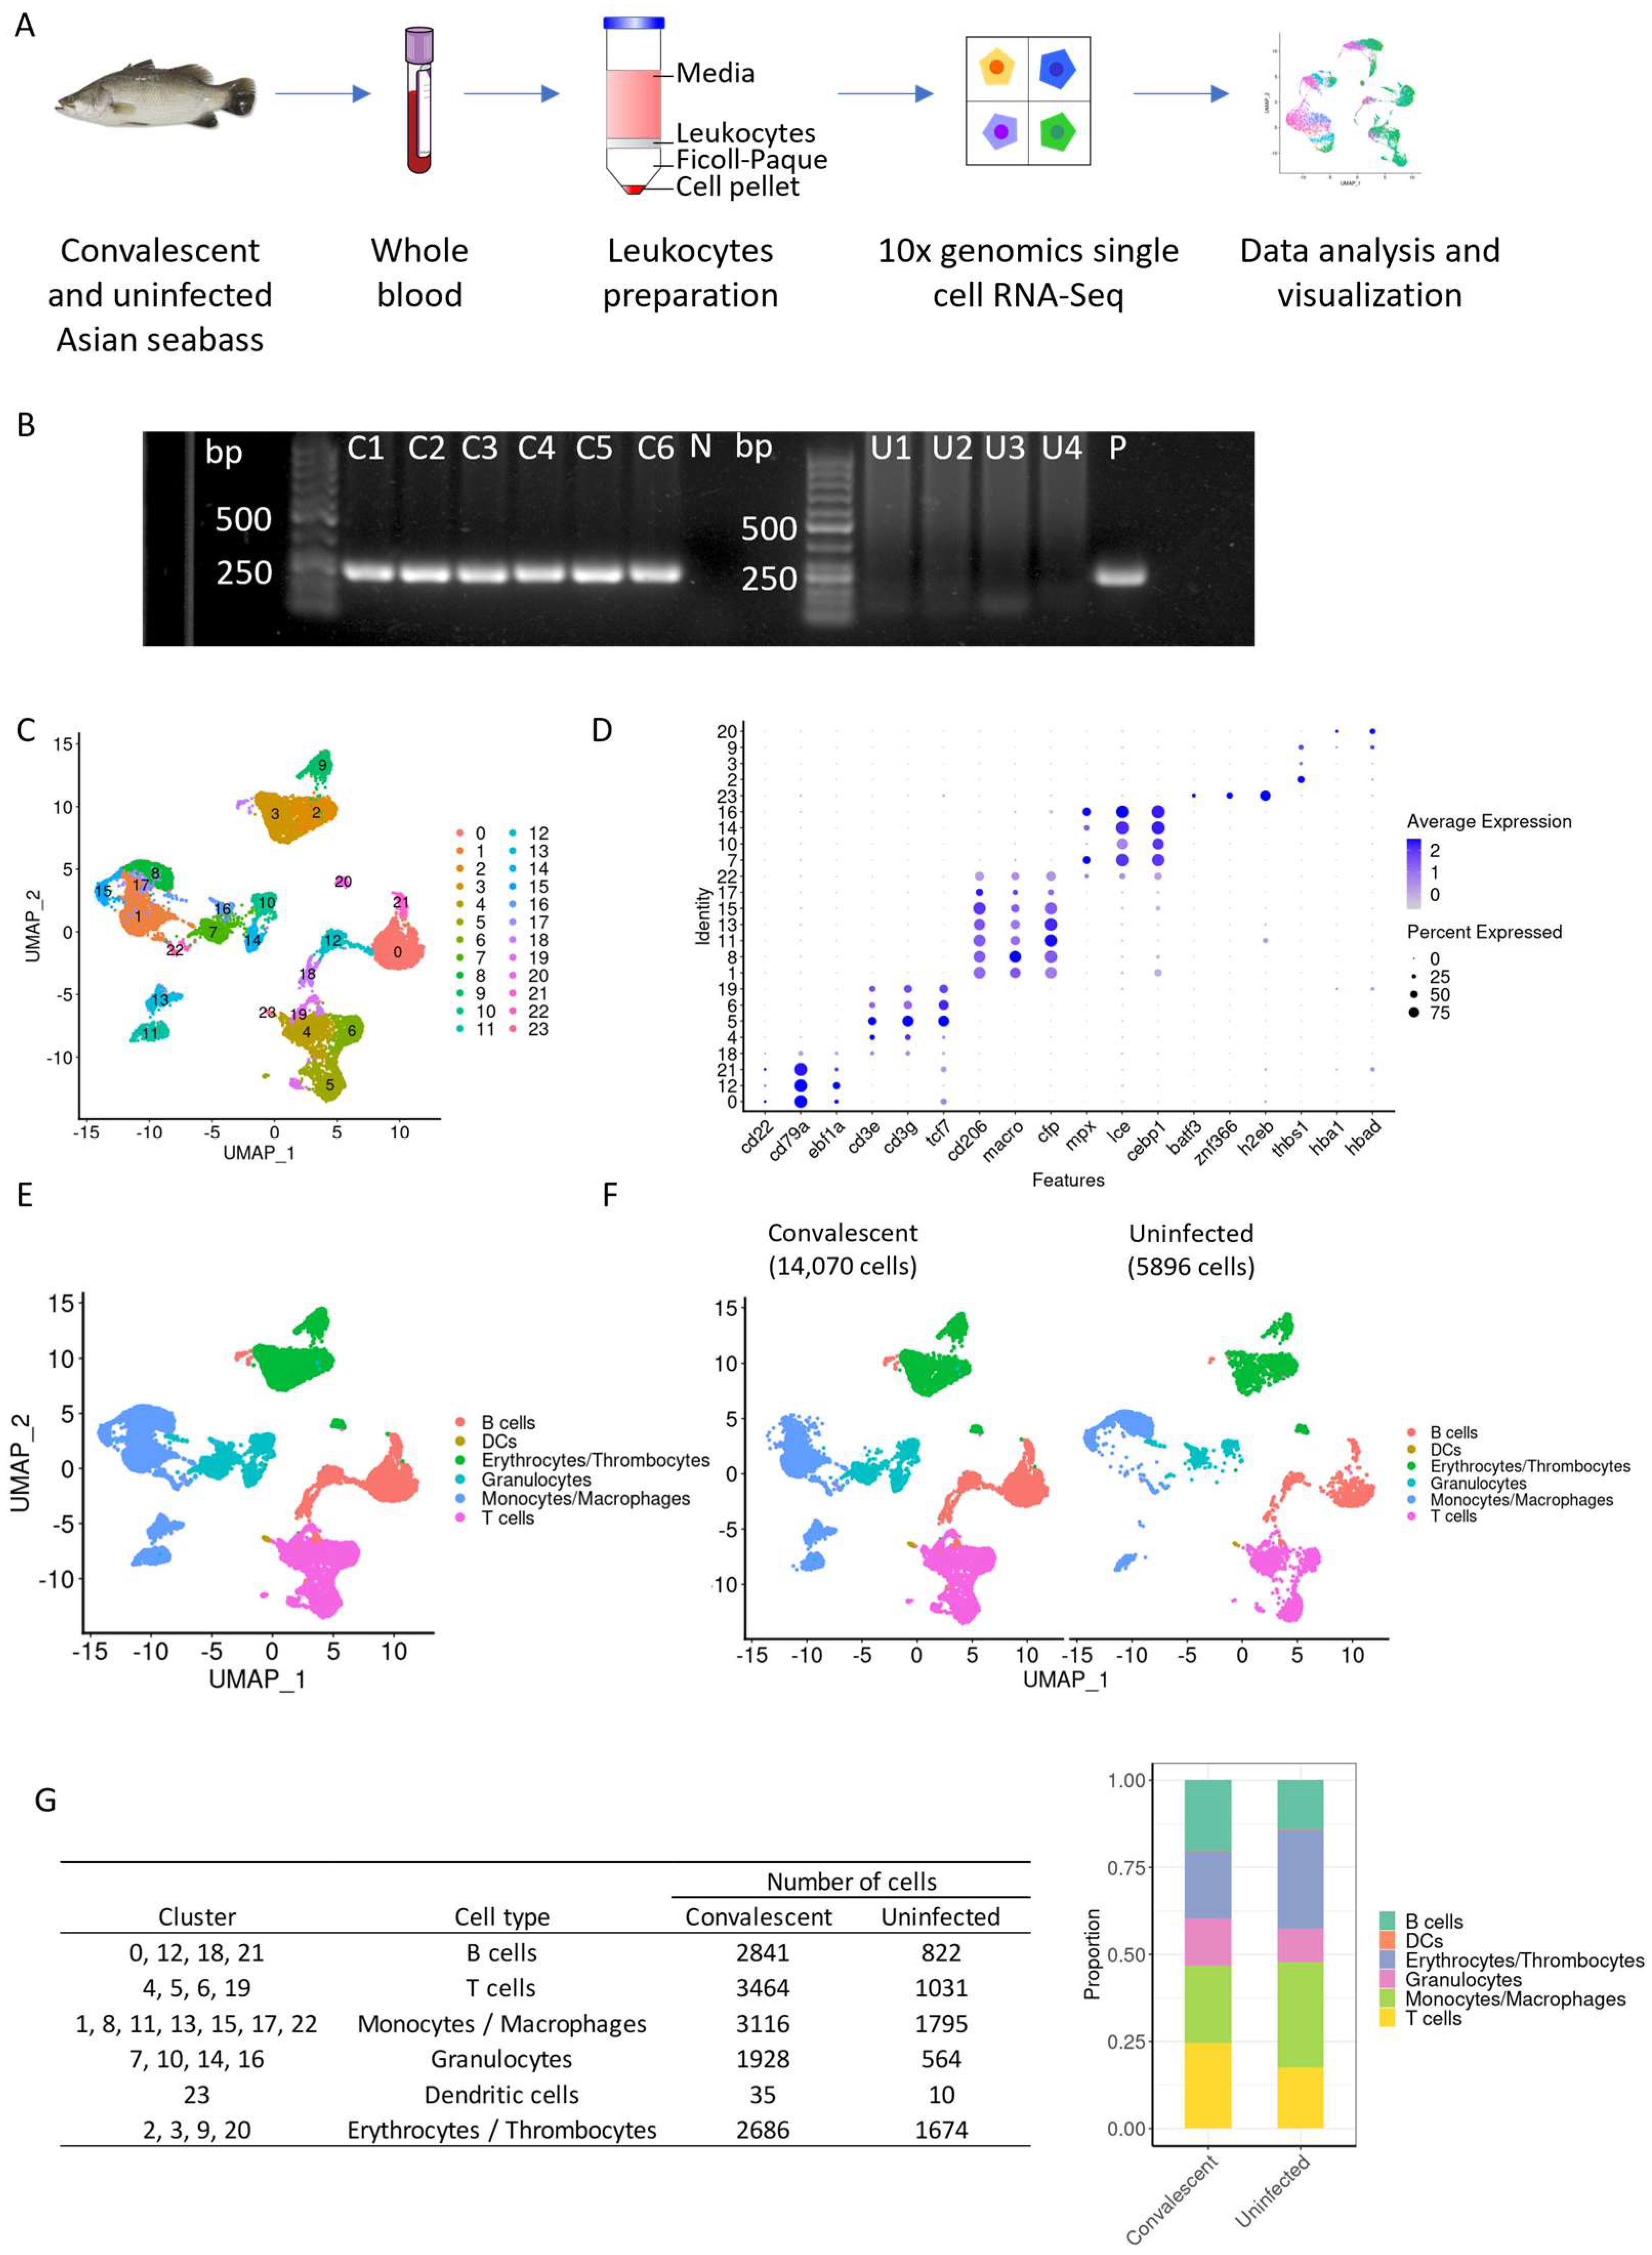
2.2. Detection of SDDV by PCR

Total DNA was extracted from convalescent and uninfected Asian seabass spleen using DNeasy Blood & Tissue Kits (Qiagen, Hilden, Germany) according to manufacturer’s protocol. A 225 bp fragment of the major capsid protein (mcp; ORF 060L) of SDDV was amplified using a forward primer SD_MCP_225_F1 (5′-TGGCCAGAGGAGGTGACTAT-3′) and a reverse primer SD_MCP_225_R1 (5′-ATCCTGACGACTTTCCACCG-3′). The PCR reaction contained 5 µL of DNA template, 2.5 µL of 10× Vibuffer A (Vivantis technologies Sdn. Bhd., Selangor, Malaysia), 0.5 µL of Taq polymerase (5 U/µL; Vivantis technologies Sdn. Bhd., Selangor, Malaysia), 1 µL of 10 mM dNTPs mix, 0.75 µL of 50 mM MgCl2, 0.5 µL of 10 µM of each primer, and DNase-free water up to a total volume of 25 µL. The thermocycler (Eppendorf, Hamburg, Germany) was employed, and the PCR cycling condition included an initial denaturation at 94 °C for 5 min, 35 cycles of denaturation at 94 °C for 30 s, annealing at 53 °C for 30 s and an extension at 72 °C for 45 s, followed by a final extension at 72 °C for 5 min. The size of the PCR products was determined using gel electrophoresis on a 1.2% agarose gel stained with GelRed® (Biotium, Fremont, CA, USA).

2.3. Leukocyte Isolation from Whole Blood and Single-Cell RNA Sequencing

Leukocyte separation from erythrocytes was achieved using the Ficoll–Paque density gradient centrifugation technique. Briefly, the whole blood suspension was gently layered onto an equivalent volume of Ficoll–Paque (density = 1.077 g/mL) in 50 mL conical tubes, followed by centrifugation at 500× g for 40 min with slow acceleration and without brake. Following centrifugation, the interface layer containing leukocytes was harvested and washed three times with the RPMI-1640 medium (Gibco, Grand Island, NY, USA). The evaluation of the cell quantity and viability was performed using 0.4% trypan blue (Sigma, St. Louis, MO, USA), which indicated that over 70% of the cells exhibited viability.
Subsequently, the cells from individual fish were labelled with different oligonucleotide-conjugated lipids using the 10x Genomics 3′ CellPlex Kit as per the user guide (CG000391 Rev B). Cellplex-labelled cells were counted and equal numbers of cells from five fish (a mix of healthy and convalescent) were pooled per batch. About 43,000 pooled cells were loaded for droplet encapsulation with the 10x Genomics Chromium Next GEM Single Cell 3′ v3.1 Gel Beads on the Chromium Controller. Single-cell gene expression libraries and cell multiplexing libraries were prepared according to the manufacturer’s protocol (CG000390 Rev C). The libraries were subjected to a dual-indexed sequencing run of 2 × 151 cycles on an Illumina Novaseq 6000 (Illumina, San Diego, CA, USA) targeting a sequencing depth of 50,000 reads/cell for gene expression and 5000 reads/cell for cell multiplexing (Figure 1A).

2.4. Single-Cell RNA Sequencing Analysis

The raw sequencing reads were demultiplexed and mapped to the most recent version of the Asian seabass genome (RefSeq assembly accession GCF_001640805.2) as per Cell Ranger-Multi’s protocol (Cell Ranger Version 7.0.0). For quality control, several criteria were applied to remove the low-quality cells and reduce multiplets. Doublets identified using Scrublet (cite) were removed from the analysis. Rare genes detected in 3 or fewer cells were removed from the gene count matrix, and cells of poor-quality were further filtered based on the following criteria: (a) cells with less than 200 genes were removed, (b) cells with more than 20% (batch 1) and 30% (batch 2) ribosomal genes counts or more than 2% mitochondrial gene counts or more than 5% heat shock-associated gene counts or more than 10% hemoglobin gene counts were removed. After quality control filtering, a total number of 19,966 cells were retained for downstream analysis (Supplementary Figure S1).
Seurat was used to analyze the data, including the normalization and transformation of the gene count matrix. The gene expression values were first normalized by total UMI counts, multiplied by 10,000 (TP10K), and then log transformed by log (TP10K + 1). The top 2000 most variable features were selected and scaled against the number of UMIs. Unsupervised dimension reduction was performed using PCA and Uniform Manifold Approximation and Projection (UMAP) on the first 20 principal components. Clusters were identified using Louvain clustering, implemented by the FindNeighbors and FindClusters functions. To assign cluster identity, the FindAllMarker function (min.pct = 0.25, logfc.threshold = 0.25) was used to obtain the top differentially expressed marker genes (DEGs) of each cluster based on the Wilcoxon rank-sum test. The clusters were labelled by examining and comparing these DEGS to gene markers found in the literature. To examine the immune cell populations more closely, granulocytes, macrophages, T and B lymphocytes were selected from the UMAP, and secondary analysis was performed to further re-cluster and analyze these immune cell populations on a higher resolution.

2.5. Pseudotime Analysis

Cells clustered in each subpopulation (granulocytes, macrophages, T and B lymphocytes) by Seurat analysis pipelines were loaded to create a Monocle object using the as.cell_data_set function implemented in Monocle 3 (version 1.0.0). A partitioned approximate graph abstraction (PAGA) is learned across all partitions to order cells according to progression along an unsupervised learning trajectory. After trajectory constructed, the orderCells function was used to define the progenitor cells (identified by DEGs obtained previously) as the root and starting point of the trajectory, and then the pseudo-time states for the remaining cells were assigned accordingly. Pseudo-time states were inferred by tracking the changes as a function of progress along the learnt trajectory by Monocle 3.

2.6. Analysis of Differentially Expressed Genes (DEGs)

To find and compare differential genes in each immune cell subpopulation between the convalescent and uninfected fish group, differential expression analysis using the DESeq2 was performed on pseudo-bulked expression profiles generated by aggregation of expression at sample-level using the AggregateExpression implemented in Seurat. This leverages the resolution offered by single-cell techniques to define the cell population labels and combines it with the statistical rigor of existing methods for differential expression analysis involving small number of samples (we can remove this line if you think it is unnecessary to explain why we use pseudo-bulk data). A fold change ≥2 and Thred < 0.1 (parameter is FDR) were used as the screening criteria to screen the most significant differential genes in each cluster. Volcano plots for the visualization of the obtained DEGS were plotted using the EnhancedVolcano package (version 1.20.0).

3. Results

3.1. Single-Cell RNA Sequencing Reveals the Presence of 24 Distinct Clusters of Blood Leukocytes

To confirm the presence of SDDV in the uninfected and SDDV-infected convalescent Asian seabass in our obtained samples, a qualitative molecular test using PCR was carried (Figure 1B). Leukocytes from both convalescent and uninfected controls fish were then isolated. Each group comprised samples from two independent experiments, resulting in a total of four healthy samples and five SDDV-infected convalescent samples. A single convalescent sample from batch 1 was removed due to the low numbers of genes captured, indicating a low-quality sample. These samples were subsequently processed for scRNA-seq using the 10× Chromium platform. The analysis revealed 10,401 cells in the leukocyte population of the healthy group. The scRNA-seq process yielded a median of 71,870 reads for each cell, constituting an assembly of 2725 genes per cell. Conversely, the SDDV-infected convalescent group displayed 16,921 identified cells, with each cell averaging 159,745 reads, assembling into 5068 genes per cell. After quality control measures were applied to the isolated cells, which included the exclusion of reads associated with ribosomes, hemoglobin, and heat shock genes, a total of 5896 and 14,070 cells were retained for subsequent analysis in the uninfected and SDDV-infected convalescent groups, respectively (Figure S1).
To cluster cells exhibiting a similar gene expression, we utilized an unsupervised cluster detection algorithm (SEURAT) and followed by visualization in two dimensions using Uniform Manifold Approximation and Projection (UMAP). The analysis revealed a total of 24 distinct cell clusters (clusters 0–23), each characterized by their unique gene expression signatures (Figure 1C and Table S1). These clusters size ranged from 44 cells within the smallest cluster to 4911 cells. The clusters were further distinguished using recognized signature genes associated with immune cells (Figure 1D–F and Figure S2). Clusters representing B cells (cluster 0, 12, 18, and 21) were confirmed by the expression of cd22, cd79a, and transcription factor ebf1a. Clusters 4, 5, 6, and 19, based on their expression of cd3ε, cd3γ, and tcf7 which encodes for T cell factor 1 [20], important for T cell differentiation and memory formation, were identified as T cells. The lysosomal markers for teleost monocytes are not well defined, but markers for macrophages (Mφ) (clusters 1, 8, 11, 13, 15, 17, and 22) through their high expression of cd206 (a C type lectin receptor present on macrophages), macro, and complement factor properdin (cfp). Clusters indicating granulocytes were identified by myeloid-specific peroxidase (mpx), low choriolytic enzyme (lce), and CCAAT/enhancer binding protein (C/EBP) 1 (cebp1) gene expression. Dendritic cells (DCs) (cluster 23) formed the smallest cluster, and were detected by the expression of basic leucine zipper transcription factor, ATF-like 3 (batf3), H-2 class II histocompatibility antigen, E-D beta chain (h2eb), and zinc finger protein 366 (znf366, also known as DC-script). While precautions were taken during leukocyte preparation, some erythrocytes and thrombocytes identified by the expression of thrombospondin 1b (thbs1), hemoglobin subunit alpha-1 (hba1) and subunit beta-2 (hbad) were still present in the samples, defined by cluster 2, 3, 9, and 20. Vertebrate evolution suggests that vertebrate-enucleated erythrocytes possess the ability to participate in the immune response [21,22,23,24,25]. Indeed, the erythrocytes also expressed immune-related genes, including activator protein-1 transcription factor c-Jun, a potent mitigator of inflammation [26]. The numbers and percentages of these distinct cell types are presented in Figure 1G. The results suggest an increase in the proportions of B cells, granulocytes, and T cells within the convalescent group when compared to the uninfected group.

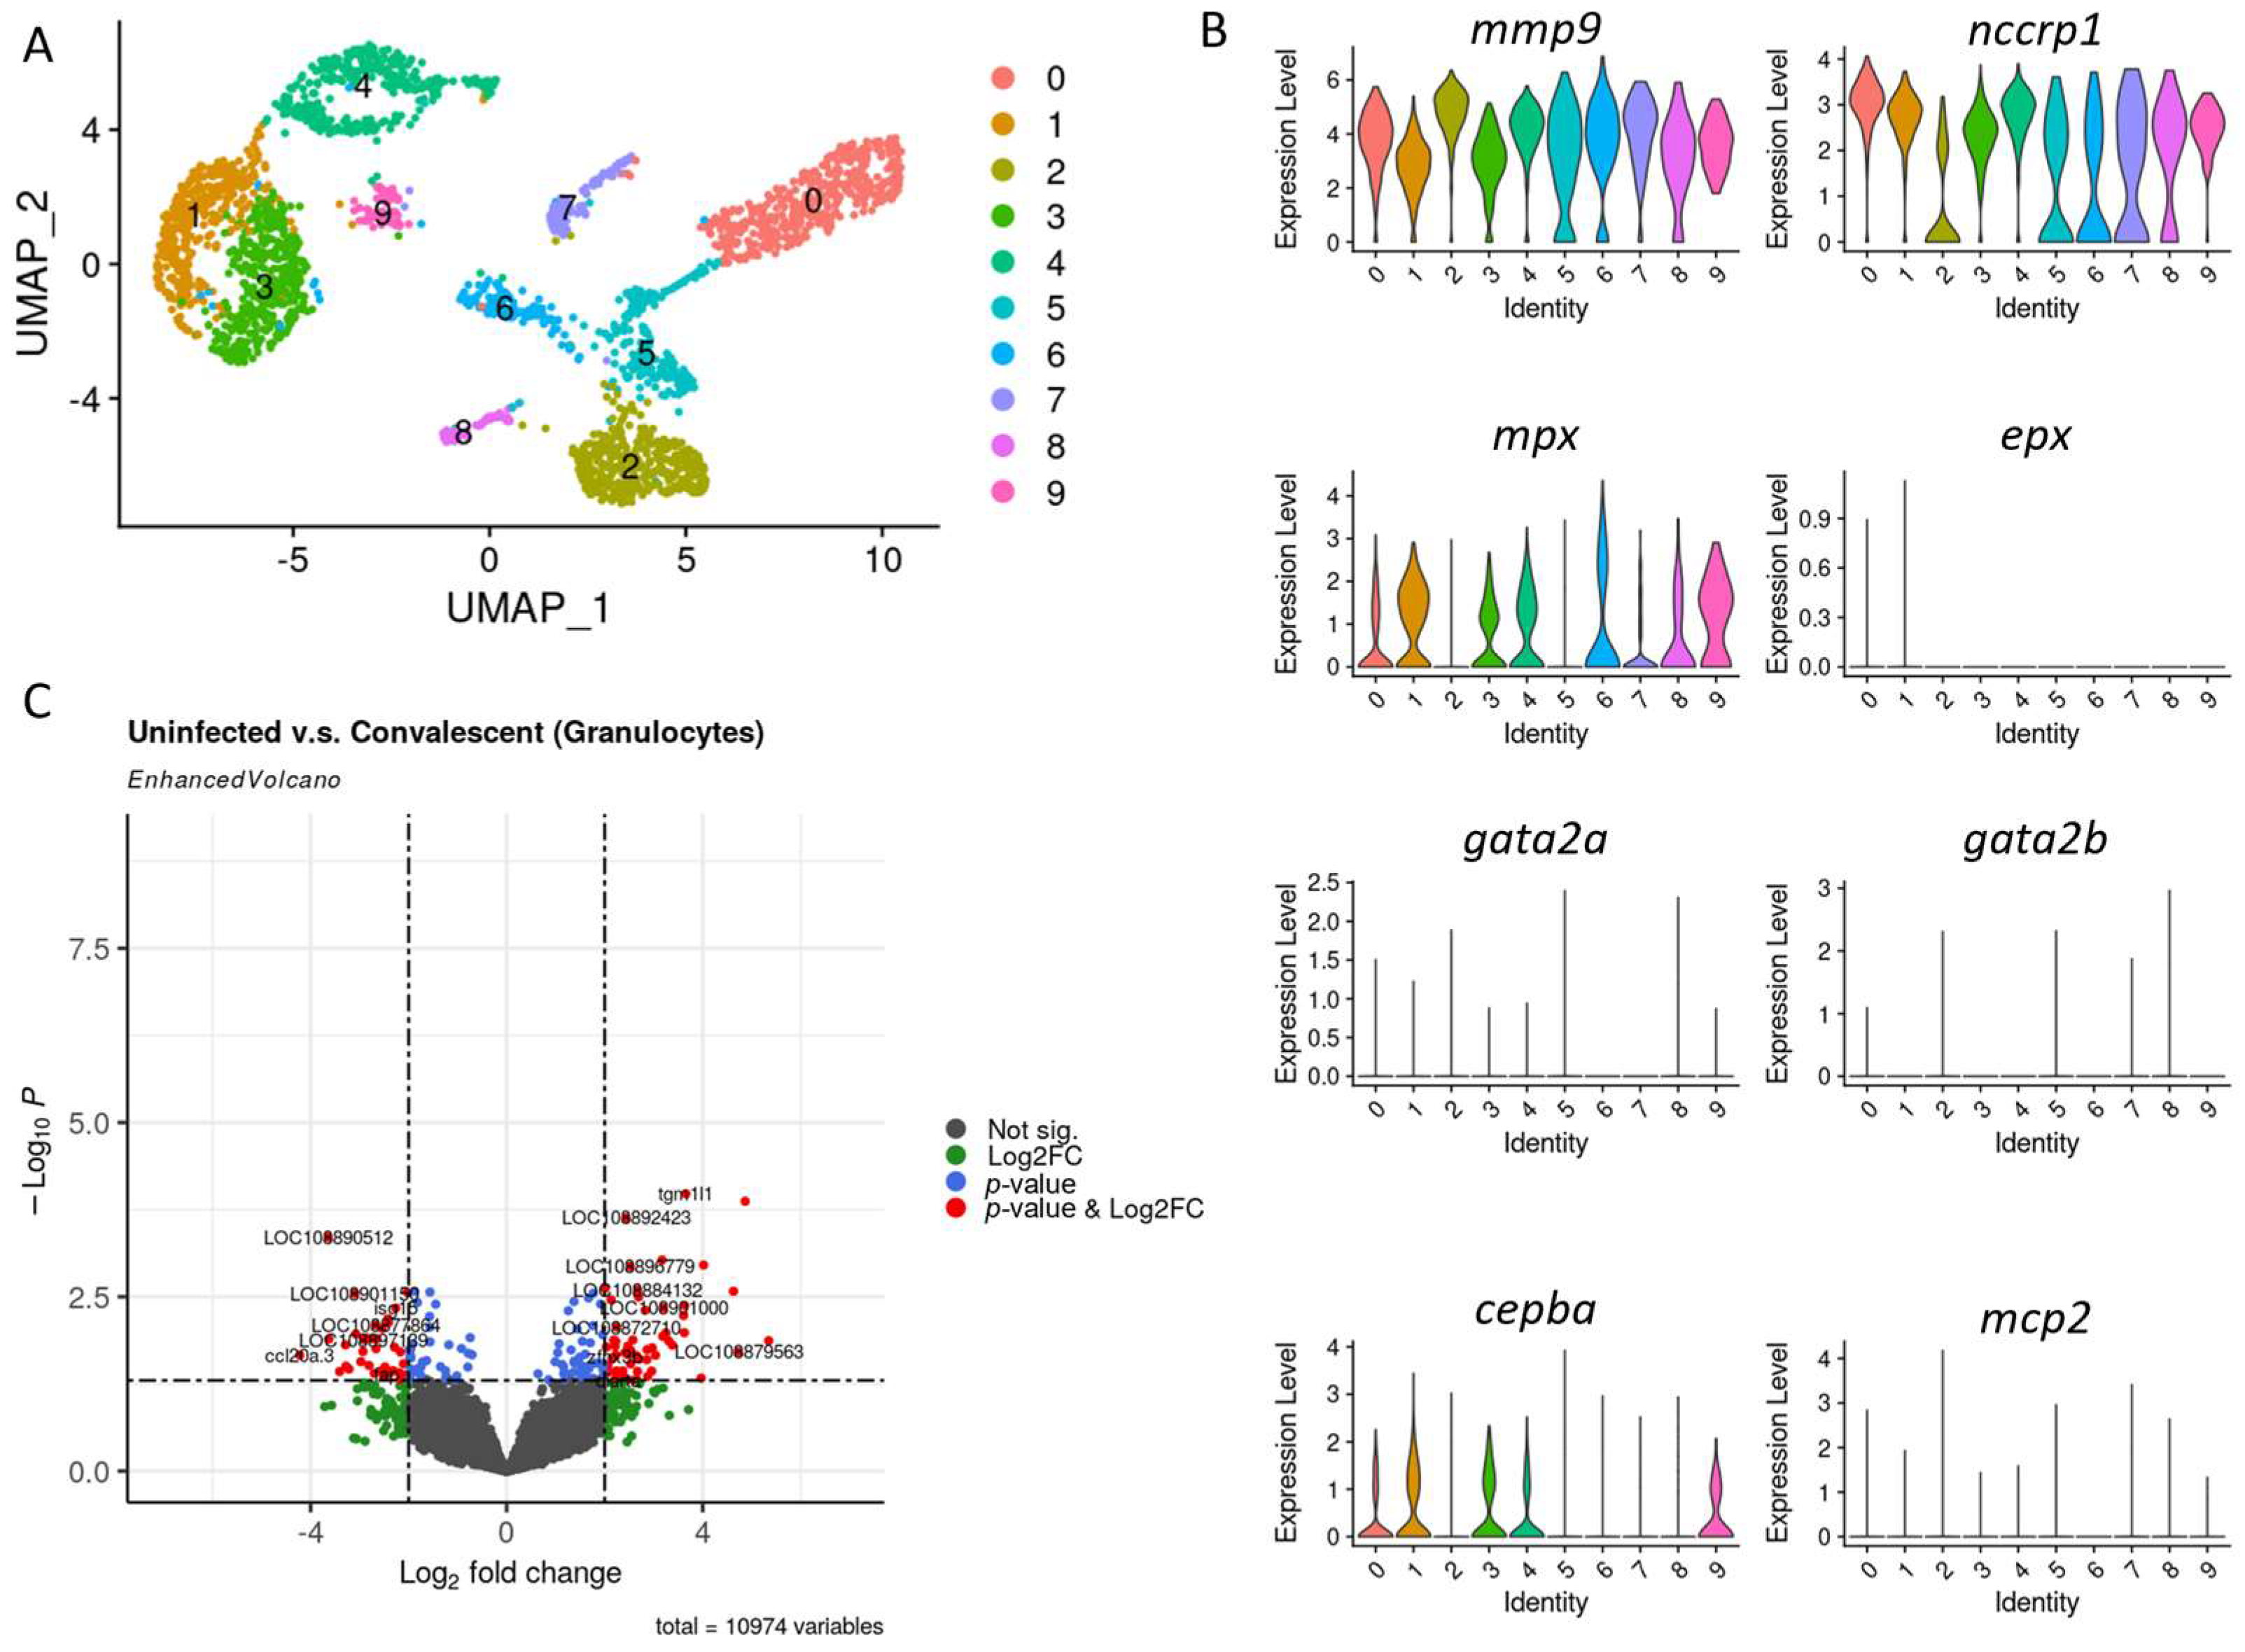
3.2. Granulocytes Profile in Convalescent and Uninfected Asian Seabass

Similarly to mammals, fish granulocytes consist of neutrophils, eosinophils, basophils, and mast cells [27]. The identified granulocytes were further classified into ten distinct populations at a resolution of 0.5 (Figure 2A). Granulocytes’ specific markers matrix metallopeptidase 9 (mmp9) and non-specific cytotoxic cell receptor protein 1 (nccrp1) were identified in all ten populations (Figure 2B and Table S2). Selected markers were used to identify neutrophils (myeloperoxidase; mpx), eosinophils (eosinophil-peroxidase; epx; gata2a and gata2b), basophils (cepba) and mast cells (mast cell protease 2; mcp2), respectively. The overlapping expression of the neutrophils marker mpx gene and basophil marker cebpa were found in clusters 0, 1, 3, 4, and 9, while the rest of the markers were expressed by a low number of cells (Figure 2B and Table S2); hence, we were unable to distinguish the different granulocyte subsets based on these genes. Of note, the analysis of the differentially expressed genes (DEGs) revealed an upregulation of a series of uncharacterized proteins, transglutaminase 1 like 1, deleted in malignant brain tumors 1 protein, receptor (G protein-coupled) activity modifying protein 2, dCMP deaminase, C-type lectin domain containing 14A, zinc finger homeobox 3b, and microfibril-associated glycoprotein 4-like (Figure 2C and Table S3), but none that have been reported to be essential in granulocyte maturation, activation, and functions.

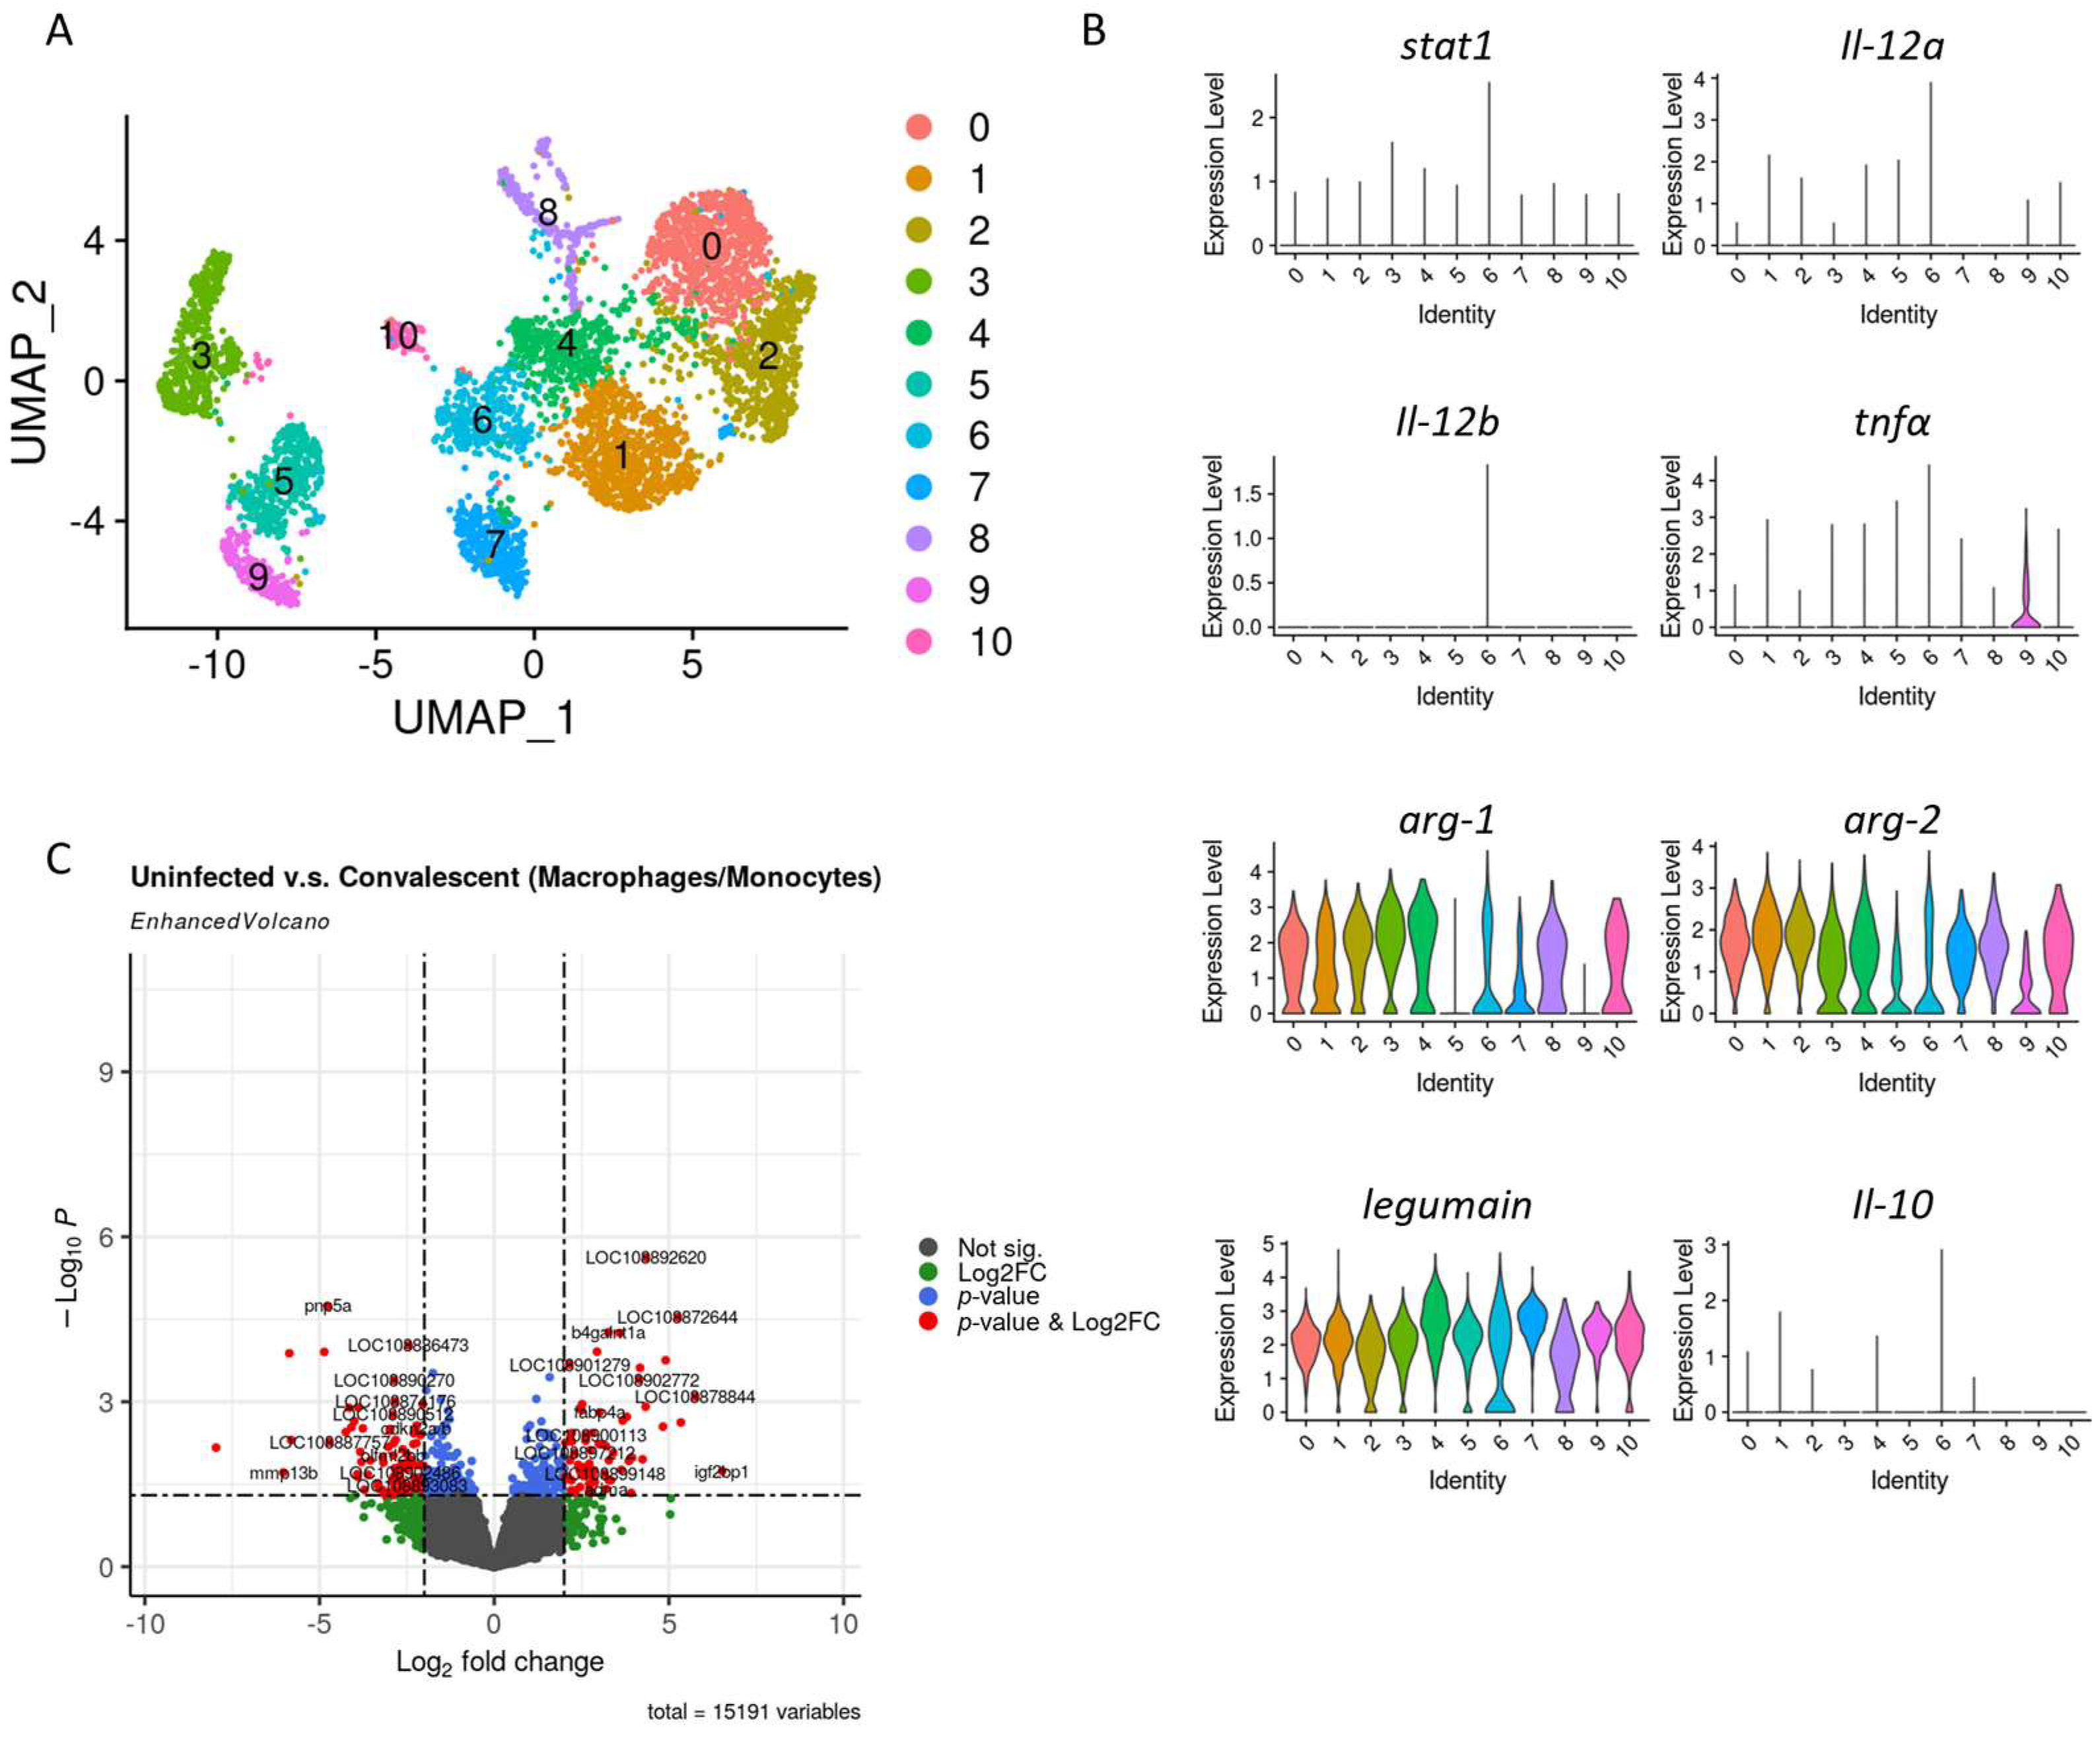
3.3. Macrophages Profile in Convalescent and Uninfected Asian Seabass

Macrophages can polarize into classically activated proinflammatory M1 macrophages and alternatively activated anti-inflammatory M2 subpopulations [28]. The identified macrophages were further sub-clustered into 11 subsets with a resolution of 0.5 (Figure 3A). Selected markers were used to identify M1 cells (signal transducers and activators of transcription 1; stat1, interleukin 12; il-12a and il-12b, and tumor necrosis factor alpha; tnfα) and M2 cells (arginase-1; arg1, arginase-2; arg2, legumain, and interleukin 10; il-10) (Table S4). However, the expression patterns observed within these clusters lacked clear distinctions (Figure 3B). Consequently, we were unable to discern M1 and M2 macrophages within these clusters. The DEG analyses of the whole macrophage population suggest an upregulation of genes involved in inflammatory processes including arg-1, 15-hydroxyprostaglandin dehydrogenase, mRNA binding protein 1, and adrenomedullin a, as well as metabolic-associated genes such as transferase 1a, glycerol kinase-like, fatty acid binding protein 4a, insulin-like growth factor 2 (Figure 3C and Table S5).

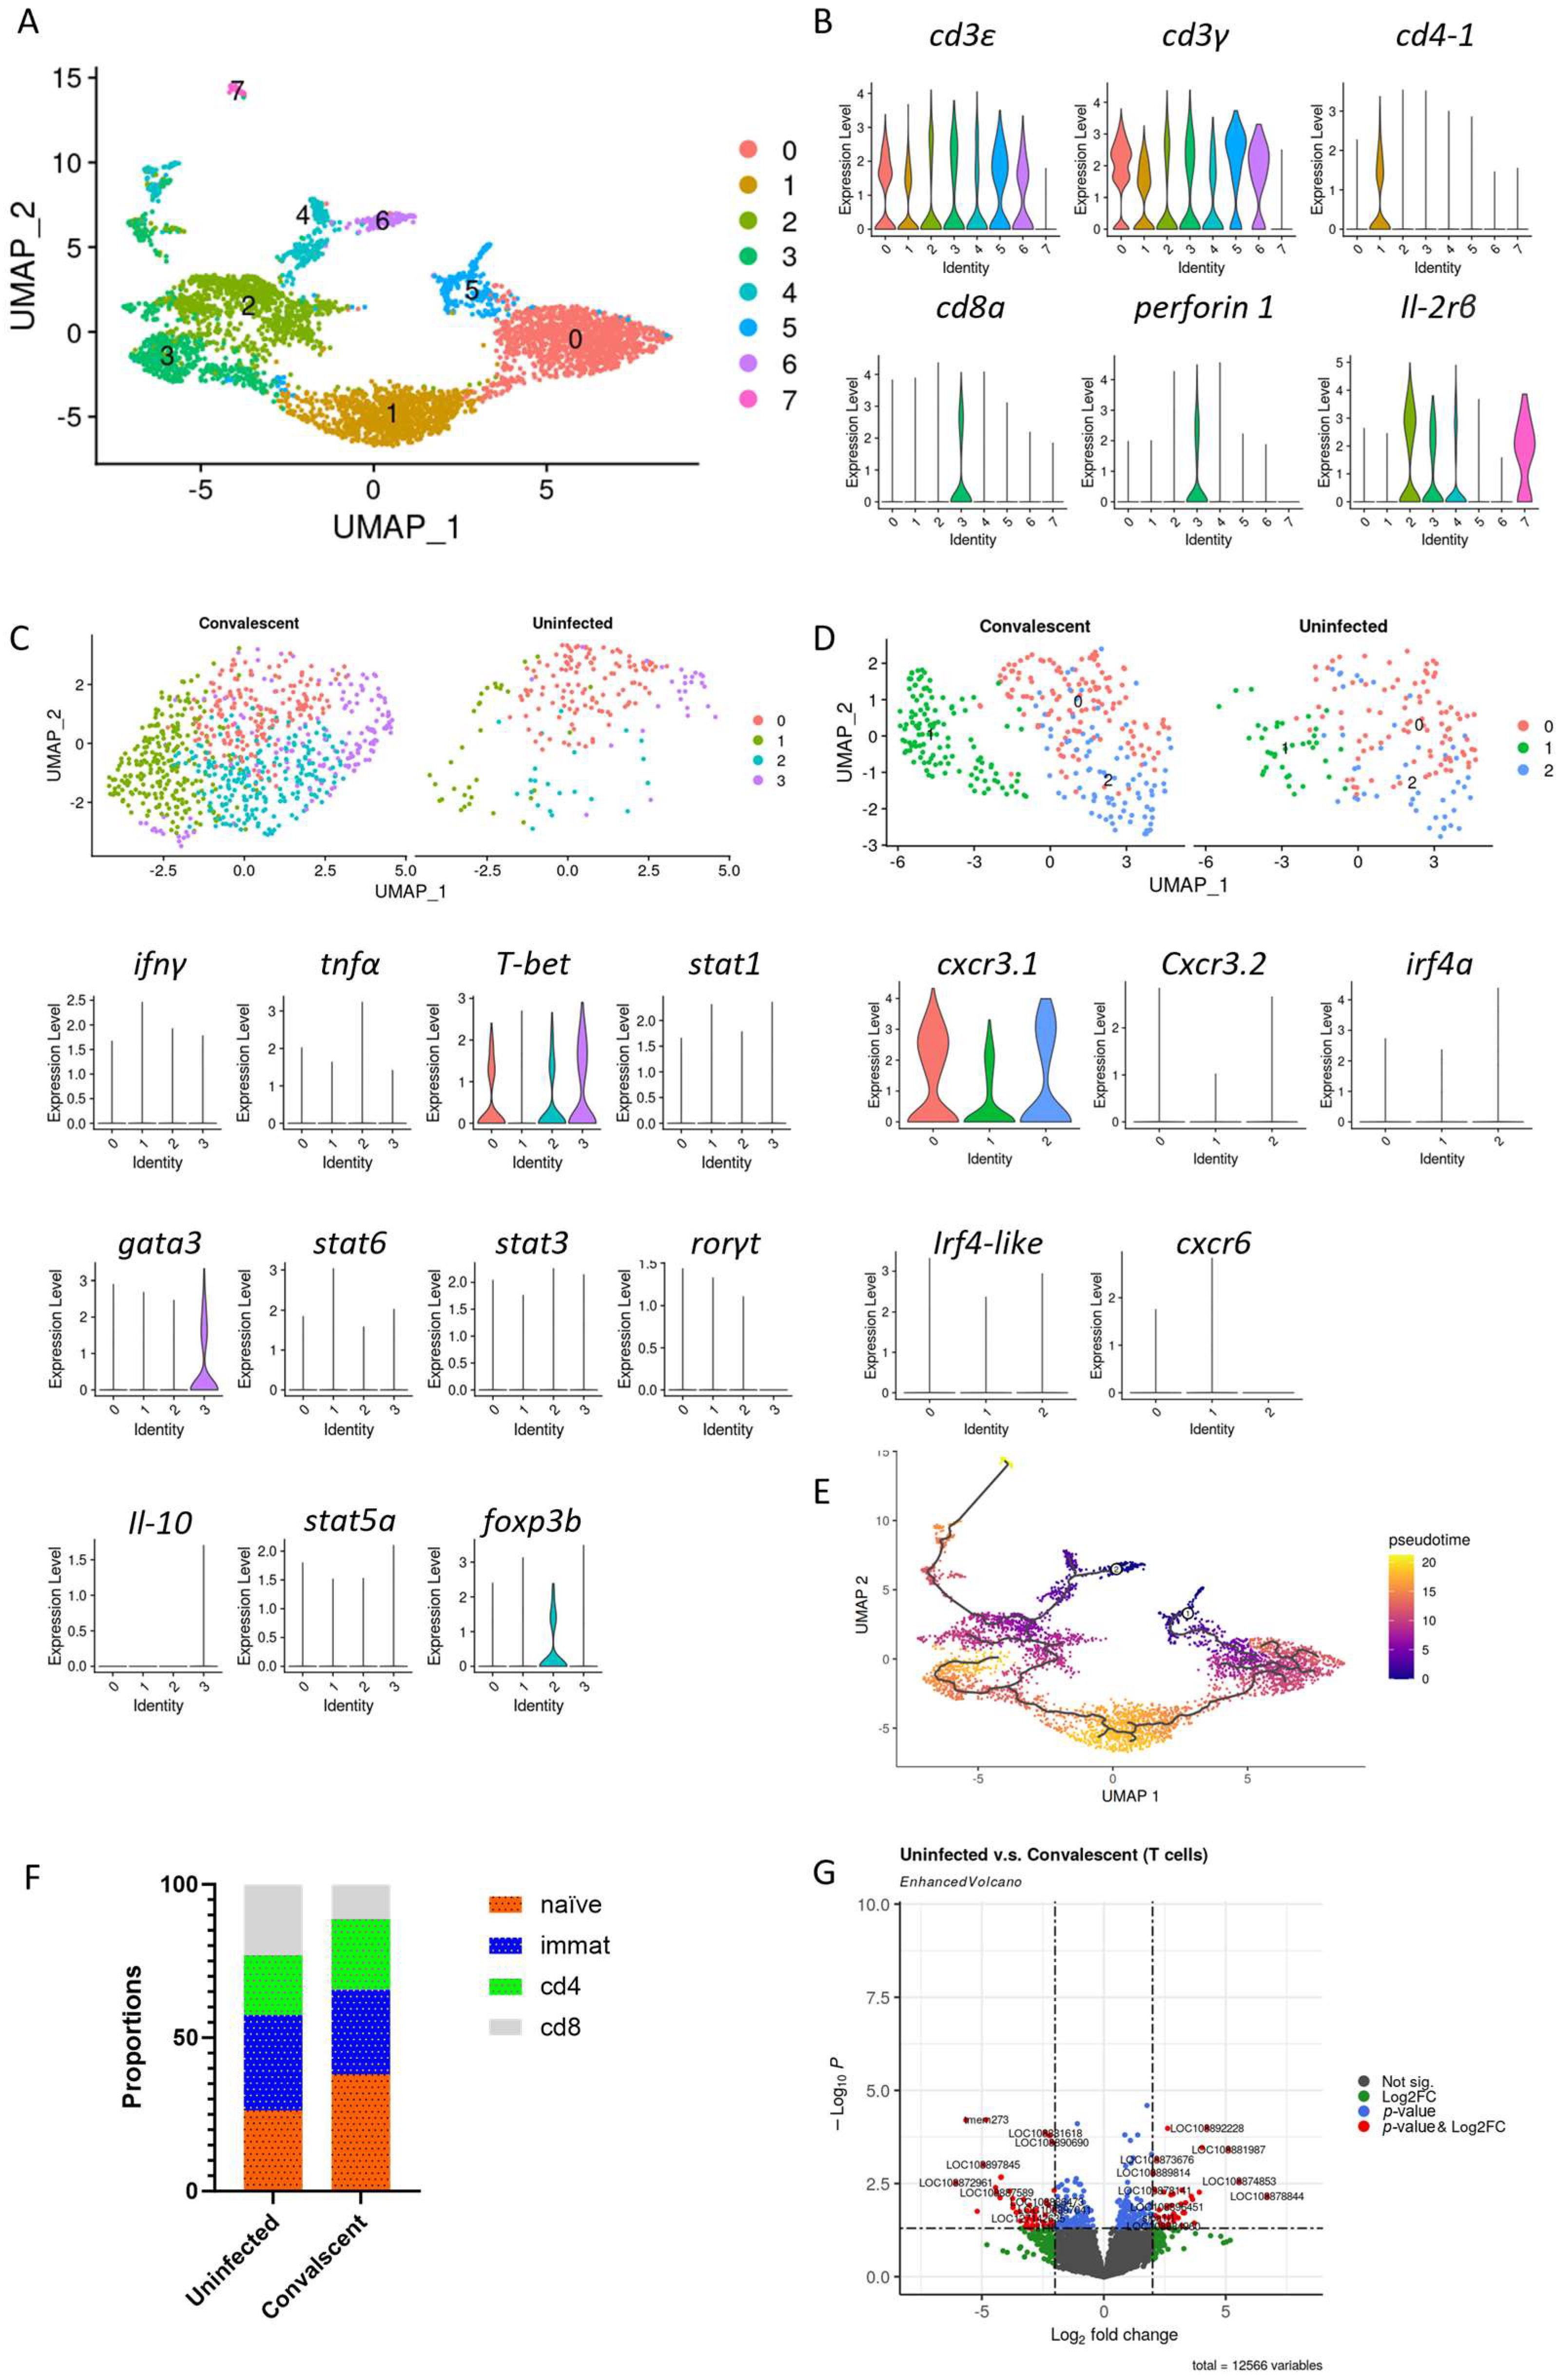
3.4. T Cells Profile in Convalescent and Uninfected Asian Seabass

Among mammals, T cells can be classified into two distinct subsets, the CD4+ T helper cells (Th) and CD8+ cytotoxic T cells (Tc). These subsets play distinct roles in both humoral and cell-mediated immune responses against pathogens. Existing evidence suggests that T cells in teleost fish function similarly to those observed in mammals [29,30,31]. The identified T cells were further categorized into 11 subsets at a resolution of 0.5 (Figure 4A). Cluster 1 exhibited a high expression of cd4-1, whereas cluster 3 displayed an elevated expression of cd8a and perforin-1. According to the T cell maturation process, we hypothesize that clusters 2, 4, and 7 are immature T cells due to the low expression of cd4-1 and cd8a, but high in expression of il-2rβ, and the rest of the clusters (cluster 0, 5, and 6) to be naïve T cells (Figure 4B and Table S6).
CD4+ Th cells can be divided into distinct subsets, including Th1, Th2, Th6, Th9, Th17, Th22, and T regulatory (Treg) cells. These subsets enhance the cellular immunity against intracellular pathogens, promoting antibody production against extracellular parasites, mediating inflammation and maintaining immune tolerance, respectively [29,30,31]. Conversely, CD8+ Tcs can also be classified into Tc1, Tc2, Tc9, and Tc17 subsets, each with varying immune functions and differentiation programs [32]. They recognize the antigens presented by the MHC class I molecules on normal and infected cells. This leads to their activation and subsequent release of cytotoxic molecules like perforin and granzymes, facilitating target cell destruction. We identified four clusters within the CD4+ T cell population and attempted to categorize them into Th subtypes using the reported cytokines and transcription factors. However, it became evident that the CD4+ CD8− T-cell subset could not be neatly classified into specific Th subtypes, as the relevant genes were expressed across all clusters without a distinct concentration in any one cluster (Figure 4C and Table S6). In contrast, three clusters were identified within the CD8+ T cells, with Tc1-expressing cxcr3.1 as the predominant subtype in all three clusters (Figure 4D and Table S6).
To explore the relationship between Th cells, CTLs, immature T cells, and naïve T cells, we performed a pseudotemporal trajectory analysis. In this analysis, however, we did not observe a clear pseudotemporal trajectory (Figure 4E). In the uninfected group, the percentage of CD4+ T cells was 19.51%, and the percentage of CD8+ T cells was 23.02%. In contrast, in the infected group, the percentage of CD4+ T cells and CD8 T cells increased to 23% and 11.31%, respectively (Figure 4F). Of note, the percentage of the immature T cells decreased from 31.12% to 27.54% in the uninfected group compared to the convalescent group (Figure 4F). We then made further attempts to identify the DEGs within the T cells populations, and we found that T cell-associated genes antimicrobial peptide NK-lysin-like, NLR family CARD domain-containing protein 3 (NLRC3), and Rab interacting lysosomal protein-like 2 were upregulated (Figure 4G and Table S7).

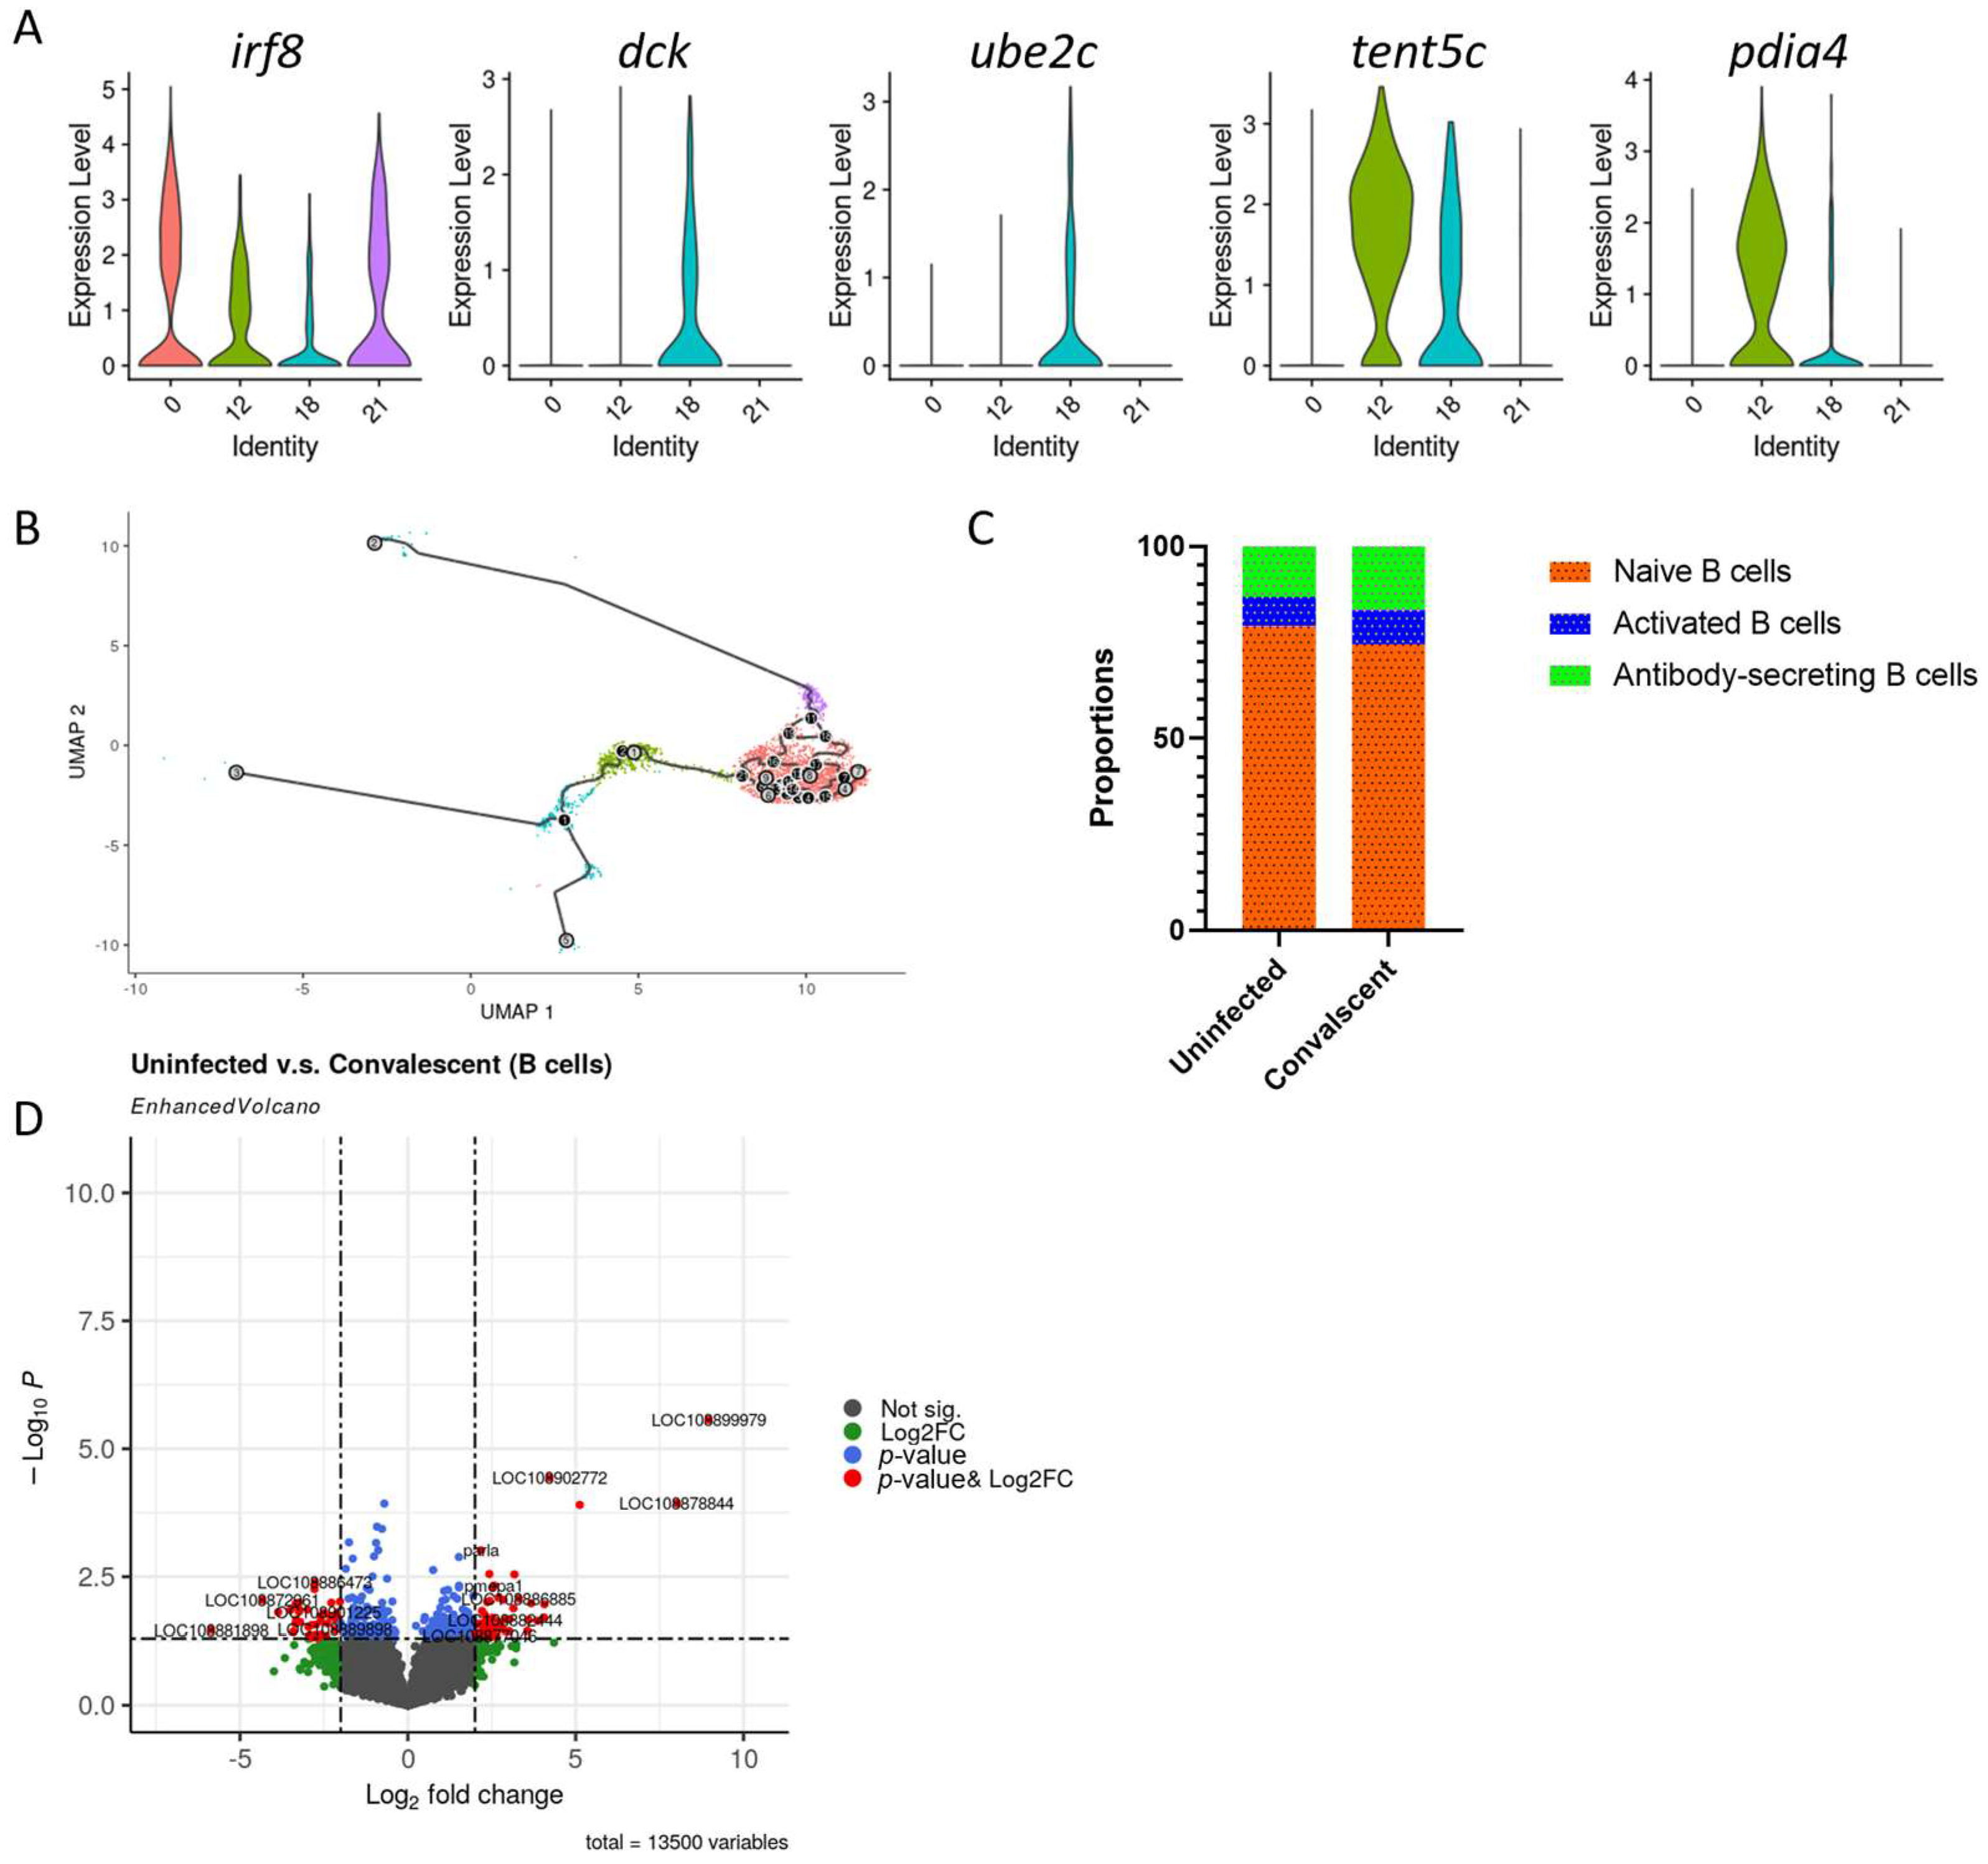
3.5. B Cells Profile in Convalescent and Uninfected Asian Seabass

Clusters 0, 12, 18, and 21 were identified as B cells based on the expression of established markers such as cd22, cd79a, and ebf1a (Figure 1D). To further categorize B cells in Asian seabass, we observed that the expression of interferon regulator factor (irf8) was higher in clusters 1 and 21 when compared to clusters 12 and 18. Additionally, deoxycytidine kinase (dck) and ubiquitin-conjugating enzyme E2C (ube2c) exhibited a high expression in cluster 18, while terminal nucleotidyltransferase 5C (tent5c) and protein disulfide isomerase family A, member 4 (pdia4) displayed higher expression in cluster 12 compared to cluster 18 (Figure 5A and Table S8). The trajectory analysis indicated a path starting from clusters 0 and 21, differentiating towards clusters 12 and 18 (Figure 5B). Using these gene expression profiles and trajectory analysis results, clusters 0 and 21 were classified as naive B cells, cluster 18 as activated B cells, and cluster 12 as antibody-secreting B cells. In the uninfected group, the proportion of activated B cells stood at 7.78%, while that of antibody-secreting cells was 13.02%. Conversely, within the infected group, both the proportion of activated B cells and antibody-secreting cells rose to 8.86% and 16.52%, respectively (Figure 5C). When comparing the convalescent group to the uninfected group in the three B cell subtypes, we observed differentially upregulated genes, including androgen induced 1 (aig-1) and granzyme B-like (grb-like) (Figure 5D and Table S9).

4. Discussion

Upon exposure to viruses, teleost fish exhibit an enrichment of diverse leukocytes in their blood, engaging in immune functions that closely mimic those observed in mammals. The identification of specific types of leukocytes are important in investigating their functions and understanding host immune responses towards specific viruses. However, there remains a deficiency in our comprehension of immune cells in teleost fish due to the absence of antibody-based reagents and cell lines tailored for non-model organisms. In this study, we profiled a total of 19,966 cells from Asian seabass, which provided insights into the types of leukocyte types in uninfected Asian seabass, and convalescent Asian seabass that were previously exposed to SDDV. Through this approach, 24 distinct clusters were identified within the blood, enabling the characterization of immune cells such as granulocytes, monocytes/macrophages, T cells, B cells, and DCs based on an extensive panel of potential marker genes. These findings shed light on host responses against SDDV and hold promise for the future development of effective vaccines in the realm of fish farming.
Leukocytes isolated from blood for scRNA-seq has been previously explored [14,33]. Nonetheless, researchers have also explored the use of alternative tissues, notably the anterior kidney [34] and spleen [33,35], as they function as the principal and secondary lymphoid organs for hematopoiesis in teleost fish, respectively. These tissues contain abundant cell populations that are segregated into myeloid and lymphoid lineages. It is noteworthy that leukocytes in uninfected Atlantic cod are predominantly composed of 42% B cells, the largest cell population, followed by 25% T cells and 18% neutrophils [33]. In contrast, the cell types identified in this study indicate that leukocytes obtained from uninfected Asian seabass mainly consist of macrophages and erythrocytes/thrombocytes, making up approximately 30% and 28%, respectively, followed by 17% T cells, 14% B cells, 10% granulocytes, and less than 1% of dendritic cells (DCs). This disparity may stem from various factors, including evolutionary differences, as evidenced by the Atlantic cod’s lack of CD4+ T cell [36,37]. Despite its unique immune system, cod remains a thriving species and is not inherently more vulnerable to diseases in its natural habitat compared to other teleosts with more typical immune systems [38]. Hence, the proportion of immune cells in Asian seabass may be different to Atlantic cod due to the potential compensatory mechanisms at play. However, it is crucial to note that methodological variations or environmental factors, such as prior infections, may also influence the observed differences in cell proportions. Further investigations are required to fully confirm and elucidate these observations.
Nucleated red blood cells in fish are known to contribute to the immune system, and this is supported by the presence of the activator protein-1 transcription factor c-Jun within erythrocyte clusters in Asian seabass, suggesting that erythrocytes could hold immunological significance in the defense mechanisms against SDDV. Although we did not delve into the further subclustering of the erythrocytes, previous reports have discussed the maturation stages of erythrocytes, indicating the differences in gene expression between immature reticulocytes and fully mature red blood cells [39,40].
Myeloid cells were annotated using the expressions of marker genes and were classified into granulocytes, macrophage, and DCs. Teleost DCs play a crucial role in response to pathogens by functioning as antigen-presenting cells (APCs). These cells express molecular markers similar to those found in mammalian DCs. These include a major histocompatibility complex (MHC) II, CD80/86, and CD83 [41,42]. In the case of Asian seabass, the DC-SCRIPT gene was identified as a specific gene marker for DCs, sharing homology with the human ZNF366 gene and the pufferfish ZNF1 gene [43]. Furthermore, DC-SCRIPT/ZNF366, along with transcription factors ZBTB46, was associated with the maturation and activation of DCs in rainbow trout [44]. While we found that znf366 was highly expressed in cluster 2, we did not further sub-classify DCs due to their relatively low number in the blood (35 cells in convalescent and 10 cells in the uninfected group). This finding is consistent with other studies showing a low abundance of DCs in flounder’s blood [45]. Macrophages and granulocytes are innate cells that help fight infections. Surprisingly, we encountered challenges in identifying distinct granulocyte and macrophage subsets using established markers. The difficulty in identifying subtypes may be due to the absence of certain cell subtypes in Asian seabass blood. While the marker genes used for identifying granulocytes, macrophages, and DCs are valuable, further research is needed to confirm the accuracy of these results.
In this study, we observed a decrease in the proportion of macrophages and an increase in the proportion of granulocytes in the convalescent group. Macrophages are known to undergo polarization into pro-inflammatory (M1) and anti-inflammatory (M2) types based on cytokines and transcription factors during stress, immune responses, and inflammation [28]. The analysis of DEGs in the entire macrophage population revealed a diverse array of genes contributing to their anti-inflammatory functions, suggesting their importance in defending against SDDV. For instance, Arg-1 modulates immune responses towards an anti-inflammatory phenotype by regulating arginine metabolism [46]. Additionally, mammalian 15-hydroxyprostaglandin dehydrogenase (15-PGDH) degrades pro-inflammatory prostaglandins, thereby reducing inflammation [47]. Moreover, adrenomedullin A, a peptide hormone with vasodilatory and anti-inflammatory properties, may further contribute to the anti-inflammatory environment within macrophages [48,49]. Although the roles of metabolic-associated genes such as transferase 1a, glycerol kinase-like enzymes, fatty acid binding protein 4a, and insulin-like growth factor in fish macrophages are unclear, these metabolic pathways may influence macrophage polarization and function. We hypothesize that, by maintaining an anti-inflammatory profile, macrophages in this study regulate the immune response, prevent excessive tissue damage, and promote tissue repair, thereby enhancing the host’s ability to combat viral infections such as SDDV. In contrast to macrophages, the lack of DEGs associated with granulocyte maturation and functions raises questions that require further investigation.
The lymphocytes identified in this study include T cells and B cells, but not the non-specific cytotoxic cells (NCCs) initially identified in tilapia [15]. NCCs are believed to be evolutionary precursors of NK cells in teleost, identified by a marker, NCCRP1. However, our findings suggest that the NCCRP1 expression is present in the granulocyte subsets, indicating the need for additional specific markers to ensure accurate NCC identification.
In contrast to mammals, fish possess a more restricted range of immunoglobulins. Fish genomes encode three classes of immunoglobulins, including IgM, IgD, and the fish-specific IgT/Z [50,51]. In the naïve state, B cells co-express IgM and IgD on their surface. Following antigen recognition, they downregulate IgD, undergo differentiation into IgM + IgD− B cells exhibiting a plasmablasts profile [52]. Conversely, IgM-IgD+ B cells have been detected in catfish (Ictalurus punctatus) and in rainbow trout gills and guts [53,54], but the mechanisms and functions remain to be fully elucidated. Finally, in fish, B cells expressing IgT/IgZ, analogous to mammalian IgA constitute a unique B cell lineage where IgM and IgD are absent [54]. Most teleost species express more than one IgT, including three in salmonids [55]. Nevertheless, it is still uncertain whether individual B cells express multiple forms of IgT or whether specific B cells exclusively express particular IgT variants. However, in the case of the Asian seabass, it seems that IgD and IgT cannot be identified, or simply not annotated, in the existing reference genome (GCF_001640805.2). Further investigation and exploration are warranted to obtain additional information.
T cells can be broadly categorized into CD4+ T cells and CD8+ T cells [56]. In our analysis of Asian seabass blood, we identified four distinct subsets within the T cell cluster based on the expression of cd4-1, cd8a, perforin-1, and il-2rβ. Additionally, aside from CD4+ T cells and CD8+ T cells, we also observed the presence of naïve and immature T cells. However, the maturation and developmental pathways of T cells in Asian seabass remain uncertain, as trajectory analysis failed to provide clear insights. This analysis usually requires proposed start or endpoints, or determining the number of trajectories, to resolve biologically meaningful lineages. Consequently, we cannot propose specific T cell trajectories based on our data. Future studies combining single-cell RNA sequencing with single-cell T cell receptor sequencing may elucidate the developmental relationships among various T cell subpopulations, potentially identifying unconventional T cells such as natural killer T. Additionally, we observed the increased proportions of CD4+ T cells and CD8+ T cells were increased in the convalescent group. Specifically, within the CD8+ T cell subset, Tc1-expressing cxcr3.1 was the predominant subtype. Furthermore, DEGs analysis revealed upregulation of nlrc3, which promotes the infiltration of CD8+ T cells, emphasizing the importance of cytotoxic T cells, particularly Tc1, in the clearance of SDDV.
In conclusion, the data presented here in this study, utilizing 10x Genomics scRNA-seq, have provided a dataset for characterizing various leukocyte subsets found in the blood of Asian seabass. The distinct gene expression profiles observed in both uninfected and convalescent fish leukocyte subsets form the basis for investigating various immune cell populations’ responses to natural SDDV exposure.

Supplementary Materials

The following supporting information can be downloaded at: https://www.mdpi.com/article/10.3390/aquacj4020003/s1, Figure S1:Sequencing quality control and expression quantification; Figure S2: UMAP of five types of cell marker molecules in all clusters; Table S1: The genes and gene IDs used to identify cell populations in blood; Table S2: The genes and gene IDs used to identify granulocyte subsets in blood; Table S3: Analysis of DEGs in granulocytes; Table S4: The genes and gene IDs used to identify macrophage subsets in blood; Table S5: Analysis of DEGs in macrophages; Table S6: The genes and gene IDs used to identify T cell subsets in blood; Table S7: Analysis of DEGs in T cells; Table S8: The genes and gene IDs used to identify B cell subsets in blood; Table S9: Analysis of DEGs in B cells.

Author Contributions

Conceptualization, E.C.R., S.W.H., L.R. and J.C.; methodology, E.C.R., Z.L., S.W.H., S.A. and T.W.L.; formal analysis, T.W.L., Z.L., S.W.H. and J.C.; writing, Z.L., E.C.R., T.W.L. and S.W.H.; reviewing and editing, E.C.R., L.R. and J.C.; funding acquisition, E.C.R. and L.R. All authors have read and agreed to the published version of the manuscript.

Funding

This research is supported by the Singapore Food Agency grant SFS_RND_SUFP_001_01.

Institutional Review Board Statement

While specific approval for this study is not required as samples were retrieved from healthy fish from commercial farms without manipulation or undergoing any experiments, all animal procedures were carried out in Singapore and performed in strict accordance with the specific regulations that govern animal research in Singapore following the guidelines set forth by the National Advisory Committee for Laboratory Animal Research (NACLAR) on the Proper Care and Use of Animals for Scientific Purposes (2004). Research on animals is regulated by the Agri-Food and Veterinary Authority of Singapore under the Animal and Birds Act, Animals and Birds (Care and Use of Animals for Scientific Purposes) Rules.

Informed Consent Statement

Not applicable.

Data Availability Statement

Data are contained within the article or Supplementary Material.

Acknowledgments

We are grateful to the commercial farm in Singapore for providing the samples, and Shihui Foo and Alicia Tay for their assistance in data acquisition.

Conflicts of Interest

Sunita Awate is an employee of UVAXX Private Limited. The authors declare no conflicts of interest.

References

  1. Gibson-Kueh, S.; Chee, D.; Chen, J.; Wang, Y.H.; Tay, S.; Leong, L.N.; Ng, M.L.; Jones, J.B.; Nicholls, P.K.; Ferguson, H.W. The pathology of ‘scale drop syndrome’ in Asian seabass, Lates calcarifer Bloch, a first description. J. Fish. Dis. 2012, 35, 19–27. [Google Scholar] [CrossRef] [PubMed]
  2. de Groof, A.; Guelen, L.; Deijs, M.; van der Wal, Y.; Miyata, M.; Ng, K.S.; van Grinsven, L.; Simmelink, B.; Biermann, Y.; Grisez, L.; et al. A Novel Virus Causes Scale Drop Disease in Lates calcarifer. PLoS Pathog. 2015, 11, e1005074. [Google Scholar] [CrossRef] [PubMed]
  3. Dong, H.T.; Jitrakorn, S.; Kayansamruaj, P.; Pirarat, N.; Rodkhum, C.; Rattanarojpong, T.; Senapin, S.; Saksmerprome, V. Infectious spleen and kidney necrosis disease (ISKND) outbreaks in farmed barramundi (Lates calcarifer) in Vietnam. Fish. Shellfish. Immunol. 2017, 68, 65–73. [Google Scholar] [CrossRef] [PubMed]
  4. Chang, S.F.; Ng, K.S.; Grisez, L.; de Groof, A.; Vogels, W.; van der Hoek, L.; Deijs, M. Novel Fish Pathogenic Virus; International Publication Number WO 2018/029301 A1; World Intellectual Property Organization International Bureau: Geneva, Switzerland, 2018. [Google Scholar]
  5. Chen, J.; Toh, X.; Ong, J.; Wang, Y.; Teo, X.H.; Lee, B.; Wong, P.S.; Khor, D.; Chong, S.M.; Chee, D.; et al. Detection and characterization of a novel marine birnavirus isolated from Asian seabass in Singapore. Virol. J. 2019, 16, 71. [Google Scholar] [CrossRef] [PubMed]
  6. Girisha, S.; Puneeth, T.; Nithin, M.; Kumar, B.N.; Ajay, S.; Vinay, T.; Suresh, T.; Venugopal, M.; Ramesh, K. Red sea bream iridovirus disease (RSIVD) outbreak in Asian seabass (Lates calcarifer) cultured in open estuarine cages along the west coast of India: First report. Aquaculture 2020, 520, 734712. [Google Scholar] [CrossRef]
  7. Senapin, S.; Dong, H.T.; Meemetta, W.; Gangnonngiw, W.; Sangsuriya, P.; Vanichviriyakit, R.; Sonthi, M.; Nuangsaeng, B. Mortality from scale drop disease in farmed Lates calcarifer in Southeast Asia. J. Fish. Dis. 2019, 42, 119–127. [Google Scholar] [CrossRef] [PubMed]
  8. Kerddee, P.; Dong, H.T.; Chokmangmeepisarn, P.; Rodkhum, C.; Srisapoome, P.; Areechon, N.; Del-Pozo, J.; Kayansamruaj, P. Simultaneous detection of scale drop disease virus and Flavobacterium columnare from diseased freshwater-reared barramundi Lates calcarifer. Dis. Aquat. Organ. 2020, 140, 119–128. [Google Scholar] [CrossRef]
  9. Nurliyana, M.; Lukman, B.; Ina-Salwany, M.Y.; Zamri-Saad, M.; Annas, S.; Dong, H.T.; Rodkhum, C.; Amal, M.N.A. First evidence of scale drop disease virus in farmed Asian seabass (Lates calcarifer) in Malaysia. Aquaculture 2020, 528. [Google Scholar] [CrossRef]
  10. Carmona, S.J.; Teichmann, S.A.; Ferreira, L.; Macaulay, I.C.; Stubbington, M.J.; Cvejic, A.; Gfeller, D. Single-cell transcriptome analysis of fish immune cells provides insight into the evolution of vertebrate immune cell types. Genome Res. 2017, 27, 451–461. [Google Scholar] [CrossRef]
  11. Hernández, P.P.; Strzelecka, P.M.; Athanasiadis, E.I.; Hall, D.; Robalo, A.F.; Collins, C.M.; Boudinot, P.; Levraud, J.P.; Cvejic, A. Single-cell transcriptional analysis reveals ILC-like cells in zebrafish. Sci. Immunol. 2018, 3. [Google Scholar] [CrossRef]
  12. Peuß, R.; Box, A.C.; Chen, S.; Wang, Y.; Tsuchiya, D.; Persons, J.L.; Kenzior, A.; Maldonado, E.; Krishnan, J.; Scharsack, J.P.; et al. Adaptation to low parasite abundance affects immune investment and immunopathological responses of cavefish. Nat. Ecol. Evol. 2020, 4, 1416–1430. [Google Scholar] [CrossRef] [PubMed]
  13. Perdiguero, P.; Morel, E.; Díaz-Rosales, P.; Tafalla, C. Individual B cells transcribe multiple rearranged immunoglobulin light chains in teleost fish. iScience 2021, 24, 102615. [Google Scholar] [CrossRef] [PubMed]
  14. Perdiguero, P.; Morel, E.; Tafalla, C. Diversity of Rainbow Trout Blood B Cells Revealed by Single Cell RNA Sequencing. Biology 2021, 10, 511. [Google Scholar] [CrossRef] [PubMed]
  15. Niu, J.; Huang, Y.; Liu, X.; Zhang, Z.; Tang, J.; Wang, B.; Lu, Y.; Cai, J.; Jian, J. Single-cell RNA-seq reveals different subsets of non-specific cytotoxic cells in teleost. Genomics 2020, 112, 5170–5179. [Google Scholar] [CrossRef] [PubMed]
  16. Wang, Q.; Peng, C.; Yang, M.; Huang, F.; Duan, X.; Wang, S.; Cheng, H.; Yang, H.; Zhao, H.; Qin, Q. Single-cell RNA-seq landscape midbrain cell responses to red spotted grouper nervous necrosis virus infection. PLoS Pathog. 2021, 17, e1009665. [Google Scholar] [CrossRef] [PubMed]
  17. Chen, W.; Huang, J.; Wang, W.; Wang, Y.; Chen, H.; Wang, Q.; Zhang, Y.; Liu, Q.; Yang, D. Multi-tissue scRNA-seq reveals immune cell landscape of turbot (Scophthalmus maximus). Fundam. Res. 2022, 2, 550–561. [Google Scholar] [CrossRef]
  18. Sun, X.; Li, L.; Wu, B.; Ge, J.; Zheng, Y.; Yu, T.; Zhou, L.; Zhang, T.; Yang, A.; Liu, Z. Cell type diversity in scallop adductor muscles revealed by single-cell RNA-Seq. Genomics 2021, 113, 3582–3598. [Google Scholar] [CrossRef]
  19. Koiwai, K.; Koyama, T.; Tsuda, S.; Toyoda, A.; Kikuchi, K.; Suzuki, H.; Kawano, R. Single-cell RNA-seq analysis reveals penaeid shrimp hemocyte subpopulations and cell differentiation process. Elife 2021, 10, e66954. [Google Scholar] [CrossRef] [PubMed]
  20. Wen, S.; Lu, H.; Wang, D.; Guo, J.; Dai, W.; Wang, Z. TCF-1 maintains CD8+ T cell stemness in tumor microenvironment. J. Leukoc. Biol. 2021, 110, 585–590. [Google Scholar] [CrossRef]
  21. Morera, D.; Roher, N.; Ribas, L.; Balasch, J.C.; Doñate, C.; Callol, A.; Boltaña, S.; Roberts, S.; Goetz, G.; Goetz, F.W.; et al. RNA-Seq reveals an integrated immune response in nucleated erythrocytes. PLoS ONE 2011, 6, e26998. [Google Scholar] [CrossRef]
  22. Morera, D.; MacKenzie, S.A. Is there a direct role for erythrocytes in the immune response? Vet. Res. 2011, 42, 89. [Google Scholar] [CrossRef]
  23. Passantino, L.; Massaro, M.A.; Jirillo, F.; Di Modugno, D.; Ribaud, M.R.; Modugno, G.D.; Passantino, G.F.; Jirillo, E. Antigenically activated avian erythrocytes release cytokine-like factors: A conserved phylogenetic function discovered in fish. Immunopharmacol. Immunotoxicol. 2007, 29, 141–152. [Google Scholar] [CrossRef] [PubMed]
  24. Passantino, L.; Altamura, M.; Cianciotta, A.; Patruno, R.; Tafaro, A.; Jirillo, E.; Passantino, G.F. Fish immunology. I. Binding and engulfment of Candida albicans by erythrocytes of rainbow trout (Salmo gairdneri Richardson). Immunopharmacol. Immunotoxicol. 2002, 24, 665–678. [Google Scholar] [CrossRef] [PubMed]
  25. Workenhe, S.T.; Kibenge, M.J.; Wright, G.M.; Wadowska, D.W.; Groman, D.B.; Kibenge, F.S. Infectious salmon anaemia virus replication and induction of alpha interferon in Atlantic salmon erythrocytes. Virol. J. 2008, 5, 36. [Google Scholar] [CrossRef] [PubMed]
  26. Kyriakis, J.M. Activation of the AP-1 transcription factor by inflammatory cytokines of the TNF family. Gene Expr. 1999, 7, 217–231. [Google Scholar]
  27. Ainsworth, A.J. Fish granulocytes: Morphology, distribution, and function. Annu. Rev. Fish. Dis. 1992, 2, 123–148. [Google Scholar] [CrossRef]
  28. Ragini, S. Macrophage: A Key Player of Teleost Immune System. In Macrophages; Chapter 2; Vijay, K., Ed.; IntechOpen: Rijeka, Croatia, 2022. [Google Scholar]
  29. Nakanishi, T.; Shibasaki, Y.; Matsuura, Y. T Cells in Fish. Biology 2015, 4, 640–663. [Google Scholar] [CrossRef]
  30. Ashfaq, H.; Soliman, H.; Saleh, M.; El-Matbouli, M. CD4: A vital player in the teleost fish immune system. Vet. Res. 2019, 50, 1. [Google Scholar] [CrossRef] [PubMed]
  31. Nakanishi, T.; Toda, H.; Shibasaki, Y.; Somamoto, T. Cytotoxic T cells in teleost fish. Dev. Comp. Immunol. 2011, 35, 1317–1323. [Google Scholar] [CrossRef]
  32. Mittrücker, H.-W.; Visekruna, A.; Huber, M. Heterogeneity in the Differentiation and Function of CD8+ T Cells. Arch. Immunol. Et. Ther. Exp. 2014, 62, 449–458. [Google Scholar] [CrossRef]
  33. Guslund, N.C.; Solbakken, M.H.; Brieuc, M.S.O.; Jentoft, S.; Jakobsen, K.S.; Qiao, S.W. Single-Cell Transcriptome Profiling of Immune Cell Repertoire of the Atlantic Cod Which Naturally Lacks the Major Histocompatibility Class II System. Front. Immunol. 2020, 11, 559555. [Google Scholar] [CrossRef] [PubMed]
  34. Wu, L.; Gao, A.; Li, L.; Chen, J.; Li, J.; Ye, J. A Single-Cell Transcriptome Profiling of Anterior Kidney Leukocytes From Nile Tilapia (Oreochromis niloticus). Front. Immunol. 2021, 12, 783196. [Google Scholar] [CrossRef] [PubMed]
  35. Huang, L.; Qiao, Y.; Xu, W.; Gong, L.; He, R.; Qi, W.; Gao, Q.; Cai, H.; Grossart, H.P.; Yan, Q. Full-Length Transcriptome: A Reliable Alternative for Single-Cell RNA-Seq Analysis in the Spleen of Teleost Without Reference Genome. Front. Immunol. 2021, 12, 737332. [Google Scholar] [CrossRef] [PubMed]
  36. Star, B.; Nederbragt, A.J.; Jentoft, S.; Grimholt, U.; Malmstrøm, M.; Gregers, T.F.; Rounge, T.B.; Paulsen, J.; Solbakken, M.H.; Sharma, A.; et al. The genome sequence of Atlantic cod reveals a unique immune system. Nature 2011, 477, 207–210. [Google Scholar] [CrossRef] [PubMed]
  37. Malmstrøm, M.; Matschiner, M.; Tørresen, O.K.; Star, B.; Snipen, L.G.; Hansen, T.F.; Baalsrud, H.T.; Nederbragt, A.J.; Hanel, R.; Salzburger, W.; et al. Evolution of the immune system influences speciation rates in teleost fishes. Nat. Genet. 2016, 48, 1204–1210. [Google Scholar] [CrossRef] [PubMed]
  38. Pilström, L.; Warr, G.W.; Strömberg, S. Why is the antibody response of Atlantic cod so poor? The search for a genetic explanation. Fish. Sci. 2005, 71, 961–971. [Google Scholar] [CrossRef]
  39. Lund, S.G.; Phillips, M.C.; Moyes, C.D.; Tufts, B.L. The effects of cell ageing on protein synthesis in rainbow trout (Oncorhynchus mykiss) red blood cells. J. Exp. Biol. 2000, 203, 2219–2228. [Google Scholar] [CrossRef] [PubMed]
  40. Zexia, G.; Weimin, W.; Yi, Y.; Abbas, K.; Dapeng, L.; Guiwei, Z.; Diana, J.S. Morphological studies of peripheral blood cells of the Chinese sturgeon, Acipenser sinensis. Fish. Physiol. Biochem. 2007, 33, 213–222. [Google Scholar] [CrossRef]
  41. Lugo-Villarino, G.; Balla, K.M.; Stachura, D.L.; Bañuelos, K.; Werneck, M.B.F.; Traver, D. Identification of dendritic antigen-presenting cells in the zebrafish. Proc. Natl. Acad. Sci. USA 2010, 107, 15850–15855. [Google Scholar] [CrossRef]
  42. Shao, T.; Zhu, L.-Y.; Nie, L.; Shi, W.; Dong, W.-R.; Xiang, L.-X.; Shao, J.-Z. Characterization of surface phenotypic molecules of teleost dendritic cells. Dev. Comp. Immunol. 2015, 49, 38–43. [Google Scholar] [CrossRef]
  43. Zoccola, E.; Delamare-Deboutteville, J.; Barnes, A.C. Identification of Barramundi (Lates calcarifer) DC-SCRIPT, a Specific Molecular Marker for Dendritic Cells in Fish. PLoS ONE 2015, 10, e0132687. [Google Scholar] [CrossRef]
  44. Wang, J.; Wang, T.; Benedicenti, O.; Collins, C.; Wang, K.; Secombes, C.J.; Zou, J. Characterisation of ZBTB46 and DC-SCRIPT/ZNF366 in rainbow trout, transcription factors potentially involved in dendritic cell maturation and activation in fish. Dev. Comp. Immunol. 2018, 80, 2–14. [Google Scholar] [CrossRef]
  45. Tian, H.; Xing, J.; Tang, X.; Sheng, X.; Chi, H.; Zhan, W. Single-cell transcriptome uncovers heterogeneity and immune responses of leukocytes after vaccination with inactivated Edwardsiella tarda in flounder (Paralichthys olivaceus). Aquaculture 2023, 566, 739238. [Google Scholar] [CrossRef]
  46. Wiegertjes, G.F.; Wentzel, A.S.; Spaink, H.P.; Elks, P.M.; Fink, I.R. Polarization of immune responses in fish: The ‘macrophages first’ point of view. Mol. Immunol. 2016, 69, 146–156. [Google Scholar] [CrossRef]
  47. Desai, A. 15-Pgdh Inhibition Alternatively Activates Macrophages to Promote Hematopoietic Function during Aging. Blood 2023, 142 (Suppl. 1), 5610. [Google Scholar] [CrossRef]
  48. Clementi, G.; Caruso, A.; Cutuli, V.M.; Prato, A.; Mangano, N.G.; Amico-Roxas, M. Antiinflammatory activity of adrenomedullin in the acetic acid peritonitis in rats. Life Sci. 1999, 65, Pl203–Pl208. [Google Scholar] [CrossRef]
  49. Isumi, Y.; Kubo, A.; Katafuchi, T.; Kangawa, K.; Minamino, N. Adrenomedullin suppresses interleukin-1beta-induced tumor necrosis factor-alpha production in Swiss 3T3 cells. FEBS Lett. 1999, 463, 110–114. [Google Scholar] [CrossRef] [PubMed]
  50. Hansen, J.D.; Landis, E.D.; Phillips, R.B. Discovery of a unique Ig heavy-chain isotype (IgT) in rainbow trout: Implications for a distinctive B cell developmental pathway in teleost fish. Proc. Natl. Acad. Sci. USA 2005, 102, 6919–6924. [Google Scholar] [CrossRef]
  51. Parra, D.; Takizawa, F.; Sunyer, J.O. Evolution of B Cell Immunity. Annu. Rev. Anim. Biosci. 2013, 1, 65–97. [Google Scholar] [CrossRef] [PubMed]
  52. Granja, A.G.; Tafalla, C. Different IgM+ B cell subpopulations residing within the peritoneal cavity of vaccinated rainbow trout are differently regulated by BAFF. Fish. Shellfish. Immunol. 2019, 85, 9–17. [Google Scholar] [CrossRef]
  53. Castro, R.; Bromage, E.; Abós, B.; Pignatelli, J.; Gonzalez Granja, A.; Luque, A.; Tafalla, C. CCR7 is mainly expressed in teleost gills, where it defines an IgD+ IgM− B lymphocyte subset. J. Immunol. 2014, 192, 1257–1266. [Google Scholar] [CrossRef] [PubMed]
  54. Perdiguero, P.; Martín-Martín, A.; Benedicenti, O.; Díaz-Rosales, P.; Morel, E.; Muñoz-Atienza, E.; García-Flores, M.; Simón, R.; Soleto, I.; Cerutti, A. Teleost IgD+ IgM− B cells mount clonally expanded and mildly mutated intestinal IgD responses in the absence of lymphoid follicles. Cell Rep. 2019, 29, 4223–4235.e5. [Google Scholar] [CrossRef] [PubMed]
  55. Zhang, N.; Zhang, X.J.; Chen, D.D.; Oriol Sunyer, J.; Zhang, Y.A. Molecular characterization and expression analysis of three subclasses of IgT in rainbow trout (Oncorhynchus mykiss). Dev. Comp. Immunol. 2017, 70, 94–105. [Google Scholar] [CrossRef]
  56. Tian, H.-F.; Xing, J.; Tang, X.-Q.; Chi, H.; Sheng, X.-Z.; Zhan, W.-B. Cluster of differentiation antigens: Essential roles in the identification of teleost fish T lymphocytes. Mar. Life Sci. Technol. 2022, 4, 303–316. [Google Scholar] [CrossRef]
Figure 1. Single-cell RNA sequencing (scRNA-seq) analysis of Asian seabass whole-blood leukocytes. (A) Experimental procedures for the scRNA-seq of leukocytes extracted from the whole blood of Asian seabass, involving cell isolation, 10× Genomics Chromium 3′ scRNA-seq, and subsequent data visualization. (B) The presence of the SDDV MCP gene using the PCR assay. DNA was extracted from plasma. C, convalescent; U, uninfected; N; no template control; P, positive control using plasmid. GeneRuler 50 bp DNA ladder was used to determine the band sizes given in base pairs. A product of approximately 200 bp was amplified from all samples. (C) A collective of 24 cell clusters were identified and represented in a uniform manifold approximation and projection (UMAP) space. (D) Bubble chart depicting the marker genes associated with B cells, T cells, macrophages, granulocytes, dendritic cells (DCs), and erythrocytes across the cell clusters. Dot size corresponds to the percentage of gene expression, while the color intensity reflects the average expression levels of the cells within each cluster. (E) Identification of potential cell types through the expression of marker genes observed in both mammals and fish. (F) UMAP clustering of convalescent and uninfected samples. (G) The numbers of cells (left) and percentage (right) of each cell type in convalescent and uninfected samples.
Aquacj 04 00003 g001
Figure 2. Granulocyte diversity in response to SDDV infection. (A) UMAP plot displaying 10 distinct clusters. Clusters labelled from 0 to 9 represent granulocytes with distinct gene signatures identified through the application of the Seurat algorithm. (B) Violin plots showing the expression of specific genes in granulocytes. The y axis represents the normalized and log-transformed average gene expression, while the x axis indicates the granulocytes sub-cluster. (C) Volcano plot illustrating the differentially expressed genes in granulocytes, with each dot representing an individual gene based on both the p-value and fold differences.
Aquacj 04 00003 g002
Figure 3. Immune response of monocytes/macrophages against SDDV infection. (A) UMAP plot displaying 11 distinct clusters. Clusters labeled from 0 to 10 represent monocytes/macrophages with distinct gene signatures identified through the application of the Seurat algorithm. (B) Violin plots showing the expression of specific genes in monocytes/macrophages. The y axis represents the normalized and log-transformed average gene expression, while the x axis indicates the granulocytes sub-cluster. (C) Volcano plot illustrating the differentially expressed genes in monocytes/macrophages, with each dot representing an individual gene based on both p-value and fold differences.
Aquacj 04 00003 g003
Figure 4. Characterization of T cell subpopulations in SDDV-infected convalescent Asian seabass. (A) The identified T cells were categorized into 7 distinct clusters and visualized with UMAP. Clusters 0, 5, and 6 represent naïve T cells, while clusters 2, 4, and 7 represent immature T cells. Cluster 1 represents CD4+ T helper cells, and cluster 3 represents CD8+ cytotoxic T cells. (B) Violin plots showing the expression of specific genes in T cells. The y axis represents the normalized and log-transformed average gene expression, while the x axis indicates the granulocytes sub-cluster. (C, top) Cluster 2 were sub-categorized into 4 distinct clusters and visualized with UMAP in convalescent and uninfected samples. (C, bottom) Violin plots showing the expression of specific genes in CD4+ T cells. (D, top) Cluster 3 and cluster 4 were sub-categorized into 3 distinct clusters and visualized with UMAP in convalescent and uninfected samples. (D, bottom) Violin plots showing the expression of specific genes in CD8+ T cells. (E) Pseudotime trajectory of T cell subsets estimated using Monocle. (F) Proportion of T cell subsets in convalescent and uninfected samples. (G) Volcano plot illustrating the differentially expressed genes in T cells, with each dot representing an individual gene based on both p-value and fold differences.
Aquacj 04 00003 g004
Figure 5. Classification of B cells after SDDV infection in Asian seabass. (A) Violin plots showing the expression of specific genes in B cells. The y axis represents the normalized and log-transformed average gene expression, while the x axis indicates the granulocytes sub-cluster. (B) Pseudotime trajectory of B cell subsets estimated using Monocle. (C) Proportion of B cell subsets in convalescent and uninfected samples. (D) Volcano plot illustrating the differentially expressed genes in B cells, with each dot representing an individual gene based on both p-value and fold differences.
Aquacj 04 00003 g005
Disclaimer/Publisher’s Note: The statements, opinions and data contained in all publications are solely those of the individual author(s) and contributor(s) and not of MDPI and/or the editor(s). MDPI and/or the editor(s) disclaim responsibility for any injury to people or property resulting from any ideas, methods, instructions or products referred to in the content.

