
Enhancing Disease Detection in the Aquaculture Sector Using Convolutional Neural Networks Analysis

Abstract
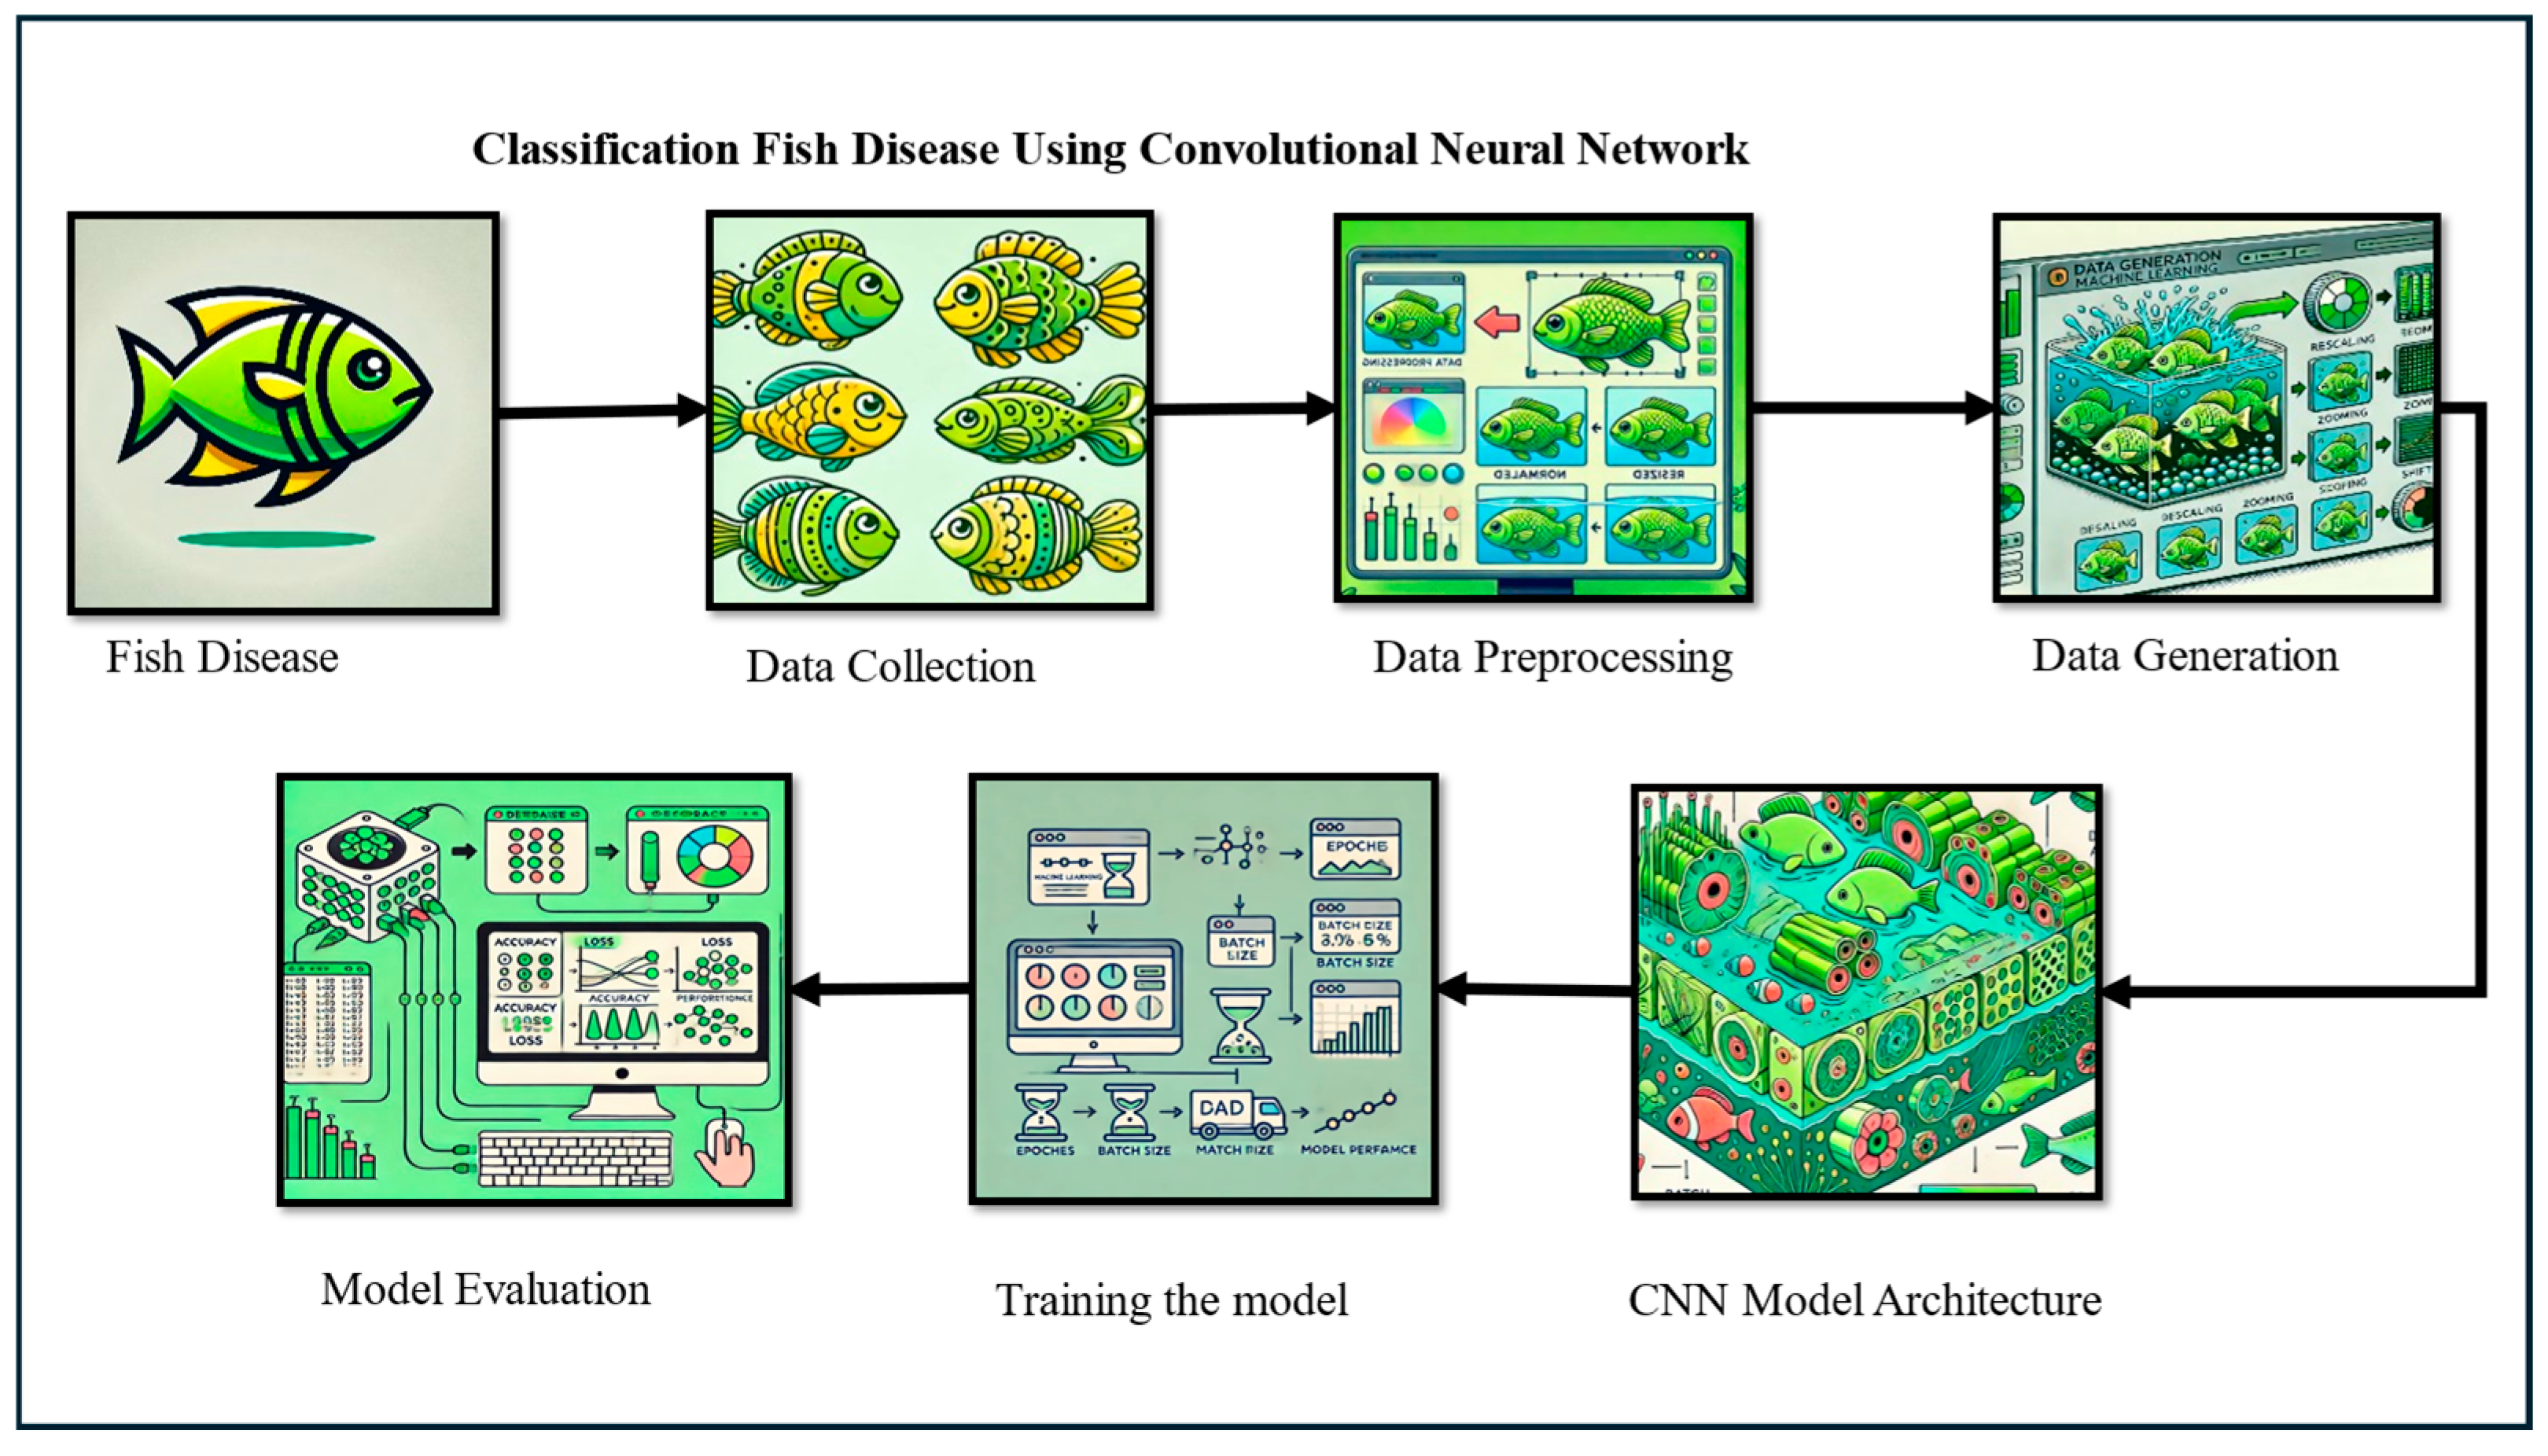
:1. Introduction
2. Materials and Methods
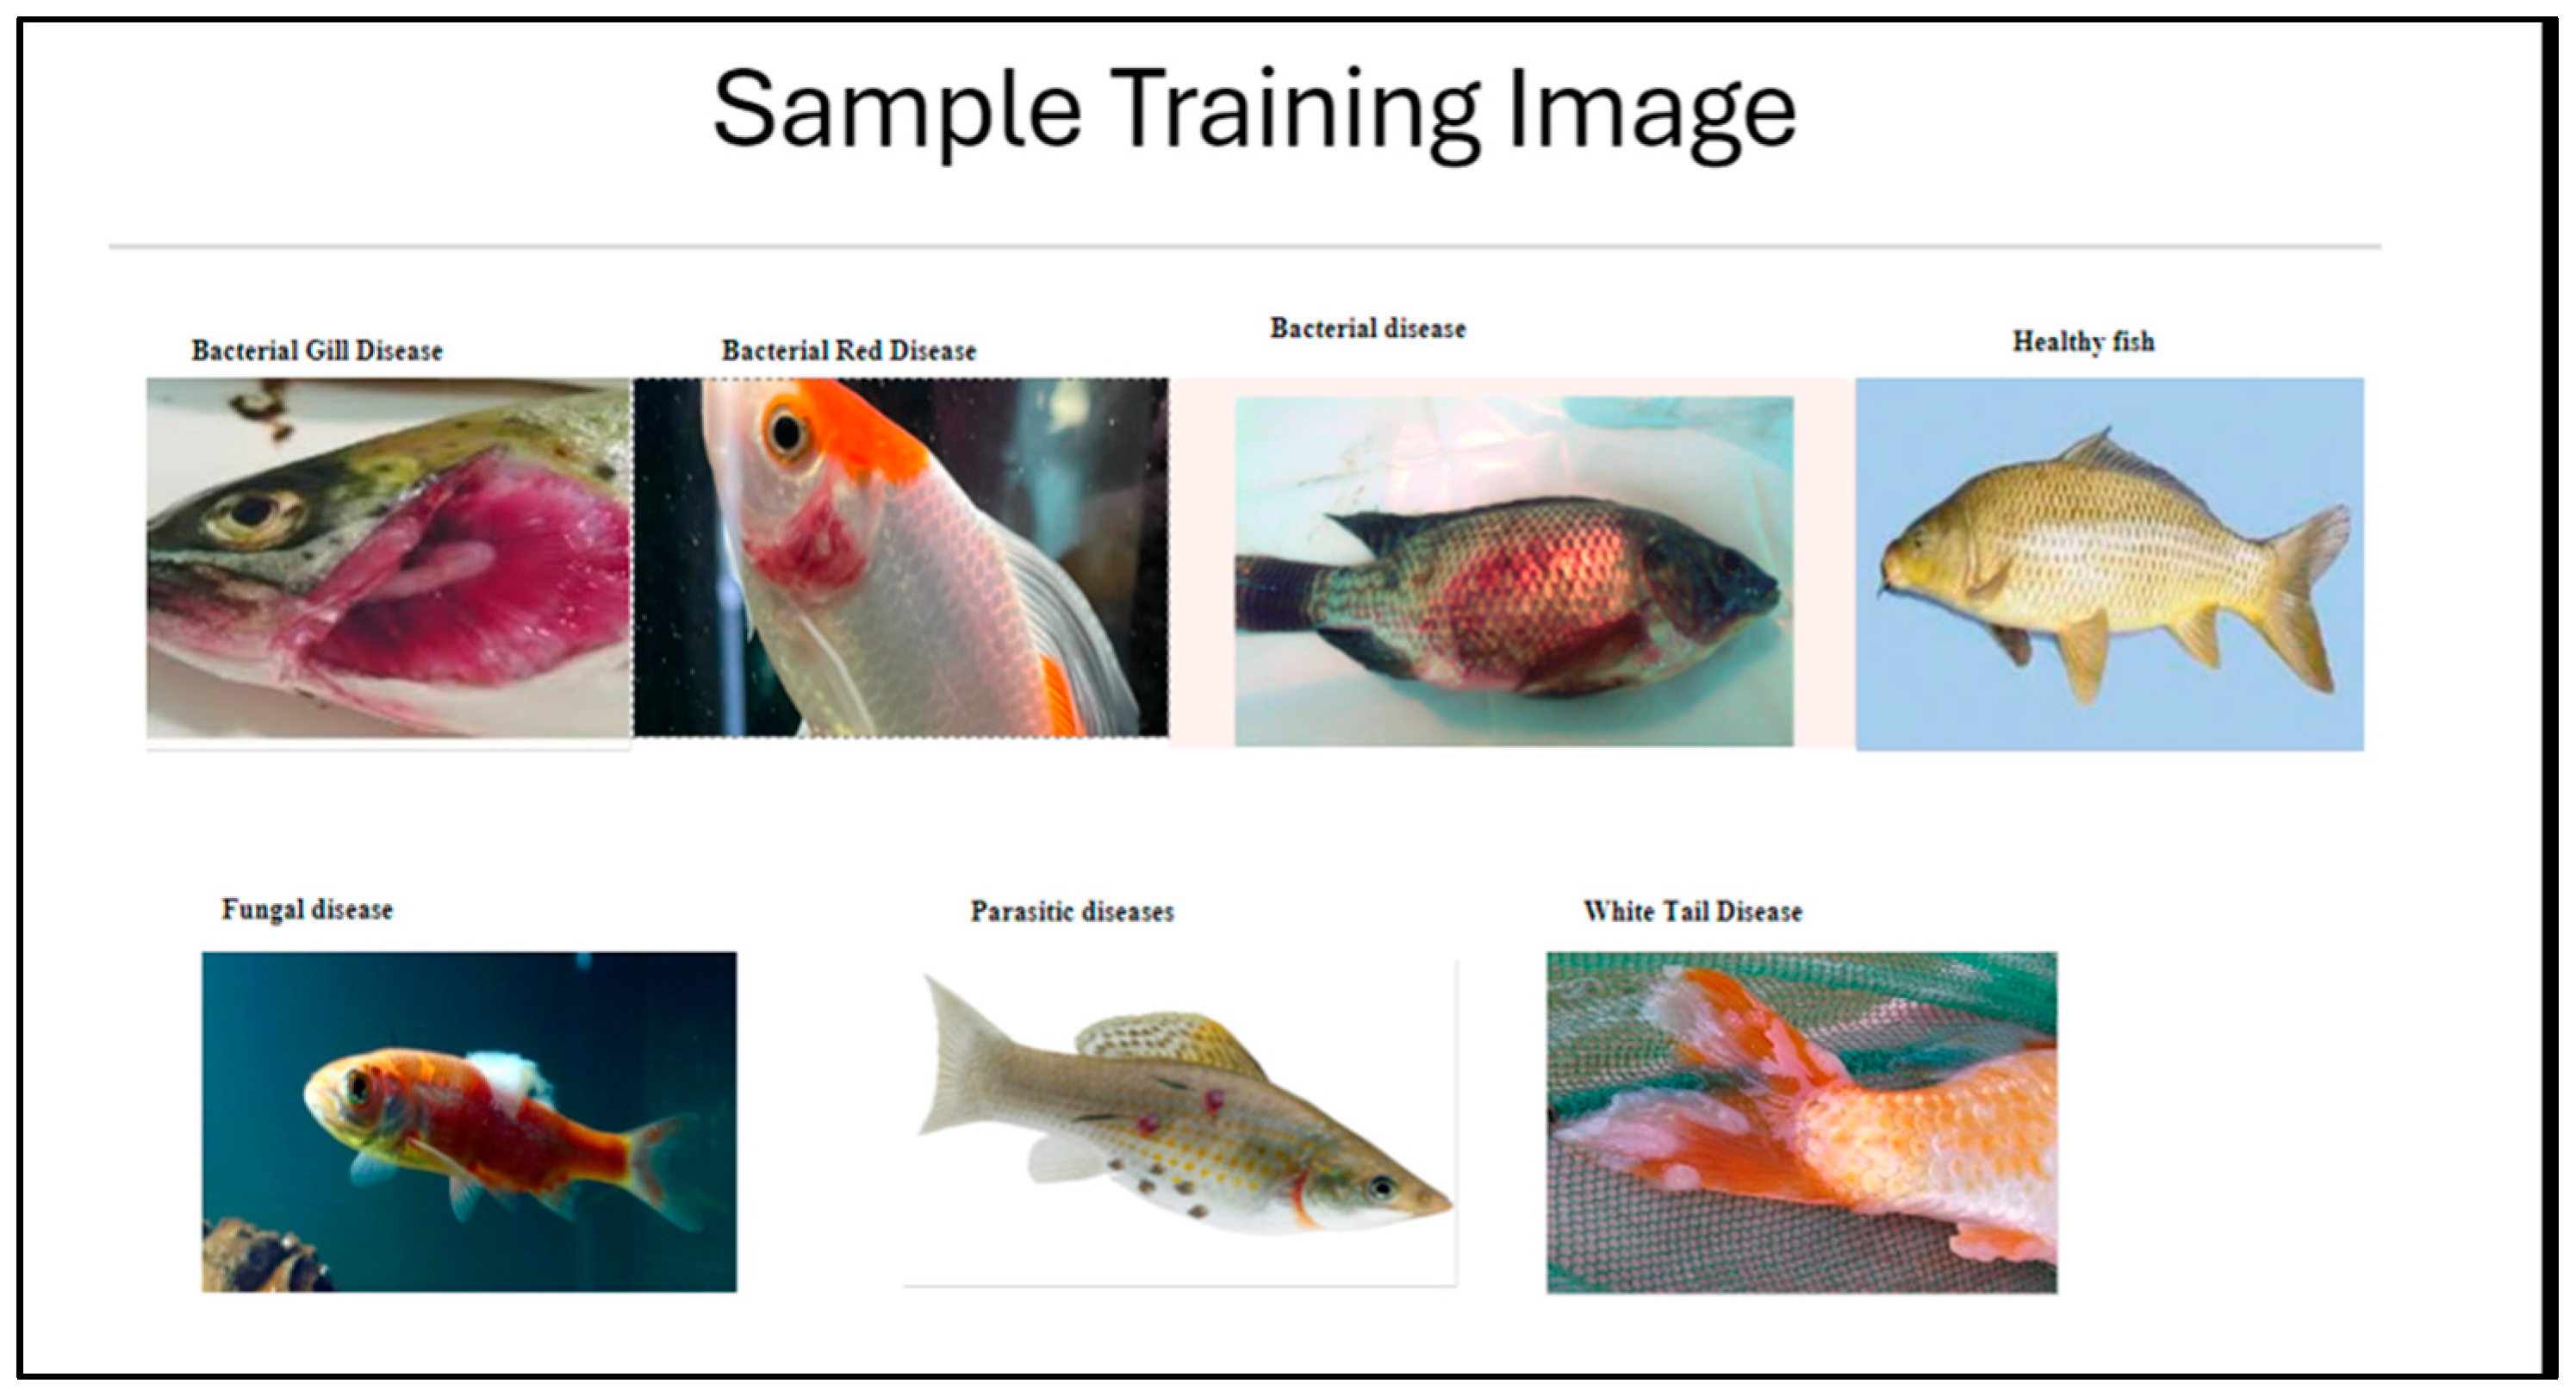
2.1. Data Collection
- The training set comprises 1747 images (71.48% of total images used). Here, every class contains around 250 images, except for the “viral disease/white tail disease” class, which has 247 images.
- The validation set comprises 697 images (28.52% of total images used). The validation set consists of approximately 100 images per class, verifying that it aligns with the training dataset’s consistency. The model was developed using Keras, a high-level API built on TensorFlow, due to its simplicity and user-friendly design, which facilitates rapid prototyping and development of deep learning models. While Keras is widely adopted, alternatives like PyTorch 2.3.0 offer additional flexibility and lower-level control, making them better suited for certain advanced research and production environments [22,23]. Future studies could explore PyTorch to improve compatibility with broader frameworks and optimize performance for resource-constrained setups.
2.1.1. Data Preprocessing
2.1.2. Data Generation
2.2. Model Evaluation
2.2.1. Model Compilation
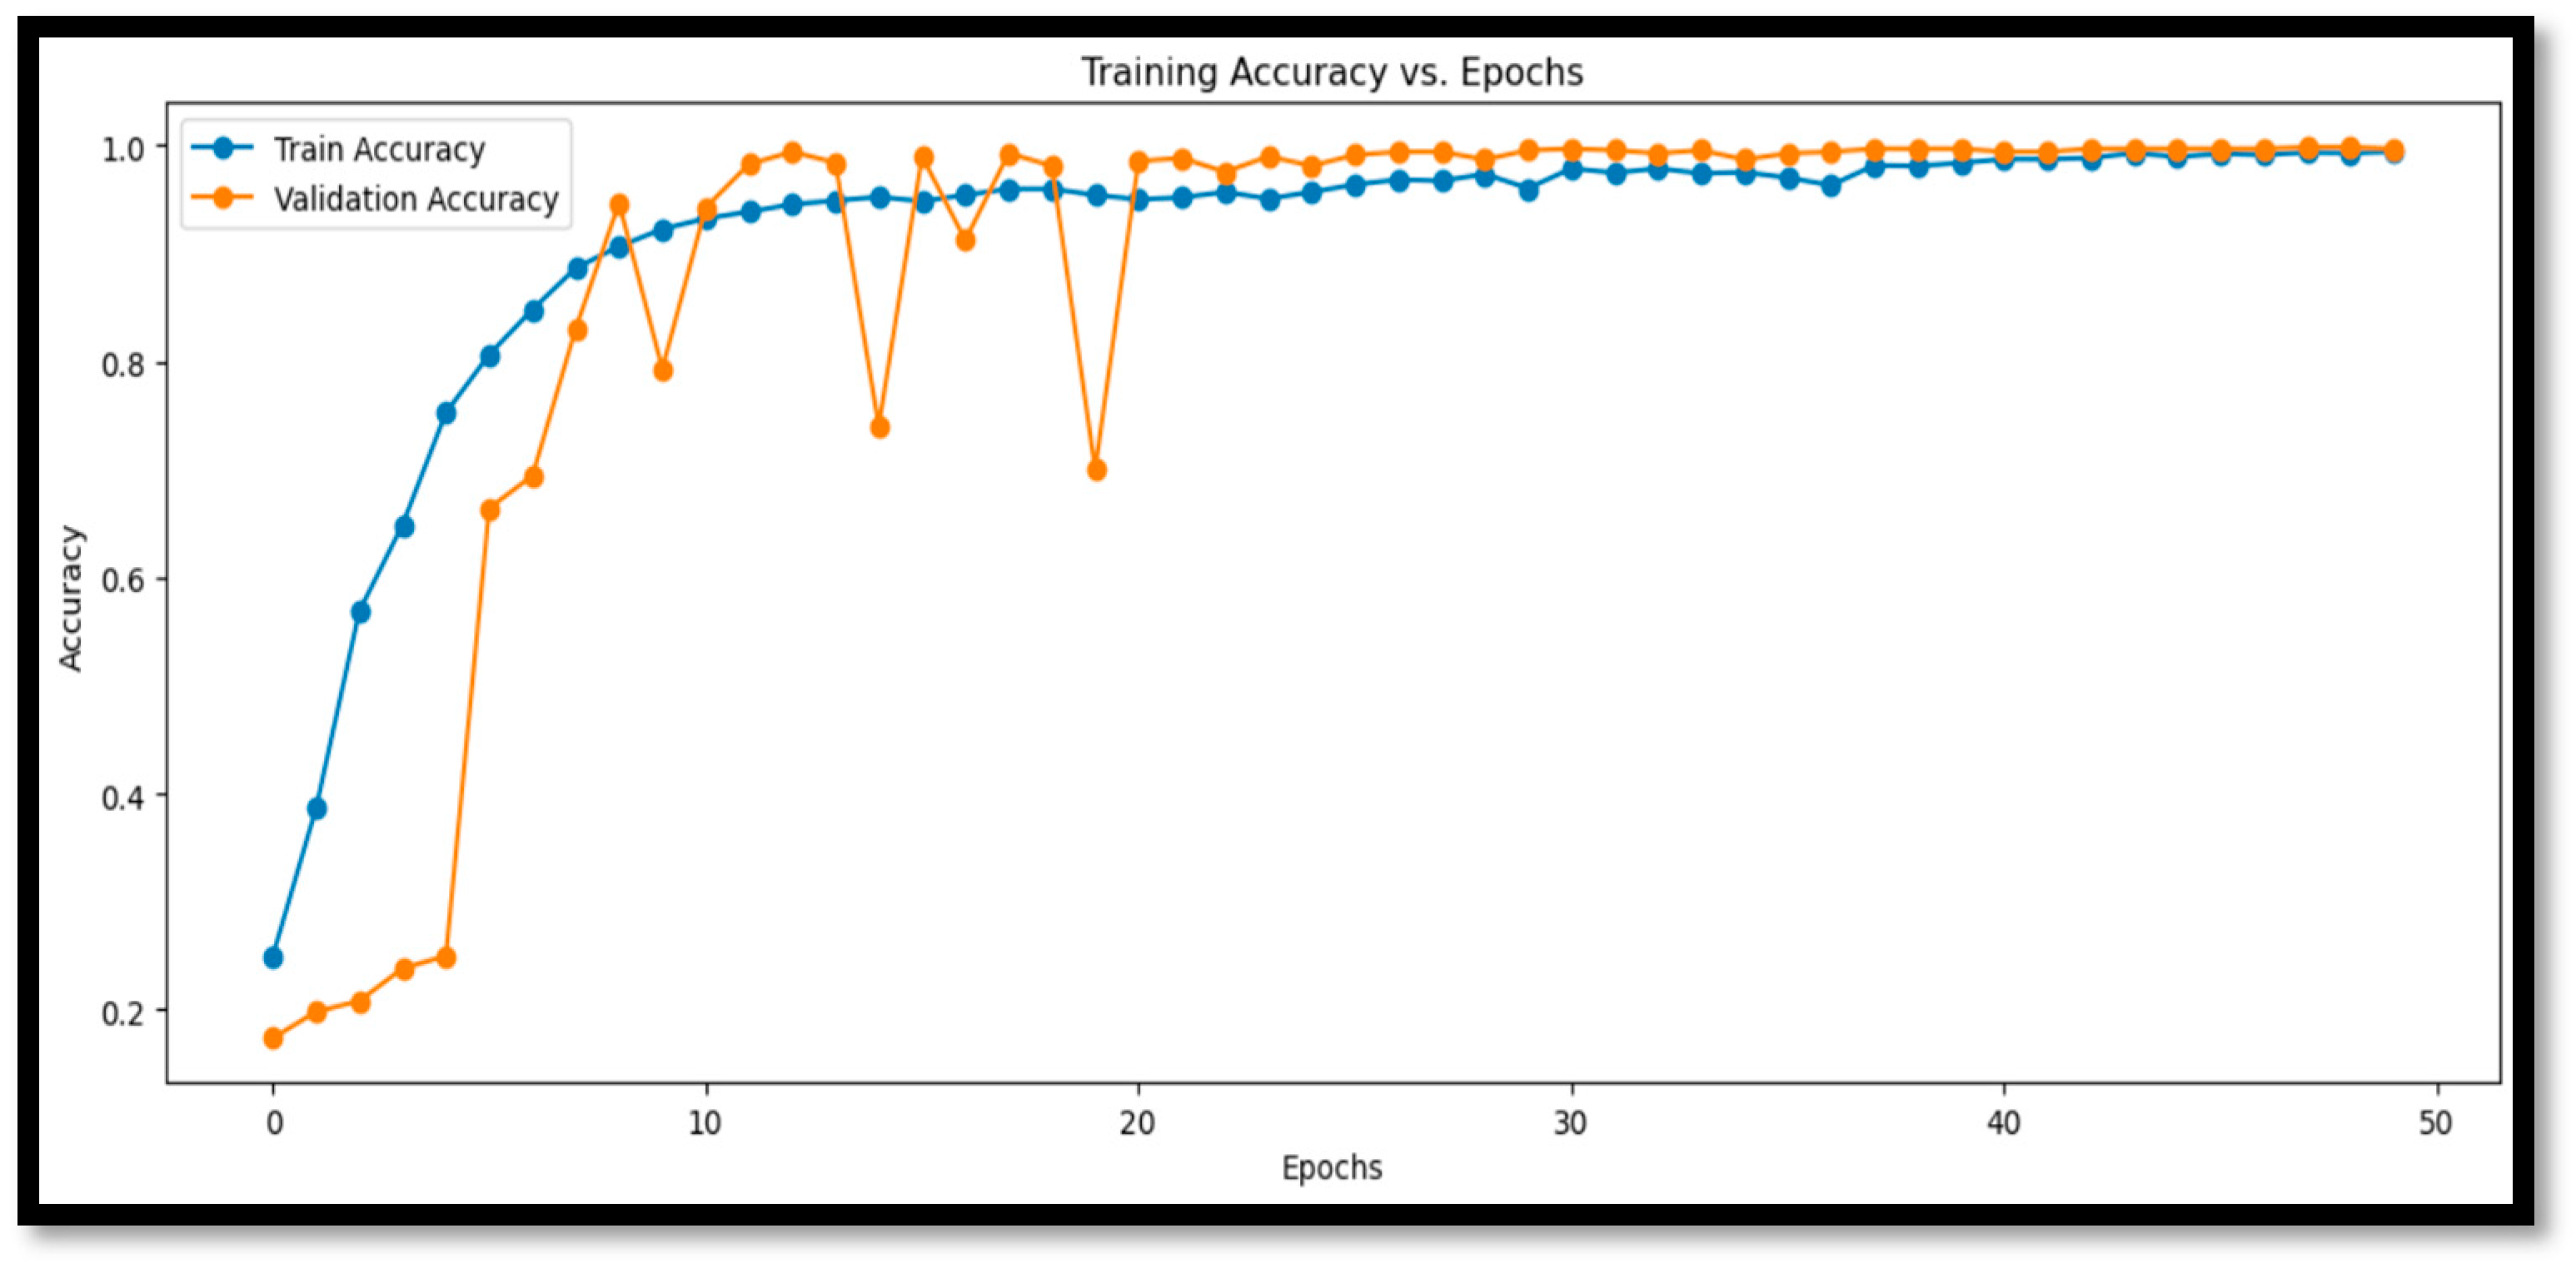
2.2.2. Training the Model
2.3. Evaluation Criteria
3. Results and Discussion
3.1. Model Time Complexity
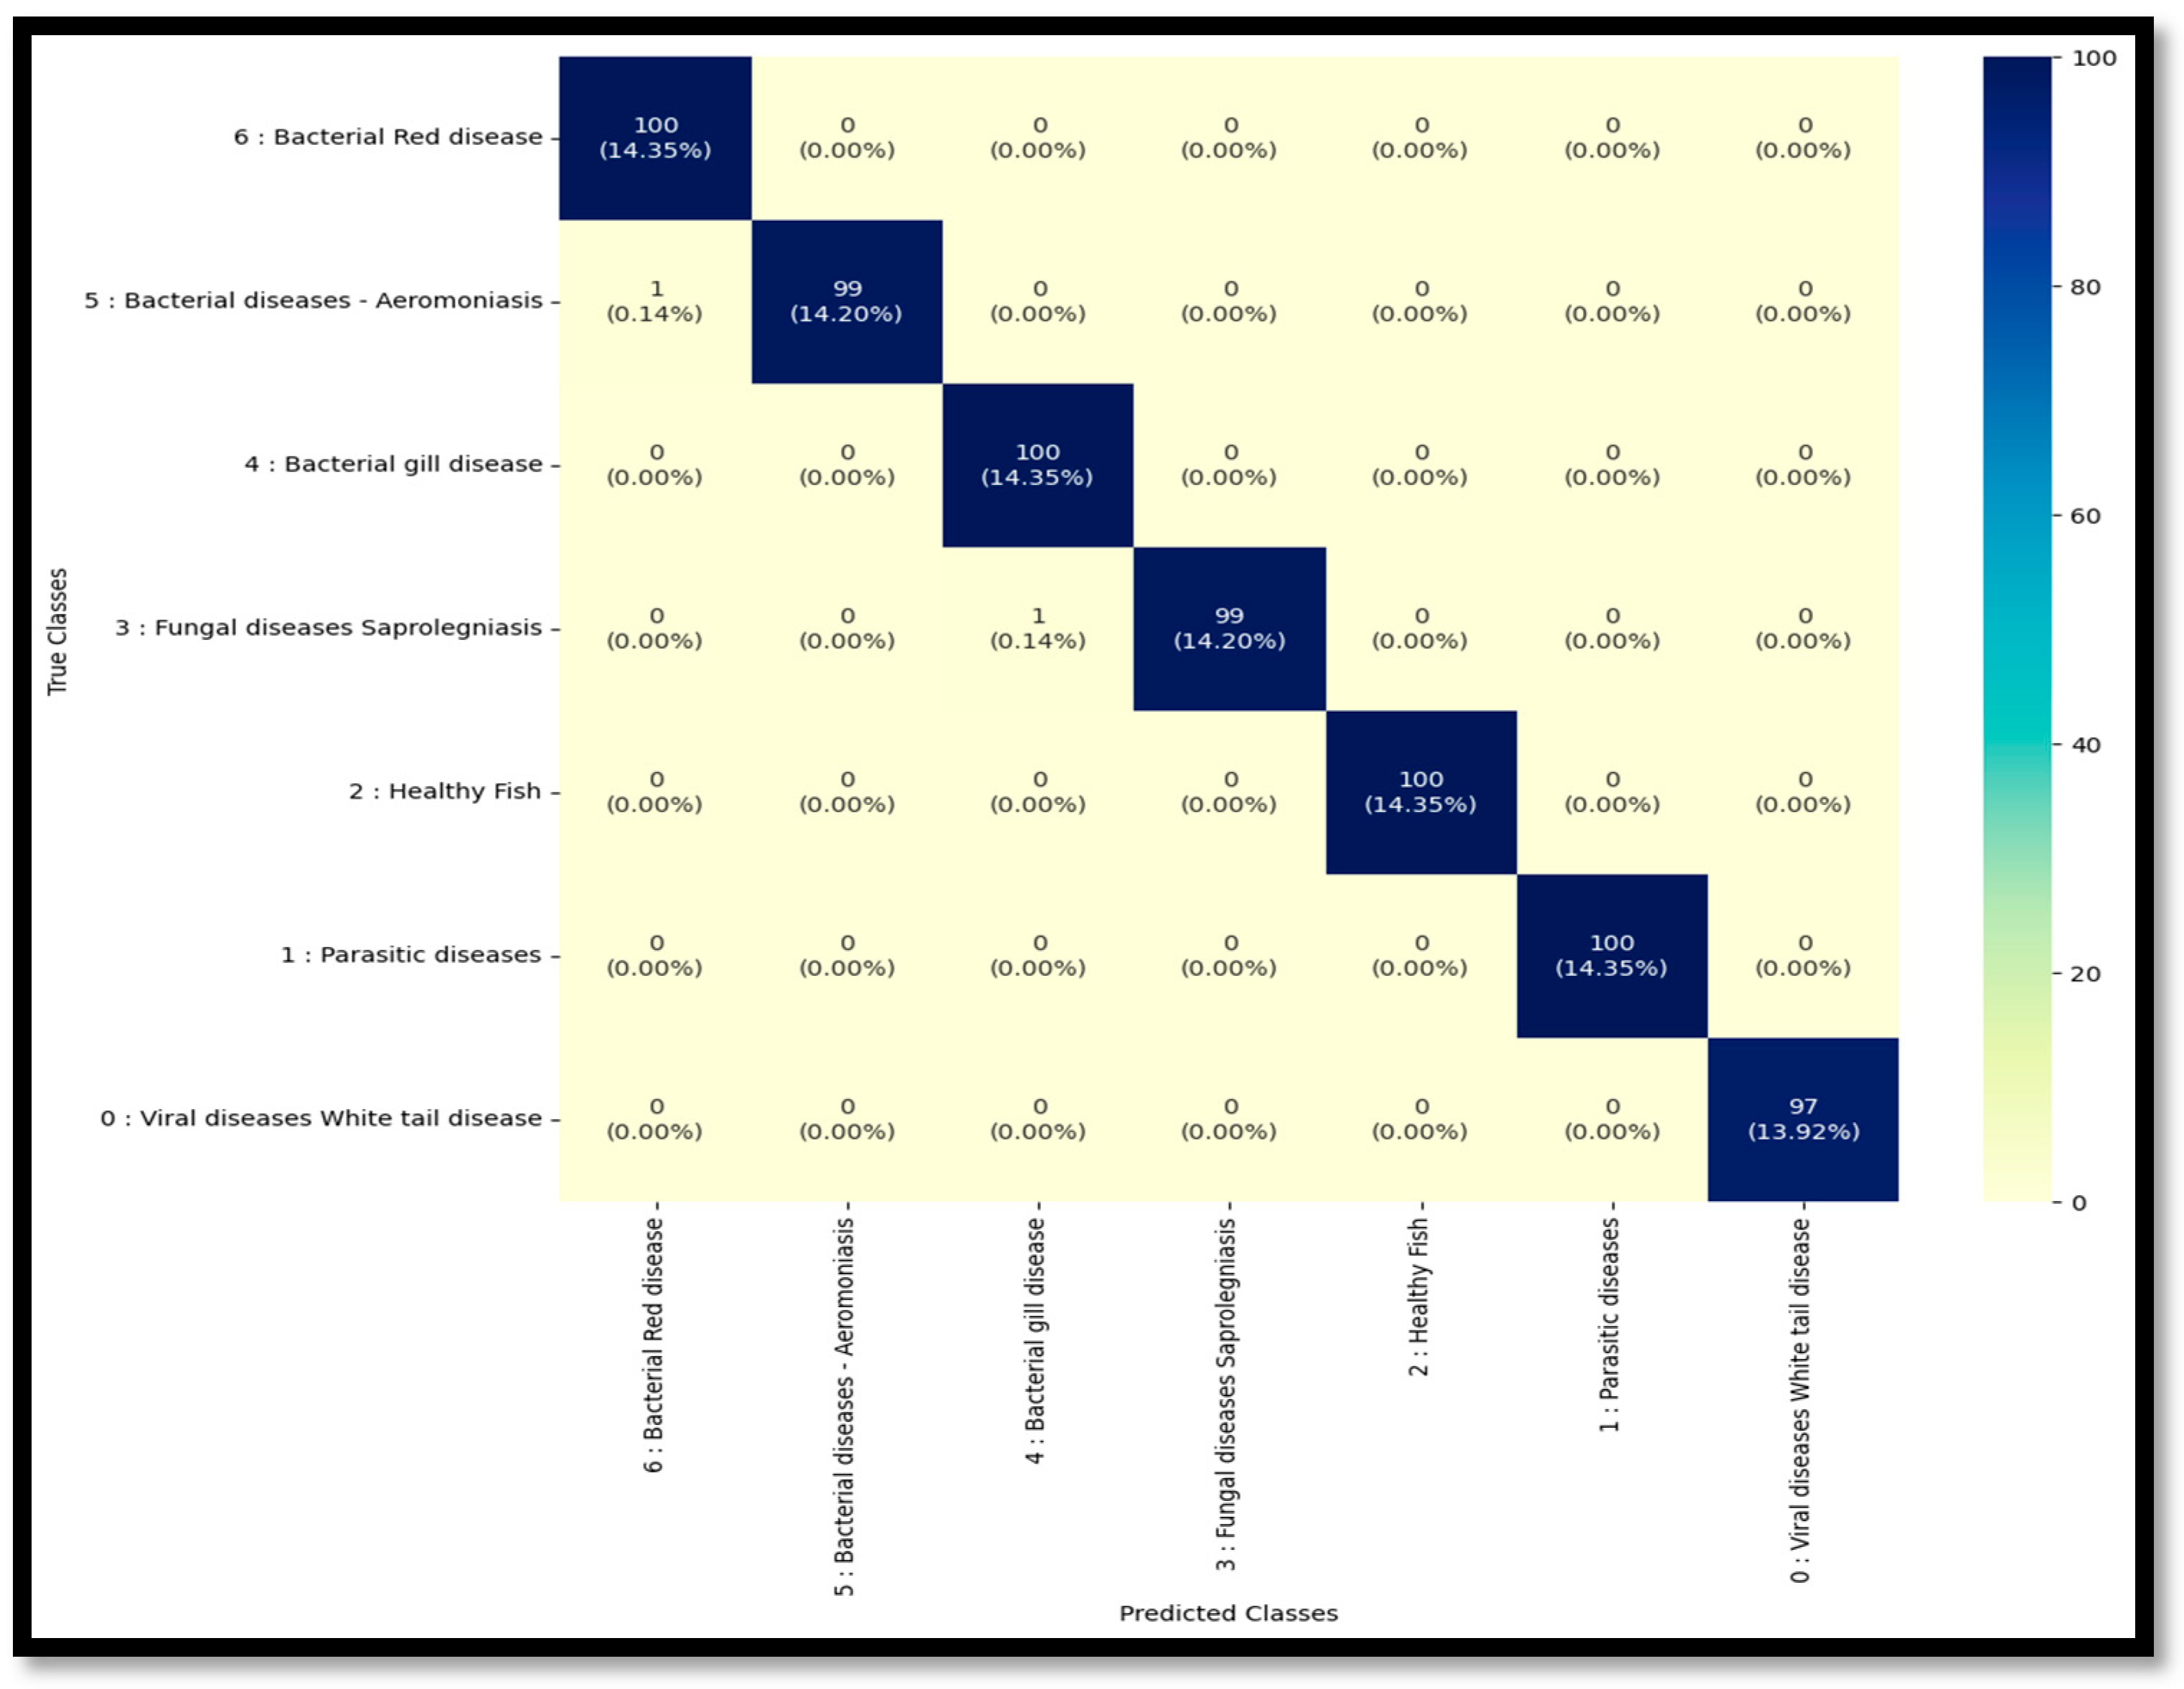
3.2. Confusion Matrix Analysis
3.3. Performance Metrics
3.3.1. Enhanced Quantitative Analysis of Accuracy and Errors
3.3.2. Error Analysis
3.4. CNN Model Architecture and Performance
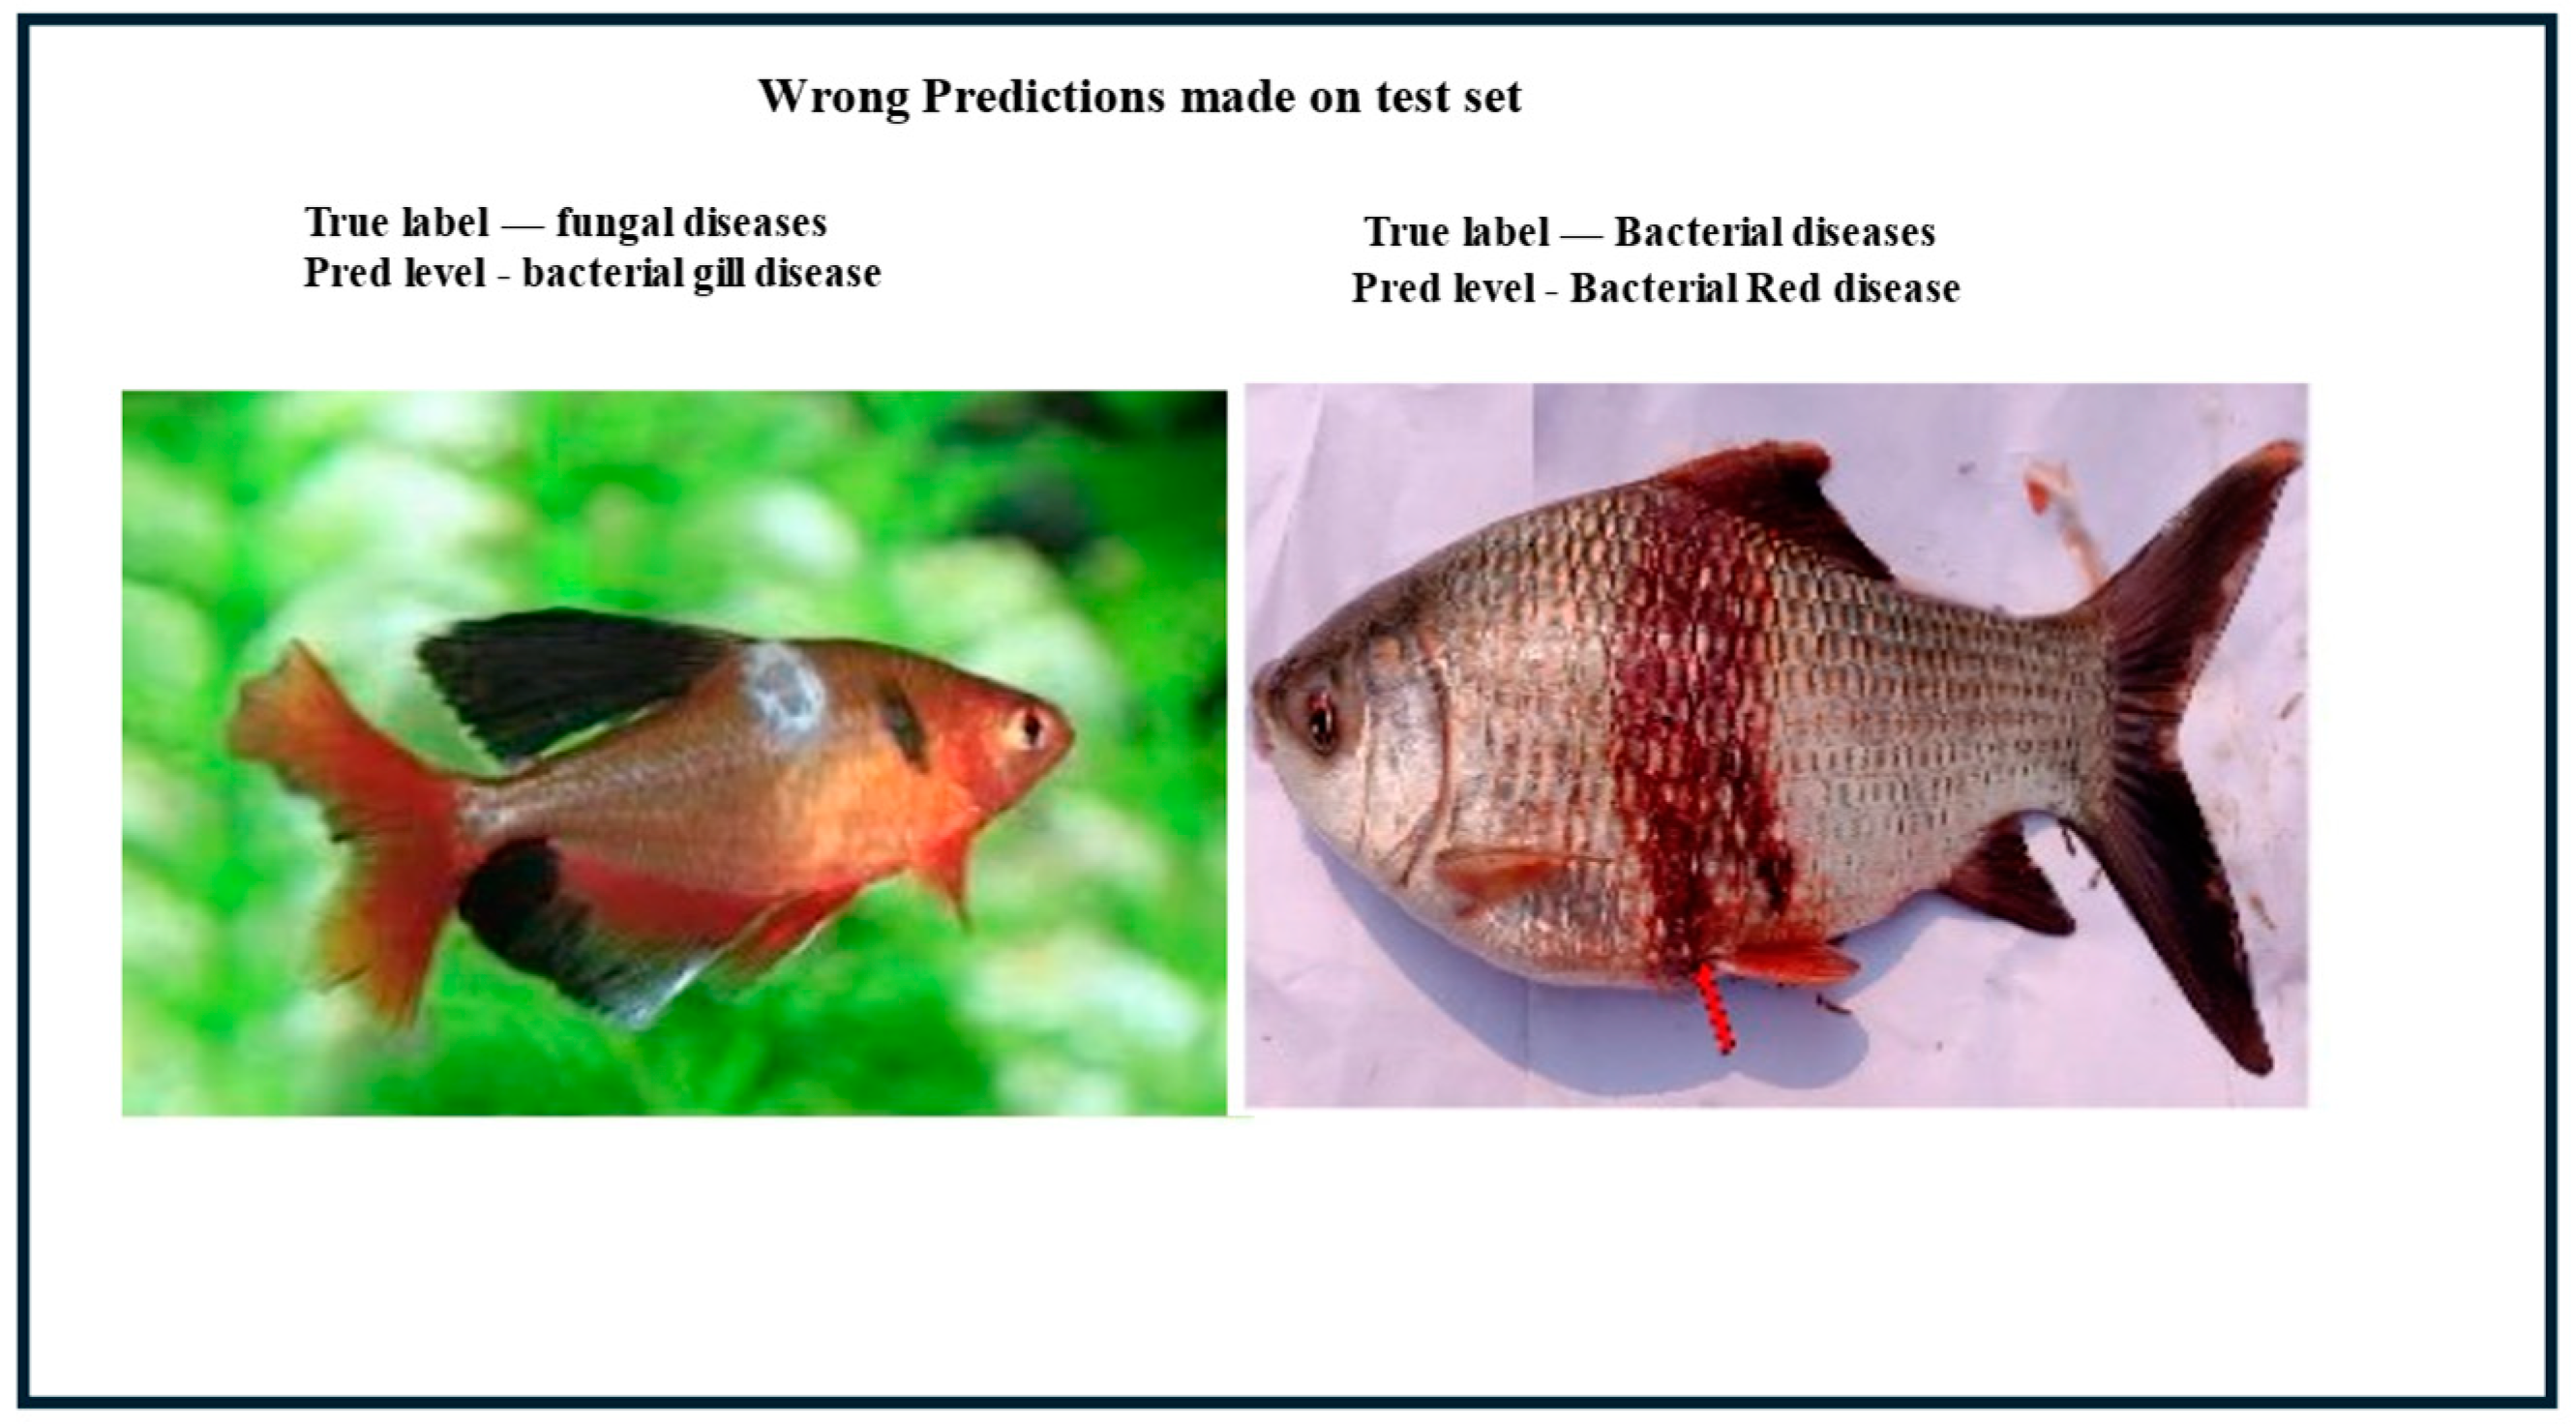
3.5. Error Visualization Insights
4. Conclusions
Author Contributions
Funding
Institutional Review Board Statement
Data Availability Statement
Conflicts of Interest
References
- FAO (Food and Agricultural Organization). The State of World Fisheries and Aquaculture 2024: Blue Transformation in Action; UN: The United Nations: United States of America. 2024; Available online: https://coilink.org/20.500.12592/2rbp5z6 (accessed on 30 November 2024).
- Nie, P.; Hallerman, E. Advancing the sustainability of aquaculture. Rev. Aquac. 2021, 13, 781. [Google Scholar] [CrossRef]
- Boyd, C.; D’Abramo, L.; Glencross, B.; Huyben, D.; Juarez, L.; Lockwood, G.; McNevin, A.; Tacon, A.; Teletchea, F.; Tomasso, J., Jr.; et al. Achieving sustainable aquaculture: Historical and current perspectives and future needs and challenges. J. World Aquac. Soc. 2020, 51, 578–633. [Google Scholar] [CrossRef]
- Mohanty, B.; Mahanty, A.; Ganguly, S.; Mitra, T.; Karunakaran, D.; Anandan, R. Nutritional composition of food fishes and their importance in providing food and nutritional security. Food Chem. 2019, 293, 561–570. [Google Scholar] [CrossRef]
- Bayissa, T.; Geerardyn, M.; Gobena, S.; Vanhauteghem, D.; Du Laing, G.; Wakijra Kabeta, M.; Janssens, G. Impact of species and their edible parts on the macronutrient and mineral composition of fish from the same aquatic environment, the Gilgel Gibe Reservoir, Ethiopia. J. Anim. Physiol. Anim. Nutr. 2022, 106, 220–228. [Google Scholar] [CrossRef] [PubMed]
- Bondad-Reantaso, M.; Subasinghe, R.; Arthur, J.; Ogawa, K.; Chinabut, S.; Adlard, R.; Tan, Z.; Shariff, M. Disease and Health Management in Asian Aquaculture. Vet. Parasitol. 2005, 132, 249–272. [Google Scholar] [CrossRef] [PubMed]
- Bosma, R.; Verdegem, M. Sustainable aquaculture in ponds: Principles, practices and limits. Livest. Sci. 2011, 139, 58–68. [Google Scholar] [CrossRef]
- Snieszko, S. Recent advances in scientific knowledge and developments pertaining to diseases of fishes. Adv. Vet. Sci. Comp. Med. 1973, 17, 291–314. [Google Scholar]
- World Bank. Reducing Disease Risks in Aquaculture. In World Bank Report 88257-GLB; World Bank: Washington, DC, USA, 2014. [Google Scholar]
- Asche, F.; Eggert, H.; Oglend, A.; Roheim, C.; Smith, M. Aquaculture: Externalities and policy options. Rev. Environ. Econ. Policy 2022, 16, 282–305. [Google Scholar] [CrossRef]
- Behringer, D.C.; Silliman, B.R.; Lafferty, K.D. Disease in fisheries and aquaculture. In Marine Disease Ecology; Behringer, D.C., Silliman, B.R., Lafferty, K.D., Eds.; Oxford University Press: Oxford, UK, 2020. [Google Scholar] [CrossRef]
- Lafferty, K.; Harvell, C.; Conrad, J.; Friedman, C.; Kent, M.; Kuris, A.; Powell, E.; Rondeau, D.; Saksida, S. Infectious Diseases Affect Marine Fisheries and Aquaculture Economics. Annu. Rev. Mar. Sci. 2015, 7, 471–496. [Google Scholar] [CrossRef]
- Karunasagar, I.; Karunasagar, I.; Otta, S. Disease Problems Affecting Fish in Tropical Environments. J. Appl. Aquac. 2003, 13, 231–249. [Google Scholar] [CrossRef]
- Mohd-Aris, A.; Muhamad-Sofie, M.; Zamri-Saad, M.; Daud, H.; Ina-Salwany, M. Live vaccines against bacterial fish diseases: A review. Vet. World 2019, 12, 1806. [Google Scholar] [CrossRef]
- Subramani, P.; Michael, R. Prophylactic and Prevention Methods Against Diseases in Aquaculture. In Fish Diseases: Prevention and Control Strategies; Jeney, G., Ed.; Elsevier Inc: Amsterdam, The Netherlands, 2017; Chapter 4; pp. 81–117. [Google Scholar] [CrossRef]
- Peterman, M.; Posadas, B. Direct Economic Impact of Fish Diseases on the East Mississippi Catfish Industry. N. Am. J. Aquac. 2019, 81, 222–229. [Google Scholar] [CrossRef]
- Overstreet, R.; Curran, S. Defeating Diplostomoid Dangers in USA Catfish Aquaculture. Folia Parasitol. 2004, 51, 153–165. [Google Scholar] [CrossRef] [PubMed]
- Maldonado-Miranda, J.; Castillo-Pérez, L.; Ponce-Hernández, A.; Carranza-Álvarez, C. Summary of Economic Losses Due to Bacterial Pathogens in Aquaculture Industry. In Bacterial Fish Diseases; Elsevier: Amsterdam, The Netherlands, 2022; pp. 399–417. [Google Scholar]
- Singh, A.; Gupta, H.; Srivastava, A.; Srivastava, A.; Joshi, R.; Dutta, M. A novel pilot study on imaging-based identification of fish exposed to heavy metal (Hg) contamination. J. Food Process Preserv. 2021, 45, e15571. [Google Scholar] [CrossRef]
- Hasan, N.; Ibrahim, S.; Azlan, A. Fish Diseases Detection Using Convolutional Neural Network (CNN). Int. J. Nonlinear Anal. Appl. 2022, 13, 1977–1984. [Google Scholar] [CrossRef]
- Rekha, B.; Srinivasan, G.; Reddy, S.; Kakwani, D.; Bhattad, N. Fish detection and classification using convolutional neural networks. In Computational Vision and Bio-Inspired Computing: ICCVBIC 2019; Springer: Berlin/Heidelberg, Germany, 2020; pp. 1221–1231. [Google Scholar]
- Abadi, M.; Barham, P.; Chen, J.; Chen, Z.; Davis, A.; Dean, J.; Devin, M.; Ghemawat, S.; Irving, G.; Isard, M.; et al. TensorFlow: A System for Large-Scale Machine Learning. In Proceedings of the 12th USENIX Symposium on Operating Systems Design and Implementation (OSDI), Savannah, GA, USA, 2–4 November 2016; USENIX Association: Berkeley, CA, USA, 2016; pp. 265–283. Available online: https://www.usenix.org/conference/osdi16/technical-sessions/presentation/abadi (accessed on 20 January 2025).
- Ahmed, M.S.; Jeba, S.M. SalmonScan: A Novel Image Dataset for Machine Learning and Deep Learning Analysis in Fish Disease Detection in Aquaculture. Data Brief 2024, 54, 110388. [Google Scholar] [CrossRef]
- Chakravorty, H.; Paul, R.; Das, P. Image processing technique to detect fish disease. Int. J. Comput. Sci. Secur. (IJCSS) 2015, 9, 121–131. [Google Scholar]
- Kartika, T.; Herumurti, D. Detection of Koi Carp Diseases Using Traditional Image Processing Techniques and K-Means Clustering. Int. J. Imaging Sci. Technol. 2016, 26, 78–86. [Google Scholar]
- Yu, X.; Li, Q.; Wang, Z.; Zhang, Y. Fish disease detection using Mobile Net v3-GELU-YOLOv4 model. IEEE Trans. Image Process. 2023, 32, 789–798. [Google Scholar]
- Pei, G.; Wu, W.; Zhou, B.; Liu, Z.; Li, P.; Qian, X.; Yang, H. Research on Agricultural Disease Recognition Methods Based on Very Large Kernel Convolutional Network-RepLKNet. Preprints 2024, 1–12. [Google Scholar] [CrossRef]
- Kaggle. Dataset of Freshwater Fish Diseases and Healthy Specimens. 2024. Publicly Available Under the Kaggle License Permitting Academic Use. Available online: https://www.kaggle.com/datasets/subirbiswas19/freshwater-fish-disease-aquaculture-in-south-asia/data (accessed on 26 January 2024).
- De Raad, K.; van Garderen, K.A.; Smits, M.; van der Voort, S.R.; Incekara, F.; Oei, E.; Hirvasniemi, J.; Klein, S.; Starmans, M.P. The Effect of Preprocessing on Convolutional Neural Networks for Medical Image Segmentation. In Proceedings of the 2021 IEEE 18th International Symposium on Biomedical Imaging (ISBI), Nice, France, 13–16 April 2021; IEEE: Piscataway, NJ, USA, 2021; pp. 655–658. [Google Scholar] [CrossRef]
- Ghosh, R.; Cingreddy, A.R.; Melapu, V.; Joginipelli, S.; Kar, S. Application of artificial intelligence and machine learning techniques in classifying extent of dementia across alzheimer’s image data. Int. J. Quant. Struct. Prop. Relatsh. (IJQSPR) 2021, 6, 29–46. [Google Scholar] [CrossRef]
- Ahmed, M.S.; Aurpa, T.T.; Azad, M.A.K. Fish Disease Detection Using Image-Based Machine Learning Technique in Aquaculture. J. King Saud Univ.—Comput. Inf. Sci. 2022, 34, 5170–5182. [Google Scholar] [CrossRef]
- Mia, M.; Rahman, M.; Hasan, M.; Islam, M. Comparative Analysis of Multiple Machine Learning Algorithms for Fish Disease Detection. Mach. Learn. Aquacult. 2022, 14, 450–465. [Google Scholar]
- Sivakumar, M.; Parthasarathy, S.; Padmapriya, T. Trade-off between training and testing ratio in machine learning for medical image processing. PeerJ Comput. Sci. 2024, 10, e2245. [Google Scholar] [CrossRef] [PubMed]
- Tseng, C.; Lin, Y. Fish Disease Detection Using CNNs Combined with K-Means Clustering. Comput. Biol. Bioinform. 2023, 18, 144–152. [Google Scholar]
- Chakravorty, S.; Das, S.; Chakrabarti, A. Fish Disease Detection Using Principal Component Analysis and K-Means Clustering. J. Aquat. Sci. 2015, 12, 234–241. [Google Scholar]
- Malik, H.; Naeem, A.; Hassan, S.; Ali, F.; Naqvi, R.A.; Yon, D.K. Multi-classification deep neural networks for identification of fish species using camera captured images. PLoS ONE 2023, 18, e0284992. [Google Scholar] [CrossRef]
- Lee, R.; Chen, I.Y. The time complexity analysis of neural network model configurations. In Proceedings of the 2020 International Conference on Mathematics and Computers in Science and Engineering (MACISE), Madrid, Spain, 14–16 January 2020; pp. 178–183. [Google Scholar]
- Oyedare, T.; Shah, V.K.; Jakubisin, D.J.; Reed, J.H. Keep it simple: CNN model complexity studies for interference classification tasks. In Proceedings of the IEEE INFOCOM 2023—IEEE Conference on Computer Communications Workshops (INFOCOM WKSHPS), New York, NY, USA, 17–20 May 2023; IEEE: Piscataway, NJ, USA, 2023; pp. 1–6. [Google Scholar]
- Ramachandran, L.; Mohan, V.; SenthilKumar, S.; Sankara Ganesh, J. Early Detection and Identification of White Spot Syndrome in Shrimp Using an Improved Deep Convolutional Neural Network. J. Intell. Fuzzy Syst. 2023, 45, 6429–6440. [Google Scholar] [CrossRef]
- Wang, Z.; Liu, H.; Zhang, G.; Yang, X.; Wen, L.; Zhao, W. Diseased Fish Detection in the Underwater Environment Using an Improved YOLOv5 Network for Intensive Aquaculture. Fishes 2023, 8, 169. [Google Scholar] [CrossRef]
- Haddad, M.; Hassan, F.; Mohammed, H. A Convolutional Neural Network Approach for Precision Fish Disease Detection. Evol. Stud. Imaginative Cult. 2024, 8, 1018–1033. [Google Scholar] [CrossRef]
- Thakur, K.; Shetty, M.; Singh, S.; Khanapuri, J. Enhancing Fish Disease Detection: A Comprehensive Review for Sustainable Aquaculture. In Proceedings of the 2023 IEEE International Conference on Advanced Science and Technology (ICAST), Pune, India, 15–17 March 2023; pp. 191–196. [Google Scholar] [CrossRef]
- Ssekitto, I.; Oyoka, D.; Mwebembezi, G.; Mubuuke, J.K.; Lule, E.; Ggaliwango, M. Explainable Machine Vision Techniques for Fish Disease Detection with Deep Transfer Learning. In Proceedings of the International Conference on Electrical, Computer, and Systems Engineering (ICECSE), Kampala, Uganda, 15–17 March 2024; pp. 1218–1227. [Google Scholar] [CrossRef]
- Akram, W.; Hassan, T.U.; Toubar, H.; Ahmed, M.D.F.; Mišković, N.; Seneviratne, L.; Hussain, I. Aquaculture Defects Recognition via Multi-Scale Semantic Segmentation. Expert Syst. Appl. 2023, 237, 121197. [Google Scholar] [CrossRef]
- Phettongkam, H. Error Analysis and Its Implications in Communicative English Language Teaching. Thammasat Rev. 2013, 16, 96–108. [Google Scholar]
- Nanthini, N.; Arul, S.; Kumaran, K.; Ashiq, A.; Aakash, V.S.; Bhuvaneshwaran, M.J. Convolutional neural networks (CNN) based marine species identification. In Proceedings of the 2022 International Conference on Advanced Computing and Robotic Systems. (ICACRS), Pudukkottai, India, 13–15 December 2022; pp. 602–607. [Google Scholar] [CrossRef]
- Yasruddin, M.L.; Ismail, M.A.H.; Husin, Z.; Tan, W.K. Feasibility study of fish disease detection using computer vision and deep convolutional neural network (DCNN) algorithm. In Proceedings of the 2022 International Conference on Control, Power, and Artificial Intelligence. (CSPA), Guangzhou, China, 21–23 October 2022; pp. 272–276. [Google Scholar] [CrossRef]
- Khabusi, S.P.; Huang, Y.P.; Lee, M.F. Attention-Based Mechanism for Fish Disease Classification in Aquaculture. In Proceedings of the 2023 International Conference on System Science and Engineering (ICSSE), Ho Chi Minh, Vietnam, 27–28 July 2023; IEEE: New York, NY, USA, 2023; pp. 95–100. [Google Scholar] [CrossRef]
- Lokesh, Y.; Rithvik, M.; Madhavi, M.; Madhu, S.; Rajeshwar Rao, K. Image Classification Using CNN with CIFAR-10 Dataset. Int. J. Res. Appl. Sci. Eng. Technol. 2024, 12, 229–231. [Google Scholar] [CrossRef]
- Surve, Y.; Pudari, K.; Bedade, S.; Masanam, B.D.; Bhalerao, K.; Mhatre, P. Comparative Analysis of Various CNN Architectures in Recognizing Objects in a Classification System. In Proceedings of the 2024 IEEE 9th International Conference for Convergence in Technology (I2CT), Pune, India, 5–7 April 2024; IEEE: Piscataway, NJ, USA; pp. 1–5. [Google Scholar] [CrossRef]
- Dash, S.; Ojha, S.; Muduli, R.K.; Patra, S.P.; Barik, R.C. Fish Type and Disease Classification Using Deep Learning Model Based Customized CNN with ResNet-50 Technique. J. Adv. Zool. 2024, 45, 32. [Google Scholar] [CrossRef]
- Azhar, A.S.B.M.; Harun, N.H.B.; Hassan, M.G.B.; Yusoff, N.B.; Pauzi, S.N.B.M.; Yusuf, N.N.; Kua, B.C. Early Screening Protozoan White Spot Fish Disease Using Convolutional Neural Network. J. Adv. Res. Appl. Sci. Eng. Technol. 2024, 37, 73–79. [Google Scholar] [CrossRef]
- Islam, M.R.; Rahman, U.S.; Akter, T.; Azim, M.A. Fish Disease Detection Using Deep Learning and Machine Learning. Int. J. Comput. Appl. 2023, 975, 8887. [Google Scholar] [CrossRef]
- Malik, S.; Kumar, T.; Sahoo, A.K. Image Processing Techniques for Identification of Fish Disease. In Proceedings of the 2017 IEEE 2nd International Conference on Signal and Image Processing (ICSIP), Singapore, 4–6 August 2017; IEEE: Piscataway, NJ, USA, 2017; pp. 55–59. [Google Scholar] [CrossRef]


| Layer (Type) | Output Shape | Parameters (Param #) |
|---|---|---|
| Conv2d_3 (Conv2D) | (None, 146, 146, 128) | 9728 |
| Activation_3 (Activation) | (None, 146, 146, 128) | 0 |
| Max_pooling2d_3 (maxpooling2d) | (None, 73, 73, 128) | 0 |
| Batch_normalization_3 (batch-normalization) | (None, 73, 73, 128) | 512 |
| Conv2d_4 (Conv2D) | (None, 71, 71, 64) | 73,792 |
| Activation_4 (Activation) | (None, 71, 71, 64) | 0 |
| Max_pooling2d_4 (maxpooling2d) | (None, 35, 35, 64) | 0 |
| Batch_normalization_4 (batch-normalization) | (None, 35, 35, 64) | 256 |
| Conv2d_5 (Conv2D) | (None, 33, 33, 32) | 18,464 |
| Activation_5 (Activation) | (None, 33, 33, 32) | 0 |
| Max_pooling2d_5 (maxpooling2d) | (None, 16, 16, 32) | 0 |
| Batch_normalization_5 (batch-normalization) | (None, 16, 16, 32) | 128 |
| Flatten_1 (Flatten) | (None, 8192) | 0 |
| Dense_2 (Dense) | (None, 256) | 2,097,408 |
| Dropout_1 (Dropout) | (None, 256) | 0 |
| Dense_3 (Dense) | (None, 7) | 1799 |
| Disease Class | Precision | Recall | F1-Score | Support |
|---|---|---|---|---|
| Bacterial Red Disease | 99.71 | 1.00 | 1.00 | 100 |
| Bacterial Diseases (Aeromoniasis) | 1.00 | 0.99 | 0.99 | 100 |
| Bacterial Gill Disease | 0.99 | 1.00 | 1.00 | 100 |
| Fungal Diseases (Saprolegniasis) | 1.00 | 0.99 | 0.99 | 100 |
| Healthy Fish | 1.00 | 1.00 | 1.00 | 100 |
| Parasitic Diseases | 1.00 | 1.00 | 1.00 | 100 |
| Viral Diseases (White Tail Disease) | 1.00 | 1.00 | 1.00 | 97 |
Disclaimer/Publisher’s Note: The statements, opinions and data contained in all publications are solely those of the individual author(s) and contributor(s) and not of MDPI and/or the editor(s). MDPI and/or the editor(s) disclaim responsibility for any injury to people or property resulting from any ideas, methods, instructions or products referred to in the content. |
© 2025 by the authors. Licensee MDPI, Basel, Switzerland. This article is an open access article distributed under the terms and conditions of the Creative Commons Attribution (CC BY) license (https://creativecommons.org/licenses/by/4.0/).
Share and Cite
Tamut, H.; Ghosh, R.; Gosh, K.; Siddique, M.A.S. Enhancing Disease Detection in the Aquaculture Sector Using Convolutional Neural Networks Analysis. Aquac. J. 2025, 5, 6. https://doi.org/10.3390/aquacj5010006
Tamut H, Ghosh R, Gosh K, Siddique MAS. Enhancing Disease Detection in the Aquaculture Sector Using Convolutional Neural Networks Analysis. Aquaculture Journal. 2025; 5(1):6. https://doi.org/10.3390/aquacj5010006
Chicago/Turabian StyleTamut, Hayin, Robin Ghosh, Kamal Gosh, and Md Abdus Salam Siddique. 2025. "Enhancing Disease Detection in the Aquaculture Sector Using Convolutional Neural Networks Analysis" Aquaculture Journal 5, no. 1: 6. https://doi.org/10.3390/aquacj5010006
APA StyleTamut, H., Ghosh, R., Gosh, K., & Siddique, M. A. S. (2025). Enhancing Disease Detection in the Aquaculture Sector Using Convolutional Neural Networks Analysis. Aquaculture Journal, 5(1), 6. https://doi.org/10.3390/aquacj5010006