
Thermal Metrics to Identify Canadian Coastal Environments

Abstract
:1. Introduction
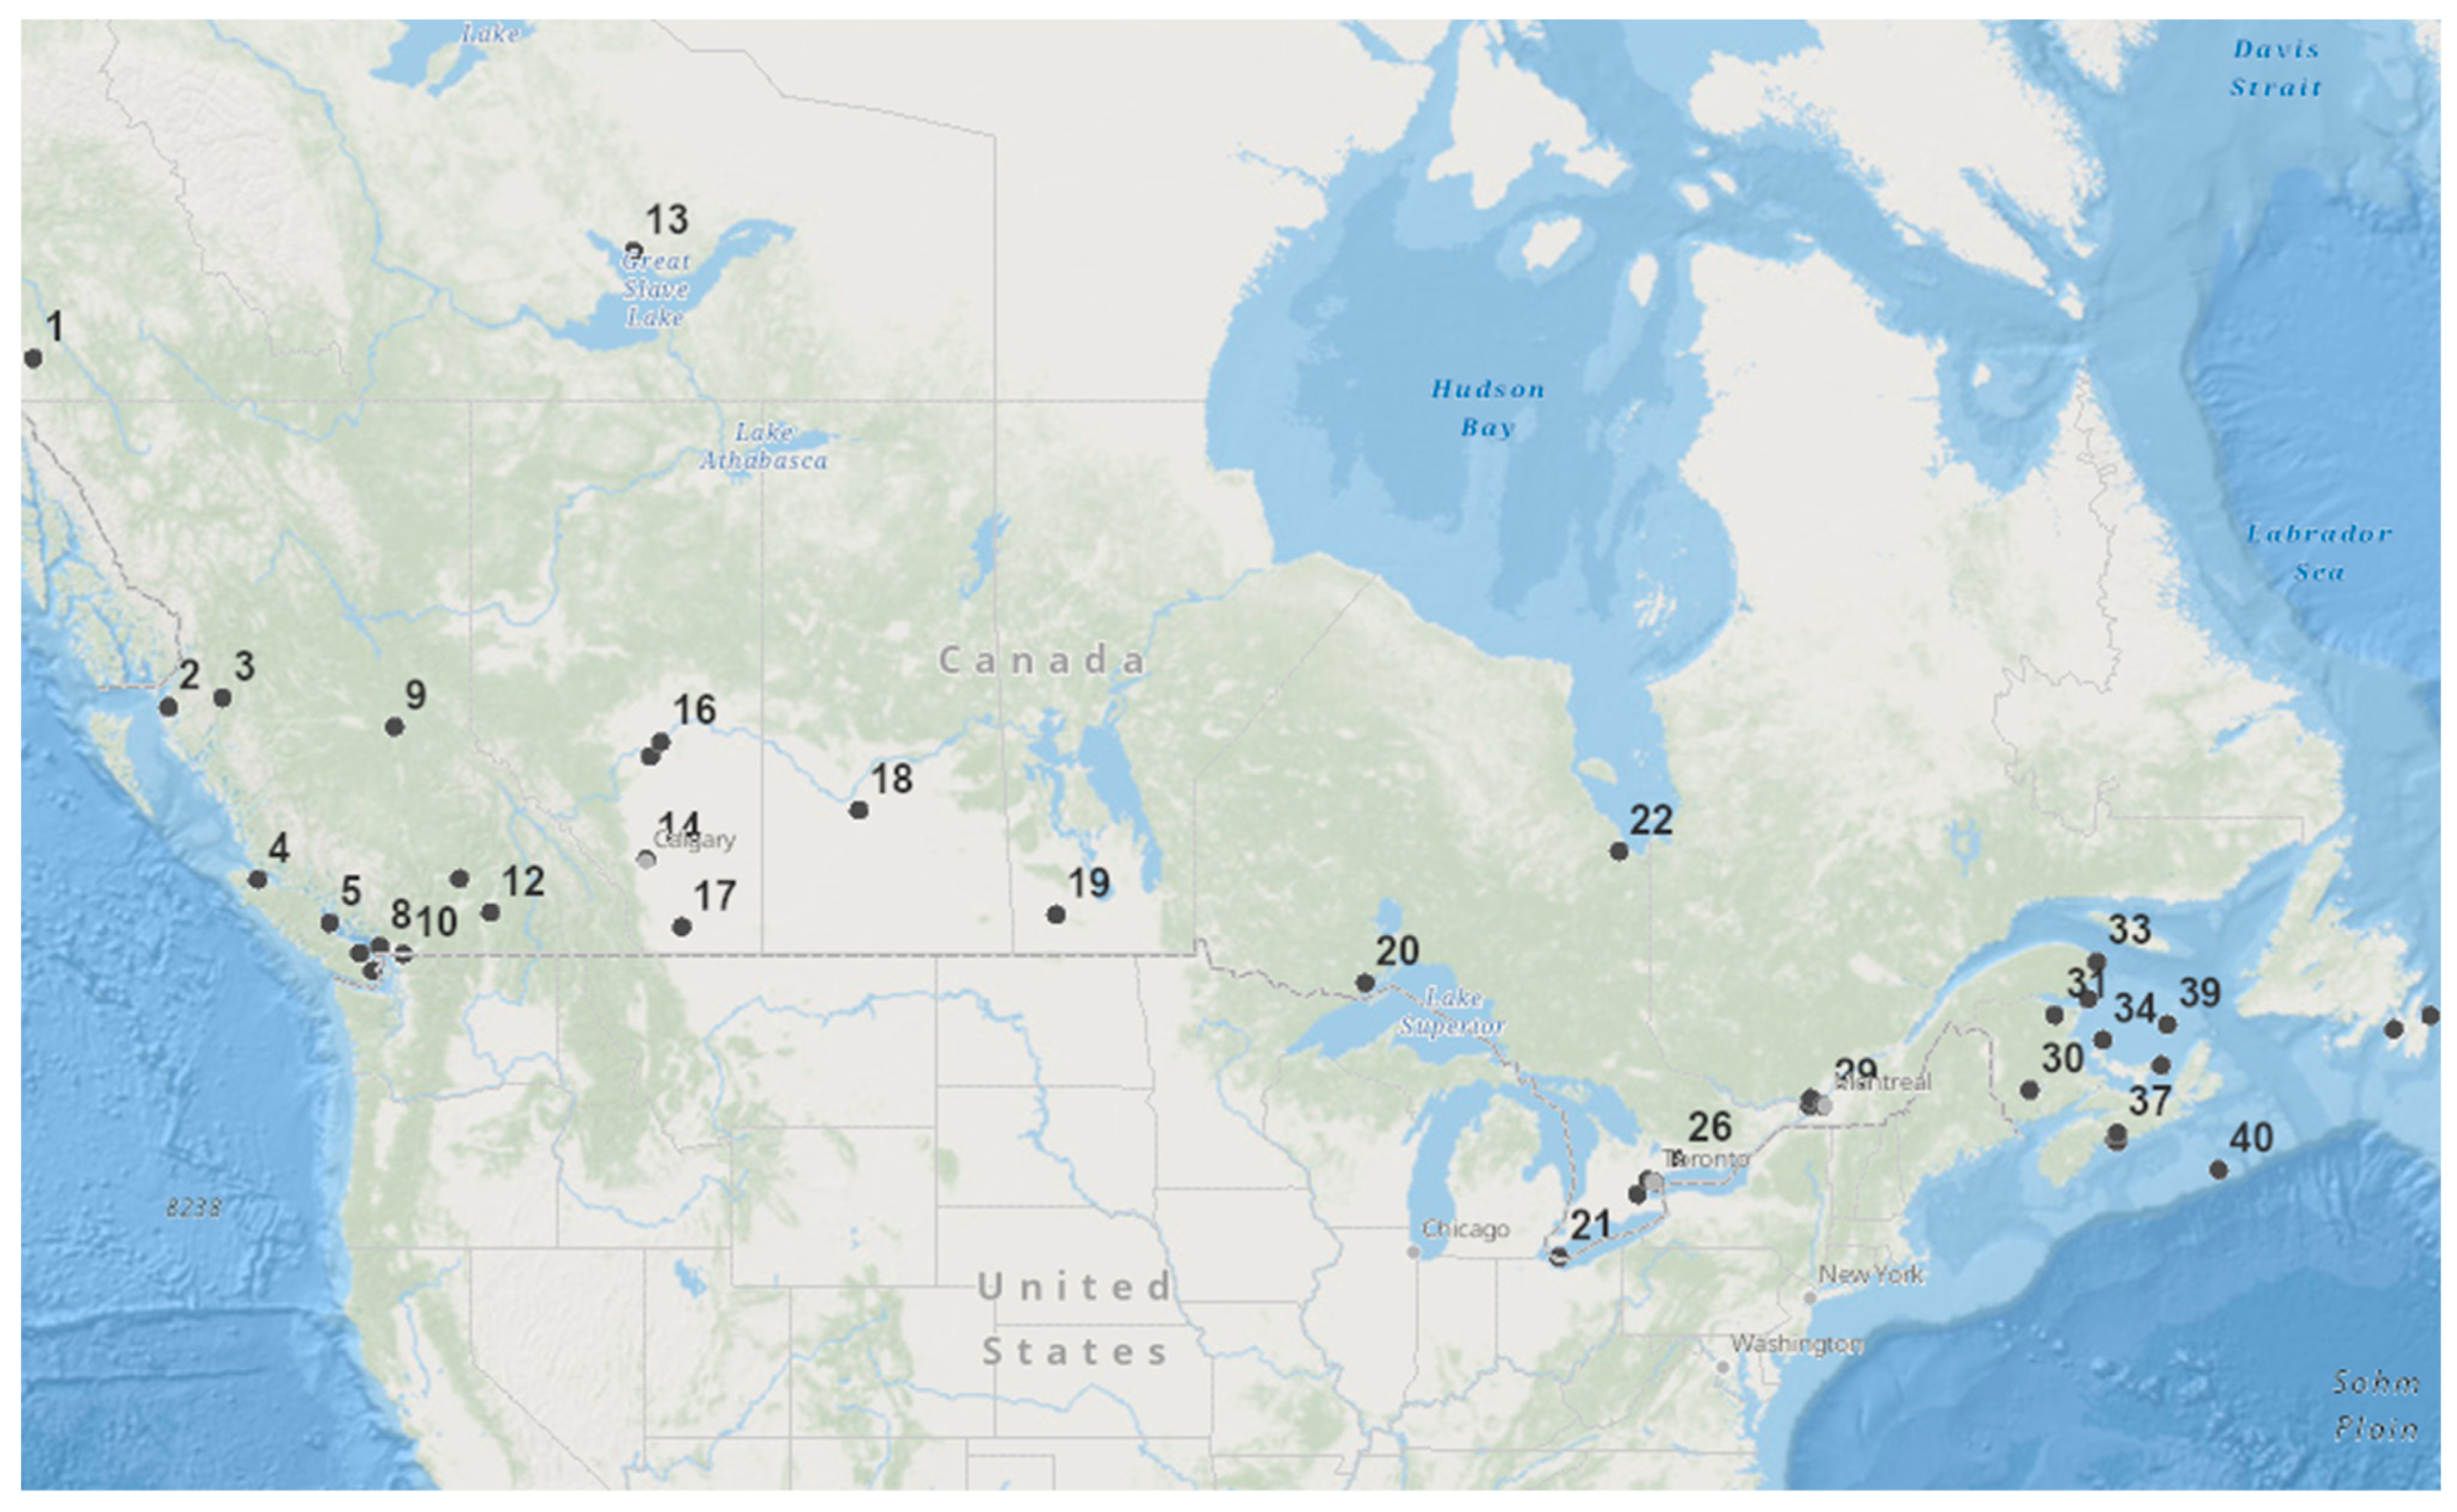
2. Materials and Methods
3. Results
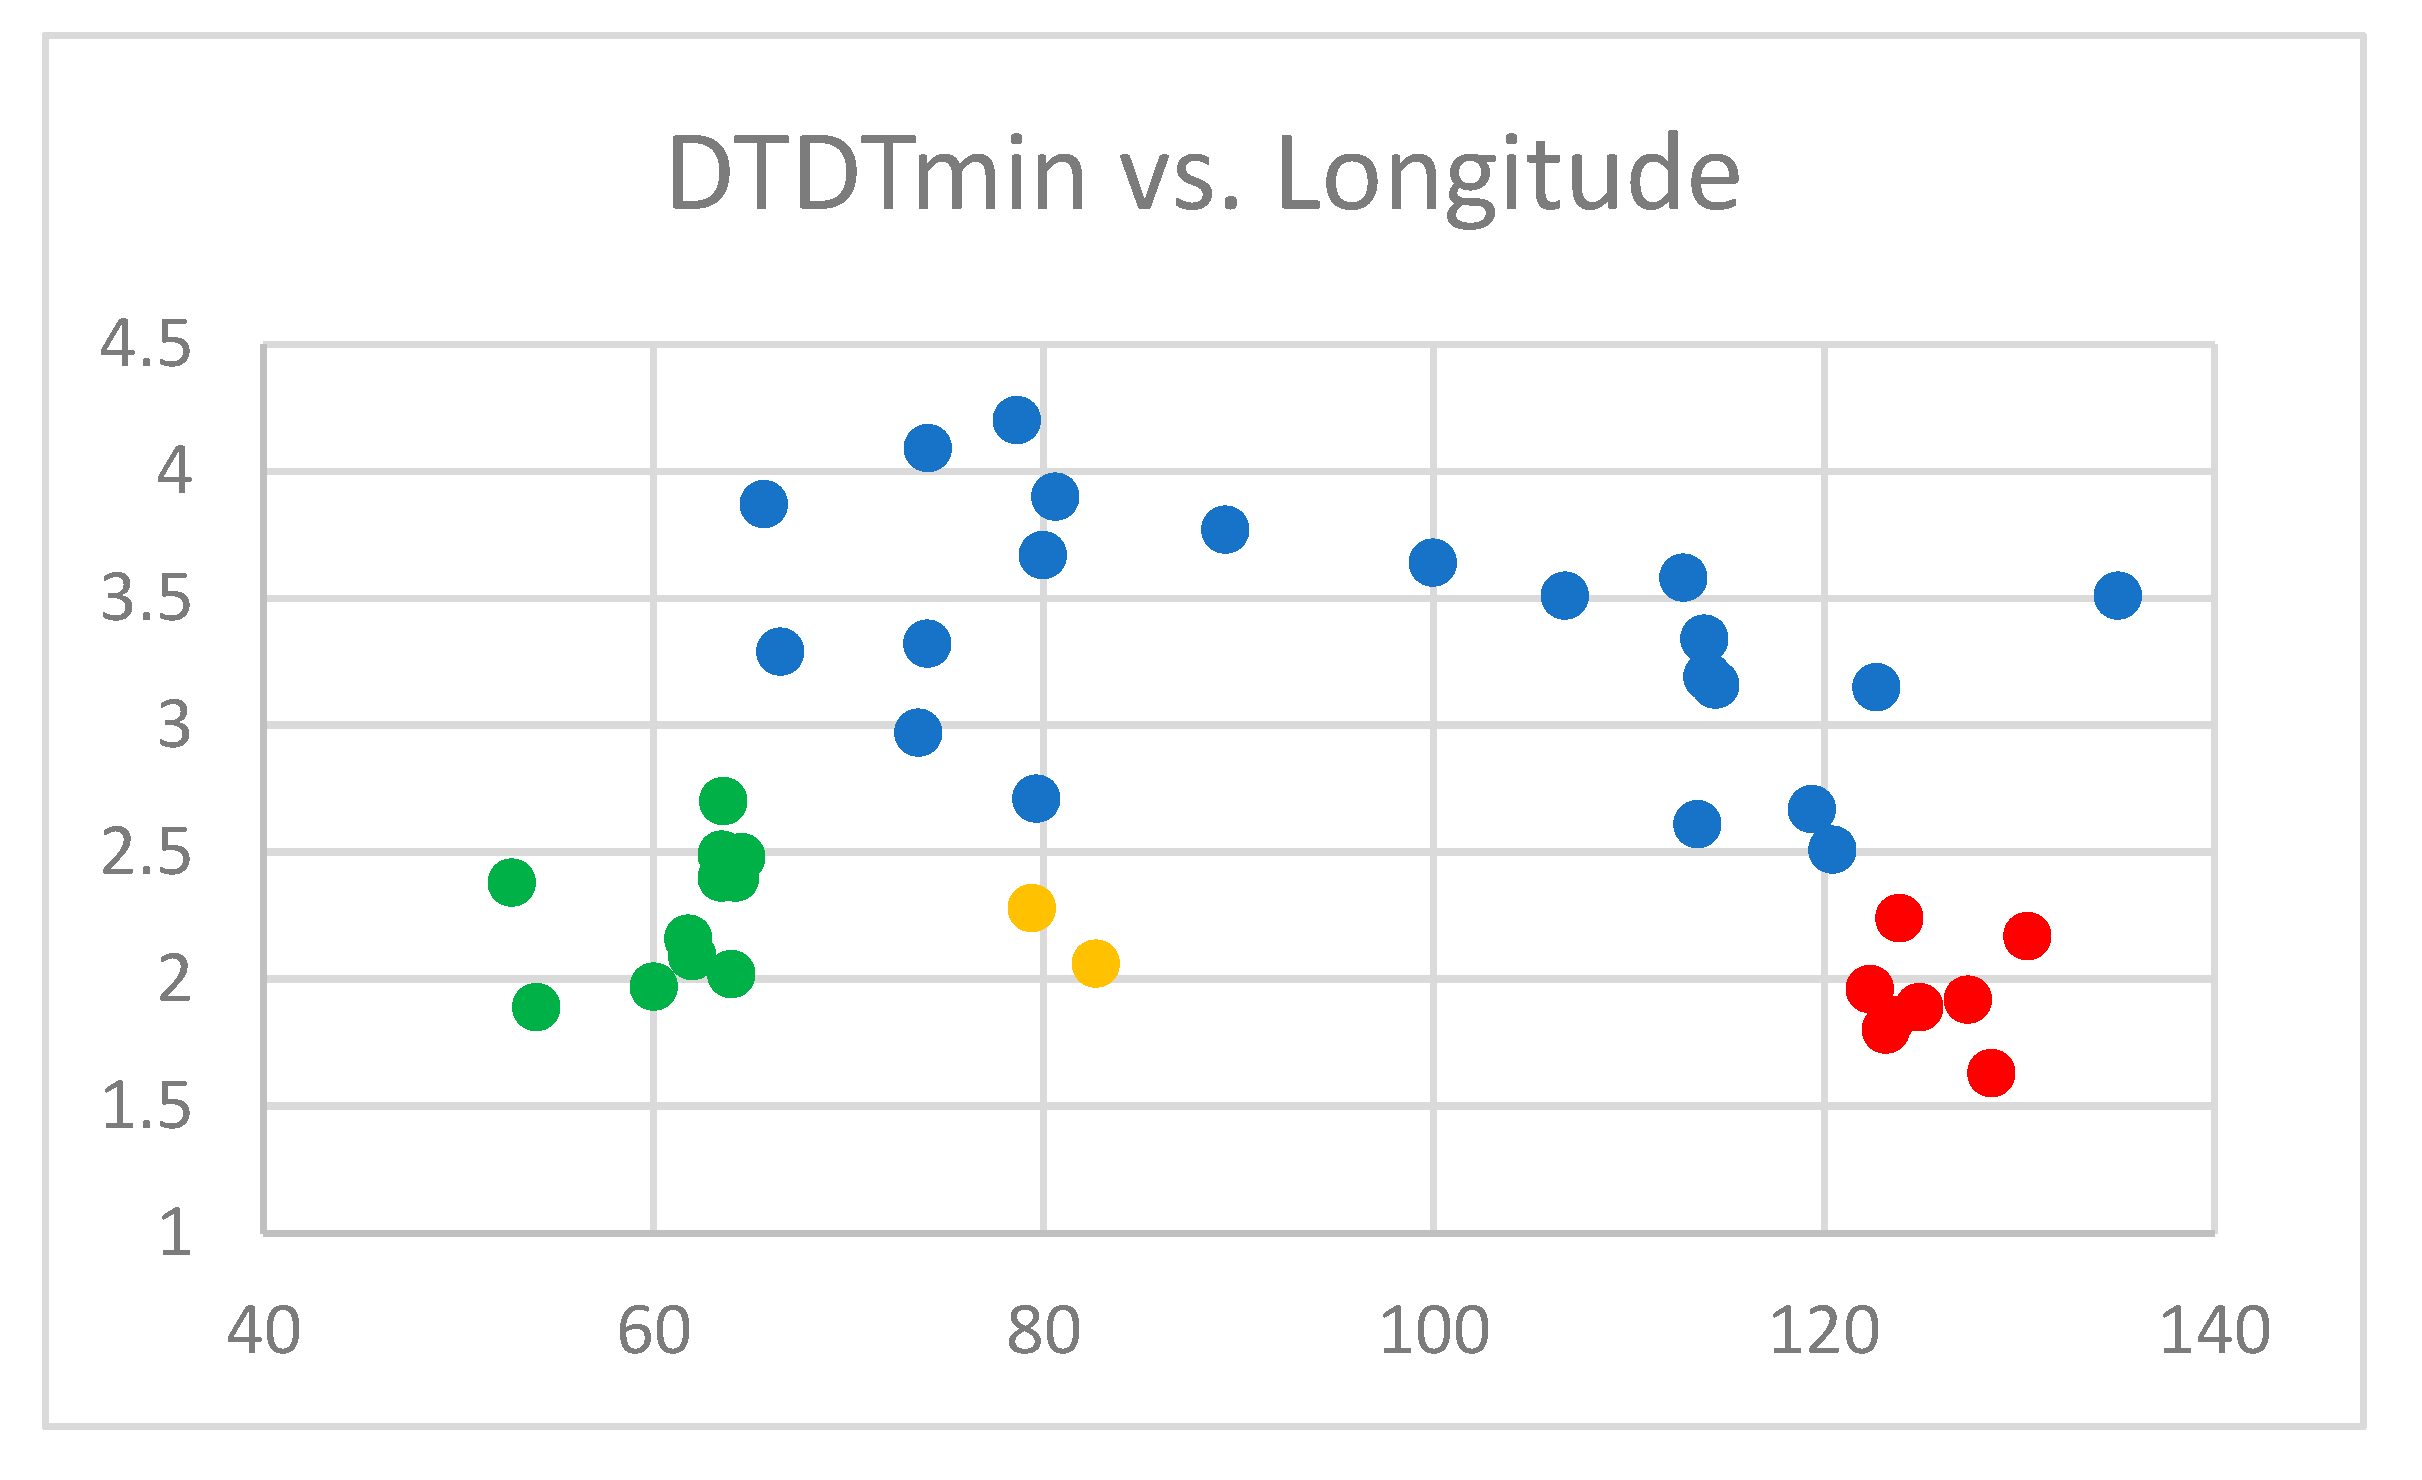
3.1. DTDTmin
3.2. Continentality
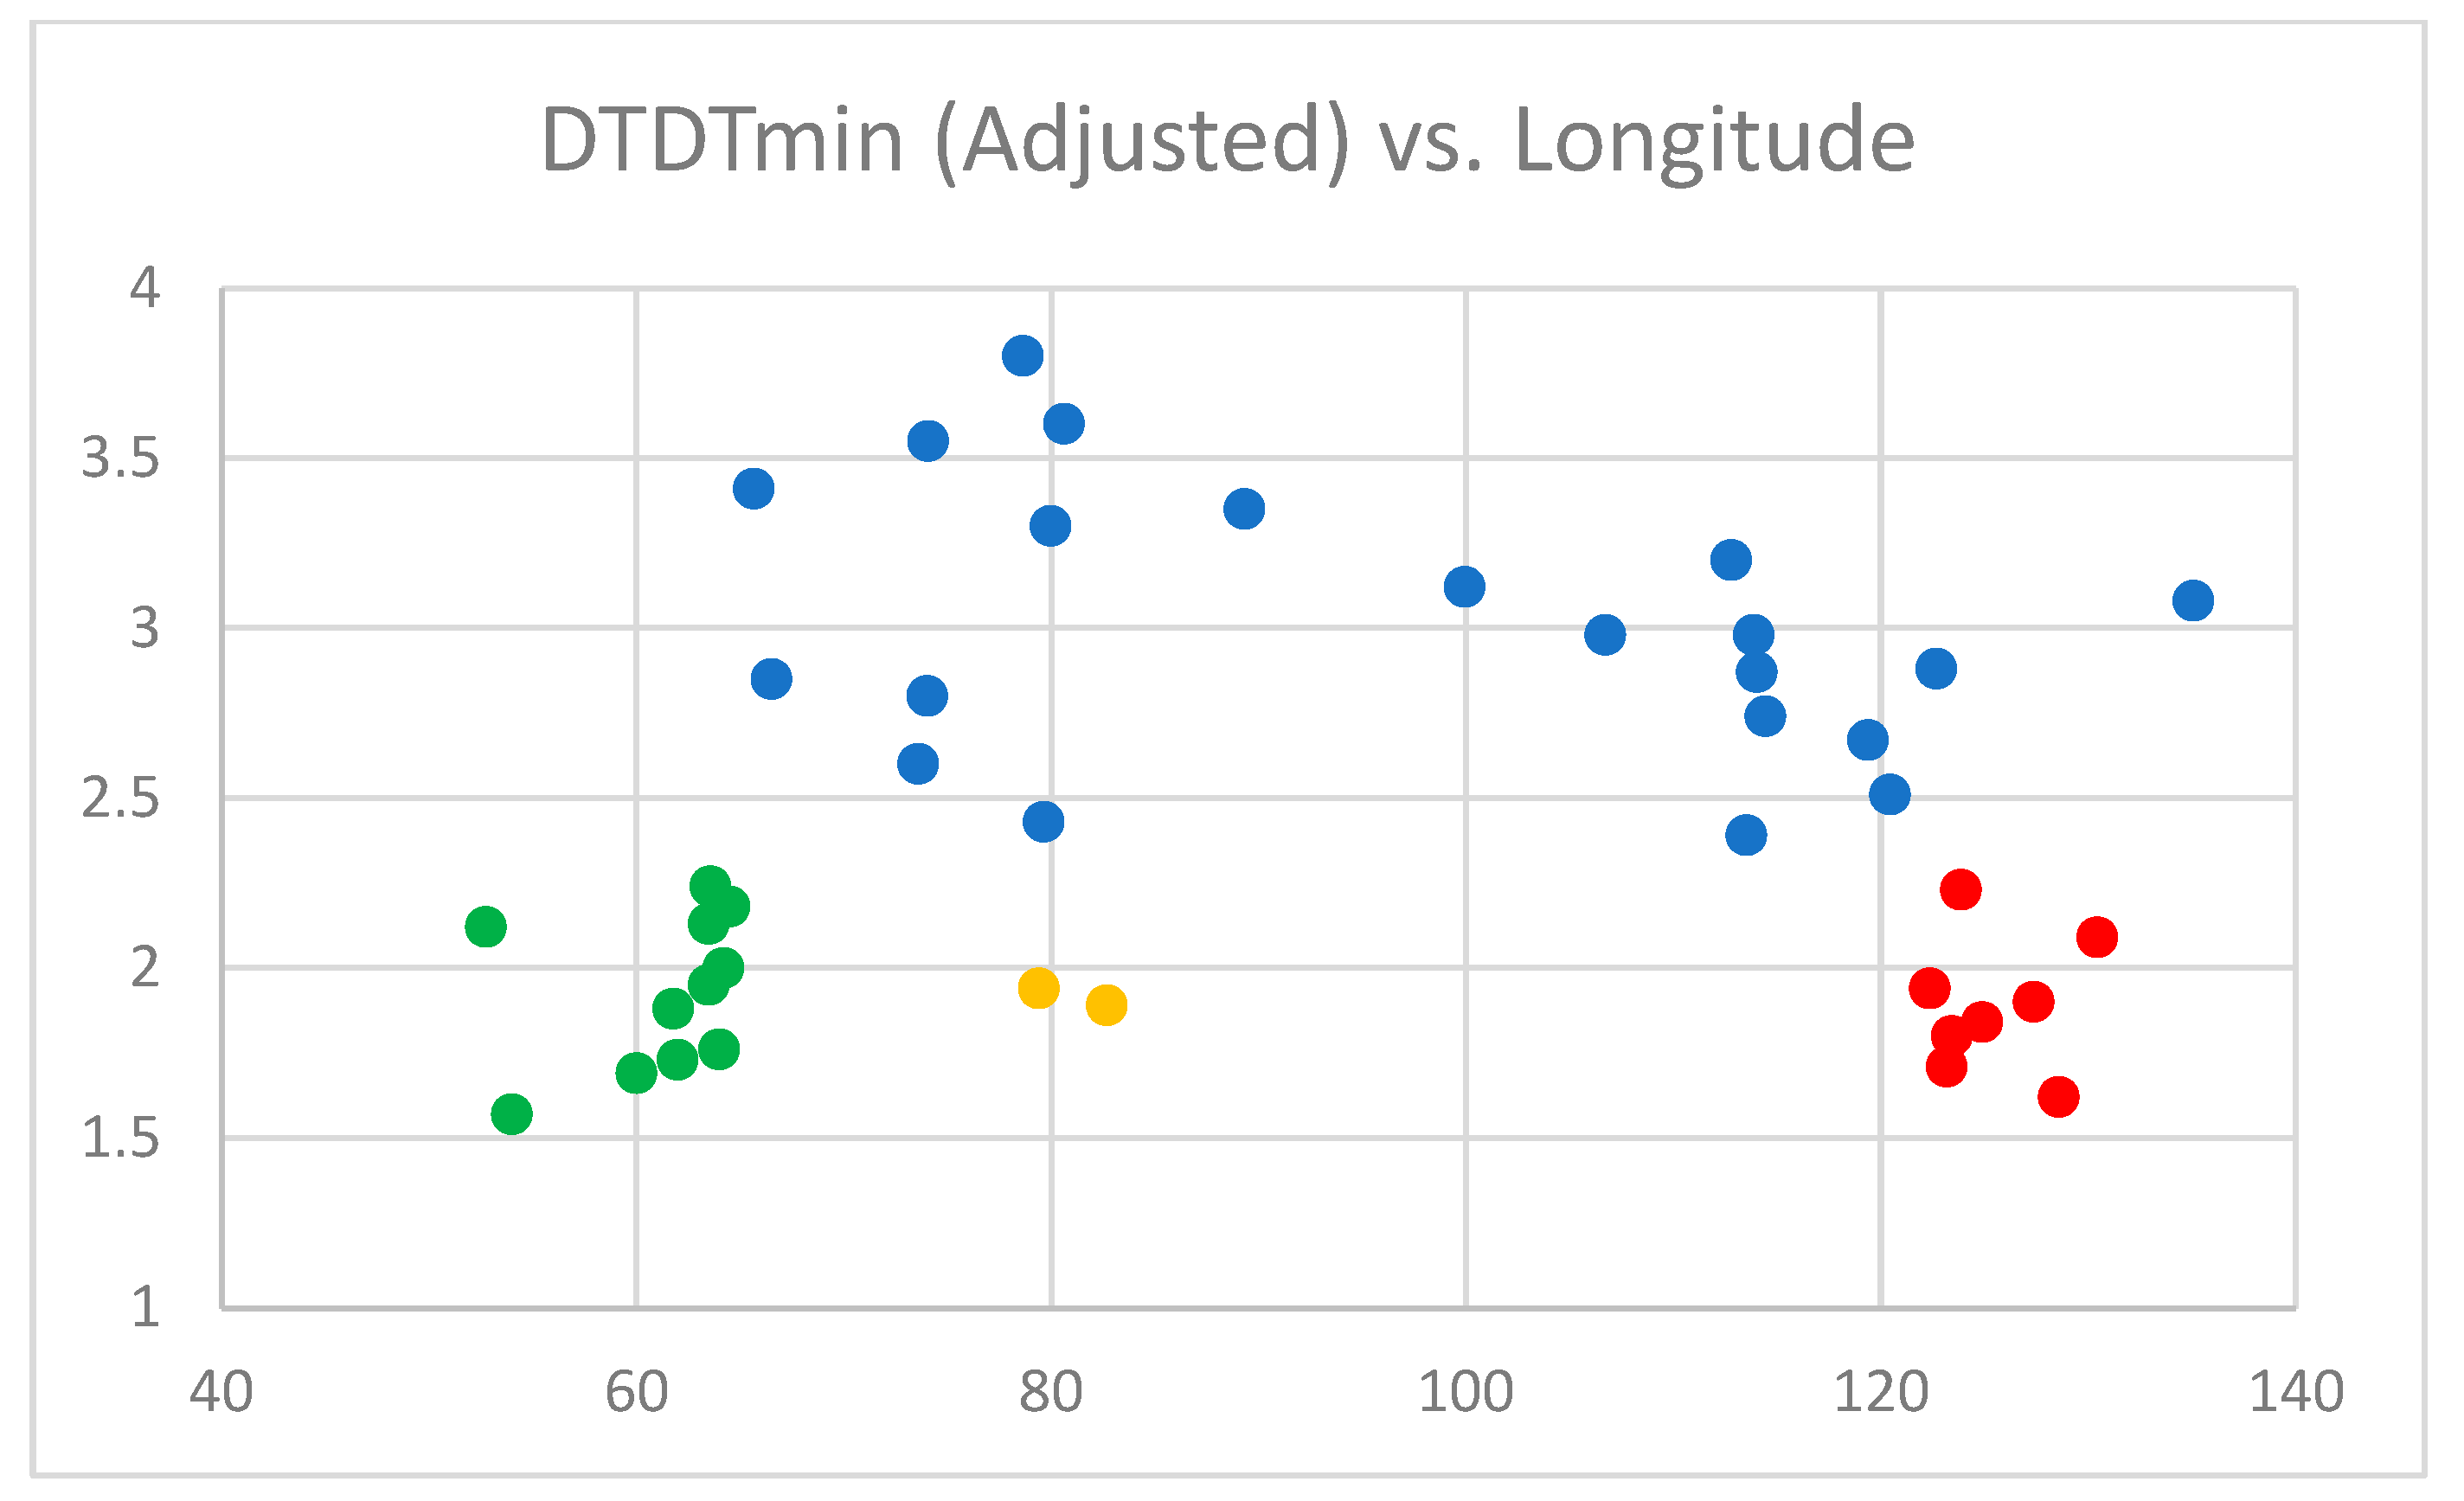
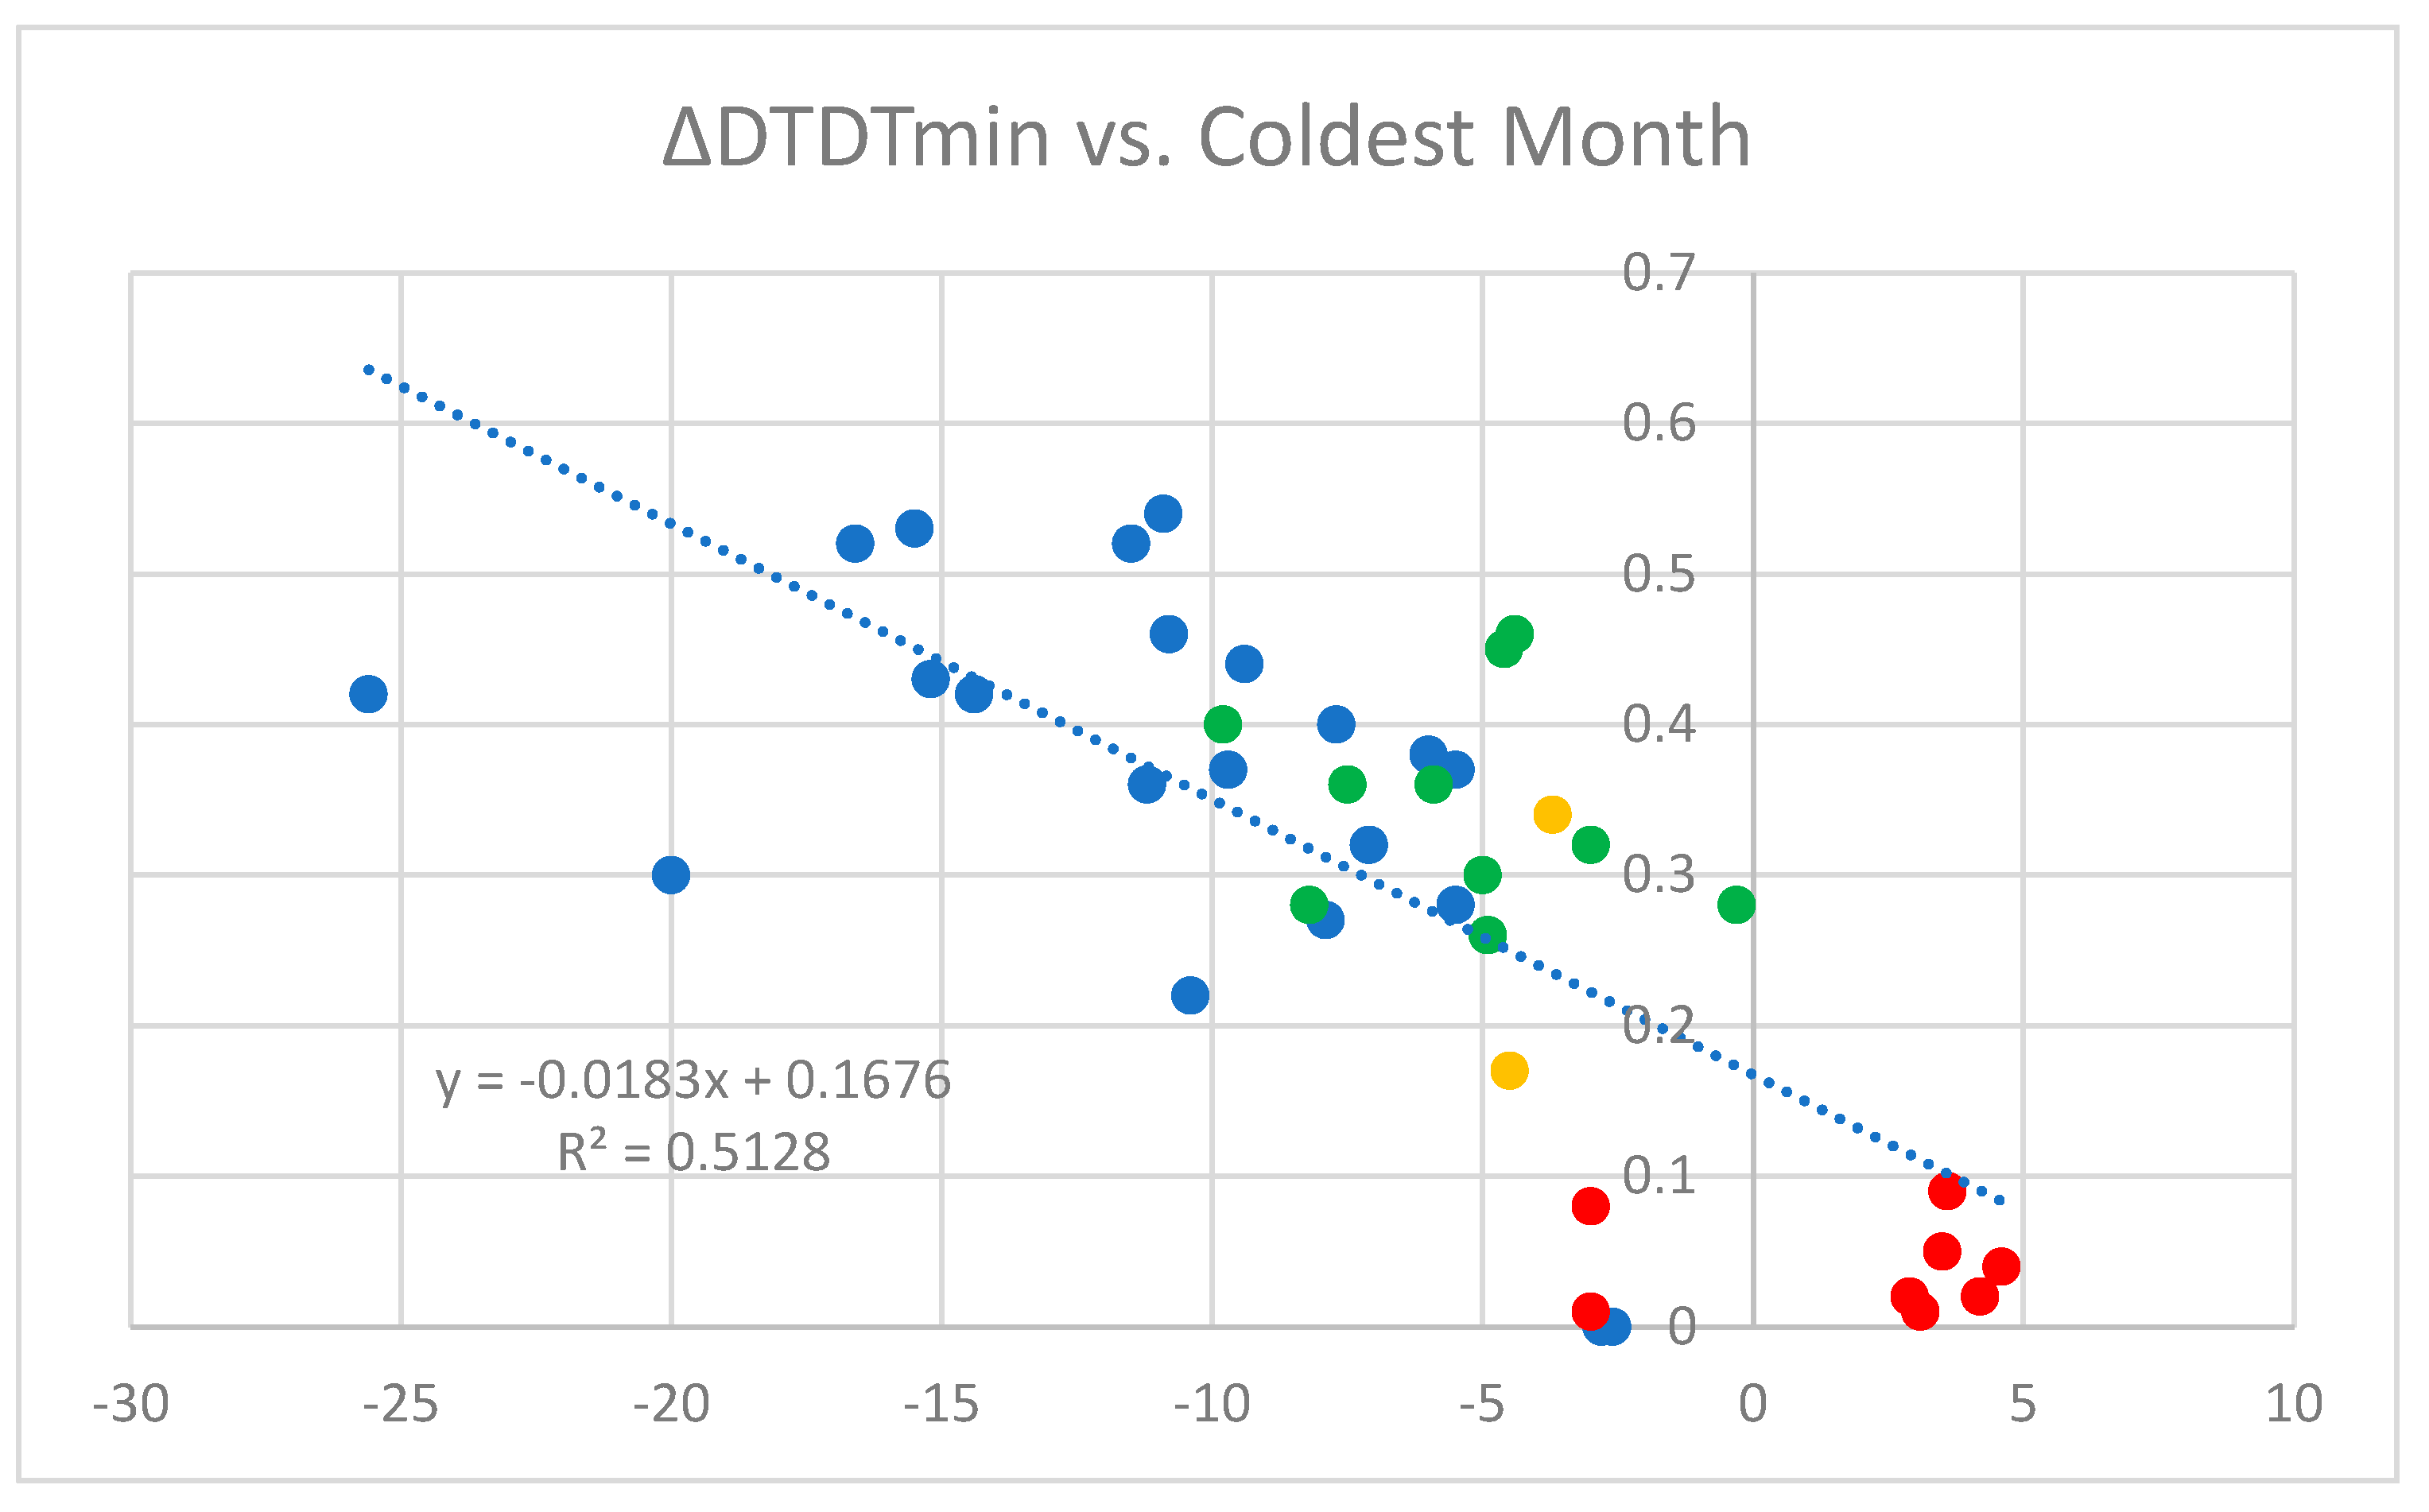
3.3. Winter Correction
4. Discussion
5. Conclusions
Funding
Institutional Review Board Statement
Informed Consent Statement
Data Availability Statement
Conflicts of Interest
References
- Gough, W.A.; Shi, B. Impact of coastalization on day to day temperature variability along China’s east coast. J. Coast. Res. 2021, 36, 451–456. [Google Scholar] [CrossRef]
- Driscoll, D.M.; Yee Fong, J.M. Continentality: A basic climate parameter re-examined. Int. J. Clim. 1992, 12, 185–192. [Google Scholar] [CrossRef]
- Conrad, V. Usual formulas of continentality and their limits of validity. EOS 1946, 27, 663–664. [Google Scholar] [CrossRef]
- Szymanowski, M.; Bednarczyk, P.; Kryza, M.; Nowosad, M. Spatial interpolation of Ewert’s index of continentality in Poland. Pure Appl. Geophys. 2017, 174, 623–642. [Google Scholar] [CrossRef] [Green Version]
- Sakakibara, Y.; Owa, K. Urban–rural temperature differences in coastal cities: Influence of rural sites. Int. J. Climatol. 2005, 25, 811–820. [Google Scholar] [CrossRef]
- Gough, W.A. Theoretical considerations of day-to-day temperature variability applied to Toronto and Calgary, Canada data. Theor. Appl. Climatol. 2008, 94, 97–105. [Google Scholar] [CrossRef]
- Tam, B.Y.; Gough, W.A.; Mohsin, T. The impact of urbanization on day to day temperature variation. Urban Clim. 2015, 12, 1–10. [Google Scholar] [CrossRef]
- Gough, W.A.; Hu, Y. Day to day temperature variability for four urban areas in China. Urban Clim. 2016, 17, 80–88. [Google Scholar] [CrossRef]
- Anderson, C.A.; Gough, W.A.; Mohsin, T. Characterization and estimation of urban heat island at Toronto: Revisiting the choice of rural sites using a measure of day to day variation. Urban Clim. 2018, 25, 187–196. [Google Scholar] [CrossRef]
- Tam, B.Y.; Gough, W.A. Examining Past Temperature Variability in Moosonee, Thunder Bay and Toronto, Ontario, Canada through a Day-to-Day Variability Framework. Theor. Appl. Climatol. 2012, 110, 103–113. [Google Scholar] [CrossRef]
- Gough, W.A.; He, D. Diurnal temperature asymmetries and fog at Churchill, Manitoba. Theor. Appl. Climatol. 2015, 121, 113–119. [Google Scholar] [CrossRef]
- Laidler, G.J.; Ford, J.; Gough, W.A.; Ikummaq, T.; Gagnon, A.S.; Kowal, S. Travelling and hunting in a changing Arctic: Assessing Inuit vulnerability to sea ice change in Igloolik, Nunavut. Clim. Chang. 2009, 94, 363–397. [Google Scholar] [CrossRef]
- Bonacci, O.; Bonacci, D.; Roje-Bonacci, T. Different air temperature changes in continental and Mediterranean regions: A case study from two Croatian stations. Theor. Appl. Climatol. 2021, 145, 1333–1346. [Google Scholar] [CrossRef]
- Tong, X.; Wang, P.; Wu, S.; Luo, M. Urbanization effects on high frequency temperature variability over South China. Urban Clim. 2022, 42, 101092. [Google Scholar] [CrossRef]
- Hewer, M.J.; Gough, W.A. Lake Ontario Ice Coverage: Past, Present and Future. J. Great Lake Res. 2019, 45, 1080–1089. [Google Scholar] [CrossRef]


| Station | Latitude (° N) | Longitude (° W) | Elevation (m) | Years | |
|---|---|---|---|---|---|
| 1 | Whitehorse A, YK | 60.71 | 135.08 | 706.2 | 1998–2007 |
| 2 | Prince Rupert A, BC | 54.29 | 130.44 | 35.4 | 1991–2000 |
| 3 | Terrace A, BC | 54.47 | 128.58 | 217.3 | 1994–2003 |
| 4 | Port Hardy A, BC | 50.68 | 127.37 | 21.6 | 1991–2000 |
| 5 | Comox A, BC | 49.72 | 124.9 | 25.6 | 1991–2000 |
| 6 | Nanaimo A, BC | 49.05 | 123.87 | 28 | 1991–2000 |
| 7 | Victoria A, BC | 48.65 | 123.43 | 19.5 | 1991–2000 |
| 8 | Vancouver Int’l A, BC | 49.2 | 123.18 | 4.3 | 1991–2000 |
| 9 | Prince George A, BC | 53.89 | 122.68 | 691.3 | 1991–2000 |
| 10 | Abbotsford A, BC | 49.03 | 122.36 | 59.1 | 1991–2000 |
| 11 | Kamloops A, BC | 50.7 | 120.44 | 345.3 | 1994–2003 |
| 12 | Kelowna A, BC | 49.96 | 119.38 | 429.5 | 1991–2000 |
| 13 | Yellowknife A, NWT | 62.46 | 114.44 | 205.7 | 1991–2000 |
| 14 | Calgary A, AB | 51.12 | 114.02 | 1084.1 | 1991–2000 |
| 15 | Calmar, AB | 53.29 | 113.87 | 720 | 1991–2000 |
| 16 | Edmonton City Centre | 53.58 | 113.52 | 670.6 | 1994–2003 |
| 17 | Lethbridge A, AB | 49.63 | 112.80 | 928.7 | 1991–2000 |
| 18 | Saskatoon A, SK | 52.17 | 106.72 | 504.1 | 1991–2000 |
| 19 | Brandon A, MB | 49.91 | 99.95 | 409.4 | 1991–2000 |
| 20 | Thunder Bay A, ON | 48.37 | 89.32 | 199.0 | 1991–2000 |
| 21 | Pelee Island, ON | 41.75 | 82.68 | 175.3 | 1961–1970 |
| 22 | Moosonee A, ON | 51.29 | 80.61 | 9.1 | 1996–2005 |
| 23 | Millgrove, ON | 43.32 | 79.97 | 255.1 | 1991–2000 |
| 24 | Toronto Pearson, ON | 43.68 | 79.63 | 173.4 | 1994–2003 |
| 25 | Toronto Island A, ON | 43.63 | 79.40 | 76.5 | 1991–2000 |
| 26 | Janetville, ON | 44.22 | 78.63 | 296.9 | 1991–2000 |
| 27 | Oka, QC | 45.5 | 74.07 | 91.4 | 1991–2000 |
| 28 | Mirabel A, QC | 45.67 | 74.03 | 82.6 | 1991–2000 |
| 29 | Montreal McGill, QC | 45.5 | 73.58 | 56.9 | 1982–1991 |
| 30 | Frederiction, NB | 45.87 | 66.51 | 20.7 | 1991–2000 |
| 31 | Bathurst A, NB | 47.63 | 65.65 | 58.8 | 1993–2003 |
| 32 | Miscou Island, NB | 48.01 | 64.49 | 4.0 | 1995–2004 |
| 33 | Cap des Rosiers, QC | 48.85 | 64.20 | 15.0 | 1991–2000 |
| 34 | North Cape, PEI | 47.06 | 64.00 | 7.6 | 2003–2012 |
| 35 | Halifax Citadel, NS | 44.65 | 63.58 | 70.1 | 1991–2000 |
| 36 | Shearwater A, NS | 44.63 | 63.50 | 44.0 | 1991–2000 |
| 37 | Halifax Stanfield A, NS | 44.83 | 63.50 | 145.5 | 1991–2000 |
| 38 | East Point, PEI | 46.46 | 61.99 | 7.7 | 1995–2004 |
| 39 | Iles-de-la-Madeleine A | 47.42 | 61.78 | 10.7 | 1991–2000 |
| 40 | Sable Island, NS | 43.93 | 60.01 | 5.0 | 1991–2000 |
| 41 | Argentia A, NL | 47.3 | 54.00 | 15.5 | 1976–1985 |
| 42 | St John’s A, NL | 47.62 | 52.74 | 140.5 | 1991–2000 |
| Station | DTDTmin (°C) | DTDTmin A (°C) | Warm | Cold | Cont | ContA | |
|---|---|---|---|---|---|---|---|
| 1 | Whitehorse A, YK | 3.51 | 3.08 | 14.3 | −15.2 | 29.50 | 33.83 |
| 2 | Prince Rupert A, BC | 2.17 | 2.09 | 13.8 | −3.0 | 11.40 | 14.04 |
| 3 | Terrace A, BC | 1.63 | 1.62 | 16.5 | −3.0 | 19.50 | 23.97 |
| 4 | Port Hardy A, BC | 1.92 | 1.90 | 14.4 | 4.2 | 10.20 | 13.19 |
| 5 | Comox A, BC | 1.89 | 1.84 | 18.0 | 3.5 | 14.50 | 19.01 |
| 6 | Nanaimo A, BC | 2.24 | 2.23 | 18.2 | 3.1 | 15.10 | 20.00 |
| 7 | Victoria A, BC | 1.84 | 1.80 | 16.9 | 4.6 | 12.30 | 16.39 |
| 8 | Vancouver Int’l A, BC | 1.80 | 1.71 | 18.0 | 3.6 | 14.40 | 19.03 |
| 9 | Prince George A, BC | 3.15 | 2.88 | 15.8 | −7.9 | 23.70 | 29.35 |
| 10 | Abbotsford A, BC | 1.96 | 1.94 | 18.2 | 2.9 | 15.30 | 20.27 |
| 11 | Kamloops A, BC | 2.51 | 2.51 | 21.5 | −2.8 | 24.30 | 31.41 |
| 12 | Kelowna A, BC | 2.67 | 2.67 | 19.5 | −2.6 | 22.10 | 28.33 |
| 13 | Yellowknife A, NWT | 3.16 | 2.74 | 17.0 | −25.6 | 42.60 | 48.06 |
| 14 | Calgary A, AB | 3.19 | 2.87 | 16.6 | −7.1 | 23.60 | 30.33 |
| 15 | Calmar, AB | 3.34 | 2.98 | 16.6 | −11.2 | 27.80 | 34.69 |
| 16 | Edmonton City Centre | 2.61 | 2.39 | 17.7 | −10.4 | 28.10 | 34.93 |
| 17 | Lethbridge A, AB | 3.58 | 3.20 | 18.2 | −6.0 | 24.20 | 31.78 |
| 18 | Saskatoon A, SK | 3.51 | 2.98 | 18.5 | −15.5 | 34.00 | 43.06 |
| 19 | Brandon A, MB | 3.64 | 3.12 | 18.5 | −16.6 | 35.10 | 45.90 |
| 20 | Thunder Bay A, ON | 3.77 | 3.35 | 17.6 | −14.4 | 32.00 | 42.83 |
| 21 | Pelee Island, ON | 2.06 | 1.89 | 22.3 | −4.5 | 26.80 | 40.26 |
| 22 | Moosonee A, ON | 3.90 | 3.60 | 15.8 | −20.0 | 35.80 | 45.90 |
| 23 | Millgrove, ON | 3.67 | 3.30 | 20.8 | −5.5 | 26.30 | 38.35 |
| 24 | Toronto Pearson A, ON | 2.71 | 2.43 | 21.5 | −5.5 | 27.00 | 39.11 |
| 25 | Toronto Island A, ON | 2.28 | 1.94 | 22.3 | −3.7 | 26.00 | 37.70 |
| 26 | Janetville, ON | 4.20 | 3.80 | 20.1 | −7.7 | 27.80 | 39.88 |
| 27 | Oka, QC | 4.09 | 3.55 | 20.3 | −10.9 | 31.20 | 43.76 |
| 28 | Mirabel A, QC | 3.32 | 2.80 | 19.8 | −11.5 | 31.30 | 43.77 |
| 29 | Montreal McGill, QC | 2.97 | 2.60 | 21.2 | −9.7 | 30.90 | 43.34 |
| 30 | Frederiction, NB | 3.29 | 2.85 | 19.3 | −9.4 | 28.70 | 40.00 |
| 31 | Bathurst A, NB | 3.87 | 3.41 | 19.1 | −10.8 | 29.90 | 40.49 |
| 32 | Miscou Island, NB | 2.48 | 2.18 | 21.0 | −5.0 | 26.0 | 34.99 |
| 33 | Cap des Rosiers, QC | 2.40 | 2.00 | 16.2 | −9.8 | 26.0 | 34.54 |
| 34 | North Cape, PEI | 2.02 | 1.76 | N/A | N/A | ||
| 35 | Halifax Citadel, NS | 2.70 | 2.24 | 18.9 | −4.4 | 23.3 | 33.17 |
| 36 | Shearwater A, NS | 2.40 | 1.95 | 18.5 | −4.6 | 23.1 | 32.89 |
| 37 | Halifax Stanfield A, NS | 2.49 | 2.13 | 18.8 | −5.9 | 24.7 | 35.05 |
| 38 | East Point, PEI | 2.09 | 1.73 | 19.5 | −7.5 | 27.0 | 37.26 |
| 39 | Iles-de-la-Madeleine A | 2.16 | 1.88 | 17.8 | −8.2 | 26.0 | 35.32 |
| 40 | Sable Island, NS | 1.97 | 1.69 | 17.8 | −0.3 | 18.1 | 26.10 |
| 41 | Argentia A, NL | 1.89 | 1.57 | 16.0 | −3.0 | 19.0 | 25.86 |
| 42 | St John’s A, NL | 2.38 | 2.12 | 16.1 | −4.9 | 21.0 | 28.44 |
| DTDTmin | DTDTmin A | Cont | Cont A | ||
|---|---|---|---|---|---|
| Coastal | Mean | 2.13 | 1.91 | 19.99 | 27.38 |
| Standard Deviation | 0.27 | 0.20 | 5.73 | 8.66 | |
| Signal to Noise | 7.79 | 9.69 | 3.49 | 3.16 | |
| Inland | Mean | 3.36 | 3.01 | 29.33 | 38.53 |
| Standard Deviation | 0.48 | 0.39 | 4.90 | 6.03 | |
| Signal to Noise | 6.95 | 7.62 | 5.99 | 6.39 |
Publisher’s Note: MDPI stays neutral with regard to jurisdictional claims in published maps and institutional affiliations. |
© 2022 by the author. Licensee MDPI, Basel, Switzerland. This article is an open access article distributed under the terms and conditions of the Creative Commons Attribution (CC BY) license (https://creativecommons.org/licenses/by/4.0/).
Share and Cite
Gough, W.A. Thermal Metrics to Identify Canadian Coastal Environments. Coasts 2022, 2, 93-101. https://doi.org/10.3390/coasts2020006
Gough WA. Thermal Metrics to Identify Canadian Coastal Environments. Coasts. 2022; 2(2):93-101. https://doi.org/10.3390/coasts2020006
Chicago/Turabian StyleGough, William A. 2022. "Thermal Metrics to Identify Canadian Coastal Environments" Coasts 2, no. 2: 93-101. https://doi.org/10.3390/coasts2020006
APA StyleGough, W. A. (2022). Thermal Metrics to Identify Canadian Coastal Environments. Coasts, 2(2), 93-101. https://doi.org/10.3390/coasts2020006