
Geomorphic Response of the Georgia Bight Coastal Zone to Accelerating Sea Level Rise, Southeastern USA


1
Institute of Environment, Florida International University, 11200 SW 8th Street, Miami, FL 33199, USA
2
Institute of Environment, Department of Earth and Environment, Florida International University, 11200 SW 8th Street, Miami, FL 33199, USA
*
Author to whom correspondence should be addressed.
Coasts 2024, 4(1), 1-20; https://doi.org/10.3390/coasts4010001
Submission received: 6 November 2023
/
Revised: 12 December 2023
/
Accepted: 19 December 2023
/
Published: 22 December 2023
Abstract
:Synthesis of geologic and chronologic data generated from Holocene sedimentary sequences recovered along the inner continental shelf, shoreface, and modern coastal zone of the Georgia Bight reveal a synchronous sequence of paleoenvironmental events that occurred in response to rate of sea level rise tipping points. During the early Holocene (11.7–8.2 cal kyr BP), the paleoshoreline was overstepped and submerged by rapidly rising seas that averaged ~5 mm yr−1. Rates of rise during the middle Holocene (8.2–4.2 cal kyr BP) averaged ~2 mm yr−1 and this deceleration resulted in the formation of coastal environments and sedimentary sequences that were subsequently reworked as the shoreface continued its landward and upward migration. The modern coastal zone emerged commensurate with the late Holocene (4.2–0 cal kyr BP), when the rate of sea level rise averaged <1 mm yr−1. Analysis of water level data collected at six NOAA tide gauge stations located along the Georgia Bight coast indicates the rate of relative sea level rise has increased from a historical average of 3.6 ± 0.2 mm yr−1 (<1972 to 2022) to 6.6 ± 0.8 (1993 to 2022) and during the 21st century it has averaged 9.8 ± 0.3 mm yr−1 (2003 to 2022). The current rate of sea level rise is nearly double the early Holocene rate of rise. Based upon a novel application of the principle of uniformitarianism (i.e., the past is the key to the future), the likely geomorphic trajectory of the Georgia Bight coastal zone under conditions of 21st century accelerating sea level rise will be one of increasing instability (e.g., coastal erosion) and flooding (e.g., overwash, breaching). Evidence of an emerging instability within the coastal zone has been previously reported throughout the region and supports the trajectory of geomorphic change proposed herein. This will ultimately result in the submergence of existing landscapes and replacement by estuarine and marine environments, which may hasten in pace and scale given the current rate of sea level rise is expected to continue accelerating throughout this century. These findings have not been previously reported and should be considered by coastal practitioners responsible for conceptualizing risk, as well as the formulation and implementation of adaptation action plans designed to mitigate threats to the built and natural environment induced by climate change.
1. Introduction
This investigation was designed to assist coastal practitioners, responsible for the formulation and implementation of climate change adaptation action plans, with a scientific basis for envisioning future conditions by answering the following question—what is the probable geomorphic response of the Georgia Bight coastal zone to accelerating sea level rise during the 21st century? The projections are based on a novel application of the principle of uniformitarianism; the past is the key to the future. The work began by conducting a regional analysis of geological investigations previously performed on the modern coastal zone and inner continental shelf to generate a unified model that associated widespread and synchronous changes in sedimentology, stratigraphy, and paleoenvironment with contemporaneous rates of sea level rise throughout the Holocene Epoch. Three distinct facies transitions are recognized, each corresponding to a substantial deceleration in the rate of sea level rise. These “tipping points” were compared with historical and recent rates of sea level rise observed at six NOAA tide gage stations located within the study domain to inform projections of geomorphic change likely to unfold along the Georgia Bight to the year 2050. While the findings of this study are likely applicable beyond mid-century, projections extending only a few decades into the future present less ambiguity to coastal zone managers, decision makers, and other practitioners [1].
1.1. Background
The origin of emergent marine and coastal strata observed globally along modern shorelines was the subject of considerable debate through the mid-20th century. Some argued a novel mechanism of long-term changes in mean sea level, while others preferred to invoke the historically accepted endogenous process of tectonism [2,3]. However, this debate was promptly resolved upon the advent of the radiocarbon method as a reliable means of age determination (c.f., [4]). When used in tandem with bathymetric, sedimentologic, and stratigraphic data obtained on the continental shelves of the Gulf of Mexico [5,6,7,8] and the western Atlantic Ocean [9,10,11,12,13,14,15], investigators presented unequivocal evidence that a sea level rise of more than 100 m had occurred during the late Quaternary as a result of post-glacial melting.
Over the next several decades geologists, working along the eastern seaboard of the continental United States, often coupled their observations of sedimentology, stratigraphy, and geochronology with contemporaneous Holocene sea level rise to generate paleoenvironmental models of coastal evolution. For example, the presence of a thin and discontinuous sand sheet on the inner continental shelf was attributed to the reworking of older strata in response to a relatively rapid rise in sea level during early to middle Holocene [16,17,18,19,20]. Beneath modern coastal environments (e.g., barrier island, back barrier estuary, or bay), investigations often reported the presence of a transgressive facies sequence consisting of Pleistocene fluvial deposits overlain by estuarine muds and capped by barrier island sands (e.g., overwash, flood tidal shoals, aeolian) [21,22,23,24]. This sequence was interpreted to have formed by the deposition and preservation of coastal sediments during the middle to late Holocene in response to a relatively slow rate of sea level rise. Located between the inner shelf sand sheet and modern coastal zone is the shoreface and early workers (cf, [23]) typically reported the presence of a transgressive facies sequence that was partially (nearshore) to completely reworked (offshore) by the surf zone and associated ravinement surface as it migrated both landward and upward in response to Holocene sea level rise. These observations and those of the many studies that followed formed the database and context from which the findings of this study are grounded.
1.2. Study Area
This study focused on an area of the southeast United States known as the Georgia Bight (Figure 1) and was selected to conform with the boundaries of previous regional assessments [24,25]. It extends from Cape Lookout, North Carolina, southward to Fernandina Beach, Florida, and seaward across the inner continental shelf to a depth of ~25 m. This depth roughly coincides with the elevation of sea level at the onset of the Holocene Epoch (~11.7 cal kyr BP). The study area is subdivided into four coastal sectors: southern North Carolina, northern South Carolina, southern South Carolina, and the Georgia-Florida border. Sector boundaries roughly coincide with shoreline compartments II–V of Hayes [25] and are based upon prominent geomorphic features and physical oceanographic conditions (Table 1).
2. Sea Level Rise
Since the last glacial maximum, the globally averaged eustatic sea level has undergone a rise of at least 120 m, with the rate of ascent decelerating during the Holocene Epoch [26,27,28]. Submergence records indicate that the initial transgression was marked by several meltwater pulses [29,30], characterized by extremely rapid rises exceeding 40 mm yr−1 [31,32,33,34], until ~11 cal kyr BP or the commencement of the Holocene Epoch. Subsequently, the long-term (spanning centuries) average trajectory of relative sea level rise within the study area is conventionally represented as a smooth curve illustrating a deceleration to the present [35,36,37] (Figure 2). The deceleration is attributed to a reduction of meltwater input and diminishing response of the Earth’s mantle to glacial-isostatic adjustment [27,28,29]. In addition to global eustatic, steric, and glacial-isostatic contributions to relative sea level rise, the submergence history of the Georgia Bight has also been influenced by two regional neotectonic features; the Cape Fear Arch and Ocala Uplift (Figure 1) [25,30]. Cape Fear Arch uplift is estimated to be 0.24 mm yr−1 [31]. Vertical motion associated the Ocala Uplift appears to be <0.01 mm yr−1 [32] and thus its contribution to relative sea level rise (hereafter sea level rise) during the Holocene Epoch is considered negligible for the purposes of this study.
Three regionally relevant reconstructions were used in this study to characterize sea level rise during the Holocene marine transgression [33,34,35] (Figure 2, Table 2). While differences between them are obvious and attributed to the phenomena described previously, the synchronous deceleration is apparent. When paired with the stratigraphical subdivisions (aka stages) of the Holocene Epoch [36], three distinct intervals of decelerating submergence are evident: (1) an interval of rapid rise during the early Holocene (11.7 to 8.2 cal kyr BP) that averaged ~5.2 mm yr−1, (2) an intermediate rate of rise averaging ~2.4 mm yr−1 that occurred during the middle Holocene (8.2 to 4.2 cal kyr BP), and (3) a relatively slow late Holocene rise that averaged ~0.8 mm yr−1. These trends are consistent with the results of other sea level studies conducted along the Atlantic coast of the United States [29,37,38].
3. Materials and Methods
3.1. Response to Holocene Sea Level Rise
The methodological framework employed in this investigation is rooted in the seminal contributions of Fischer (1961) and Curray (1964) [5,9]. They recognized that the stratigraphic record of marine transgressions and regressions is influenced by two fundamental factors: (a) fluctuations in sea level and (b) the net sedimentation rate. For instance, shoreline transgression occurs when the rate of sea level rise is faster than the rate of net sedimentation (i.e., sediment deficit). In the context of the Holocene marine transgression along the Georgia Bight coast, the rate of sea level rise was not constant but rather exhibited a decelerating trend over time. This deceleration coincided with changing patterns of sedimentation and stratigraphy. Consequently, if variations in the rate of Holocene sea level rise correspond with regionally significant shifts in paleoenvironmental evolution, these rates or tipping points can be used to model the anticipated response or geomorphic trajectory of the modern coastal zone to accelerating 21st century sea level rise.
The project began by establishing a regional conceptual framework of coastal evolution. This was accomplished by synthesizing the findings of previously published studies that (a) were executed along the contemporary coastline and/or inner continental shelf, (b) specifically focused on the Holocene stratigraphic sequence, (c) provided detailed characterizations of sedimentology, stratigraphy, and geochronology, and (d) incorporated paleoenvironmental descriptions pertaining to coastal evolution within the framework of concurrent sea level fluctuations. The evolution framework was established in two steps. First, a comparison of the aggregates studies conducted within each of the coastal sectors was performed to identify shared paleo-environmental events as evidenced in the stratigraphic record (e.g., deposition of a transgressive sand sheet). The geochronologic boundaries (e.g., start, end) of those shared events were then used to determine synchroneity within each sector. Once the initial, sector-based evaluation was completed, a between-sector comparison was undertaken to generate a regional, comprehensive understanding of how the Georgia Bight coastal zone evolved under conditions of Holocene sea level rise.
The geochronology of regionally synchronous paleoenvironmental events was constrained on the basis of (a) radiocarbon dates (aka absolute) generated from samples collected from a specific sediment type (e.g., saltwater peat) or environment of deposition (e.g., estuary) and (b) inferred ages derived by superimposing the depth(s) of in situ coastal sedimentary sequences onto the suite of sea level curves considered in this study (hereafter depth-age relationships). All radiocarbon ages are expressed in cal kyr BP. Conventional dates were calibrated using the online IntCal20 model by OxCal [39,40,41,42,43]. The reported dates are relative to 1950 BP. All the geochronologic data used in this study are provided in Supplementary Materials Table S1. These were then merged with three Holocene sea level histories to identify tipping points that corresponded to regionally synchronous shifts in the geomorphic trajectory.
3.2. Sea Level Rise in the 20th and 21st Centuries
The investigation into historical and contemporary sea level behavior along the coast of the Georgia Bight involved the utilization of six tide gauges (Figure 1), as detailed in the supplementary data accompanying the 2022 technical report by the National Oceanic and Atmospheric Administration (NOAA) [44]. NOAA’s mean sea level monthly data products (i.e., monthly mean, minimum, and maximum values) [45] were employed for this analysis. The data for each station were initially transformed from the mean sea level datum to mean sea level at the year 2000 by computing the mean sea level value for the year 2000 and subtracting this value from all observations. This normalization was undertaken to maintain consistency with other studies [44]. Trends in sea level rise were enumerated through a multi-parameter linear least-square estimator to determine optimal-fit parameters (i.e., intercept, slope) and their associated uncertainties using the Python programming language’s scipy.optimize.curve_fit function. Additionally, best-fit calculations were performed using a linear model with a periodic (sinusoidal) component, necessitating the inclusion of two supplementary parameters (amplitude and phase) associated with the 18.61-year lunar tide periodicity, which can exert a substantial influence on mean and maximum sea level values [46]. However, the outcomes derived from both linear and periodic analyses indicated only marginal deviations and, consequently, only the linear results were considered in this study. The best-fit analysis was conducted using three distinct data subsets, each characterized by a different start date and a common end date in 2022. The first subset encompassed the entire dataset (i.e., tstart–2022). The second and third subsets focused on station data collected during the periods 1993–2022 and 2003–2022, respectively. The three observational-based means were then extrapolated to the year 2050 and compared to the scenario-based trajectories calculated by the National Oceanic and Atmospheric Administration (NOAA) [44].
3.3. 21st Century Geomorphic Trajectories
Conceptualizations of the likely geomorphic response or trajectory of the Georgia Bight coastal zone to 21st century accelerating sea level rise were based upon the premise that the past is the key to the future. Specifically, the trajectory can be elucidated by comparison between (a) sea level rise tipping points documented during the Holocene marine transgression and (b) rates of sea level rise derived from the six NOAA tide gages. The projections of this study are considered conservative since the rate of sea level rise is expected to continue accelerating throughout the century [44,47,48,49]. The authors have utilized this methodology in other studies undertaken to identify the Holocene rate of sea level rise tipping points [50,51] and construct predictive conceptual models of environmental change [52,53,54].
4. Results
4.1. Holocene Evolution of the Georgia Bight Coastal Zone
4.1.1. Sedimentology, Stratigraphy, and Geomorphology
Observations and generalizations regarding the evolution of the Georgia Bight coastal zone in response to the Holocene marine transgression are based upon a review of over 150 publications describing geological investigations conducting within the study domain. The sedimentologic, stratigraphic, and geomorphic data contained in 32 of those (Table 3 and Table 4) were used to reconstruct the paleoenvironmental evolution of the region, as described below, and generate four regional geologic cross-sections considered representative of each coastal sector. Each cross-section is an illustrative summary of the sediments and sequences that were preserved along the pathway of the transgressing sea. The location of each cross-section was selected after reviewing the density and distribution of all data within each sector to ensure it was constructed using the largest data set possible. The spatial distribution of data used to construct each cross-section is illustrated in Figure 3 and the generalized geologic cross-sections are illustrated in Figure 4.
Of the 32 publications, 21 were conducted on the inner continental shelf and all reported the presence of a thin (~1 m) and discontinuous transgressive sand sheet that unconformably overlies unconsolidated Pleistocene sands and older strata (Table 3). Local bathymetric relief is generally minimal (e.g., meters), although in some areas (e.g., location f in Figure 3) bedrock scarps exceed 5 m. None of the investigations conducted on the continental shelf report the presence of in situ coastal sediments (e.g., basal peat, estuarine mud).
Seven of the thirty-two studies were conducted over the shoreface (Table 3) and only one included a detailed description of subsurface geology [18]. Based upon geophysical surveys conducted in the southern North Carolina sector, these authors report the presence of an inner shelf sand sheet that grades landward into a transgressive facies sequence consisting of basal Pleistocene sediments, overlain by Holocene lagoon and tidal inlet strata, in turn truncated by the modern ravinement surface of the Bogue Banks shoreface (Figure 4).
Eighteen of the thirty-two investigations were conducted in the modern coastal zone (e.g., barrier island, back barrier bay, mainland). This region exhibits the highest degree of geomorphic and stratigraphic variability within the study domain because (1) it is subject to the effects of physical oceanographic processes (e.g., waves and tides; Table 1) and (2) may host Pleistocene high stand deposits along the mainland shoreline or embedded in the Holocene back barrier bay sediment succession (Figure 4) [24,67,82,83]. The alongshore variation in the presence and elevation of Pleistocene high stand deposits is attributed to regional differences in neotectonics [32]. In all coastal sectors of the Georgia Bight except Georgia-Florida, investigators reported the presence of a transgressive facies sequence beneath the barrier island and back barrier bay environments. No investigations appear to have been conducted on the subsurface geology of barrier islands located in the Georgia-Florida sector (Table 3), so the presence of a similar stratigraphy has yet to be determined.
4.1.2. Geochronology
The literature review yielded 12 papers and 115 radiocarbon dates considered relevant to the geochronologic element of this study (Table 5, Supplementary Materials Table S1). The radiocarbon dates obtained from the inner shelf transgressive sand sheet vary widely (Figure 2) and often yield geochronological inversions because the stratigraphic sequence was generated by the reworking of Holocene, Pleistocene, and older materials along the leading edge of the transgression (c.f., [77]). Depth-age relationships suggest the sand sheet was deposited between ~10 (25 m) and ~8 (10 m) cal kyr BP; Figure 2 and Figure 4) or early Holocene, as has been suggested by others [56]. Long et al. [71] recovered a core in water depths of ~13 m at a site located just seaward of the modern shoreface in the northern South Carolina sector. The core penetrated ~1.5 m of sand that unconformably overlay Pleistocene muds. Eight radiocarbon dates were generated from the sand layer and no ages were inverted. The oldest sample, collected at the base of the sand layer, dated 8.5 cal kyr BP or terminal early Holocene.
As noted previously, only one publication described the stratigraphy of the modern shoreface. However, the authors [18] did not provide any geochronological data. Depth-age relationships (Figure 2 and Figure 4) suggest the lagoon strata, located at the base of transgressive facies sequence they encountered, was deposited ~8 cal kyr BP and therefore during the onset of the middle Holocene.
All samples collected from beneath the modern back barrier coastline and adjacent bay areas dated <7 cal kyr BP (Figure 2). These data plot along a concave upward curve that emulates contemporaneous sea level, and their ages suggest these depositional systems formed during the intermediate and terminal stages of middle Holocene and have persisted throughout the late Holocene marine transgression. A scatter of the data within each sector is apparent and attributed to (a) errors associated with estimating sample age and elevation (both in situ and relative to contemporaneous sea level), (b) the thickness of the sample interval (e.g., bulk peat samples vs. an individual shell), and (c) post-depositional auto-compaction and/or sediment consolidation associated with the coring process (cf, [39,69]). Between sector differences are also apparent, with the data collected from the northern two sectors tacking more closely to the North Carolina sea level reconstruction of Kopp et al. [35] and the southern two more tightly with the Florida curve of Hawkes et al. [37]. These trends are attributed to glacial-isostatic processes.
4.1.3. Sea Level Rise Tipping Points
When the geology and geochronology of the study area are considered in tandem with contemporaneous rates of Holocene sea level rise, three synchronous depositional events are revealed. The inner shelf transgressive sand sheet was generated as the coastline was overstepped in response to a relatively rapid rise in sea level (~5.2 mm yr−1) during the early Holocene. During the middle Holocene, sea level rise slowed to an average rate of ~2.4 mm yr−1 and although the data are limited, this corresponds to a transition from coastal overstep to the formation of an emergent, but landward migrating, erosional coastline. Sediment cores recovered from the modern back barrier coastline and bays yielded dates <7 cal kyr BP and record a period of continuous sedimentation and geomorphic stability that has persisted throughout the late Holocene sea, during which the rate of level rise averaged ~0.8 mm yr−1.
4.2. Sea Level Rise in the 20th and 21st Centuries
The sea level data acquired from the six NOAA tide gauge stations (Figure 5, Table 6) reveal an acceleration in the average rate of sea level rise. The mean rates of historical sea level rise, computed utilizing the entire dataset, ranged from 2.22 ± 0.01 mm yr−1 (Fernandina Beach, Florida) to 4.27 ± 0.05 mm yr−1 (Beaufort, North Carolina), with an overall average of 3.26 ± 0.21 mm yr−1. The mean rate of sea level rise since 1993 ranged from 4.80 ± 0.57 mm yr−1 (Fernandina Beach, Florida) to 6.32 ± 0.43 mm yr−1 (Charleston, South Carolina) and averaged 5.63 ± 0.81 mm yr−1. The mean rate of sea level rise during the 21st century (2003–2022) ranged from 8.24 ± 1.83 mm yr−1 (Fernandina Beach, Florida) to 10.96 ± 1.40 mm yr−1 (Charleston, South Carolina) and averaged 9.82 ± 0.31 mm yr−1. Differences in the rates of sea level rise among stations is attributed to variations in glacial-isostatic adjustment [39]. neotectonics (i.e., Cape Fear Arch), surface temperature [84], prevailing winds, semi-annual (e.g., sunny-day) and long-term (e.g., nodal) tidal cycles [46], the regional coastal sea level fingerprint [85], climate variability [86], and oceanic circulation (e.g., the Gulf Stream) [87] unique to each location. However, in the context of this study, the numerous processes that contribute to local variations in the rate of relative sea level rise are not relevant. Rather, it is their aggregate that determines the rate of rise to which the geomorphology has, is, and will respond.
Observation-based extrapolations of sea level elevation in 2050 were calculated for each of the three time periods considered in this study (i.e., tstart–2022, 1993–2022, and 2003–2022). These are compared to the scenario-based trajectories of Sweet et al. [44] in Table 7. Those authors considered five emissions-based sea level trajectories: low, intermediate low, intermediate, intermediate high, and high. Our sea level observation-based extrapolations indicate recent rates (1993–2022) are tracking with the low to intermediate-low scenario-based estimates. The 21st century trends (2003–2022) are tracking with the intermediate to high scenario-based estimates. At the current 21st century rate of rise, water level elevations above the 2000 datum will reach +35 cm (Fernandina Beach, Florida) to +46 cm (Wilmington, North Carolina) by 2050.
5. Discussion
5.1. 21st Century Geomorphic Trajectories
The paleo-environmental observations culled from geological investigations conducted within the study domain reveal a shared regional and synchronous response to changing rates of Holocene sea level rise. An initial interval of coastal overstep, demonstrated by the presence of a transgressive sand sheet, occurred during the Early Holocene (11.7–8.2 cal kyr BP) when the rate of sea level rise exceeded 5 mm yr−1. Towards the modern shoreface, the sand sheet thickens and is interpreted as a transgressive facies sequence. This interval of shoreline retreat occurred during the Middle Holocene (8.2–4.2 cal kyr BP), when the rate of SLR averaged ~2 mm yr−1. The modern coastal zone emerged and stabilized during the Late Holocene (4.2 cal kyr BP-present), when sea level was rising at a rate of <1 mm yr−1. Local differences in sedimentology, stratigraphy, and geochronology within and between each coastal sector are evident, but these differences did not mask the overall uniform and synchronous trajectory of coastal evolution during the Holocene marine transgression.
The observed 21st century rate of sea level rise along the Georgia Bight coastline is nearly double the fastest rate of rise recorded during the Holocene marine transgression and tracking with the intermediate to high sea level rise scenario-based trajectories of [44]. When this region was last subjected to a rate of this magnitude, the geomorphology was overstepped as demonstrated by the presence of the thin and discontinuous inner shelf transgressive sand sheet. If the past is indeed the key to the future, it is highly probable the geomorphic trajectory of the modern coastal zone to a rate of rise of this magnitude will be a shift towards increasing instability (c.f., [74,75,76,77]). This will ultimately result in erosional shoreface retreat, coastal backstepping, and landscape submergence. Early indicators of destabilization will include increasing rate and extent of (a) saltwater encroachment, landward migration of salt tolerant wetland plant communities, (b) barrier overwash and/or breaching, and (c) shoreline erosion [52,88,89,90,91,92,93,94].
5.2. Evidence of Recent Changes and Likely Outcomes of Faster Rates of Sea Level Rise
There have been numerous studies conducted in the study area that either (1) describe historical and recent environmental changes attributed to sea level rise or (2) model future conditions using various sea level rise scenarios. For example, on the back barrier coastlines of North Carolina, Voss et al. [80] reported steep declines in coastal marsh macrophyte production and related vertical sediment accumulation which they attributed to rising sea levels. The authors concluded a growing sediment deficit will ultimately lead to marsh drowning. In South Carolina, rising seas and salinity since 2014 were shown to have negatively impacted coastal forest productivity and composition [95], leading the investigators to conclude a transition to marsh habitat was inevitable. Working in the tidal freshwater coastal floodplains of South Carolina and Georgia, Jones et al. [96] and Wang et al. [97] observed a decline in coastal forest productivity (e.g., die off, tree regeneration, growth) and marsh encroachment, which the authors linked to rising sea level and increasing salinity. Some of their observations were reported from riverine study sites located as much as 30 km upstream of the Atlantic coastline. These areas represent the leading edge of the ongoing, anthropogenically induced marine transgression. On the Georgia coastal plain, Craft [98] determined the maximum rates of vertical elevation change or soil accretion in tidal freshwater forests averaged 2.2 mm yr−1. He noted this was lower than the recent rate of sea level rise, which he reported at the time as 3.3 mm yr−1, and concluded submergence was likely. Submergence is even more likely now, given the 21st century rates of rise recorded at NOAA stations proximal to his study area are nearly three-times faster (i.e., Fort Pulaski, 10.62 mm yr−1; Fernandina Beach, 8.24 mm yr−1). In north Florida, Morris et al. [99] measured vertical elevation change in both marsh and mangrove habitat. The authors noted that mangroves outperformed marsh, but even so concluded rates of sea level rise >10 mm yr−1 will result in forest submergence. The rate of sea level rise in this sector of the Georgia Bight coast is currently averaging ~8 mm yr−1 (Table 6). Finally, in a study conducted in National Wildlife Refuges located throughout the study domain [100], net vertical elevation measurements were collected from a variety of coastal wetland plant communities (e.g., oligohaline and salt marsh, forested) and none exceeded 3.1 mm yr−1. This is much lower than the 21st century average rate of sea level rise (9.82 mm yr−1) reported in this study using all the NOAA station data (Table 6). In summary, these ecological studies provide regional evidence that the effects of accelerating sea level rise are already occurring in fresh- and tide-water wetlands located in the study area. The pace of wetland plant community shifts and localized submergence are likely to hasten as the rate of sea level rise continues to accelerate.
No reports or publications linking accelerating sea level rise to historic or recent changes in the geomorphology of sandy beaches and barrier islands were identified during the data mining phase of this investigation. However, this was not unexpected because the natural response of these features to rising seas (e.g., shoreline retreat, more frequent overwash) is often obscured or obstructed by human activities (cf, [101,102]). These include the installation of shore protection features (e.g., sea walls, bulkheads, revetments), beach nourishment, and inlet management (e.g., jetties, sediment dredging, sand back- or by-passing). However, these anthropogenic alterations ultimately exacerbate the vulnerability of the coastline to accelerating sea level rise by eliminating relevant ecosystem services (e.g., the storm buffering capacity of wetlands), lowering elevation (e.g., removal or scalping of coastal dunes), altering the sediment budget (e.g., managed inlets), and enhancing substrate erosion (e.g., sea wall wave reflection; [103]).
The geomorphic trajectory of the Georgia Bight will also be influenced by landfall of tropical storms and cyclones. These high energy events generally result in extensive shoreline, dune and bluff erosion, island overwash and breaching, and the destruction of shore protection structures (e.g., bulkheads, revetments), buildings, and infrastructure [104,105,106,107]. Storm impacts are especially pronounced across low-lying areas, where overwash or breaching are more likely occur [108]. This overtopping of the shoreline will increase proportional to sea level rise. The intensity and destructiveness of tropical cyclones are expected to increase as the climate warms [109,110,111,112] and this will further accelerate geomorphic and ecologic instability. The combination of faster rates of sea level rise, increasing storminess, and ongoing anthropogenic alterations will surely increase the pace and scale of geomorphic, ecologic, and urban change towards 2050 [113,114]). This will create substantial new challenges to coastal zone practitioners, as the management and planning instruments of governance often lack the capacity to contextualize risk at the pace at which it is changing and the financial resources necessary to implement the plans that have already been accepted [115].

Table 6.
Average rates of sea level rise (mm yr−1) recorded at NOAA six tide gage stations [45]. Error expressed as uncertainty. Station locations illustrated in Figure 1.
| Location | NOAA ID | Latitude | Longitude | Observation of Period | Trend tstart–2022 | Trend 1993–2022 | Trend 2003–2022 |
|---|---|---|---|---|---|---|---|
| Beaufort, NC | 8656483 | 34.72 | −76.67 | 1964–2022 | 4.27 ± 0.05 | 5.82 ± 0.31 | 9.24 ± 1.03 |
| Wilmington, NC | 8658120 | 34.23 | −77.95 | 1935–2022 | 2.65 ± 0.01 | 5.74 ± 0.37 | 10.86 ± 1.12 |
| Springmaid, SC | 8661070 | 33.66 | −78.92 | 1977–2022 | 3.44 ± 0.11 | 4.86 ± 0.40 | 8.99 ± 1.26 |
| Charleston, SC | 8665530 | 32.78 | −79.93 | 1901–2022 | 3.44 ± 0.01 | 6.32 ± 0.43 | 10.96 ± 1.40 |
| Ft. Pulaski, SC | 8670870 | 32.03 | −80.90 | 1935–2022 | 3.52 ± 0.02 | 6.25 ± 0.49 | 10.62 ± 1.59 |
| Fernandina Beach, FL | 8720030 | 30.67 | −81.47 | 1897–2022 | 2.23 ± 0.01 | 4.80 ± 0.57 | 8.24 ± 1.83 |
| Average | 3.26 ± 0.21 | 5.63 ± 0.81 | 9.82 ± 0.31 |
Table 7.
Observation-based linear extrapolations (this study, left column) and scenario-based median estimates of sea level elevation with likely ranges bracketed (i.e., 17th–83rd percentile [44]) in 2050 relative to a baseline of 2000. The observation-based extrapolations are derived from best-fit analysis of all data (black), three decades: 1993–2022 (red), and 21st century: 2003–2022 (purple). The two scenario-based estimates (columns) that bound the observation-based extrapolations (rows) are shown for each of the six tide gauge stations as vertical dividing lines using the observation-based color scheme (i.e., red = 1993–2022, purple = 2003–2022). Values expressed in mm. Scenario-based estimates obtained from Supplementary Data Files to NOAA’s 2022 sea level rise technical report [44,116]).
| Observation Extrapolation | Low | Intermediate-Low | Intermediate | Intermediate-High | High |
|---|---|---|---|---|---|
| Beaufort 223, 285, 405 | 290 [230, 370] | 330 [230, 370] | 370 [290, 460] | 440 [330, 570] | 490 [370, 640] |
| Wilmington 149, 283, 463 | 270 [200, 340] | 300 [230, 380] | 340 [260, 430] | 400 [300, 540] | 460 [330, 600] |
| Springmaid 177, 229, 374 | 260 [200, 330] | 300 [230, 370] | 340 [260, 430] | 400 [330, 540] | 460 [330, 600] |
| Charleston 169, 291, 453 | 290 [230, 350] | 330 [260, 400] | 370 [300, 450] | 430 [330, 570] | 490 [370, 630] |
| Fort Pulaski 176, 293, 446 | 290 [230, 350] | 330 [270, 350] | 370 [300, 450] | 430 [330, 570] | 500 [370, 640] |
| Fernandina Beach 114, 228, 348 | 250 [190, 310] | 290 [230, 350] | 330 [260, 410] | 390 [290, 530] | 450 [330, 600] |
6. Conclusions
Synthesis of regional geologic and chronologic data associated with the Holocene marine transgression of the Georgia Bight coastal zone reveal a uniform, time synchronous geomorphic response to rate of sea level rise tipping points. During the early Holocene, coastal plain sediments were partially reworked and submerged by a relatively rapid sea level rise averaging at least 5 mm yr−1. This paleoenvironmental sequence of events is evidenced by the presence of a thin and discontinuous transgressive sand sheet that unconformably overlies older strata on the inner continental shelf. The rate of sea level rise slowed to ~2 mm yr−1 during the middle Holocene and this was accompanied by erosional shoreface retreat of the coastal zone and formation of a transgressive facies sequence. The modern coastline emerged during the late Holocene under conditions of a relatively slow rate of sea level rise that averaged <1 mm yr−1. Data obtained from six NOAA tide gage stations located within the study domain indicate the rate of sea level rise has accelerated from an historical average of ~3 mm yr−1 (<1972–2022) to ~6 mm yr−1 over the past 30 years (1993–2022) and ~10 mm yr−1 during the 21st century (2003–2022). The 21st century rate of rise is tracking with the intermediate to high scenario-based trajectories of Sweet et al. [51]. At the current rate, water level elevation gain in 2050 will range between 35 to 46 cm relative to the year 2000 datum.
The 21st century rates vary between stations; however, all exceed the rate of sea level rise that accompanied the early Holocene marine transgression, a time when the coastal zone was rapidly transgressed and submerged. Recent studies have demonstrated the destabilizing effects of this acceleration on coastal geomorphology and ecology are already evident. Destabilization will likely expand in pace and scale in response to a persistent acceleration in the rate of 21st century sea level rise and especially during the latter half [44,49]. By 2100, much of the modern, emergent coastal zone will have been replaced by open water marine and estuarine environments.
Supplementary Materials
The following supporting information can be downloaded at: https://www.mdpi.com/article/10.3390/coasts4010001/s1, Table S1: Data used to construct geological cross-sections for each coastal sector as illustrated in Figure 4. Yellow infill = data generated from shell. Orange infill = data generated from plant material. nd = no data provided.
Author Contributions
Conceptualization, R.W.P.; methodology, R.W.P. and S.W.; formal analysis, R.W.P. and S.W.; writing—original draft preparation, R.W.P.; writing—review and editing, R.W.P. and S.W.; visualization, R.W.P. and S.W. All authors have read and agreed to the published version of the manuscript.
Funding
This study was supported by NSF grant #DEB-1832229 and NASA grant #80NSSC21K0982 to SW.
Institutional Review Board Statement
Not applicable.
Informed Consent Statement
Not applicable.
Data Availability Statement
Data relevant supplemental data are available as Supplementary Materials Table S1.
Acknowledgments
The authors extend our appreciation to colleagues who provide reports and publications relevant to this study including Clark Alezander, Mona Behl, Evan Garrison, Ken Krauss, Josh Long, Antonio Rodriguez, and Gary Zarillo. This is contribution #1670 from the Institute of Environment at Florida International University.
Conflicts of Interest
The authors declare no conflict of interest.
References
- Kopp, R.E.; Oppenheimer, M.; O’Reilly, J.L.; Drijfhout, S.S.; Edwards, T.L.; Fox-Kemper, B.; Garner, G.G.; Golledge, N.R.; Hermans, T.H.J.; Hewitt, H.T.; et al. Communicating Future Sea-Level Rise Uncertainty and Ambiguity to Assessment Users. Nat. Clim. Chang. 2023, 13, 648–660. [Google Scholar] [CrossRef]
- Fairbridge, R.W. Eustatic Changes in Sea Level. Phys. Chem. Earth 1961, 4, 99–185. [Google Scholar] [CrossRef]
- Wheeler, R.R. Sanctity of Sea Level. Geol. Soc. Am. Bull. 1954, 65, 1325. [Google Scholar]
- Arnold, J.R.; Libby, W.F. Age Determinations by Radiocarbon Content: Checks with Samples of Known Age. Science 1949, 110, 678–680. [Google Scholar] [CrossRef] [PubMed]
- Curray, J.R. Transgressions and Regressions. In Papers in Marine Geology; Miller, R.L., Ed.; Macmillan Publishing Co.: New York, NY, USA, 1964; pp. 175–203. [Google Scholar]
- Curray, J.R. Sediments and History of Holocene Transgression, Continental Shelf, Northwest Gulf of Mexico. In Recent Sediments, Northwest Gulf of Mexico; Special Volumes; American Association of Petroleum Geologists: Tulsa, Oklahoma, 1960; Volume 143, pp. 221–266. [Google Scholar]
- Shepard, F.P. Rise of Sea Level along Northwest Gulf of Mexico. In Recent Sediments, Northwest Gulf of Mexico; Special Volume; American Association of Petroleum Geologists: Tulsa, Oklahoma, 1960; Volume SP-21, pp. 338–381. [Google Scholar]
- Shepard, F.P. Late Pleistocene and Recent History of the Central Texas Coast. J. Geol. 1956, 64, 56–69. [Google Scholar] [CrossRef]
- Fischer, A.G. Stratigraphic Record of Transgressing Seas in Light of Sedimentation on Atlantic Coast of New Jersey. Bull. Am. Assoc. Pet. Geol. 1961, 45, 1656–1666. [Google Scholar] [CrossRef]
- Gorsline, D.S. Bottom Sediments of the Atlantic Shelf and Slope off the Southern United States. J. Geol. 1963, 71, 422–440. [Google Scholar] [CrossRef]
- Hails, J.R.; Hoyt, J.H. An Appraisal of the Evolution of the Lower Atlantic Coastal Plain of Georgia, U.S.A. Trans. Inst. Br. Geogr. 1969, 46, 53–68. [Google Scholar] [CrossRef]
- Milliman, J.D.; Emery, K.O. Sea Levels during the Past 35,000 Years. Science 1968, 162, 1121–1123. [Google Scholar] [CrossRef]
- Pilkey, O.H.; Frankenberg, D. The Relict-Recent Sediment Boundary on the Georgia Continental Shelf. Acad. Sci. 1964, 22, 30–37. [Google Scholar]
- Swift, D.J.P. Coastal Erosion and Transgressive Stratigraphy. J. Geol. 1968, 76, 444–456. [Google Scholar] [CrossRef]
- Uchupi, E. Atlantic Continental Shelf and Slope of the United States–Physiography; Professional Paper; United States Geological Survey: Washington, DC, USA, 1968; pp. 1–30. [Google Scholar]
- Colquhoun, D.J. A Review of Cenozoic Evolution of the Southeastern United States Atlantic Coast North of the Georgia Trough. Quat. Int. 1995, 26, 35–41. [Google Scholar] [CrossRef]
- Field, M.E.; Meisburger, E.P. Geomorphology, Shallow Structure, and Sediments of the Florida Inner Continental Shelf, Cape Canaveral to Georgia; United States Army Corps of Engineers Coastal Engineering Research Center: Fort Belvoir, VA, USA, 1975; pp. 1–124. [Google Scholar]
- Hine, A.; Snyder, S. Coastal Lithosome Preservation—Evidence from the Shoreface and Inner Continental Shelf off Bogue Banks, North Carolina. Mar. Geol. 1985, 63, 307–330. [Google Scholar] [CrossRef]
- Milliman, J.D.; Pilkey, O.H.; Ross, D.A. Sediments of the Continental Margin off the Eastern United States. Geol. Soc. Am. Bull. 1972, 83, 1315–1334. [Google Scholar] [CrossRef]
- Pilkey, O.H.; Blackwelder, B.W.; Knebel, H.J.; Ayers, M.W. The Georgia Embayment Continental Shelf: Stratigraphy of a Submergence. Geol. Soc. Am. Bull. 1981, 92, 52–63. [Google Scholar] [CrossRef]
- Belknap, D.; Kraft, J.C. Holocene Relative Sea-Level Changes and Coastal Stratigraphic Units on the Northwest Flank of the Baltimore Canyon Trough Geosyncline. SEPM JSR 1977, 47, 610–629. [Google Scholar] [CrossRef]
- Heron, S.D.; Moslow, T.F.; Berelson, W.M.; Herbert, J.R.; Steele, G.A., III; Susman, K.R. Holocene Sedimentation of a Wave-Dominated Barrier Island Shoreface—Cape Lookout, North Carolina. Mar. Geol. 1984, 60, 413–434. [Google Scholar] [CrossRef]
- Kraft, J.C. Sedimentary Facies Patterns and Geologic History of a Holocene Marine Transgression. Geol. Soc. Am. Bull. 1971, 82, 2131–2158. [Google Scholar] [CrossRef]
- Oertel, G. Post-Pleistocene Island and Inlet Adjustments along the Georgia Coast. J. Sediment. Petrol. 1975, 45, 150–159. [Google Scholar]
- Hayes, M.O. The Georgia Bight Barrier System. In Geology of Holocene Barrier Island Systems; Springer: Heidelberg/Berlin, Germany, 1994; pp. 233–304. [Google Scholar]
- Hubbard, D.; Oertel, G.; Nummedal, D. The Role of Waves and Tidal Currents in the Development of Tidal-Inlet Sedimentary Structures and Sand Body Geometry: Examples from North Carolina, South Carolina, and Georgia. SEPM JSR 1979, 49, 1073–1092. [Google Scholar] [CrossRef]
- Clark, J.A.; Farrell, W.E.; Peltier, W.R. Global Changes in Postglacial Sea Level: A Numerical Calculation. Quat. Res. 1978, 9, 265–287. [Google Scholar] [CrossRef]
- Engelhart, S.E.; Horton, B.P. Holocene Sea Level Database for the Atlantic Coast of the United States. Quat. Sci. Rev. 2012, 54, 12–25. [Google Scholar] [CrossRef]
- Engelhart, S.E.; Horton, B.P.; Douglas, B.C.; Peltier, W.R.; Törnqvist, T.E. Spatial Variability of Late Holocene and 20th Century Sea-Level Rise along the Atlantic Coast of the United States. Geology 2009, 37, 1115–1118. [Google Scholar] [CrossRef]
- LeGrand, H.E. Summary of Atlantic Coastal Plain. Bull. Am. Assoc. Pet. Geol. 1961, 45, 1557–1571. [Google Scholar] [CrossRef]
- Van de Plassche, O.; Wright, A.J.; Horton, B.P.; Engelhart, S.E.; Kemp, A.C.; Mallinson, D.; Kopp, R.E. Estimating Tectonic Uplift of the Cape Fear Arch (South-eastern United) Using Reconstructions of Holocene Relative Sea Level. J. Quat. Sci. 2014, 29, 749–759. [Google Scholar] [CrossRef]
- Winker, C.D.; Howard, J.D. Correlation of Tectonically Deformed Shorelines on the Southern Atlantic Coastal Plain. Geology 1977, 5, 123–127. [Google Scholar] [CrossRef]
- Kopp, R.E.; Horton, B.P.; Kemp, A.C.; Tebaldi, C. Past and Future Sea-Level Rise along the Coast of North Carolina, USA. Clim. Chang. 2015, 132, 693–707. [Google Scholar] [CrossRef]
- Toscano, M.A.; Macintyre, I.G. Corrected Western Atlantic Sea-Level Curve for the Last 11,000 Years Based on Calibrated 14C Dates from Acropora Palmata Framework and Intertidal Mangrove Peat. Coral Reefs 2003, 22, 257–270. [Google Scholar] [CrossRef]
- Hawkes, A.D.; Kemp, A.C.; Donnelly, J.P.; Horton, B.P.; Peltier, W.R.; Cahill, N.; Hill, D.F.; Ashe, E.; Alexander, C.R. Relative Sea-Level Change in Northeastern Florida (USA) during the Last ~8.0 Ka. Quat. Sci. Rev. 2016, 142, 90–101. [Google Scholar] [CrossRef]
- Walker, M.; Head, M.J.; Lowe, J.; Berkelhammer, M.; BjÖrck, S.; Cheng, H.; Cwynar, L.C.; Fisher, D.; Gkinis, V.; Long, A.; et al. Subdividing the Holocene Series/Epoch: Formalization of Stages/Ages and Subseries/Subepochs, and Designation of GSSPs and Auxiliary Stratotypes. J. Quat. Sci. 2019, 34, 173–186. [Google Scholar] [CrossRef]
- Horton, B.P.; Peltier, W.R.; Culver, S.J.; Drummond, R.; Engelhart, S.E.; Kemp, A.C.; Mallinson, D.; Thieler, E.R.; Riggs, S.R.; Ames, D.V.; et al. Holocene Sea-Level Changes along the North Carolina Coastline and Their Implications for Glacial Isostatic Adjustment Models. Quat. Sci. Rev. 2009, 28, 1725–1736. [Google Scholar] [CrossRef]
- Kemp, A.C.; Horton, B.P.; Donnelly, J.P.; Mann, M.E.; Vermeer, M.; Rahmstorf, S. Climate Related Sea-Level Variations over the Past Two Millennia. Proc. Natl. Acad. Sci. USA 2011, 108, 11017–11022. [Google Scholar] [CrossRef]
- Bronk Ramsey, C. Deposition Models for Chronological Records. Quat. Sci. Rev. 2008, 27, 42–60. [Google Scholar] [CrossRef]
- Bronk Ramsey, C. Bayesian Analysis of Radiocarbon Rates. Radiocarbon 2009, 51, 337–360. [Google Scholar] [CrossRef]
- Bronk Ramsey, C.; Lee, S. Recent and Planned Developments of the Program OXCAL. Radiocarbon 2013, 55, 720–730. [Google Scholar] [CrossRef]
- Reimer, P.J.; Austin, W.E.N.; Bard, E.; Bayliss, A.; Blackwell, P.G.; Bronk Ramsey, C.; Butzin, M.; Cheng, H.; Edwards, R.L.; Friedrich, M.; et al. The IntCal20 Northern Hemisphere Radiocarbon Age Calibration Curve (0–55 Cal kBP). Radiocarbon 2020, 62, 725–757. [Google Scholar] [CrossRef]
- OxCal On Line IntCal20 Model. Available online: https://c14.arch.ox.ac.uk/oxcal/OxCal.html (accessed on 11 December 2023).
- Sweet, W.V.; Hamlington, B.D.; Kopp, R.E.; Weaver, C.P.; Barnard, P.L.; Bekaert, D.; Brooks, W.; Craghan, M.; Dusek, G.; Frederikse, T.; et al. Global and Regional Sea Level Rise Scenarios for the United States: Updated Mean Projections and Extreme Water Level Probabilities along US Coastlines; NOAA: Silver Spring, MD, USA, 2022; pp. 1–111. [Google Scholar]
- NOAA Sea Level Trends—NOAA Tides & Currents. Available online: https://tidesandcurrents.noaa.gov/sltrends/sltrends_station.shtml?id=8723214 (accessed on 7 August 2021).
- Peng, D.; Hill, E.M.; Meltzner, A.J.; Switzer, A.D. Tide Gauge Records Show That the 18.61-year Nodal Tidal Cycle Can Change High Water Levels by up to 30 cm. J. Geophys. Res. Ocean. 2019, 124, 736–749. [Google Scholar] [CrossRef]
- Ciracì, E.; Rignot, E.; Scheuchl, B.; Tolpekin, V.; Wollersheim, M.; An, L.; Milillo, P.; Bueso-Bello, J.-L.; Rizzoli, P.; Dini, L. Melt Rates in the Kilometer-Size Grounding Zone of Petermann Glacier, Greenland, before and during a Retreat. Proc. Natl. Acad. Sci. USA 2023, 120, e2220924120. [Google Scholar] [CrossRef]
- Hamlington, B.D.; Chambers, D.P.; Frederikse, T.; Dangendorf, S.; Fournier, S.; Buzzanga, B.; Nerem, R.S. Observation-Based Trajectory of Future Sea Level for the Coastal United States Tracks near High-End Model Projections. Commun. Earth Environ. 2022, 3, 230. [Google Scholar] [CrossRef]
- Overland, J.; Dunlea, E.; Box, J.E.; Corell, R.; Forsius, M.; Kattsov, V.; Olsen, M.S.; Pawlak, J.; Reiersen, L.-O.; Wang, M. The Urgency of Arctic Change. Polar Sci. 2019, 21, 6–13. [Google Scholar] [CrossRef]
- Parkinson, R.W. Decelerating Holocene Sea-Level Rise and Its Influence on Southwest Florida Coastal Evolution: A Transgressive/Regressive Stratigraphy. J. Sediment. Res. 1989, 59, 960–972. [Google Scholar] [CrossRef]
- Turner, R.E.; Kearney, M.S.; Parkinson, R.W. Sea-Level Rise Tipping Point of Delta Survival. J. Coast. Res. 2018, 34, 470–474. [Google Scholar] [CrossRef]
- Parkinson, R.W.; Wdowinski, S. A Unified Conceptual Model of Coastal Response to Accelerating Sea Level Rise, Florida, USA. Sci. Total Environ. 2023, 892, 164448. [Google Scholar] [CrossRef] [PubMed]
- Wanless, H.R.; Parkinson, R.W.; Tedesco, L.P. Sea Level Control on Stability of Everglades Wetlands. In Everglades: The Ecosystem and Its Restoration; St. Lucie Press: Delray Beach, FL, USA, 1994. [Google Scholar]
- Parkinson, R.W.; Wdowinski, S. Accelerating Sea-Level Rise and the Fate of Mangrove Plant Communities in South Florida, U.S.A. Geomorphology 2022, 412, 108329. [Google Scholar] [CrossRef]
- Berelson, W.M.; Heron, S.D. Correlations between Holocene Flood Tidal Delta and Barrier Island Inlet Fill Sequences: Back Sound-Shackleford Banks, North Carolina. Sedimentology 1985, 32, 215–222. [Google Scholar] [CrossRef]
- Conery, I.; Walsh, J.P.; Mallinson, D.; Corbett, D.R. Marine Geology and Sand Resources of the Southern North Carolina Inner Shelf. Mar. Georesour. Geotechnol. 2022, 40, 1084–1107. [Google Scholar] [CrossRef]
- Greenhorne; O’Mara; Ocean Surveys Inc. Marine Geophysical Investigation for the Evaluation of Sand Resources Areas Offshore Topsail Island North Carolina; United States Army Corps of Engineers: Wilmington, NC, USA, 2002; p. 95. [Google Scholar]
- Lazar, K.B.; Mallinson, D.J.; Culver, S.J. Late Quaternary Development of the Croatan Beach Ridge Complex, Bogue Sound, Bogue Banks, NC, USA and Implications for Coastal Evolution. Estuar. Coast. Shelf Sci. 2016, 174, 49–64. [Google Scholar] [CrossRef]
- Moslow, T.F.; Heron, S.D. Holocene Depositional History of a Microtidal Cuspate Foreland Cape: Cape Lookout, North Carolina. Mar. Geol. 1981, 41, 251–270. [Google Scholar] [CrossRef]
- Moslow, T.F.; Heron, S.D. The Outer Banks of North Carolina. In Geology of Holocene Barrier Island Systems; Springer: Heidelberg/Berlin, Germany, 1994; pp. 47–74. [Google Scholar]
- Riggs, S.; Snyder, S.; HIne, A.; Mearns, D. Hardbottom Morphology and Relationship to the Geological Framework—Mid-Atlantic Continental Shelf. J. Sediment. Res. 1996, 66, 830–846. [Google Scholar]
- Rodriguez, A.B.; Yu, W.; Theuerkauf, E.J. Abrupt Increase in Washover Deposition along a Transgressive Barrier Island during the Late Nineteenth Century Acceleration in Sea-Level Rise. In Barrier Dynamics and Response to Changing Climate; Moore, L.J., Murray, A.B., Eds.; Springer International Publishing: Cham, Switzerland, 2018; pp. 121–145. ISBN 978-3-319-68084-2. [Google Scholar]
- Timmons, E.A.; Rodriguez, A.B.; Mattheus, C.R.; DeWitt, R. Transition of a Regressive to a Transgressive Barrier Island Due to Back-Barrier Erosion, Increased Storminess, and Low Sediment Supply: Bogue Banks, North Carolina, USA. Mar. Geol. 2010, 278, 100–114. [Google Scholar] [CrossRef]
- Baldwin, W.E.; Morton, R.; Denny, J.F.; Dadisman, S.V.; Schwab, W.C.; Gayes, P.T.; Driscoll, N.W. Maps Showing the Stratigraphic Framework of South Carolina’s Long Bay from Little River to Winyah Bay; U.S. Geological Survey: Reston, VA, USA, 2004. [Google Scholar]
- Baldwin, W.E.; Morton, R.A.; Putney, T.R.; Katuna, M.P.; Harris, M.S.; Gayes, P.T.; Driscoll, N.W.; Denny, J.F.; Schwab, W.C. Migration of the Pee Dee River System Inferred from Ancestral Paleochannels Underlying the South Carolina Grand Strand and Long Bay Inner Shelf. Geol. Soc. Am. Bull. 2006, 118, 533–549. [Google Scholar] [CrossRef]
- Barnhardt, W.; Denny, J.; Baldwin, W.; Schwab, W.; Morton, R.; Gayes, P.; Driscoll, N. Geologic Framework of the Long Bay Inner Shelf: Implications for Coastal Evolution in South Carolina. In Proceedings of the Coastal Sediments ’07; New Orleans, LA, USA, 13–17 May 2007; American Society of Civil Engineers: New York, NY, USA, 2007; pp. 2151–2160. [Google Scholar]
- Denny, J.F.; Baldwin, W.E.; Schwab, W.C.; Gayes, P.T.; Morton, R.A.; Driscoll, N.W. Morphology and Textures of Modern Sediments on the Inner Shelf of South Carolina’s Long Bay from Little River Inlet to Winhah Bay; Open-File Report; U.S. Geological Survey: Reston, VA, USA, 2007; p. 64. [Google Scholar]
- Denny, J.F.; Schwab, W.C.; Baldwin, W.E.; Barnhardt, W.A.; Gayes, P.T.; Morton, R.A.; Warner, J.C.; Driscoll, N.W.; Voulgaris, G. Holocene Sediment Distribution on the Inner Continental Shelf of Northeastern South Carolina: Implications for the Regional Sediment Budget and Long-Term Shoreline Response. Cont. Shelf Res. 2013, 56, 56–70. [Google Scholar] [CrossRef]
- Gardner, L.R.; Porter, D.E. Stratigraphy and Geologic History of a Southeastern Salt Marsh Basin, North Inlet, South Carolina, USA. Wetl. Ecol. Manag. 2001, 9, 371–385. [Google Scholar] [CrossRef]
- Gayes, P.T.; Scott, D.B.; Collins, E.S.; Nelson, D.D. A Late Holocene Sea-Level Fluctuation in South Carolina. In Quaternary Coasts of the United States—Marine and Lacustrine Systems; Special Publication; SEPM (Society for Sedimentary Geology): Tulsa, Oklahoma, 1992; Volume 48, pp. 155–160. [Google Scholar]
- Long, J.H.; Hanebuth, T.J.J.; Lüdmann, T. The Quaternary Stratigraphic Architecture of a Low-Accommodation, Passive-Margin Continental Shelf (Santee Delta Region, South Carolina, USA). J. Sediment. Res. 2020, 90, 1549–1571. [Google Scholar] [CrossRef]
- Wright, E.; Gayes, P.; Donovan-Ealy, P.; Baldwin, W.; Harris, M.S. Assessment of Beach Renourishment Resources on the Inner Shelf Seaward of Pawleys Island, South Carolina, USA.; Minerals Management Service: Herndon, VA, USA, 1999; p. 86. [Google Scholar]
- Duc, A.W. Back-Barrier Stratigraphy of Kiawah Island, South Carolina. Ph.D. Thesis, University of South Carolina, Columbia, SC, USA, 1981. [Google Scholar]
- Harris, M.S.; Gayes, P.T.; Kindinger, J.L.; Flocks, J.G.; Krantz, D.E.; Donovan, P. Quaternary Geomorphology and Modern Coastal Development in Response to an Inherent Geologic Framework: An Example from Charleston, South Carolina. J. Coast. Res. 2005, 211, 49–64. [Google Scholar] [CrossRef]
- Imperato, D.; Sexton, W.; Hayes, M. Stratigraphy and Sediment Characteristics of a Mesotidal Ebb-Tidal Delta, North Edisto Inlet, South Carolina. SEPM JSR 1988, 58, 950–958. [Google Scholar] [CrossRef]
- Long, J.; Hanebuth, T.J.J.; Alexander, C.R. Sedimentology and Stratigraphic Architecture of Quaternary Paleochannels along the Inner Shelf of South Carolina, U.S.A. In Proceedings of the Southeastern Geological Society of America 68th Annual Meeting, Charleston, SC, USA, 28–29 March 2019. [Google Scholar]
- Long, J.H.; Hanebuth, T.J.J.; Alexander, C.R.; Wehmiller, J.F. Depositional Environments and Stratigraphy of Quaternary Paleochannel Systems Offshore of the Georgia Bight, Southeastern U.S.A. J. Coast. Res. 2021, 37, 883–905. [Google Scholar] [CrossRef]
- CB & I—Coastal Planning & Engineering, Inc. Bureau of Ocean Energy Management Atlantic Sand Assessment Project Reconnaissance Data Processing and Interpretation; Florida Department of Environmental Protection: Tallahassee, FL, USA, 2017; p. 260. [Google Scholar]
- Phelps, D.C.; Holem, G.W. Sand Source Availability Investigations: The Search for Sand for Duval County, Florida Beach Renourishment. Available online: https://www.boem.gov/marine-minerals/marine-mineral-research-studies/marine-mineral-resource-evaluation-studies (accessed on 1 September 2023).
- Meisburger, E.; Field, M. Neogene Sediments of Atlantic Inner Continental Shelf off Northern Florida. Bull. Am. Assoc. Pet. Geol. 1976, 60, 2019–2037. [Google Scholar] [CrossRef]
- Vaughn, D.R.; Bianchi, T.S.; Shields, M.R.; Kenney, W.F.; Osborne, T.Z. Blue Carbon Soil Stock Development and Estimates within Northern Florida Wetlands. Front. Earth Sci. 2021, 9, 552721. [Google Scholar] [CrossRef]
- DePratter, C.B.; Howard, J.D. History of Shoreline Change Determined by Archaeological Dating: Georgia Coast, USA. Trans. Gulf Coast Assoc. Geol. Soc. 1977, 27, 252–258. [Google Scholar]
- Howard, J.D.; Scott, R.M. Comparison of Pleistocene and Holocene Barrier Island Beach-to-Offshore Sequences, Georgia and Northwest Florida Coasts, U.S.A. Sediment. Geol. 1983, 34, 167–183. [Google Scholar] [CrossRef]
- Domingues, R.; Goni, G.; Baringer, M.; Volkov, D. What Caused the Accelerated Sea Level Changes along the U.S. East Coast during 2010–2015? Geophys. Res. Lett. 2018, 45, 13367–13376. [Google Scholar] [CrossRef]
- Mitrovica, J.X.; Gomez, N.; Clark, P.U. The Sea-Level Fingerprint of West Antarctic Collapse. Science 2009, 323, 753. [Google Scholar] [CrossRef] [PubMed]
- Valle-Levinson, A.; Dutton, A.; Martin, J.B. Spatial and Temporal Variability of Sea Level Rise Hot Spots over the Eastern United States: Sea Level Rise Hot Spots over Eastern U.S. Geophys. Res. Lett. 2017, 44, 7876–7882. [Google Scholar] [CrossRef]
- Ezer, T. Analysis of the Changing Patterns of Seasonal Flooding along the U.S. East Coast. Ocean Dyn. 2020, 70, 241–255. [Google Scholar] [CrossRef]
- Hinkel, J.; Nicholls, R.J.; Tol, R.S.J.; Wang, Z.B.; Hamilton, J.M.; Boot, G.; Vafeidis, A.T.; McFadden, L.; Ganopolski, A.; Klein, R.J.T. A Global Analysis of Erosion of Sandy Beaches and Sea-Level Rise: An Application of DIVA. Glob. Planet. Chang. 2013, 111, 150–158. [Google Scholar] [CrossRef]
- Leatherman, S.P.; Zhang, K.; Douglas, B.C. Sea Level Rise Shown to Drive Coastal Erosion. Eos Trans. Am. Geophys. Union 2000, 81, 55–57. [Google Scholar] [CrossRef]
- Nicholls, R.J.; Lincke, D.; Hinkel, J.; Brown, S.; Vafeidis, A.T.; Meyssignac, B.; Hanson, S.E.; Merkens, J.-L.; Fang, J. A Global Analysis of Subsidence, Relative Sea-Level Change and Coastal Flood Exposure. Nat. Clim. Chang. 2021, 11, 338–342. [Google Scholar] [CrossRef]
- Zhang, K.; Douglas, B.C.; Leatherman, S.P. Global Warming and Coastal Erosion. Clim. Chang. 2004, 64, 41–58. [Google Scholar] [CrossRef]
- FitzGerald, D.M.; Fenster, M.S.; Argow, B.A.; Buynevich, I.V. Coastal Impacts Due to Sea-Level Rise. Annu. Rev. Earth Planet. Sci. 2008, 36, 601–647. [Google Scholar] [CrossRef]
- Gornitz, V. Global Coastal Hazards from Future Sea Level Rise. Palaeogeogr. Palaeoclimatol. Palaeoecol. 1991, 89, 379–398. [Google Scholar] [CrossRef]
- Voss, C.M.; Christian, R.R.; Morris, J.T. Marsh Macrophyte Responses to Inundation Anticipate Impacts of Sea-Level Rise and Indicate Ongoing Drowning of North Carolina Marshes. Mar. Biol. 2013, 160, 181–194. [Google Scholar] [CrossRef] [PubMed]
- Conner, W.; Whitmire, S.; Duberstein, J.; Stalter, R.; Baden, J. Changes within a South Carolina Coastal Wetland Forest in the Face of Rising Sea Level. Forests 2022, 13, 414. [Google Scholar] [CrossRef]
- Jones, M.C.; Bernhardt, C.E.; Krauss, K.W.; Noe, G.B. The Impact of Late Holocene Land Use Change, Climate Variability, and Sea Level Rise on Carbon Storage in Tidal Freshwater Wetlands on the Southeastern United States Coastal Plain. J. Geophys. Res. Biogeosci. 2017, 122, 3126–3141. [Google Scholar] [CrossRef]
- Wang, H.; Krauss, K.W.; Noe, G.B.; Dai, Z.; Trettin, C.C. Soil Salinity and Water Level Interact to Generate Tipping Points in Low Salinity Tidal Wetlands Responding to Climate Change. Estuaries Coasts 2023, 46, 1808–1823. [Google Scholar] [CrossRef]
- Craft, C.B. Tidal Freshwater Forest Accretion Does Not Keep Pace with Sea Level Rise. Glob. Chang. Biol. 2012, 18, 3615–3623. [Google Scholar] [CrossRef]
- Morris, J.T.; Langley, J.A.; Vervaeke, W.C.; Dix, N.; Feller, I.C.; Marcum, P.; Chapman, S.K. Mangrove Trees Outperform Saltmarsh Grasses in Building Elevation but Collapse Rapidly under High Rates of Sea-level Rise. Earth’s Future 2023, 11, e2022EF003202. [Google Scholar] [CrossRef]
- Moorman, M.C.; Ladin, Z.S.; Tsai, E.; Smith, A.; Bessler, A.; Richter, J.; Harrison, R.; Van Druten, B.; Stanton, W.; Hayes, C.; et al. Will They Stay or Will They Go—Understanding South Atlantic Coastal Wetland Transformation in Response to Sea-Level Rise. Estuaries Coasts 2023, 1–13. [Google Scholar] [CrossRef]
- Johnson, J.M.; Moore, L.J.; Ells, K.; Murray, A.B.; Adams, P.N.; MacKenzie, R.A.; Jaeger, J.M. Recent Shifts in Coastline Change and Shoreline Stabilization Linked to Storm Climate Change. Earth Surf. Process. Landf. 2015, 40, 569–585. [Google Scholar] [CrossRef]
- Sankar, R.D. Quantifying the Effects of Increased Storminess and Sea-Level Change on the Morphology of Sandy Barrier Islands along the Northwestern and Atlantic Coasts of Florida. Ph.D. Thesis, Florida State University, Tallahassee, FL, USA, 2015. [Google Scholar]
- Silvester, R. Technical Note. Wave Reflection at Sea Walls and Breakwaters. Proc. Inst. Civ. Eng. 1972, 51, 123–131. [Google Scholar] [CrossRef]
- Birchler, J.; Doran, K.S.; Long, J.; Stockdon, H. Hurricane Matthew: Predictions, Observations, and an Analysis of Coastal Change; Open-File Report; U.S. Geological Survey: Reston, VA, USA, 2019; p. 48. [Google Scholar]
- Phillips, J. Event Timing and Sequence in Coastal Shoreline Erosion: Hurricanes Bertha and Fran and the Neuse Estuary. J. Coast. Res. 2023, 15, 616–623. [Google Scholar]
- Stauble, D.K.; Seabergh, W.C.; Hales, L.Z. Effects of Hurricane Hugo on the South Carolina Coast. J. Coast. Res. 1991, 8, 129–162. [Google Scholar]
- Thieler, E.R.; Young, R.S. Quantitative Evaluation of Coastal Geomorphological Changes in South Carolina after Hurricane Hugo. J. Coast. Res. 1991, 8, 187–200. [Google Scholar]
- Backstrom, J.T.; Loureiro, C.; Eulie, D.O. Impacts of Hurricane Matthew on Adjacent Developed and Undeveloped Barrier Islands in Southeastern North Carolina. Reg. Stud. Mar. Sci. 2022, 53, 102391. [Google Scholar] [CrossRef]
- Elsner, J.B.; Kossin, J.P.; Jagger, T.H. The Increasing Intensity of the Strongest Tropical Cyclones. Nature 2008, 455, 92–95. [Google Scholar] [CrossRef] [PubMed]
- Emanuel, K. Increasing Destructiveness of Tropical Cyclones over the Past 30 Years. Nature 2005, 436, 686–688. [Google Scholar] [CrossRef] [PubMed]
- Sobel, A.H.; Camargo, S.J.; Hall, T.M.; Lee, C.-Y.; Tippett, M.K.; Wing, A.A. Human Influence on Tropical Cyclone Intensity. Science 2016, 353, 242–246. [Google Scholar] [CrossRef]
- Xi, D.; Lin, N.; Gori, A. Increasing Sequential Tropical Cyclone Hazards along the US East and Gulf Coasts. Nat. Clim. Chang. 2023, 13, 258–265. [Google Scholar] [CrossRef]
- Bozzeda, F.; Ortega, L.; Costa, L.L.; Fanini, L.; Barboza, C.A.M.; McLachlan, A.; Defeo, O. Global Patterns in Sandy Beach Erosion: Unraveling the Roles of Anthropogenic, Climatic and Morphodynamic Factors. Front. Mar. Sci. 2023, 10, 1270490. [Google Scholar] [CrossRef]
- Wright, L.D.; Thom, B.G. Coastal Morphodynamics and Climate Change: A Review of Recent Advances. J. Mar. Sci. Eng. 2023, 11, 1997. [Google Scholar] [CrossRef]
- Cabana, D.; Rölfer, L.; Evadzi, P.; Celliers, L. Enabling Climate Change Adaptation in Coastal Systems: A Systematic Literature Review. Earth’s Future 2023, 11, e2023EF003713. [Google Scholar] [CrossRef]
- NOAA. National Ocean Service 2022 Sea Level Rise Technical Report: Data and Tools. Available online: https://oceanservice.noaa.gov/hazards/sealevelrise/sealevelrise-data.html (accessed on 11 December 2023).
Figure 1.
Google Earth image of Georgia Bight showing location of four coastal sectors considered in this study, NOAA tide gauge stations from which historical water level data was collected, and geologic cross-sections. Also shown are locations of two neotectonic features.
Figure 1.
Google Earth image of Georgia Bight showing location of four coastal sectors considered in this study, NOAA tide gauge stations from which historical water level data was collected, and geologic cross-sections. Also shown are locations of two neotectonic features.
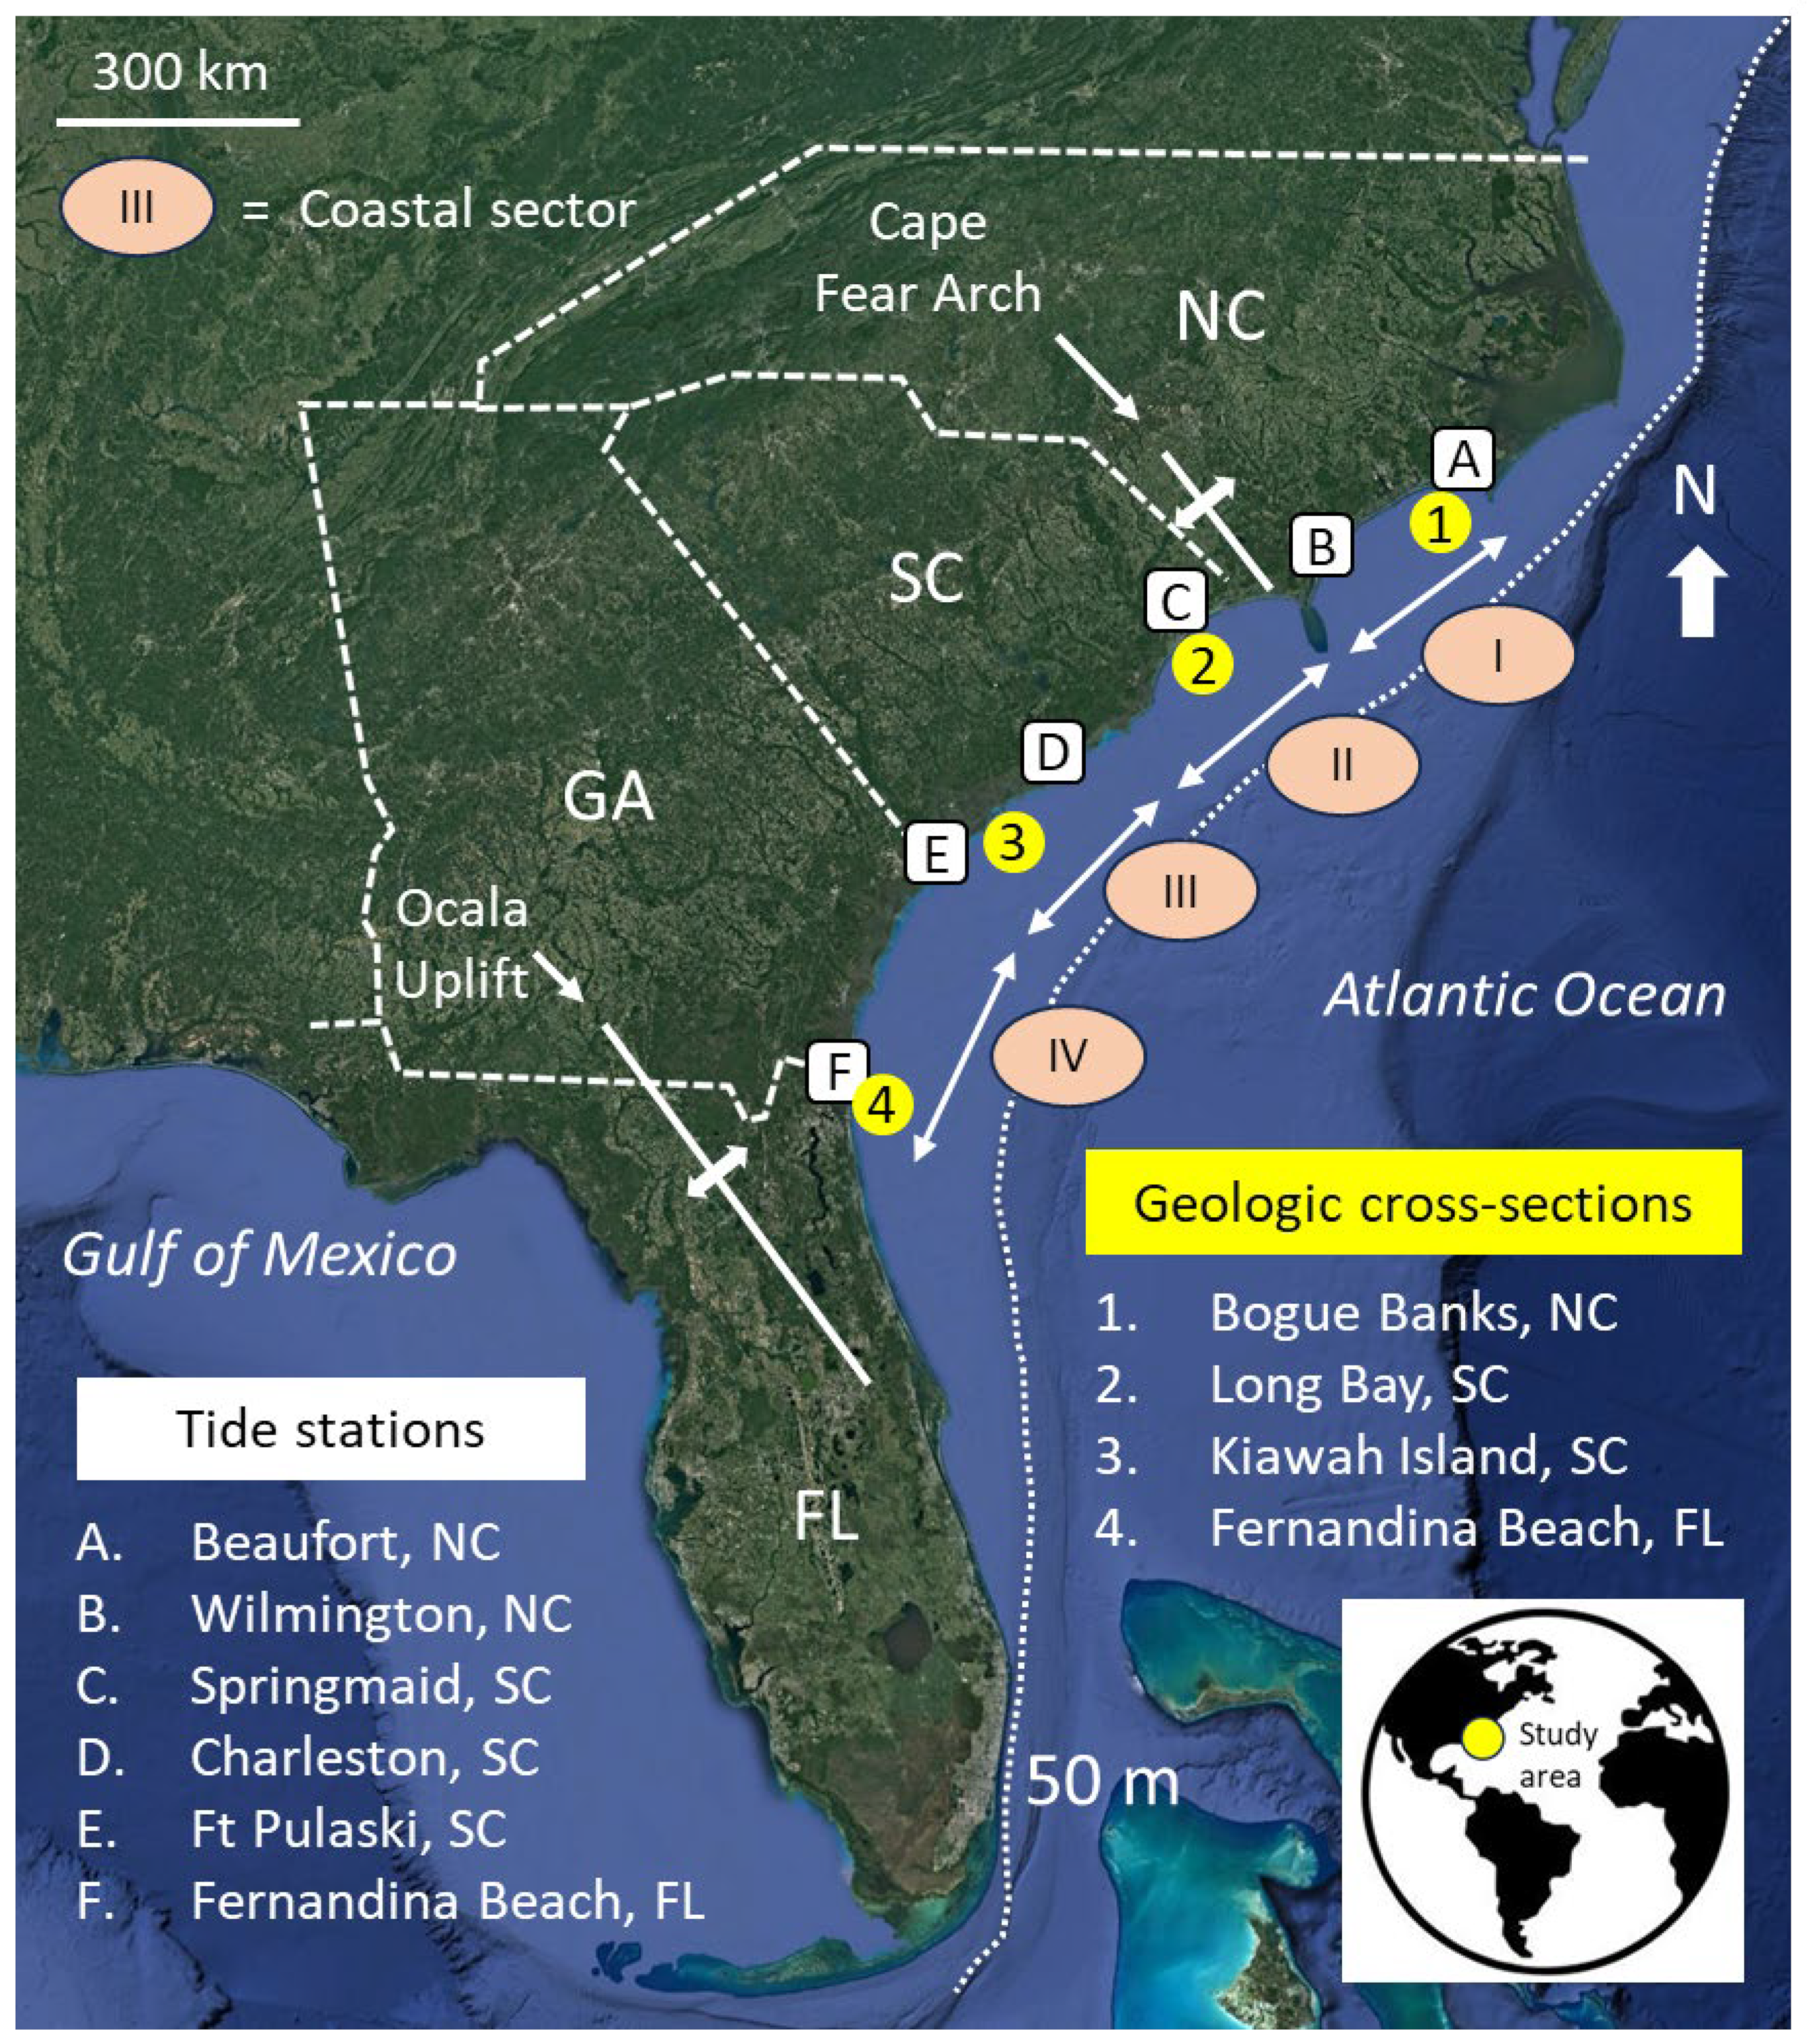
Figure 2.
Geochronologic data plotted as a function sector location and type of material analyzed. Supporting information is provided in Supplementary Materials Table S1. Superimposed are the three submergence curves considered in this study: North Carolina (NC) [33], northeast Florida (FL) [35], and the wider Caribbean (WC) [34]. Holocene Epoch subdivisions after Walker et al. [36]. SC = South Carolina.
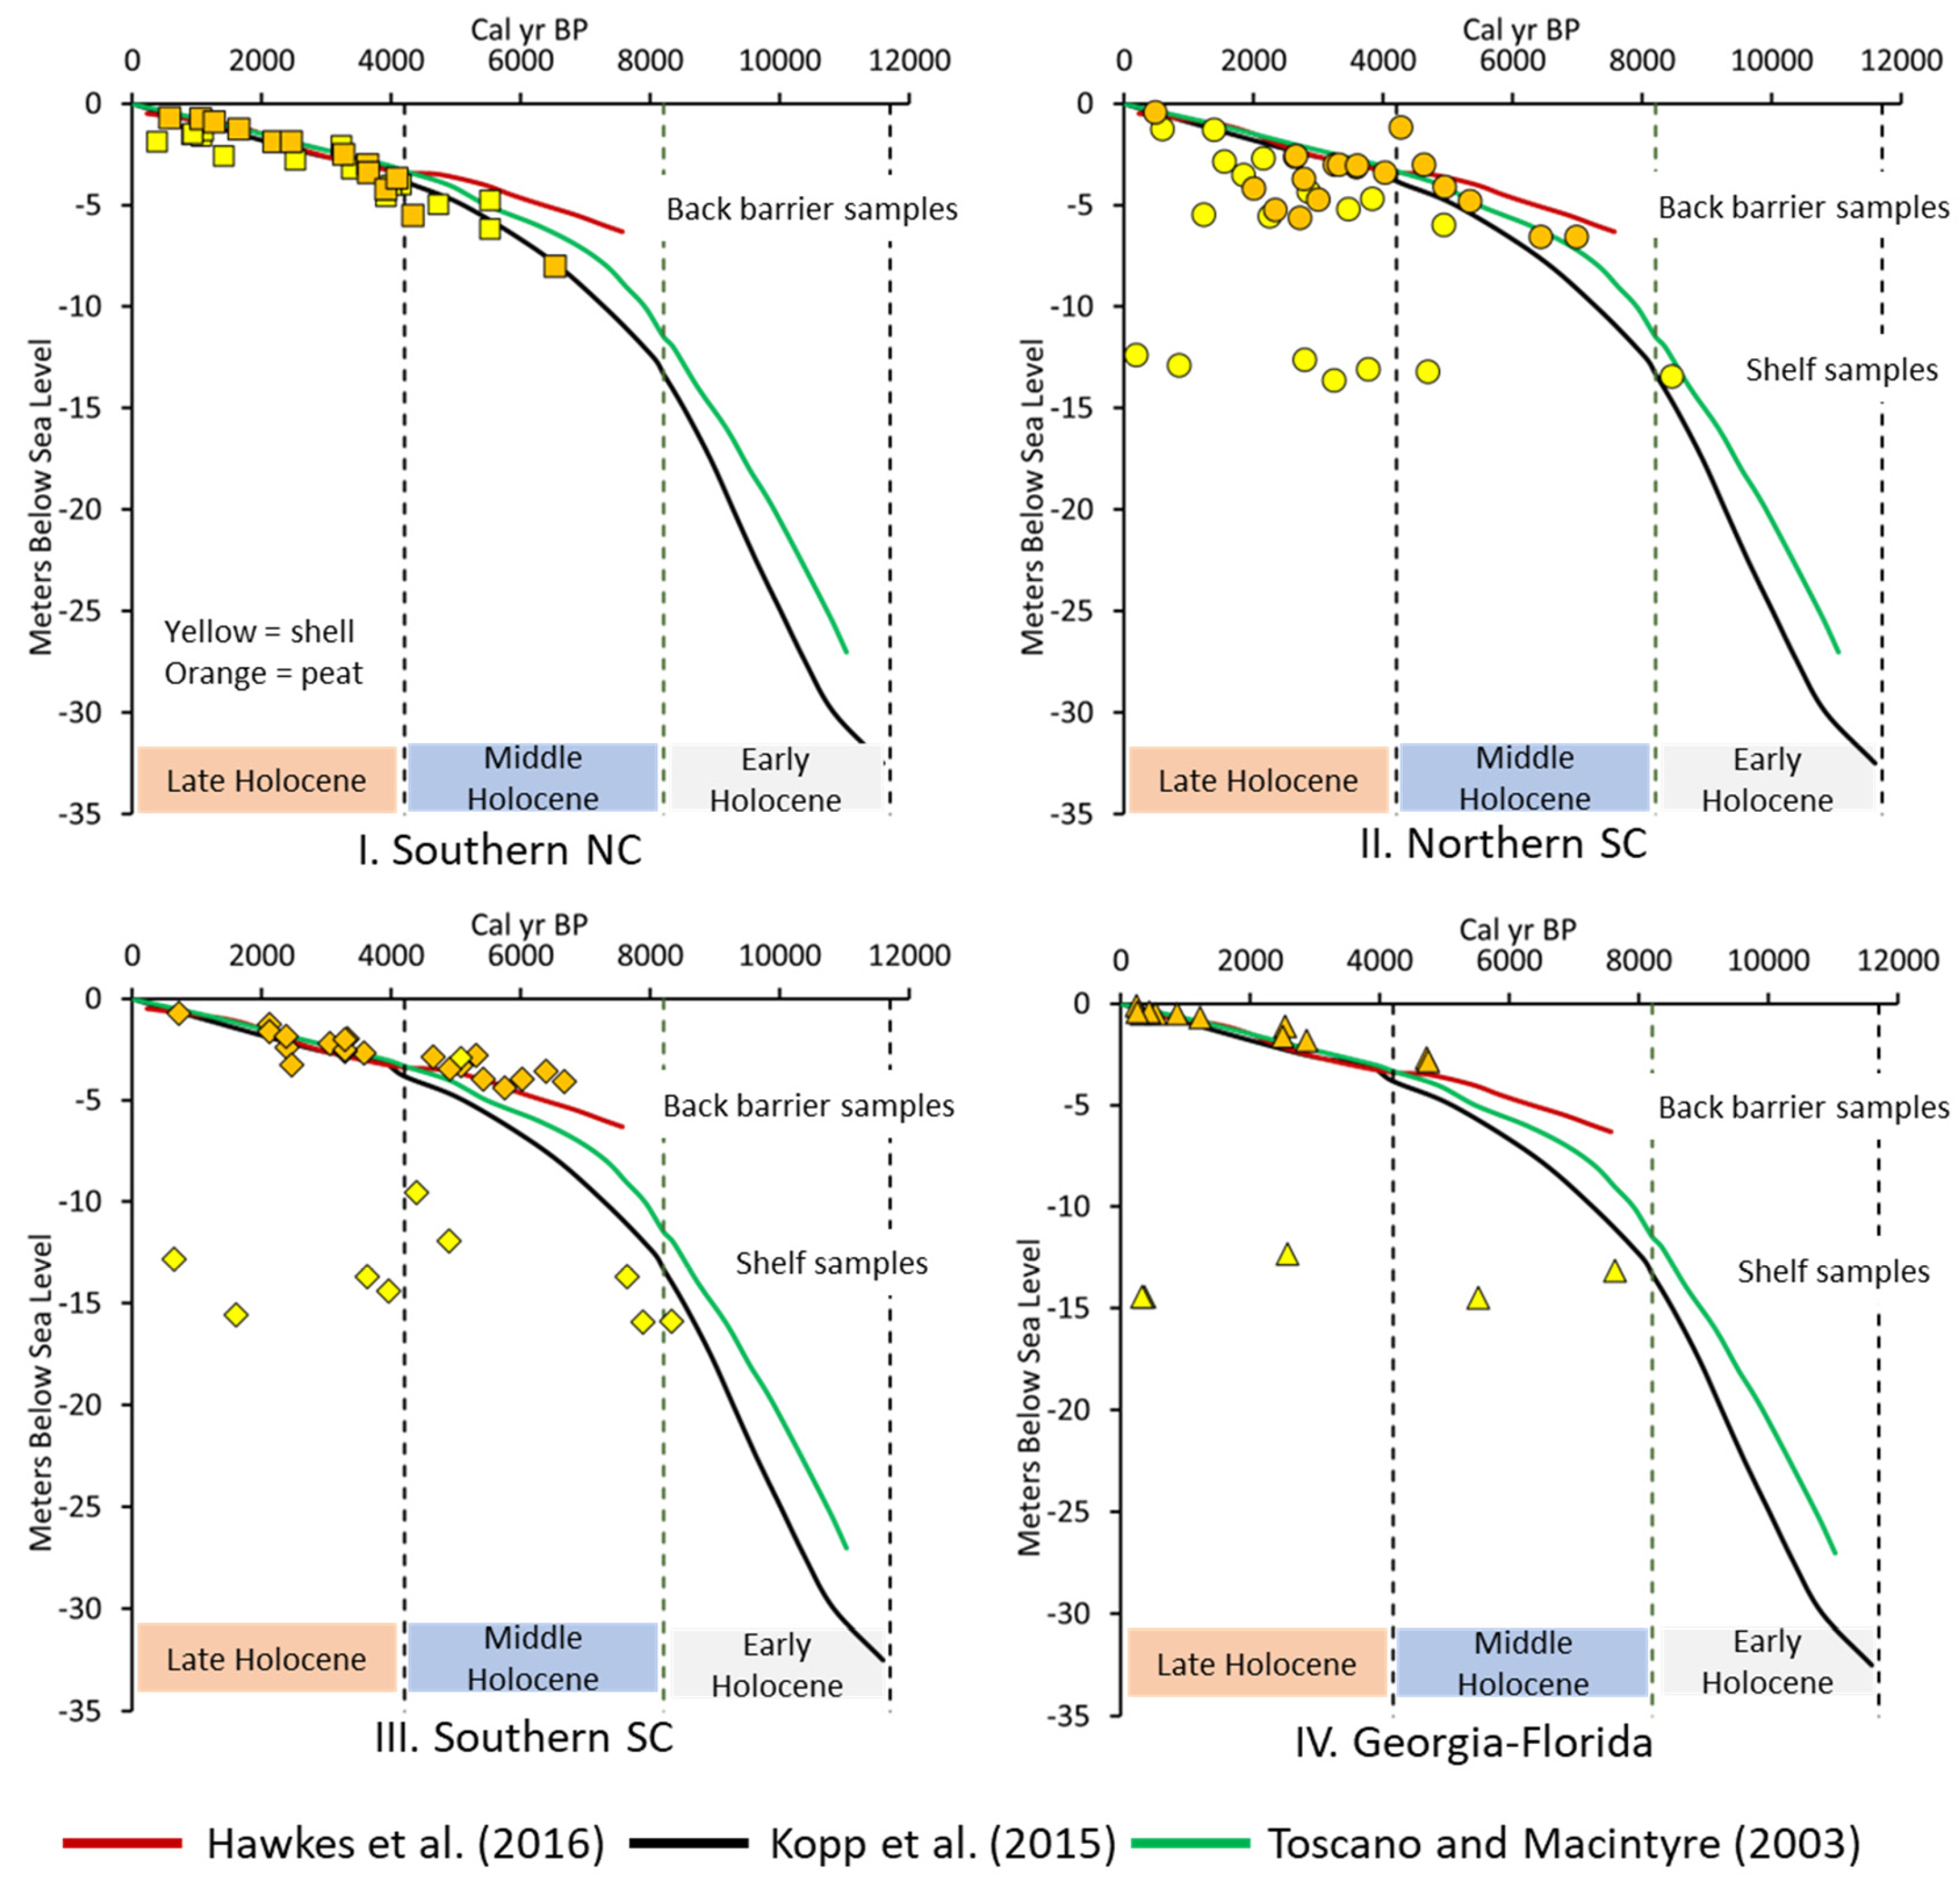
Figure 3.
Google Earth images of the four coastal sectors illustrating the source (circles labeled in lower case letters) and location (polygons) of data harvested from previous investigations to generate geologic cross-sections shown in Figure 4. Location of NOAA tide stations (squares labeled in upper case letters) and geologic cross-section (red line) also shown. Key to data sources summarized in Table 3.
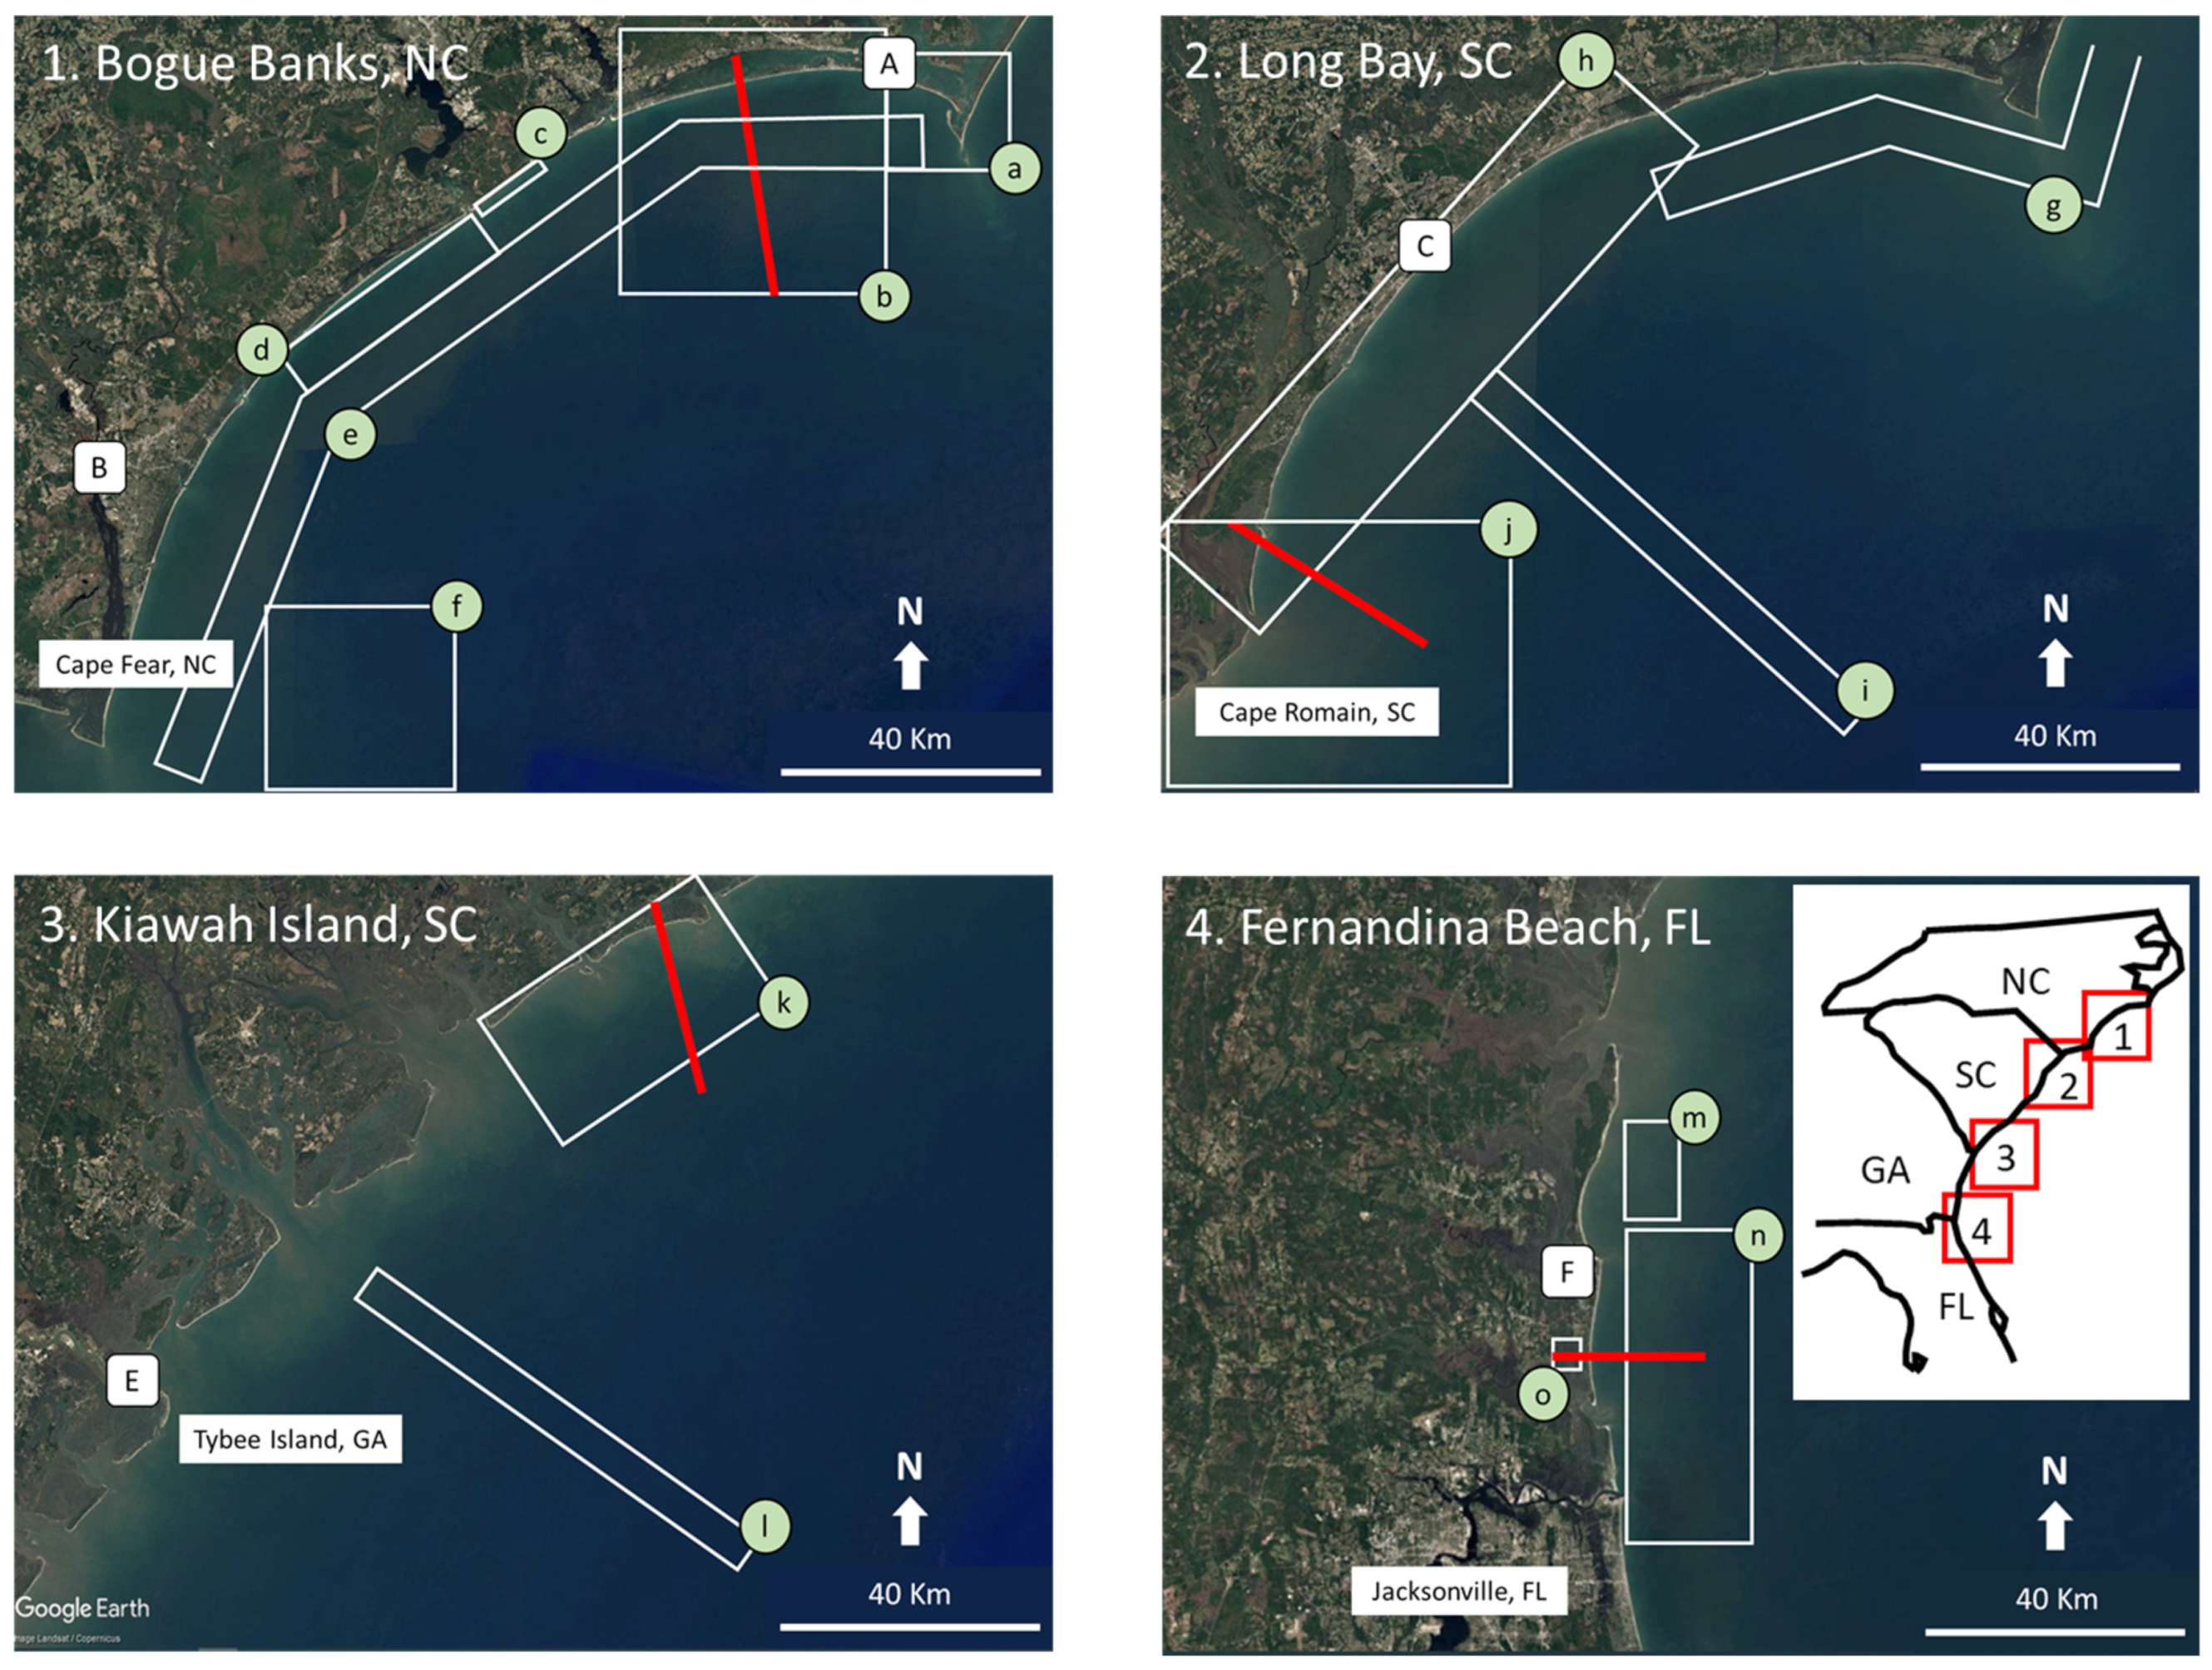
Figure 4.
Simplified geological cross-sections of the four coastal sectors illustrating prominent stratigraphic units and associated paleoenvironment of deposition. Generalized elevation and bathymetry derived from NOAA nautical charts and USGS topographic maps (topos) as follows: Bogue Banks, NC (chart #11543 and 11541; Mansfield topo), Long Bay, SC (chart #11535 and 11531; North Island topo), Kiawah Island, SC (chart #11480 and 11521; Legareville and Kiawah topos), Fernandina Beach, FL (chart 11488; Amelia topo). Specific geological data used to construct cross-sections is summarized in Table 3. Circled question mark (?) indicates zone of uncertainty due to limited or unavailable data. Vertical exaggeration is ~700×. Transect locations shown in Figure 1.
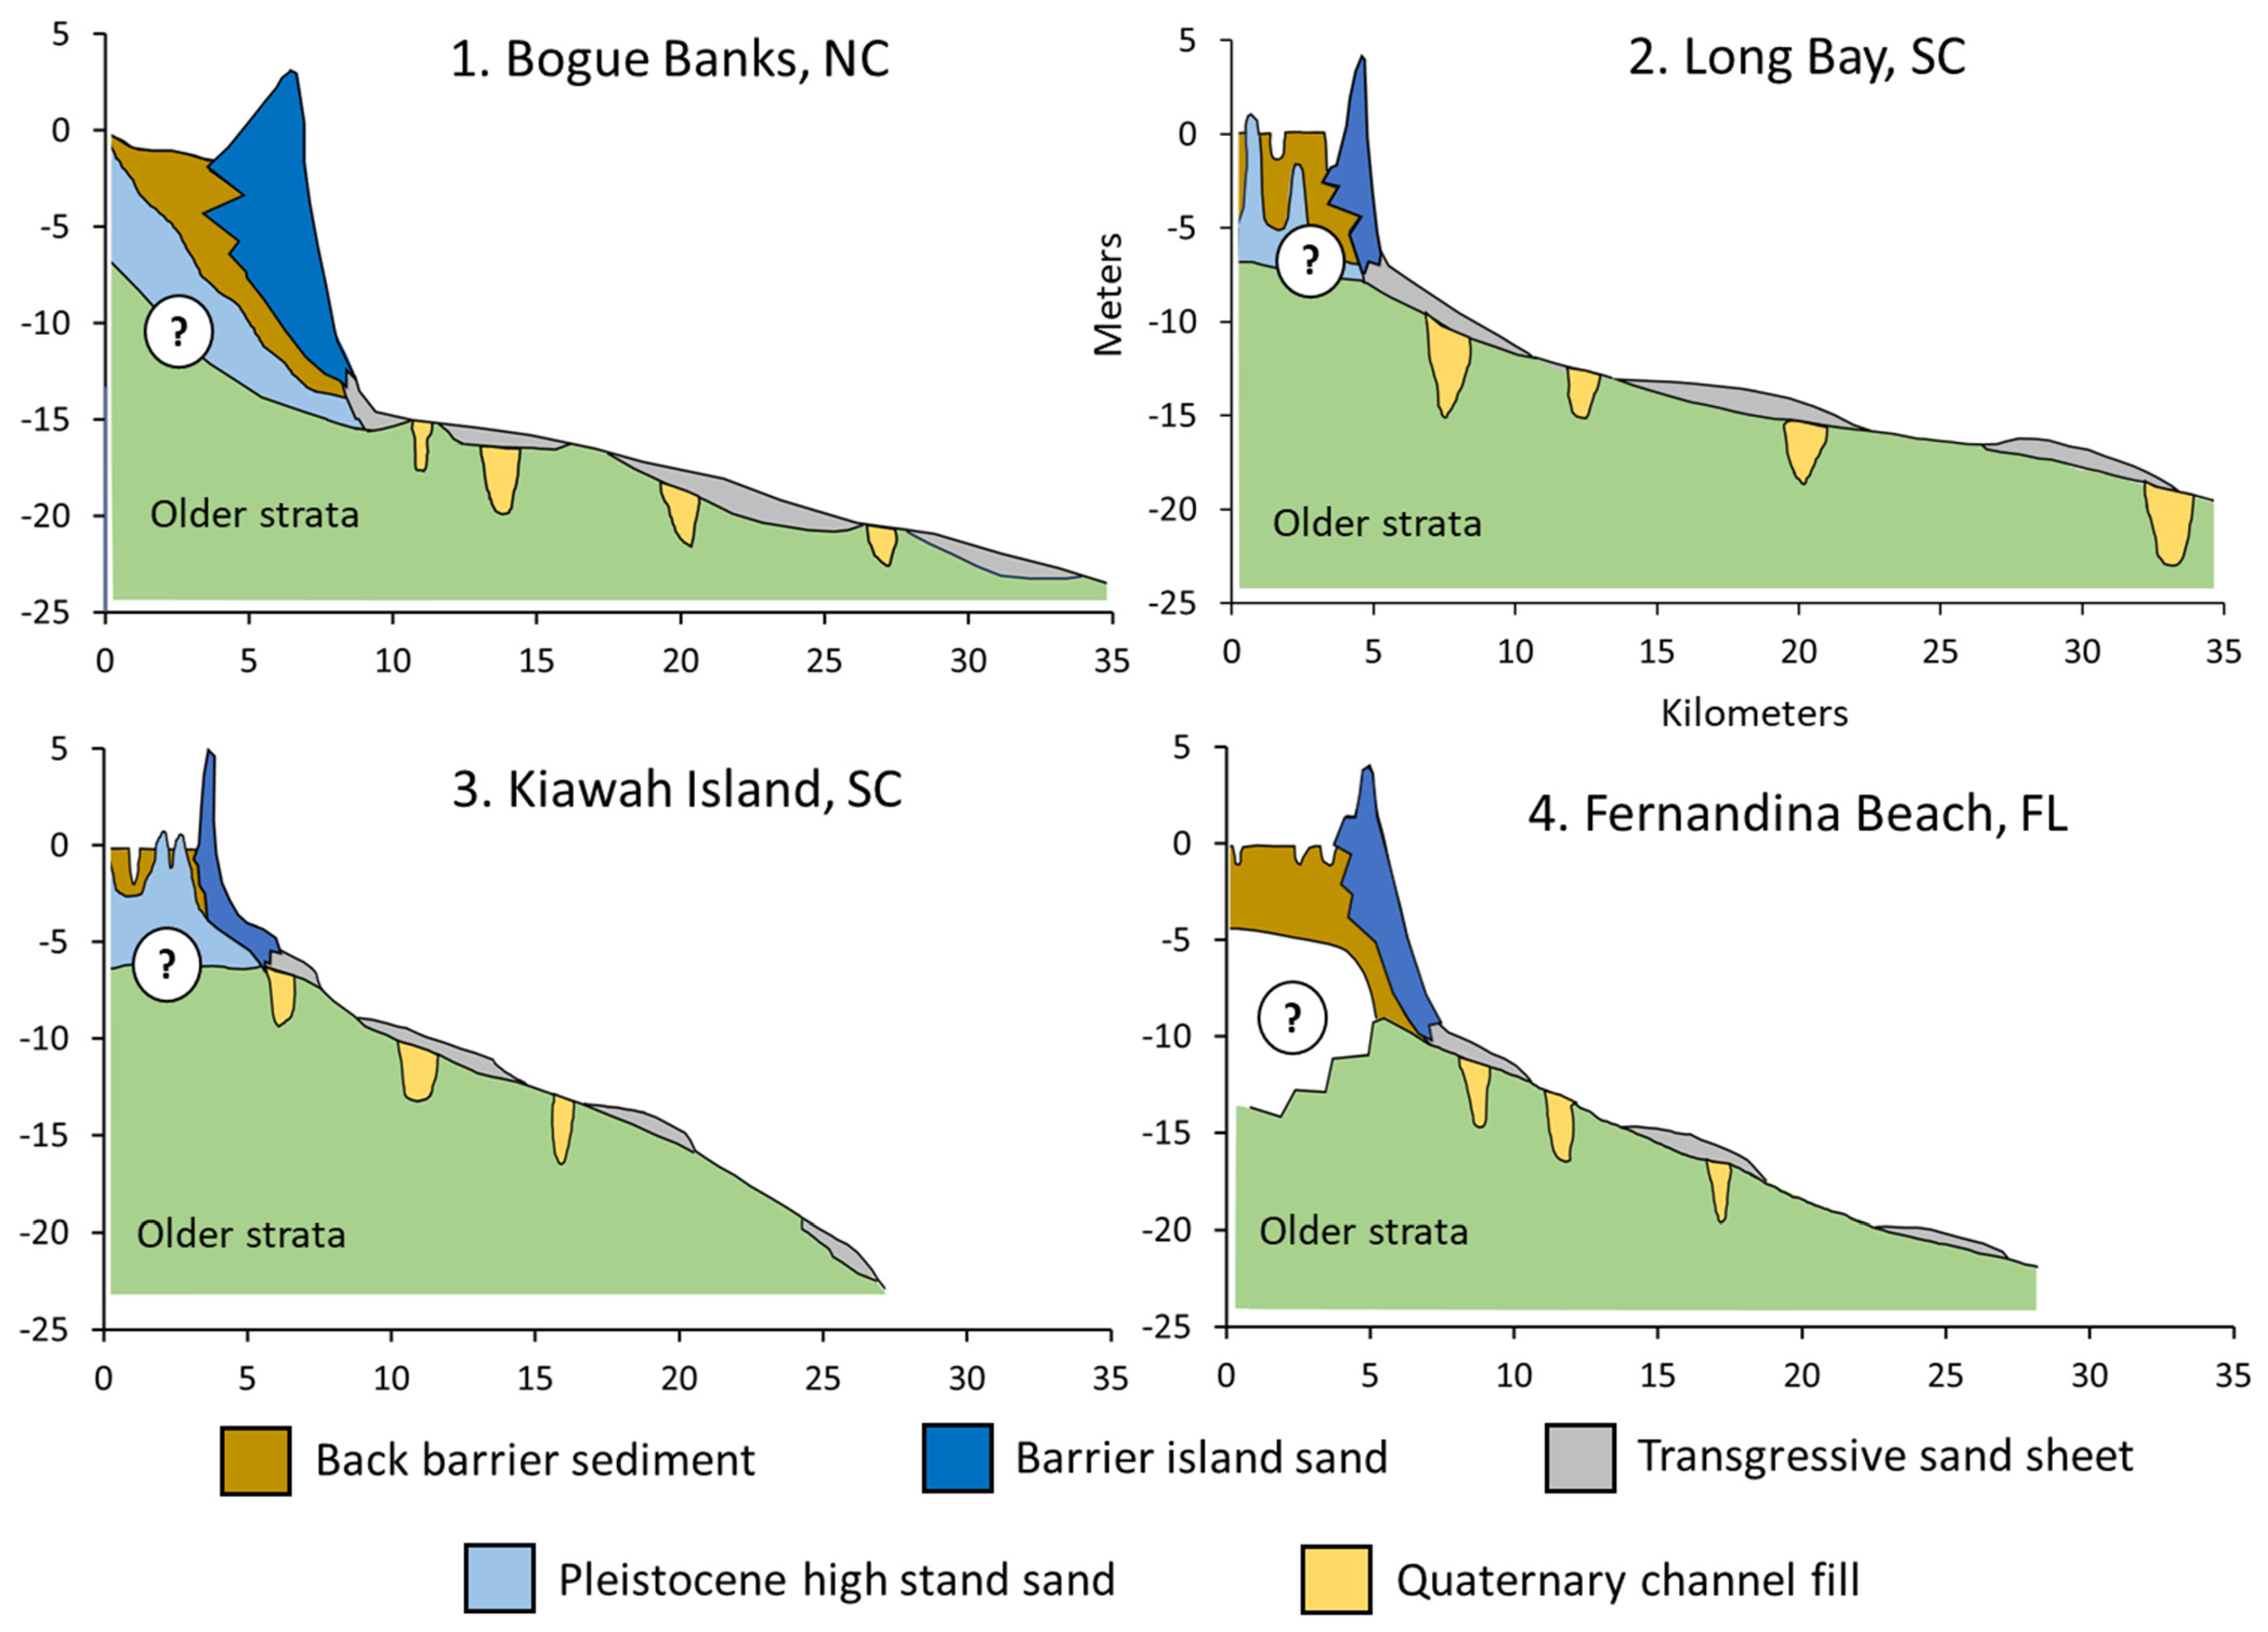
Figure 5.
Observed sea level trends and average rate of rise (error = uncertainty) calculated for the six NOAA tide gage stations located within the study domain and illustrated as a function of duration of record. Observational-based (this study) extrapolations of sea level elevation to 2050 are shown as solid lines: black = historical average rate of rise (duration of record), red = recent average rate of rise (1993–2022), purple = 21st century average rate of rise (2003–2022). Scenario-based [44] extrapolations of sea level elevation to 2050 are shown as dashed lines: blue = intermediate-high, green = high. The shaded areas delineate the 17th–83rd percentile range of uncertainty for each of the two scenario-based projections.

Table 1.
Four coastal sectors considered in this study. Physical oceanographic data obtained from Hubbard et al. [26].
Table 1.
Four coastal sectors considered in this study. Physical oceanographic data obtained from Hubbard et al. [26].
| Coastal Sector | Location (Length) | Physical Oceanography | Geologic Cross-Section |
|---|---|---|---|
| I. Southern North Carolina | Cape Lookout to Cape Fear (170 km) | Wave dominated | 1. Bogue Banks |
| II. Northern South Carolina | Cape Fear to Cape Romain (180 km) | Mixed energy | 2. Long Bay |
| III. Southern South Carolina | Cape Romain to Beaufort River (160 km) | Tide dominated | 3. Kiawah Island |
| IV. Georgia–Florida | Beaufort River to Mayport (200 km) | Mixed energy | 4. Fernandina Beach |
Table 2.
Average rate of sea level rise during early, middle, and late Holocene. Values derived from data shown in Figure 2.
Table 2.
Average rate of sea level rise during early, middle, and late Holocene. Values derived from data shown in Figure 2.
| Author | Rate of Sea Level Rise (mm yr−1) | |||
|---|---|---|---|---|
| Duration (Years) | Late Holocene (0–4.2 cal kyr BP) | Middle Holocene (4.2–8.2 cal kyr BP) | Early Holocene (8.2–11.7 cal kyr BP) | |
| Hawkes et al. [35] | 7500 | 0.7 | NA | NA |
| Kopp et al. [33] | 11,600 | 0.9 | 2.4 | 5.2 |
| Toscano and Macintyre [34] | 11,000 | 0.8 | 2.4 | 5.1 |
| Average | 0.8 | 2.4 | 5.2 | |
Table 3.
Published information (x) utilized to construct geologic cross-sections considered representative of the four coastal sectors (see Figure 1 and Figure 3). Definition of terms and abbreviations provided in Table 4. Matching cell colors highlight link between area of study and observations of original authors.
| Cross-Section | Location | Study Area | Methods | Map Inset Key (km2) | Observation | ||||||||||
|---|---|---|---|---|---|---|---|---|---|---|---|---|---|---|---|
| M | Bb | Bi | Sf | Sh | H | CB | GP | Author | TFS | TSS | HB | PC | |||
| 1. BB | Shackleford Banks | x | x | x | a | [55] | x | ||||||||
| 1. BB | Bogue Banks | x | x | x | b (2000) | [56] | x | x | x | ||||||
| 1. BB | Onslow Bay | x | x | x | d | [57] | x | x | x | ||||||
| 1. BB | Cape Lookout | x | x | a | [22] | x | |||||||||
| 1. BB | Onslow Bay | x | x | x | x | x | b (14,000) | [18] | x | x | x | x | |||
| 1. BB | Bogue Sound | x | x | x | x | x | b | [58] | x | x | |||||
| 1. BB | Cape Lookout | x | x | x | a | [59] | x | ||||||||
| 1. BB | Shackleford Banks | x | x | x | a | [60] | x | ||||||||
| 1. BB | Onslow Bay | x | x | e | [61] | x | x | ||||||||
| 1. BB | Onslow Beach | x | x | x | c | [62] | x | ||||||||
| 1. BB | Bogue Banks | x | x | x | x | x | x | b (270) | [63] | x | x | x | |||
| 2. LB | Long Bay | x | x | x | x | h (40,000) | [64] | x | x | x | |||||
| 2. LB | Long Bay | x | x | x | x | h (40,000) | [65] | x | x | x | |||||
| 2. LB | Long Bay | x | x | x | h (40,000) | [66] | x | x | x | ||||||
| 2. LB | Brunswick County | x | x | x | g (2000) | [56] | x | x | x | ||||||
| 2. LB | Long Bay | x | x | x | h | [67] | x | x | x | ||||||
| 2. LB | Long Bay | x | x | x | h | [68] | x | x | x | ||||||
| 2. LB | North Inlet marsh | x | x | x | x | x | h | [69] | x | ||||||
| 2. LB | Murrels Inlet | x | x | x | h | [70] | x | ||||||||
| 2. LB | Cape Romain | x | x | x | x | x | j | [71] | x | x | |||||
| 2. LB | Long Bay | x | x | x | i (40,000) | [20] | x | x | |||||||
| 2. LB | Pawleys Inlet | x | x | x | x | h | [72] | x | x | ||||||
| 3. KI | Kiawah Island | x | x | x | x | k | [73] | x | |||||||
| 3. KI | Kiawah Island | x | x | x | x | x | x | x | k | [74] | x | x | x | ||
| 3. KI | North Edisto Inlet | x | x | x | k | [75] | x | ||||||||
| 3. KI | Kiawah Island | x | x | x | k | [76] | x | x | |||||||
| 3. KI | Kiawah Island | x | x | x | k (2800) | [77] | x | x | |||||||
| 3. KI | Savanah River | x | x | x | l (40,000) | [20] | x | x | |||||||
| 4. FB | Fernandina Beach | x | n (2500) | [78] | x | x | x | ||||||||
| 4. FB | Fernandina Beach | x | x | x | x | n (1500) | [17] | x | x | x | x | ||||
| 4. FB | Cumberland Island | x | x | x | m (2800) | [77] | x | x | |||||||
| 4. FB | Fernandina Beach | x | x | x | n | [79] | x | x | |||||||
| 4. FB | Fernandina Beach | x | x | x | n | [80] | x | x | x | ||||||
| 4. FB | Fernandina Beach | x | x | o | [81] | x | |||||||||
Table 4.
Definition of Table 3 terms and abbreviations.
Table 4.
Definition of Table 3 terms and abbreviations.
| Item | Description |
|---|---|
| Cross-Section | The study domain of this investigation is subdivided into four coastal sectors. Four geologic cross-sections were constructed as representative of each: |
| BB | Bogue Banks. Southern North Carolina. |
| LB | Long Bay. Northern South Carolina. |
| KI | Kiawah Island. Southern South Carolina. |
| FB | Fernandina Beach. Southern Georgia—northeast Florida. |
| Study Area | Area in which the study was conducted: |
| M | Mainland. Emergent landscape located landward of the back barrier bay (aka lagoon, estuary) shoreline. |
| Bb | Back barrier. Subtidal or intertidal environments located between the shorelines of the mainland and barrier island. Typical environments include bay, overwash, marsh, and relict or active flood tidal shoals. |
| Bi | Barrier island. Emergent sand body located between the back barrier bay and Atlantic Ocean. |
| Sf | Shoreface. Subtidal, seaward dipping sand wedge extending from the barrier island shoreline to a depth of ~10 m. |
| Sh | Shelf. Relatively flat and featureless offshore zone extending from the toe of shoreface to the shelf break (~50 m). Along the shoreface boundary and extending seaward to ~20 m, this zone may host ebb tidal deltas and linear sand shoals with significant bathymetric relief. |
| Methods | Methodological approach used by original author(s) in their investigations: |
| H | Historical. Includes aerial photographs, nautical charts, field observations, and/or grab samples. |
| CB | Core borings. Includes core borings recovered using brute force, rotary, vibratory, and gravity methods. |
| GP | Geophysical. Includes survey records obtained using seismic reflection, sidescan sonar, swath bathymetry, and ground penetrating radar. |
| Map Inset Key | Key to location of data shown in Figure 3. In some cases, the original studies were conducted in more than one coastal sector as defined in this investigation. Thus, some of the original studies are listed more than once. In those cases, the total aerial extent of that study is indicated by a numeric value (km2). |
| Authors | Citation identifying author(s) whose published data and observations were used in this investigation to construct the generalized geologic cross-sections shown in Figure 4. |
| Observation | Sedimentologic, stratigraphic, and/or paleoenvironmental observations reported by the authors and relevant to this investigation: |
| TFS | Transgressive facies sequence. Stratigraphic onlapping sequence of coastal facies indicative of the landward migration and upward translation of the coastal zone (i.e., erosional shoreface retreat). |
| TSS | Transgressive sand sheet. Thin (~1 m) and discontinuous veneer of unconsolidated sediment observed on the lower shoreface and inner shelf. These sediments unconformably overly older strata and are separated from them by a ravinement surface. |
| HB | Hardbottom. Indurated surface on the sea floor. May reflect the presence of older, lithified strata or syn-sedimentary induration at the sediment-water interface. Common on ‘sediment-starved’ continental shelves. |
| PC | Paleochannel. Incised ‘V-shaped’ valleys carved or cut into the underlying lithified strata or unconsolidated sediments, respectfully, by fluvial or tidal processes. Vertical and horizontal dimensions vary as a function of genesis and ravinement depth of cut. |
Table 5.
Summary of geochronologic sample data used to construct Figure 2. A detailed description of these data is contained in Supplementary Materials Table S1. Sector abbreviations: sNC = southern North Carolina, nSC = northern South Carolina, sSC = southern South Carolina, G-F = Georgia-Florida.
Table 5.
Summary of geochronologic sample data used to construct Figure 2. A detailed description of these data is contained in Supplementary Materials Table S1. Sector abbreviations: sNC = southern North Carolina, nSC = northern South Carolina, sSC = southern South Carolina, G-F = Georgia-Florida.
| Sector | Study Objective | Location | Datum | Setting | Material | N | Author |
|---|---|---|---|---|---|---|---|
| sNC | Paleoenvironmental | Bogue Sound | Top of core | Marsh | Shell | 4 | [55] |
| Sea level history | Southern North Carolina | Mean sea level | Not specified | Salt peat | 11 | [28] | |
| Sea level history | Southern North Carolina | Mean sea level | Not specified | Peat | 2 | [37] | |
| Paleoenvironmental | Bogue Sound | Mean sea level | Back barrier bay | Shell | 6 | [63] | |
| Wood | 1 | ||||||
| Paleoenvironmental | Bogue Sound | Mean sea level | Back barrier bay | Foraminifera | 2 | [58] | |
| Paleoenvironmental | Oslow Beach | NAVD88 | Plant material | 1 | [62] | ||
| Shell | 1 | ||||||
| nSC | Sea level history | Northern South Carolina | Mean sea level | Not specified | Salt peat | 10 | [28] |
| Sea level history | Merrells Inlet | Mean high water | Marsh | Peat | 9 | [70] | |
| Paleoenvironmental | North Inlet | Mean high marsh | Back barrier bay | Shell | 11 | [69] | |
| Paleoenvironmental | Continental shelf | Sea level | Sand sheet | Shell | 7 | [71] | |
| sSC | Paleoenvironmental | Kiawah Island | High marsh | Marsh | Shell | 1 | [73] |
| Sea level history | Southern South Carolina | Mean sea level | Not specified | Salt peat | 21 | [28] | |
| Paleoenvironmental | Continental shelf | Sea level | Sand sheet | Shell | 9 | [71,77] | |
| G-F | Paleoenvironmental | St. Augustine Beach | Top of core | Back barrier marsh | Wetland | 12 | [81] |
| Paleoenvironmental | Continental shelf | Sea level | Sand sheet | Shell | 5 | [77] |
Disclaimer/Publisher’s Note: The statements, opinions and data contained in all publications are solely those of the individual author(s) and contributor(s) and not of MDPI and/or the editor(s). MDPI and/or the editor(s) disclaim responsibility for any injury to people or property resulting from any ideas, methods, instructions or products referred to in the content. |
© 2023 by the authors. Licensee MDPI, Basel, Switzerland. This article is an open access article distributed under the terms and conditions of the Creative Commons Attribution (CC BY) license (https://creativecommons.org/licenses/by/4.0/).
Share and Cite
MDPI and ACS Style
Parkinson, R.W.; Wdowinski, S. Geomorphic Response of the Georgia Bight Coastal Zone to Accelerating Sea Level Rise, Southeastern USA. Coasts 2024, 4, 1-20. https://doi.org/10.3390/coasts4010001
AMA Style
Parkinson RW, Wdowinski S. Geomorphic Response of the Georgia Bight Coastal Zone to Accelerating Sea Level Rise, Southeastern USA. Coasts. 2024; 4(1):1-20. https://doi.org/10.3390/coasts4010001
Chicago/Turabian StyleParkinson, Randall W., and Shimon Wdowinski. 2024. "Geomorphic Response of the Georgia Bight Coastal Zone to Accelerating Sea Level Rise, Southeastern USA" Coasts 4, no. 1: 1-20. https://doi.org/10.3390/coasts4010001