Article

Spectrophotometric and Electrochemical Assessment of the Antioxidant Capacity of Aqueous and Ethanolic Extracts of Citrus Flavedos

by
María Teresa Moreno
and
José Miguel Rodríguez Mellado
*
Departamento de Química Física y Termodinámica Aplicada, Instituto Universitario de Investigación en Química Fina y Nanoquímica IUIQFN, CeiA3, Campus de Rabanales, Universidad de Córdoba, Edificio Marie Curie, E-14071 Córdoba, Spain
*
Author to whom correspondence should be addressed.
Oxygen 2022, 2(2), 99-108; https://doi.org/10.3390/oxygen2020009
Submission received: 8 March 2022 / Revised: 18 April 2022 / Accepted: 22 April 2022 / Published: 26 April 2022
(This article belongs to the Special Issue Reactive Agents and Their Modes of Action Against Oxidative Stress)

Abstract

:
Citrus peel residues are of great interest due to the use of their extracted compounds in the food, pharmaceutical and cosmetic industries, mainly due to their antioxidant properties. The flavedo of this peel is especially relevant in modern culinary uses. The antioxidant capacity of the water and ethanolic extracts of the flavedos of ten peels was measured by a spectrophotometric assay and two electrochemical assays. The Folin–Ciocalteu values and ascorbic acid contents were also determined. From the results, it was concluded that the polyphenols extracted from the flavedos have antioxidant activities that occur through single-electron-transfer (SET) mechanisms rather than SET+ hydrogen atom transfer mechanisms. The polyphenols with high polarities extracted in the water constituted the least abundant fraction, and were better antioxidants than those with lower polarity extracted in the ethanol, which constituted the most abundant fraction.

1. Introduction

In tropical, subtropical, and temperate zones, citrus cultivation is a particularly commercially important industry [1,2,3]. Citrus fruits belong to the genus Citrus of the family Rutaceae, and are considered one of the largest plant species, consisting of more than 40 different sub-species. Over time, different hybrids and varieties have been produced through natural or artificial processes. They are characterized by their content in valuable phytochemicals and antioxidants which have beneficial effects for human health, due to their nutritional and biological properties [4,5,6]. They are also a source of bioactive compounds (carotenoids, vitamins, fiber, and phenolic compounds), flavanones, anthocyanins, and hydroxycinnamic acid, resulting in the flavor and color of the plants [7,8,9,10].
Citrus peel residues represent nearly 50–70% of the fruit’s wet mass [11], and can cause environmental problems due to their fermentation processes and microbial spoilage. One of the objectives of the agri-food industry is to maximize the reuse of these residues that are generated during the production process, which is also of great interest in the food [12], pharmaceutical [11,12,13,14] and cosmetic industries [11,15,16].
Extracting these useful components involves the use of various extraction and analysis techniques and solvents [5,12,16,17,18,19,20,21,22], including water [23,24] and ethanol–water mixtures [25,26]. However, the use of the peels in food use, commonly in pieces or powder, involves the extraction of the components in water, or sometimes in alcohol, when wine, beer or spirits are added to the food. In addition to the flavor and aroma, the use of citrus peels in food provides antioxidant properties that make food healthier [13].
Citrus peels are composed of flavedo and albedo (see Figure 1) that provide large amounts of phenolics [27]. Albedo can be used by the food industry due to its physicochemical properties, particularly its water retention and swelling capacities, which increase the viscosity of food systems. However, these properties partly prevent the solubility of polyphenols. On the other hand, the culinary use of citrus peels consists mainly of flavedos.
Antioxidants constitute a relevant class of substances which protect food against the degradation caused by oxidative processes [28]. Antioxidants can be primary and chain breaking, which act by removing reactive oxygen species, or secondary and preventive, which remove oxidation promoters such as singlet oxygen, metal ions, enzymes, and others [29,30]. The term “antioxidant activity” or “antioxidant potential” refers to the antioxidant action, while “antioxidant capacity” (AOC) is the quantification of this activity.
There are a wide variety of methods able to measure total antioxidant capacity (TAC) [30,31,32,33,34,35,36]. These are based on two types of reactions: hydrogen atom transfer (HAT) and single electron transfer (SET). Most HAT methods consist of monitoring the competitive kinetics between an easily oxidized synthetic radical generator and the antioxidant, while SET methods are based on the redox behavior of the antioxidant. The cupric reducing antioxidant capacity (CUPRAC) assay is a SET method based on the reduction of the Cu(II) ion to Cu(I) in the presence of the stabilizing ligand neocuproine (2,9-dimethyl-1,10-phenanthroline) [37,38]. In a previous work [39], we reported an electrochemical SET method based on the monitorization of the Cu(II) ion reduction signal which was able to assess antioxidant activity. A combination of the HAT and SET methods is the DPPH radical scavenging assay, which is based on the UV spectroscopic detection of the reaction of the synthetic radical 2,2-diphenyl-1-picrylhydrazyl with an antioxidant [29,32,33]. This means that CUPRAC and eCUPRAC evaluate the antioxidant activity only through the oxidation–reduction reaction of the Cu(0)/Cu(I) redox couple, while the DPPH assay includes the redox reaction of the DPPH radical together with the reaction of the abstraction of a hydrogen atom from this radical. Therefore, the measured antioxidant capacities correspond to different processes and are not necessarily the same.
The aim of this paper was to assess and discuss the antioxidant activity of the extracts of flavedos of different peels in both aqueous and ethanolic media.

2. Materials and Methods

2.1. Reagents and Solvents

Chemicals used were of at least analytical quality. 2,2-Diphenyl-1-picrylhydrazyl (DPPH), free radical (95%), neocuproin (98%), CuCl2 (99%), Cu(NO3)2 (98%) and gallic acid (99.8%) were supplied by Sigma-Aldrich. Ethanol (99.8%) was acquired from Merck. Ammonium acetate (98%), phosphoric acid (85%), and sodium hydroxide (≥97%, pellets) were from Sigma-Aldrich. The water used was from a Millipore system (16.3 MΩ·cm at 25 °C).

2.2. Citrus Samples

Bergamot (Citrus aurantium bergamia), kumquat (Fortunella japonica), faustrime lime (Citrus australasica), sudachi (Citrus sudachi), yuzu (Citrus junos) and tahitian lime (Citrus latifolia) were purchased from Citrus & Life (Castellón, Spain), whereas lime (Citrus aurantifolia), mandarin (Citrus reticulata) and lemon (Citrus limon) were purchased from the local market of Mercado Sánchez Peña, GPS: 37.883110, −4.774552 (Córdoba, Spain). Bitter oranges (Citrus aurantium amara) were obtained from the trees of the campus of Córdoba University, GPS: 37.915352, −4.717281.

2.3. Instruments

A double-beam spectrophotometer from Perkin-Elmer (model Lambda 750S) was used for UV measurements. Hanna cuvettes of 1 cm path length were used and the absorbances were measured at room temperature.
An Autolab PGSTAT101 equipped with NOVA 1.10 software and thermostated glass cells of 15 mL volume were used for the electrochemical measurements with a GCE (IJCambria) glassy carbon electrode (geometrical area of 7.5 mm2) as the working electrode, a Metrohm Ag|AgCl|KCl 3 m (model 6.0733.100) as the reference electrode and a platinum rod as the auxiliary electrode. To prevent undesired reactions on the electrode caused by oxygen, a stream of purified nitrogen was passed for 10–12 min through the solutions.

2.4. Experimental Procedures

All the following assays were made in triplicate. Standard deviations ranged from 0.1 to 0.2 for Cuprac and e-Cuprac and from 0.2 to 0.3 for DPPH, as indicated in the tables. For all antioxidant assays, gallic acid was used as a positive control.
The procedure for the preparation of the extracts took into account the extraction conditions given in the references [24,26], and was completed as follows: the entire fruit was washed with Milli-Q water and dried. Once the peel was separated from the fruit, the albedo was carefully separated from the flavedo, manually. The flavedo was minced manually and then 4 g of the sample was ground into a mortar. Then, 20 mL of ultrapure water preheated at 90 °C (or pure ethanol at 65 °C) was added and the suspension was stirred with a vortex at 300 r.p.m. for 5 min at room temperature, and centrifuged for 15 min at 3600 r.p.m. Then, the supernatant was filtered through a 0.45 µm nylon syringe filter. The assays were made with fresh extracts.
The protocol for the CUPRAC assay was as follows: all samples were made with 1 mL of 1 M ammonium acetate buffer at pH 5.5 (adjusted with NaOH). In all cases, the whole volume was 4.1 mL. Next, 1 mL of a 0.01 M CuCl2 aqueous solution and 1 mL of a 7.5 mM neocuproine solution in ethanol were added, as well as variable volumes of test solutions, to reach different concentrations (0.01, 0.02, 0.03, 0.05, 0.1, 0.2, 0.3, 0.50 mg/mL). Water was added to complete the 4.1 mL. A 2.5 × 10⁻⁴ M gallic acid solution was used for the calibration curve which allowed us to measure the values of the antioxidant capacities in the gallic acid equivalents. After incubation in the dark for 60 min, the UV-Vis spectra were recorded at room temperature and the absorbance was measured at 450 nm. A blank assay was used to correct the possible matrix effect.
DPPH is an assay based on the decrease in the UV-vis band of the DPPH radical in the region of 515 to 518 nm. This decrease is due to a radical scavenging reaction with the tested antioxidant. The IC50 is the amount of antioxidant capable of decreasing the concentration of DPPH radical to 50% of the initial value. ARP, or anti-radical power, is the inverse of IC50, and measures the antioxidant capacity. The protocol for this assay was as follows: variable volumes of extracts were added to 9 mL of a 0.56 mM DPPH solution in methanol, and water was added to complete the solution to 10 mL. At least eight solutions of extracts were used in the range of 0.01 mg/mL to 1 mg/mL The samples, including a water blank solution, were incubated for 90 min at 25 °C in the dark. The final DPPH concentrations were obtained from the absorbance at 517 nm. The calibration range was 0.2–10 mg L−1 of gallic acid (R2 = 0.987). The DPPH values were expressed as mg gallic acid equivalents/g of fresh weight by using this calibration. From the variation of the absorbance with the antioxidant concentration, the IC50 was measured.
The protocol for the eCUPRAC assay was as follows [39]: the glassy carbon electrode was immersed in 1:3 diluted chromic mixture for 30 s, to remove organic matter. The electrode was immersed in 1:3 diluted aqua regia for another 30 s to remove traces of metallic copper. Milli-Q water was used to clean the electrode surface and then it was successively polished with diamond paste (0.25 µm) and alumina slurries of 0.3 and 0.05 µm, and sonicated for 3 min in a water bath to remove alumina residues. Copper was electrodeposited at −0.3 V using a solution that was 1 × 10⁻³ M of Cu(NO3)2 and 0.5 M of HNO3. From the decrease in the intensity of the voltammetric reduction peak of Cu(II) in PBS buffer at pH 7.0, the AOC of the antioxidant in mg gallic acid/g of fresh weight was obtained.
The protocol for the Folin–Ciocalteu (FC) assay was as follows: 100 µL of sample was mixed with 250 µL FC reagent. After a vigorous agitation, the mixture was left to settle for 1 min and 1 mL of 15% (w/v) sodium carbonate aqueous solution and 1 mL Milli-Q water were added. After another shaking, the reaction was developed for 2 h and the absorbance at 760 nm was recorded. The reagent blank was the reference. TPC was expressed as mg gallic acid/g of fresh weight, and the calibration range was from 1 to 100 mg L−1 gallic acid (R2 = 0.975).
Ascorbic acid content was obtained using a standard addition method described in [40]. Figure 2 shows an example for the ethanolic extract of bitter orange. Then, 1 mL of extract was added to 39 mL of PBS buffer at pH 7.0, and the voltammogram was recorded. Different peaks corresponding to ascorbic acid and polyphenols could be seen. The figure shows only the potential region where the ascorbic acid signal appeared. Varying volumes of 1.5 g/L ascorbic acid solution were then added successively, and peak current was plotted against the resulting concentration of ascorbic acid in ppm. The extrapolation to the abscissa axis gave the ascorbic acid content.

3. Results and Discussion

The results obtained for the different samples are gathered in Table 1 and Table 2.
As can be seen, ethanolic extracts contained less ascorbic acid than the aqueous extracts due to the lower solubility of this species in ethanol than in water. On the contrary, the Folin values of the ethanolic extracts were higher than those of the aqueous extracts, indicating, in principle, that the polyphenol content was higher for the ethanolic extracts. This follows from the different polarity of the polyphenolic compounds, allowing the extraction of compounds of low polarity in ethanol and of high polarity in water, the first group being more abundant than the last group.
The values of the AOC increased, in general, with the FC, as can be seen in Figure 3. CUPRAC and eCUPRAC showed good correlations with Folin, as can be seen in Table 3. The R2 values obtained for DPPH indicate that there was no correlation between the AOC obtained with this assay and the FC. Moreover, the antioxidant capacity had good correlation with the FC, which contained the contributions of both polyphenols and ascorbic acid, provided that the assay assessed the antioxidant activity of the sample occurring through the mechanism tested.
It is widely accepted that FC corresponds to polyphenol content. Taking into account the different mechanisms of the assays, noted in the introduction, these results could mean that the polyphenols extracted from the flavedos had antioxidant activities that occurred through SET mechanisms, rather than SET + HAT mechanisms. Nevertheless, the presence of significant amounts of ascorbic acid implies that the FC was due not only to polyphenols, but also to the contribution of the ascorbic acid [41]. This is also true for the AOC measured by the different assays. The antioxidant capacity of ascorbic acid decreases slightly in water, and this compound is more inclined to the HAT [42], or HAT + SET [43] mechanisms. This has not been taken into account in the research on the AOC and polyphenol content of flavedos reported in the literature [44,45]; however, the combined effect of ascorbic acid and polyphenol is discussed in these references.
For this reason, if an interpretation of the role of polyphenols is intended, the results must be corrected with the ascorbic acid contents.
To obtain the FC values corresponding to the polyphenols, the contribution of ascorbic acid to these values was estimated using the following methodology, based on that given in [41]. Folin assays were performed with ascorbic acid solutions of a concentration range of 100 ppm to 2000 ppm. FC values varied linearly with the ascorbic acid concentration. From these assays, the FC values corresponding to ascorbic acid in this concentration range were obtained. This factor and the ascorbic acid content were used to subtract the contribution of ascorbic acid to the FC to give a “Corrected FC” value, which corresponded to the polyphenol content, usually known as “TP”.
On the other hand, the AOCs of the ascorbic acid, in terms of gallic acid equivalent, were known for each assay. So, the relative AOCs of gallic to ascorbic acid were 1.8 for CUPRAC [39], 1.9 for DPPH [46], and 1.9 for eCUPRAC [39]. The AOC values were corrected by using these factors and the ascorbic acid content was expressed as mg gallic acid/g of fresh weight.
Figure 4 shows the dependence of the corrected antioxidant capacities (AOCs*) with the corrected FC values.
As in the case of the preceding section, CUPRAC* and eCUPRAC* showed good correlations with the corrected FC values, as can be seen in Table 4. Additionally, as for the crude results, there was no correlation for the DPPH* values, which was concluded from the R2 values of the correlations.
The flavonoid content in citrus juice was less than 1% of the total polyphenols, while for peels this content was greater than 90% [47]. The main flavonoids found in citrus fruits are hesperidin, narirutin, naringin, and eriocitrin [10]. In wines, flavonoids are the most important group found, especially flavanols, which are mainly composed of catechin, epicatechin, epigallocatechin, epicatechin 3-O-gallate, and proanthocyanidins [48].
FC is well correlated with the DPPH found in wines, as has been found in many published works, for example, in [49]. This indicates that the polyphenols found in wines exert their antioxidant activity through a SET + HAT mechanism. Nevertheless, works studying citrus peels report values that do not show any correlation between FC and DPPH as, for example, in [50]. So, in this case, it can be stated that the polyphenols extracted from the flavedos had antioxidant activities that occurred through SET mechanisms, rather than SET + HAT mechanisms.
The relative antioxidant capacity of the polyphenols extracted in water and in ethanol can be explored by computing the quotient of the corrected AOC values by the corrected FC. As can be seen in Figure 5, the relative values of AOC obtained in water were, in general, higher than those obtained for the extracts in ethanol.
This can be justified by assuming that polyphenols extracted in water, which have high polarities, are better antioxidants than those with lower polarity extracted in ethanol.

4. Conclusions

The polyphenols extracted from the flavedos were found to have antioxidant activities that occurred through single-electron (SET) transfer mechanisms, rather than SET+ hydrogen atom transfer mechanisms. To assess the relationship between AOC and polyphenol content, both FC and AOC should be corrected by subtracting the contribution of ascorbic acid. High-polarity polyphenols extracted in water are better antioxidants than those with lower polarity extracted in ethanol.

Author Contributions

Methodology, J.M.R.M.; investigation, M.T.M.; writing—original draft preparation, J.M.R.M.; writing—review and editing, J.M.R.M. and M.T.M.; supervision, J.M.R.M. All authors have read and agreed to the published version of the manuscript.

Funding

This research was funded by Operative Framework Funding FEDER-Andalucía 2014–2020, UCO-1263679, and Junta de Andalucía, PAIDI-FQM-198.

Institutional Review Board Statement

Not applicable.

Informed Consent Statement

Not applicable.

Data Availability Statement

Not applicable.

Conflicts of Interest

The authors declare no conflict of interest. The funders had no role in the design of the study; in the collection, analyses, or interpretation of data; in the writing of the manuscript, or in the decision to publish the results.

References

  1. Liu, Y.; Heying, E.; Tanumihardjo, S.A. History, global distribution and nutritional importance of citrus fruits. Com. Rev. Food Sci. Food Saf. 2012, 11, 530–545. [Google Scholar] [CrossRef]
  2. European Commission DG Agri G2. Vol 01-Production. The Citrus Market in the EU: Production, Areas and Yields. Available online: https://ec.europa.eu/info/sites/default/files/food-farming-fisheries/farming/documents/citrus-production_en.pdf (accessed on 18 November 2021).
  3. AIJN-European Fruit Juice Association. AIJN Liquid Fruit Market Report. Available online: https://aijn.eu/en/publications/market-reports-1/20199 (accessed on 21 February 2022).
  4. González-Molina, E.; Domínguez-Perles, R.; Moreno, D.A.; García-Viguera, C. Natural bioactive compounds of Citrus limon for food and health. J. Pharm. Biomed. Anal. 2010, 51, 327–345. [Google Scholar] [CrossRef] [PubMed]
  5. Hou, H.S.; Bonku, E.M.; Zhai, R.; Zeng, R.; Hou, Y.L.; Yang, Z.H.; Quan, C. Extraction of essential oil from Citrus reticulate Blanco peel and its antibacterial activity against Cutibacterium acnes (formerly Propionibacterium acnes). Helion 2019, 5, e02947. [Google Scholar] [CrossRef] [Green Version]
  6. Czech, A.; Malik, A.; Sosnowska, B.; Domaradzki, P. Bioactive Substances, Heavy Metals, and Antioxidant Activity in Whole Fruit, Peel, and Pulp of Citrus Fruits. Int. J. Food Sci. 2021, 2021, 6662259. [Google Scholar] [CrossRef] [PubMed]
  7. Peterson, J.J.; Dwyer, J.T.; Beecher, G.R.; Bhagwat, S.A.; Gebhardt, S.E.; Haytowitz, D.B.; Holden, J.M. Flavanones in oranges, tangerines (mandarins), tangors, and tangelos: A compilation and review of the data from the analytical literature. J. Food Compos. Anal. 2006, 19, S66–S73. [Google Scholar] [CrossRef]
  8. Castro-Vázquez, L.; Alañón, M.; Rodríguez-Robledo, V.; Pérez-Coello, M.S.; Hermosín-Gutierrez, I.; Díaz-Maroto, M.C.; Jordán, J.; Galindo, M.; Arroyo-Jiménez. M. Bioactive Flavonoids, Antioxidant Behaviour, and Cytoprotective Effects of Dried Grapefruit Peels (Citrus paradisi Macf.). Oxid. Med. Cell Longev. 2016, 1, 8915729. [Google Scholar] [CrossRef] [Green Version]
  9. Pontifex, M.G.; Malik, M.M.A.H.; Connell, E.; Müller, M.; Vauzou, D. Citrus Polyphenols in Brain Health and Disease: Current Perspectives. Front. Neurosci. 2021, 15, 640648. [Google Scholar] [CrossRef]
  10. Addi, M.; Elbouzidi, A.; Abid, M.; Tungmunnithum, D.; Elamrani, A.; Hano, C. An Overview of Bioactive Flavonoids from Citrus Fruits. Appl. Sci. 2022, 12, 29. [Google Scholar] [CrossRef]
  11. Varmie, E.B.; Thakur, M. Utilization of citrus processing waste: A review. Pharm. Inn. J. 2021, 10, 682–697. [Google Scholar]
  12. Dassoff, E.S.; Guo, J.X.; Liu, Y.; Wang, S.C.; Li, Y.O. Potential development of non-synthetic food additives from orange processing by-products—A review. Food Qual. Saf. 2021, 5, fyaa035. [Google Scholar] [CrossRef]
  13. Irfan, S.; Ranjha, M.; Mahmood, S.; Saeed, W.; Alam, M. Lemon Peel: A Natural Medicine. Int. J. Biotech. Allied Fields 2019, 7, 185–194. [Google Scholar]
  14. Shehata, M.G.; Awad, T.S.; Asker, D.; El Sohaimy, S.A.; Abd El-Aziz, N.M.; Youssef, M.M. Antioxidant and antimicrobial activities and UPLC-ESI-MS/MS polyphenolic profile of sweet orange peel extracts. Curr. Res. Food Sci. 2021, 4, 326–335. [Google Scholar] [CrossRef] [PubMed]
  15. Burnett, C.L.; Bergfeld, W.F.; Belsito, D.W.; Hill, R.A.; Klaassen, C.D.; Liebler, C.; Marks, J.G.; Shank, R.C.; Slaga, T.J.; Snyder, P.W.; et al. Safety Assessment of Citrus Peel-Derived Ingredients as Used in Cosmetics. Int. J. Toxicol. 2021, 40 (Suppl. S3), 77S–99S. [Google Scholar] [CrossRef]
  16. Khang, D.T.; Tien, L.T.T.; Men, T.T.; Thuy, N.P. Potential of Fermented Fruit Peel Liquid in Cosmetics as a Skin Care Agent. Cosmetics 2021, 8, 33. [Google Scholar] [CrossRef]
  17. Park, J.-H.; Lee, M.; Park, E. Antioxidant Activity of Orange Flesh and Peel Extracted with Various Solvents. Prev. Nutr. Food Sci. 2014, 19, 291–298. [Google Scholar] [CrossRef] [PubMed] [Green Version]
  18. Mehmood, T.; Khan, M.R.; Shabbir, M.A.; Zia, M.A. Phytochemical profiling and HPLC quantification of citrus peel from different varieties. Progr. Nutr. 2018, 20, 279–288. [Google Scholar] [CrossRef]
  19. Nipornram, S.; Tochampa, W.; Rattanatraiwong, P.; Singanusong, R. Optimization of low power ultrasound-assisted extraction of phenolic compounds from mandarin (Citrus reticulata Blanco cv. Sainampueng) peel. Food Chem. 2018, 241, 338–345. [Google Scholar] [CrossRef]
  20. Imran, M.; Basharat, S.; Khalid, S.; Aslam, M.; Syed, F.; Jabeen, S.; Kamran, H.; Shahid, M.Z.; Tufail, T.; Shah, F.; et al. Citrus peel polyphenols: Recent updates and perspectives. Int. J. Biosci. 2020, 16, 53–70. [Google Scholar] [CrossRef]
  21. Gao, X.; Xu, D.; Zhang, X.; Zhao, H. Protective Effect of Lemon Peel Polyphenols on Oxidative Stress-Induced Damage to Human Keratinocyte HaCaT Cells Through Activation of the Nrf2/HO-1 Signaling Pathway. Front. Nutr. 2021, 7, 606776. [Google Scholar] [CrossRef]
  22. Abou Baker, D.H.; Ibrahim, E.A.; Salama, Z. Citrus Peels as a Source of Bioactive Compounds with Industrial and Therapeutic Applications. In Phenolic Compounds—Chemistry, Synthesis, Diversity, Non-Conventional Industrial, Pharmaceutical and Therapeutic Applications; Badria, F.A., Ed.; IntechOpen: London, UK, 2021; pp. 1–13. [Google Scholar] [CrossRef]
  23. Chen, X.-N.; Tait, A.R.; Kitts, D.D. Flavonoid composition of orange peel and its association with antioxidant and anti-inflammatory activities. Food Chem. 2017, 218, 15–21. [Google Scholar] [CrossRef]
  24. Montenegro-Landívar, M.F.; Tapia-Quirós, P.; Vecino, X.; Reig, M.; Valderrama, C.; Granados, M.; Cortina, J.L.; Saurina, J. Recovery of Added-Value Compounds from Orange and Spinach Processing Residues: Green Extraction of Phenolic Compounds and Evaluation of Antioxidant Activity. Antioxidants 2021, 10, 1800. [Google Scholar] [CrossRef] [PubMed]
  25. Olfa, T.; Gargouri, M.; Akrouti, A.; Brits, A.; Gargouri, M.; Ben Ameur, R.; Pieters, L.; Fourbet, K.; Magné, C.; Soussi, A.; et al. A comparative study of physichochemical investigation and antioxidative activities of six citrus peel species. Flavour. Frag. J. 2021, 36, 564–575. [Google Scholar] [CrossRef]
  26. Gómez-Mejía, E.; Rosales-Conrado, N.; León-González, M.E.; Madrid, Y. Citrus peels waste as a source of value-added compounds: Extraction and quantification of bioactive polyphenols. Food Chem. 2019, 295, 289–299. [Google Scholar] [CrossRef]
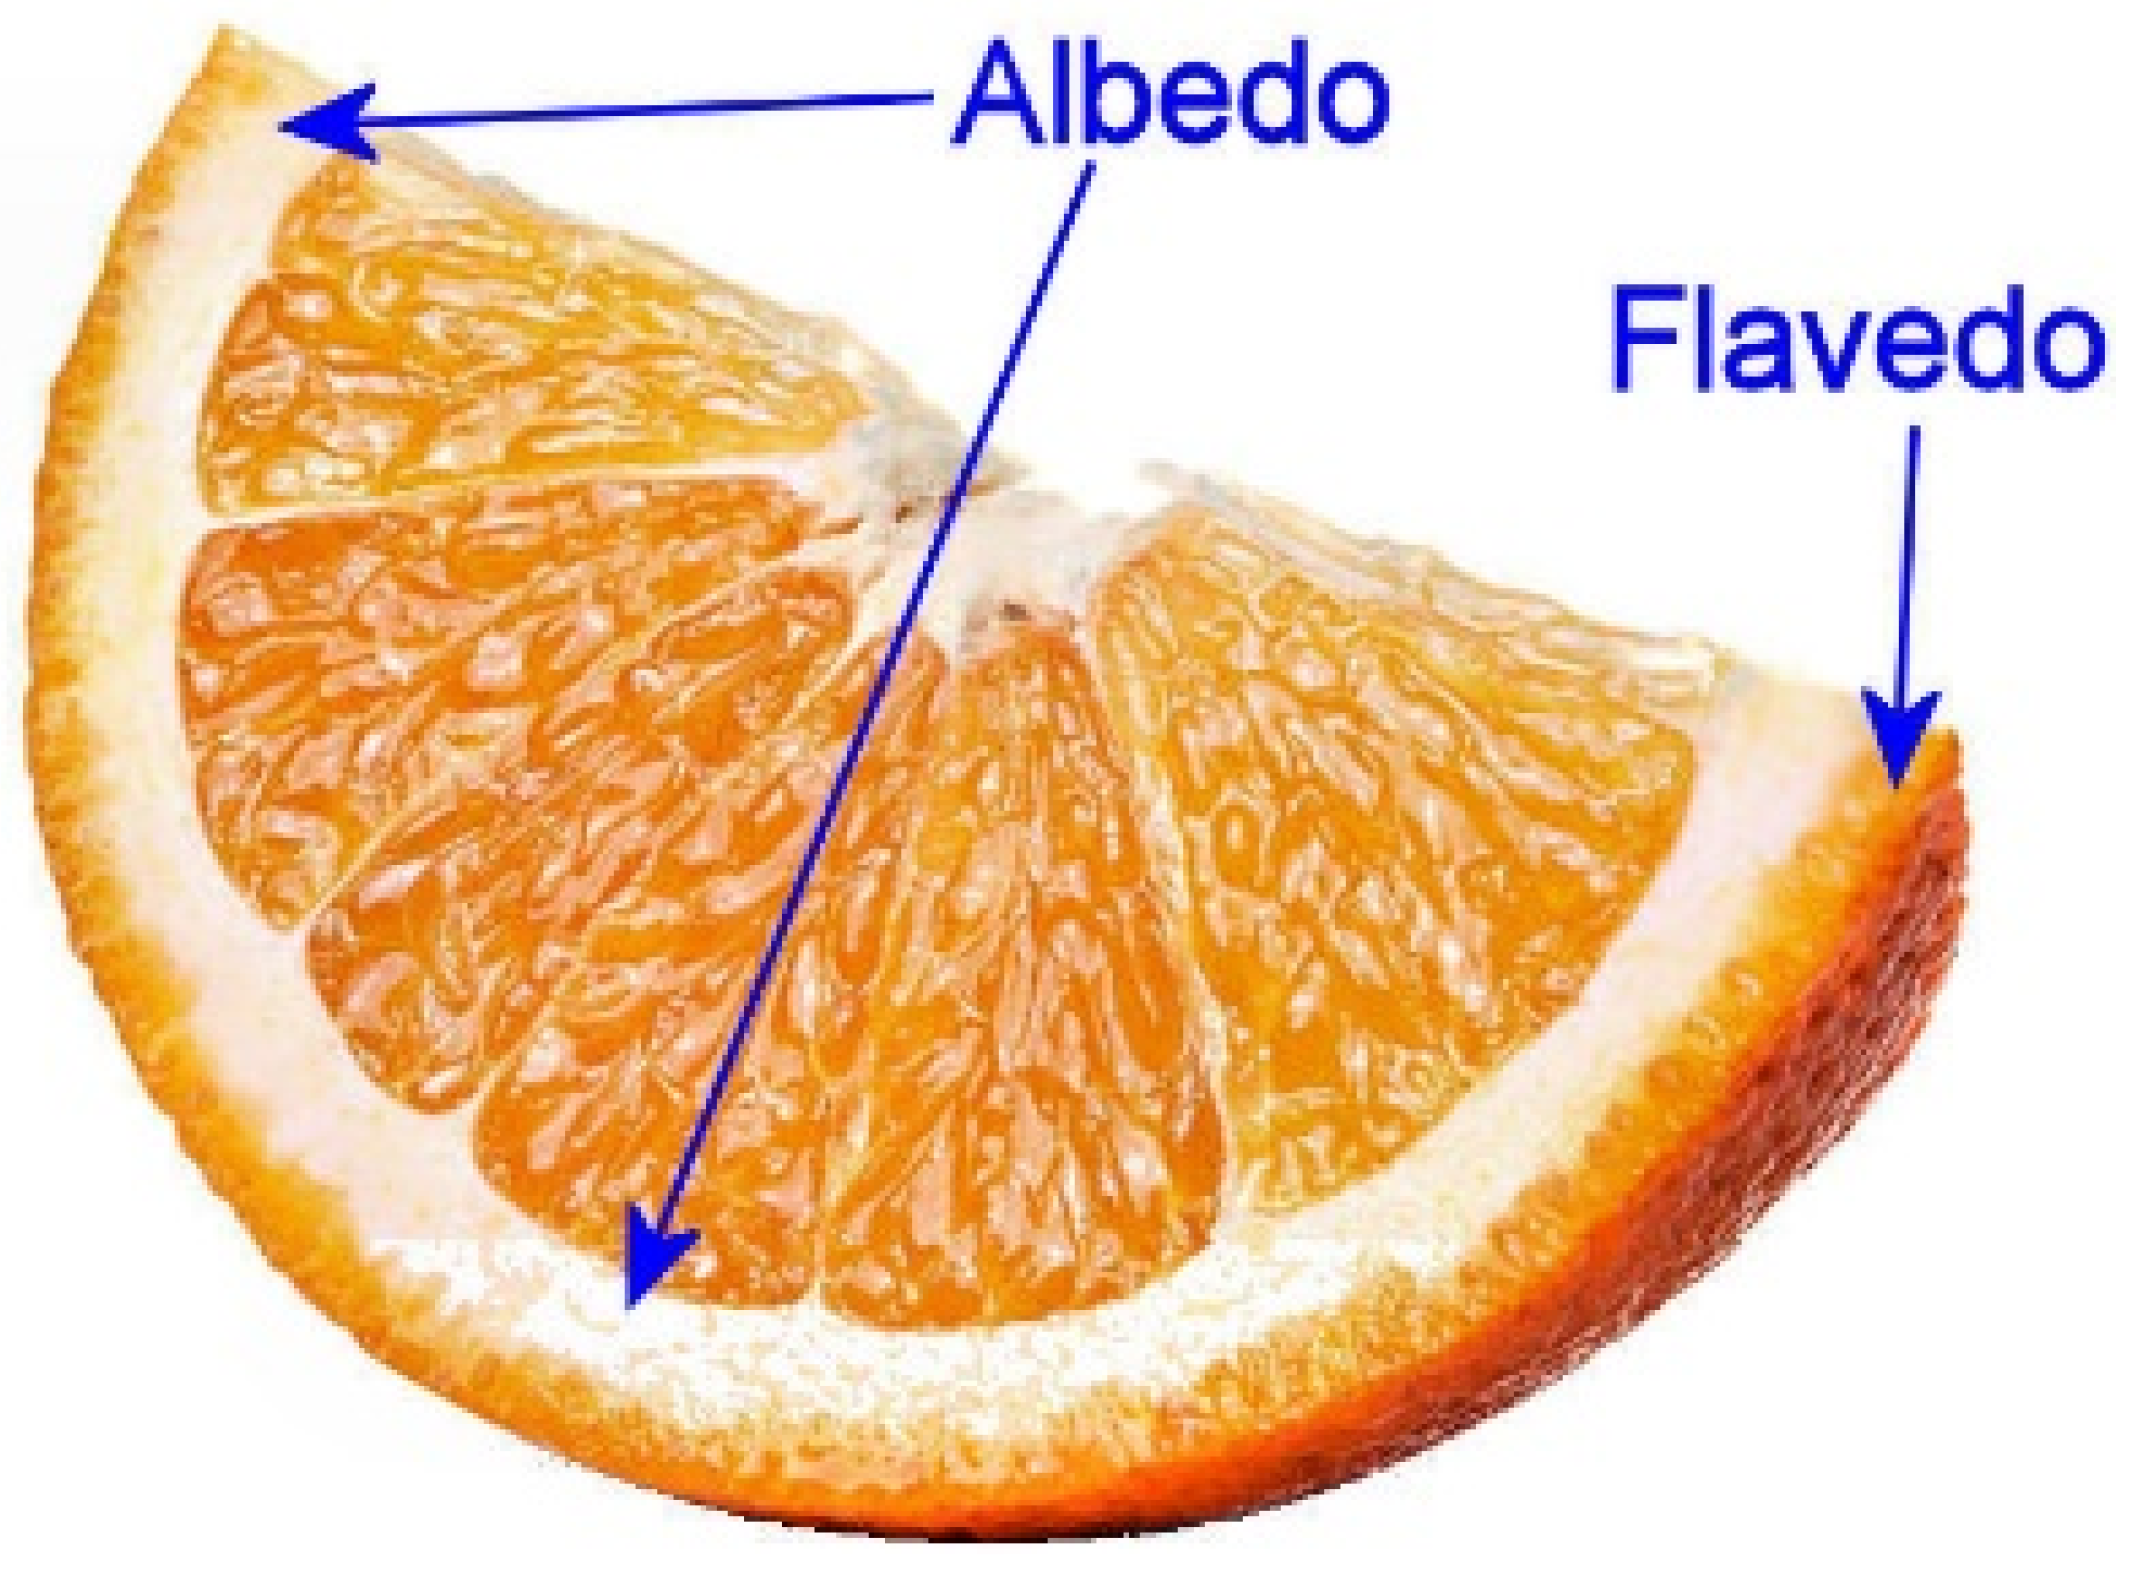
  27. Multari, S.; Licciardello, C.; Anesi, A. Flavedo and albedo of five citrus fruits from Southern Italy: Physicochemical characteristics and enzyme-assisted extraction of phenolic compounds. J. Food Meas. Charact. 2021, 15, 1754–1762. [Google Scholar] [CrossRef]
  28. Poljsak, B.; Kovac, V.; Milisav, I. Antioxidants, Food Processing and Health. Antioxidants 2021, 10, 433. [Google Scholar] [CrossRef]
  29. Flieger, J.; Flieger, W.; Baj, J.; Maciejewski, R. Antioxidants: Classification, Natural Sources, Activity/Capacity Measurements, and Usefulness for the Synthesis of Nanoparticles. Materials 2021, 14, 4135. [Google Scholar] [CrossRef]
  30. Danet, A.F. Recent Advances in Antioxidant Capacity Assays. In Antioxidants—Benefits, Sources, Mechanisms of Action; Waisundara, V.Y., Ed.; IntechOpen: London, UK, 2021; pp. 1–17. [Google Scholar] [CrossRef]
  31. Gupta, S.; Finelli, R.; Agarwal, A.; Henkel, R. Total antioxidant capacity-Relevance, methods and clinical implications. Andrologia 2021, 53, e13624. [Google Scholar] [CrossRef] [PubMed]
  32. Sadeer, N.B.; Montesano, D.; Albrizio, S.; Zengin, G.; Mahomoodally, M.F. The Versatility of Antioxidant Assays in Food Science and Safety-Chemistry, Applications, Strengths, and Limitations. Antioxidants 2020, 9, 709. [Google Scholar] [CrossRef] [PubMed]
  33. Ivanova, A.; Gerasimova, E.; Gazizullina, E. Study of Antioxidant Properties of Agents from the Perspective of Their Action Mechanisms. Molecules 2020, 25, 4251. [Google Scholar] [CrossRef]
  34. Gulcin, İ. Antioxidants and antioxidant methods: An updated overview. Arch. Toxicol. 2020, 94, 651–715. [Google Scholar] [CrossRef] [Green Version]
  35. Munteanu, G.; Apetrei, C. Analytical Methods Used in Determining Antioxidant Activity: A Review. Int. J. Mol. Sci. 2021, 22, 3380. [Google Scholar] [CrossRef] [PubMed]
  36. Apak, R.; Ozyurek, M.; Guclu, K.; Çapanoglu, E. Antioxidant Activity/Capacity Measurement. 1. Classification, Physicochemical Principles, Mechanisms, and Electron Transfer (ET)-Based Assays. J. Agric. Food Chem. 2016, 64, 997–1027. [Google Scholar] [CrossRef] [PubMed]
  37. Apak, R.; Capanoglu, E.; Shahidi, F. (Eds.) Measurement of Antioxidant Activity & Capacity: Recent Trends and Applications, 1st ed.; Wiley: Chichester, UK, 2018. [Google Scholar]
  38. Bayarsaikhan, G.; Bayarsaikhan, D.; Oh, P.C.; Kang, W.C.; Lee, B. CUPRAC-Reactive Advanced Glycation End Products as Prognostic Markers of Human Acute Myocardial Infarction. Antioxidants 2021, 10, 434. [Google Scholar] [CrossRef] [PubMed]
  39. Moreno, M.T.; Rodríguez Mellado, J.M.; Medina, A. Rapid electrochemical determination of antioxidant capacity using glassy carbon electrodes modified with copper and polyaniline. Application to ascorbic and gallic acids. Biointerface Res. Appl. Chem. 2023, 13, 23. [Google Scholar] [CrossRef]
  40. Moreno, M.T.; Estévez Brito, R.; Córdoba, M.; Rodríguez Mellado, J.M. A simple and rapid electrochemical determination of pungency: Application to aqueous and ethanolic extracts of Capsicum annuum cubana red. J. Chem. Res. 2021, 45, 111–115. [Google Scholar] [CrossRef]
  41. Cortez, J.D.; Faicán, M.A.; Pirovani, M.A.; Piagentini, A.M. Determination of polyphenols in fruits with added vitamin C: Methodology to improve the specificity of the FolinCiocalteu test. Rev. Iberoam. Tecnol. Postcosecha 2018, 19, 148–158. [Google Scholar]
  42. Liu, Y.; Liu, C.; Li, J. Comparison of Vitamin C and Its Derivative Antioxidant Activity: Evaluated by Using Density Functional Theory. ACS Omega 2020, 5, 25467–25475. [Google Scholar] [CrossRef]
  43. Pandithavidana, D.R.; Jayawardana, S.B. Comparative Study of Antioxidant Potential of Selected Dietary Vitamins; Computational Insights. Molecules 2019, 24, 1646. [Google Scholar] [CrossRef] [Green Version]
  44. Escobedo-Avellaneda, Z.; Gutiérrez-Uribe, J.; Valdez-Fragoso, A.; Torres, J.A.; Welti-Chanes, J. Phytochemicals and antioxidant activity of juice, flayed, albedo and comminuted orange. J. Functional Foods. 2014, 6, 470–481. [Google Scholar] [CrossRef]
  45. Muzykiewicz, A.; Zielonka-Brzezicka, J.; Klimowicz, A. The antioxidant potential of flesh, albedo and flavedo extracts from different varieties of grapefruits. Acta Sci. Pol. Technol. Aliment. 2019, 18, 453–462. [Google Scholar] [CrossRef]
  46. Moreno, M.T.; Estévez Brito, R.; Rodríguez Mellado, J.M. Modified CUPRAC method with electrochemical detection for the determination of antioxidant capacity of gallic acid. C. R. Chim. 2020, 23, 395–401. [Google Scholar] [CrossRef]
  47. Irkin, R.; Dogan, S.; Degirmenioglu, N.; Diken, M.E.; Guldas, M. Phenolic content, antioxidant activities and stimulatory roles of citrus fruits on some lactic acid bacteria. Arch. Biol. Sci. 2015, 67, 1313–1321. [Google Scholar] [CrossRef]
  48. Nemzer, B.; Kalita, D.; Yashin, A.Y.; Yashin, Y.I. Chemical Composition and Polyphenolic Compounds of Red Wines: Their Antioxidant Activities and Effects on Human Health—A Review. Beverages 2022, 8, 1. [Google Scholar] [CrossRef]
  49. Danilewicz, J.C. The Folin-Ciocalteu, FRAP, and DPPH Assays for Measuring Polyphenol Concentration in White Wine. Am. J. Enol. Vitic. 2015, 66, 463–471. [Google Scholar] [CrossRef]
  50. Ordóñez-Gómez, E.S.; Reátegui-Díaz, D.; Villanueva-Tiburcio, J.E. Total polyphenols and antioxidant capacity of peel and leaves in twelve citrus. Sci. Agropecu. 2018, 9, 123–131. [Google Scholar] [CrossRef] [Green Version]
Figure 1. Parts of citrus peel.
Oxygen 02 00009 g001
Figure 2. Ethanolic extract of bitter orange. Differential pulse voltammograms. Pulse amplitude —0.05 V; pulse time—20 ms. Initial potential—0 V. Background—0.1 M PBS buffer at pH 7 (39 mL). The quantities indicated in the graph are µL of 1.5 g/L ascorbic acid solution. Inset—plot of peak current vs. ppm ascorbic acid added.
Oxygen 02 00009 g002
Figure 3. Dependence of antioxidant capacities (AOCs) with the Folin values. Quantities are given in mg gallic acid/g of fresh weight. (a) Water extracts; (b) ethanolic extracts.
Oxygen 02 00009 g003
Figure 4. Dependence of corrected antioxidant capacities (AOC*) with the corrected Folin values. Quantities are given in mg gallic acid/g of fresh weight. The ascorbic acid contribution was subtracted from the original values. (a) Water extracts; (b) ethanolic extracts.
Oxygen 02 00009 g004
Figure 5. Relative antioxidant capacities for water and ethanolic extracts.
Oxygen 02 00009 g005
Table 1. Results obtained for the aqueous extracts of the flavedos.
SampleFC 1Ascorbic Acid 2CUPRAC 1DPPH 1eCUPRAC 1
Bergamot0.8019881.33 ± 0.121.74 ± 0.232.06 ± 0.18
Faustrime lime0.8859631.84 ± 0.190.78 ± 0.201.93 ± 0.19
Kumquat0.3754330.6 ± 0.110.39 ± 0.190.87 ± 0.15
Lima1.08512951.76 ± 0.171.99 ± 0.272.36 ± 0.17
Tahitian lime0.8258271.71 ± 0.180.41 ± 0.221.87 ± 0.18
Lemon0.6257340.91 ± 0.140.98 ± 0.251.32 ± 0.16
Mandarin0.7859091.43 ± 0.160.40 ± 0.201.94 ± 0.19
Bitter orange1.20314051.89 ± 0.181.54 ± 0.302.42 ± 0.22
Sudachi1.12512232.23 ± 0.211.19 ± 0.292.30 ± 0.19
Yuzu0.5856691.2 ± 0.120.42 ± 0.211.68 ± 0.18
1 mg gallic acid/g of fresh weight. 2 ppm.
Table 2. Results obtained for the ethanolic extracts of the flavedos.
SampleFC 1Ascorbic Acid 2CUPRAC 1DPPH 1e-CUPRAC 1
Bergamot2.3002762.89 ± 0.192.12 ± 0.222.97 ± 0.21
Faustrime lime1.2355741.52 ± 0.161.75 ± 0.261.70 ± 0.14
Kumquat0.8351790.94 ± 0.151.65 ± 0.240.89 ± 0.14
Lima1.2356601.69 ± 0.161.94 ± 0.282.01 ± 0.19
Tahitian lime2.2606833.10 ± 0.222.61 ± 0.272.75 ± 0.18
Lemon1.4853941.39 ± 0.122.59 ± 0.271.50 ± 0.20
Mandarin1.8854661.87 ± 0.141.89 ± 0.231.98 ± 0.19
Bitter orange2.0656172.64 ± 0.182.1 ± 0.252.73 ± 0.22
Sudachi2.6257233.34 ± 0.215.18 ± 0.323.48 ± 0.20
Yuzu1.7503942.63 ± 0.213.9 ± 0.292.20 ± 0.18
1 mg gallic acid/g of fresh weight. 2 ppm.
Table 3. Correlation of the data shown in Figure 3.
MethodWater Extracts Ethanolic Extracts
InterceptSlopeR2InterceptSlopeR2
CUPRAC0.037 ± 0.2331.751 ± 0.2700.9166–0.198 ± 0.3291.357 ± 0.1780.8789
DPPH–0.289 ± 0.5411.536 ± 0.6210.42920.487 ± 1.0441.182 ± 0.5660.3524
eCUPRAC0.414 ± 0.1911.761 ± 0.2210.8883–0.051 ± 0.2971.285 ± 0.1610.8886
Table 4. Correlations of the data shown in Figure 4.
MethodWater Extracts Ethanolic Extracts
InterceptSlopeR2InterceptSlopeR2
CUPRAC–0.014 ± 0.1284.346 ± 0.5290.8939–0.040± 0.3131.359 ± 0.2040.8480
DPPH0.305 ± 0.5260.866 ± 2.1780.51820.835 ± 0.9611.196 ± 0.6250.3138
eCUPRAC0.631 ± 0.2283.331 ± 0.9460.89840.328 ± 0.3631.302 ± 0.2370.8894
Publisher’s Note: MDPI stays neutral with regard to jurisdictional claims in published maps and institutional affiliations.

