Article

Physiologically Based Pharmacokinetic Modelling of UGT Substrate Drugs Lamotrigine and Raltegravir during Pregnancy

Clinical Pharmacology and Quantitative Pharmacology, Biopharmaceuticals R&D, AstraZeneca, Cambridge CB1 9JS, UK
*
Author to whom correspondence should be addressed.
Future Pharmacol. 2024, 4(2), 317-335; https://doi.org/10.3390/futurepharmacol4020018
Submission received: 25 January 2024 / Revised: 27 March 2024 / Accepted: 1 April 2024 / Published: 10 April 2024

Abstract

:
Pregnancy is associated with various physiological changes that can significantly impact the disposition of drugs. To further the insight into how pregnancy affects the pharmacokinetics of drugs at different stages, clinical studies can be simulated using Physiologically Based Pharmacokinetic modelling. PBPK modelling of drugs metabolised by Phase I enzymes (CYPs) in pregnant population models had been reported in the past, while its use in Phase II (UGTs) is not known. In this study, based on the results of a recent meta-analysis, lamotrigine (UGT1A4) and raltegravir (UGT1A1) were selected as candidate drugs, and pregnancy-specific models were developed for both using the Simcyp v.21 simulator. A middle-out strategy was used where previously published drug parameters were adapted from a minimal to a full PBPK model to allow their application for the pregnancy population models using Simcyp PBPK software. Adapted models were successfully validated against observed clinical data both qualitatively (visual overlay of plasma concentrations on graphs) and quantitatively (calculating the predicted/observed ratios for AUC, Cmax and CL as well as statistical analysis using model prediction power metrics). They were then applied to predict the PKs of both drugs in pregnancy population models. The temporal changes in maternal enzymatic activities during gestation were modelled based on in vitro data reported in literature and default relationships encoded in the Simcyp platform for UGT1A1 and UGT1A4, respectively. Our study demonstrates the successful development and validation of a PBPK model for LTG and RTG in pregnancy population models. Future work with additional UGT1A4 substrate drugs using the proposed changes in UGT1A4 activity may enable validating the pregnancy population model and its subsequent use for the prospective prediction of PK.

1. Introduction

1.1. Challenges of Medication Use in Pregnancy

The use of medications during pregnancy is often contraindicated due to ethical limitations preventing drug testing in pregnant women, who are systematically excluded from clinical trials. This happens due to concerns about exposing the mother and foetus to potentially unsafe levels of a drug, as well as practical challenges related to recruitment and follow-up. Therefore, alternative approaches such as Physiologically Based Pharmacokinetic (PBPK) modelling are becoming increasingly important to fill the knowledge gap in drug development for pregnant women [1].
Examples of chronic conditions which may require a pregnant patient to continue taking drugs during pregnancy to manage the symptoms include the following: respiratory diseases (asthma, allergies), HIV infection, epilepsy, depression, hypothyroidism, diabetes and cardiovascular diseases. Intervention may also be required if pregnancy-specific health issues (such as preeclampsia or gestational diabetes) arise. Acute problems such as nausea, common cold, migraines, infections or sleeping problems are commonly treated as well. Over 80% of pregnant women reported taking over-the-counter drugs while pregnant—vitamins and mineral supplements excluded [2].
Even though medicinal treatment is prevalent during that special time, available pregnancy clinical PK data is severely limited. The available information rarely covers all trimesters of pregnancy and provides rudimentary insight into the disposition of drugs in that special population [3]. Insufficient PK data along with limited prescribing information pose a challenge to healthcare professionals as supporting data are often scarce to inform dosing adjustments [4].

1.2. Physiological Changes during Pregnancy

The key physiological changes during pregnancy are shown in Table 1.
Briefly, these changes involve all aspects of pharmacokinetics (PKs)—absorption, distribution, metabolism, and elimination (ADME)—and can have a significant impact on the dosing requirements. An increase in cardiac output, and consequently intestinal blood flow [8], as well as decreased intestinal motility [9], can alter the absorption of orally administered drugs. The entire body composition changes during gestation, so does the extent to which a drug is distributed to tissues. Moreover, reduced plasma protein concentration and hematocrit during pregnancy cause a decrease in plasma protein binding and blood partitioning, possibly leading to a higher unbound fraction of the drug and increased tissue distribution and clearance [11].
Many of the drug metabolising enzymes from the cytochrome P450 family exhibit altered levels of activity throughout pregnancy [12]. The activity of UGT1A1 [13] and UGT1A4 [14] has been demonstrated to increase during pregnancy. The elimination of drugs is impacted by changes in kidney function during pregnancy as well as changes in the expression of reuptake transporters. Drug transporters present in kidney tubules such as organic anion transporters (OATs) [17], organic cation transporters (OCTs) and multidrug and toxin extrusion (MATE) transporters [18] also have a reported impact on drug clearance during pregnancy.

1.3. Current PBPK Modelling in Pregnancy

The need for developing accurate dosing information regarding the gestation period is recognised by regulatory agencies such as the FDA [19], EMA [20] and MHRA [21]. The general use of mathematical modelling to obtain additional information about the PK of drugs is encouraged.
PBPK is a robust mathematical approach that can be used to study the disposition of drugs, simulate clinical trials and bridge knowledge gaps. A drug’s physical and chemical properties are combined with parameters describing the demographics, anatomy, and physiology of the population in which the drug is administered. This allows one to accurately predict drug concentrations in various tissues and compartments of a body. This approach is particularly useful in pregnancy studies as it can take into account the impact of physiological changes at different stages during pregnancy to help optimise drug dosing regimens for pregnant women.
Currently, the major challenge associated with building pregnancy PBPK (pPBPK) models continues to be the limited amount of clinical data available, as predictions made by the models need to be compared with clinical observations to validate the simulations.
Based on a systematic review of 249 pharmaceutical agents [1] frequently prescribed during pregnancy, it has been found that only 74 of them possess a pPBPK model. However, the number of available pPBPK models is rapidly increasing, with 53 out 74 available pPBPK models being published within the past three years. It is noteworthy, however, that the majority (45%) of these models are for drugs primarily metabolised by the enzyme CYP3A4. Previous studies primarily concentrated on changes in the activity in CYP enzymes, with only a small proportion of the models accounting for other enzyme families such as UGTs, and hence there is need to develop pPBPK models for drugs metabolised by UGTs to support drug medication in pregnancy.

1.4. PBPK Modelling of Typical UGT Substrate Drugs Lamotrigine and Raltegravir in Pregnancy

This project was focused on developing a pPBPK model for typical UGT substrate drugs—lamotrigine and raltegravir. Both of these drugs are commonly used in pregnancy, even though their PK is expected to change. Lamotrigine is an anti-epileptic drug used to control seizures as well as a mood stabilizer used in the treatment of bipolar disorder. Raltegravir is an anti-viral drug used to manage HIV infection. Lamotrigine and raltegravir are metabolised by UGT1A4 and UGT1A1, respectively. The activity of both of those enzymes is expected to increase during pregnancy in response to changes in hormonal levels. This can lead to subtherapeutic maternal drug concentrations and consequently loss of drug efficacy and poor patient outcomes. Studies report that up to 51.3% of women on lamotrigine monotherapy experience seizures during pregnancy, suggesting poor symptom control [22]. Previously reported simpler PBPK models of lamotrigine and raltegravir with minimal distribution in body tissues were adapted to develop full PBPK models with distribution in major tissues and the foetus, validated by comparing predicted versus reported PK in normal population models before being applied to predict PK in pregnancy population models.

2. Methods

2.1. Clinical PK Data Collection

In order to collect relevant clinical studies reporting PK data, such as plasma concentration profiles, AUC, Cmax or CL data, a PubMed search was conducted for both pregnant and non-pregnant populations, focusing specifically on raltegravir and lamotrigine. After identifying the studies, concentrations were extracted from graphs using a web plot digitiser (https://automeris.io/WebPlotDigitizer/citation.html, accessed on 4 January 2024). A full list of all the clinical studies used in model validation is detailed in Table 2.
In the case of lamotrigine, clinical publications [39,40,41,42] in the literature reported apparent clearance as equal to dose/concentration. Since we were comparing our model simulations with observed reported clearances from the above publications, in order to allow a similar comparison, we followed the same approach of calculating clearance as equal to dose/concentration. It is to be noted that in the case of lamotrigine, clinical publications use apparent clearance equal to dose/concentration as a good approximation of clearance due to a rationale which is explained in the publication Polypally et al. [59]. Clinical data of lamotrigine from these publications is measured after a few days of administration and can be modelled as steady state concentrations since lamotrigine’s elimination half-life (23–37 h) is relatively long compared to dosing intervals in the majority of patients. This results in minimal changes in concentrations in the course of a day. As observed concentrations could be assumed to be at steady state and fluctuating little over the dosing interval, they could be reasonably predicted using the steady state infusion model equation below:
C o b s = D o s e R a t e C L / F
where the Dose Rate is the lamotrigine total daily dose divided by 24 h, and CL/F is the apparent clearance of lamotrigine. Hence, rearranging the above equation, the apparent clearance is
C L / F = D o s e 24 h C o b s
Apparent clearance determined this way is expressed as mg/[mg/L] and is considered a good surrogate of clearance. In our work, we used the above-mentioned apparent clearance values reported in the literature to benchmark and compare with our model-generated clearances. The model-generated clearance values are determined in the same way as Cavg/Dose, where Cavg is AUC/24 h.

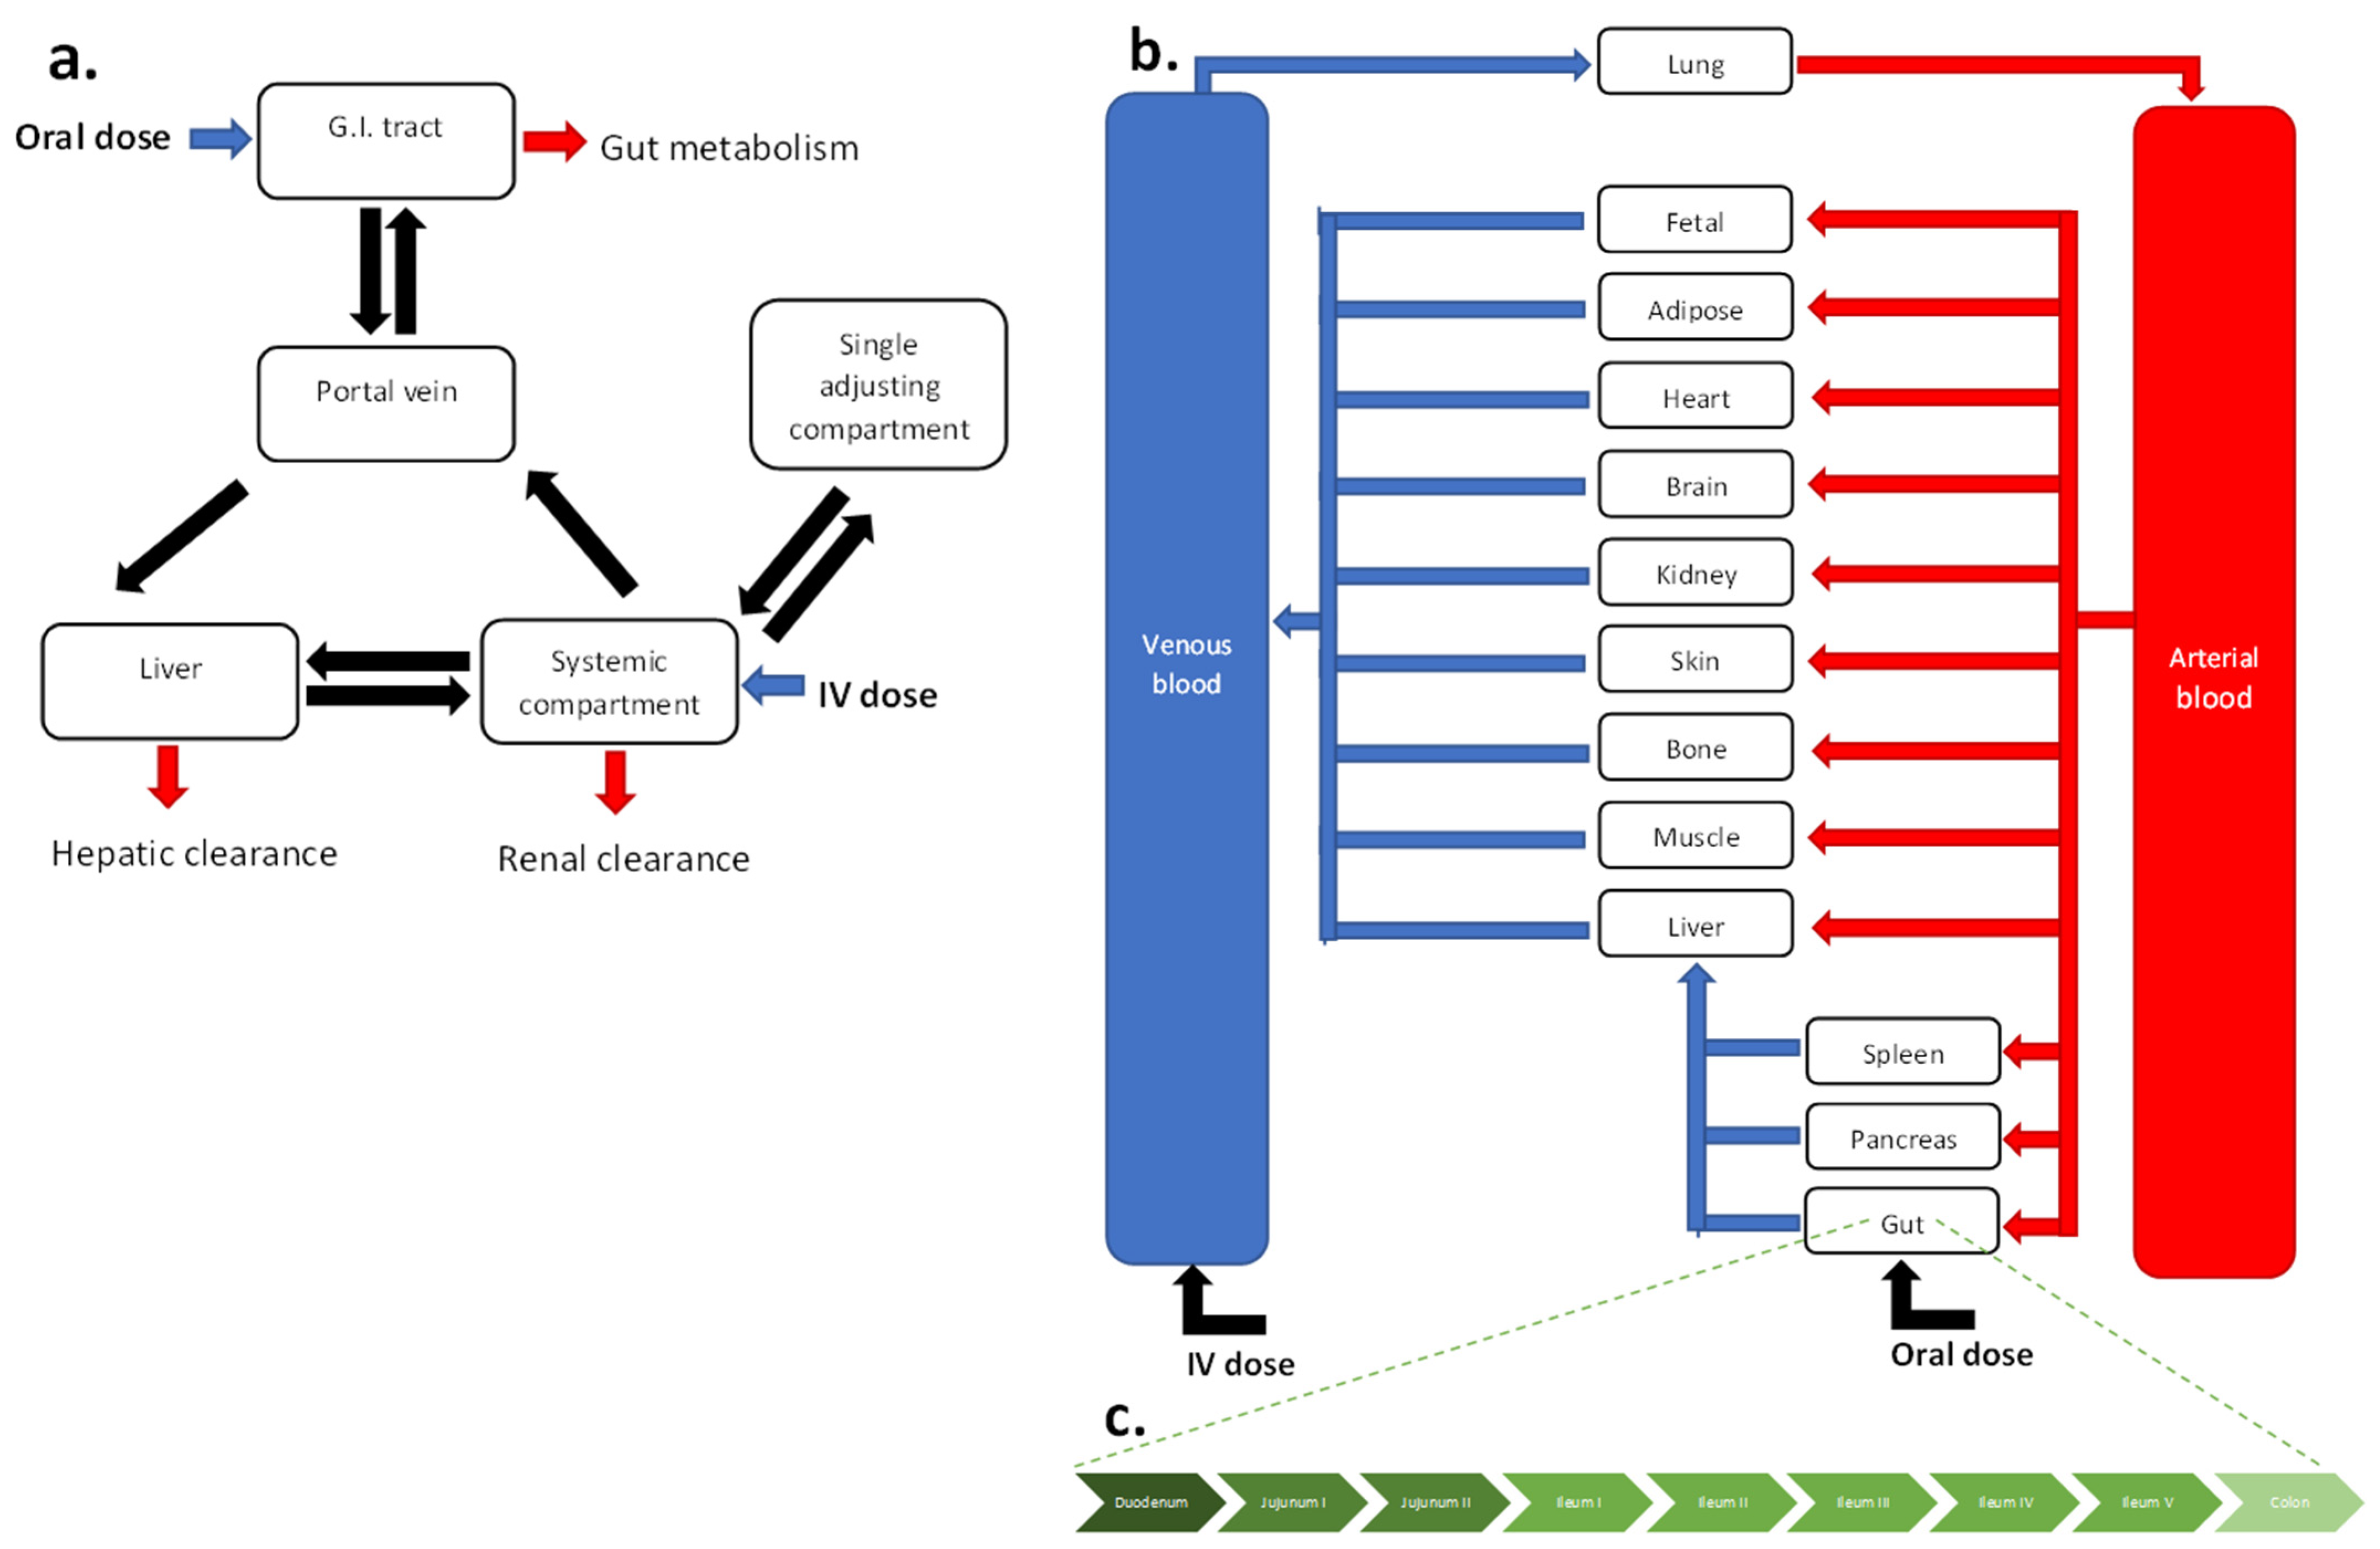
2.2. Adult Model Development

To develop PBPK models for lamotrigine and raltegravir in healthy adult populations, Simcyp v.21 (Certara UK Ltd, Sheffield, UK) was utilised for simulations. For lamotrigine, drug parameters (Table 3) were obtained from an existing minimal PBPK model [60]. A full PBPK model was optimised using the parameter estimation function to adjust the Kp scalar in order to allow its adaptation for the gestating population.
For raltegravir, compound parameters (Table 3) available in the Simcyp software compound library were utilised. Distribution parameters were updated from a minimal PBPK to a full PBPK (Figure 1) model based on Simcyp predicted values, without any further modifications to the parameters.

2.3. Adult Model Validation

For both drugs, clinical data from studies in healthy non-pregnant individuals were used to validate the models. Clinical studies were simulated, and data extracted from them were overlayed onto predictions from the simulations. PK parameters, such as AUC and Cmax, were compared for different scenarios. In the studies used, subjects were given either a single dose of 25, 100, and 200 mg of lamotrigine [23,24,25,26,27,28,29,30], or multiple doses, including a daily dose of 50, 150, and 200 mg [31,32,33], or a twice-daily dose of 50, 100, and 150 mg of lamotrigine [34,35,36,37]. In all the raltegravir clinical studies [38,39,40,41,42,43,44,45,46,47,48,49,50,51,52,53,54,55,56,57,58], participants were administered 400 mg of raltegravir either as a single dose or as a twice daily administration. Accuracy and precision in model predictions was assessed by determining statistical metrics, such as average fold error (AFE, Equation (2)) and average absolute fold error (AAFE, Equation (3)) using observed and predicted PK parameters (AUC and Cmax), respectively.
A F E = 10 1 n l o g p r e d i c t e d o b s e r v e d
A A F E = 10 1 n l o g p r e d i c t e d o b s e r v e d

2.4. Pregnancy Population Model Development
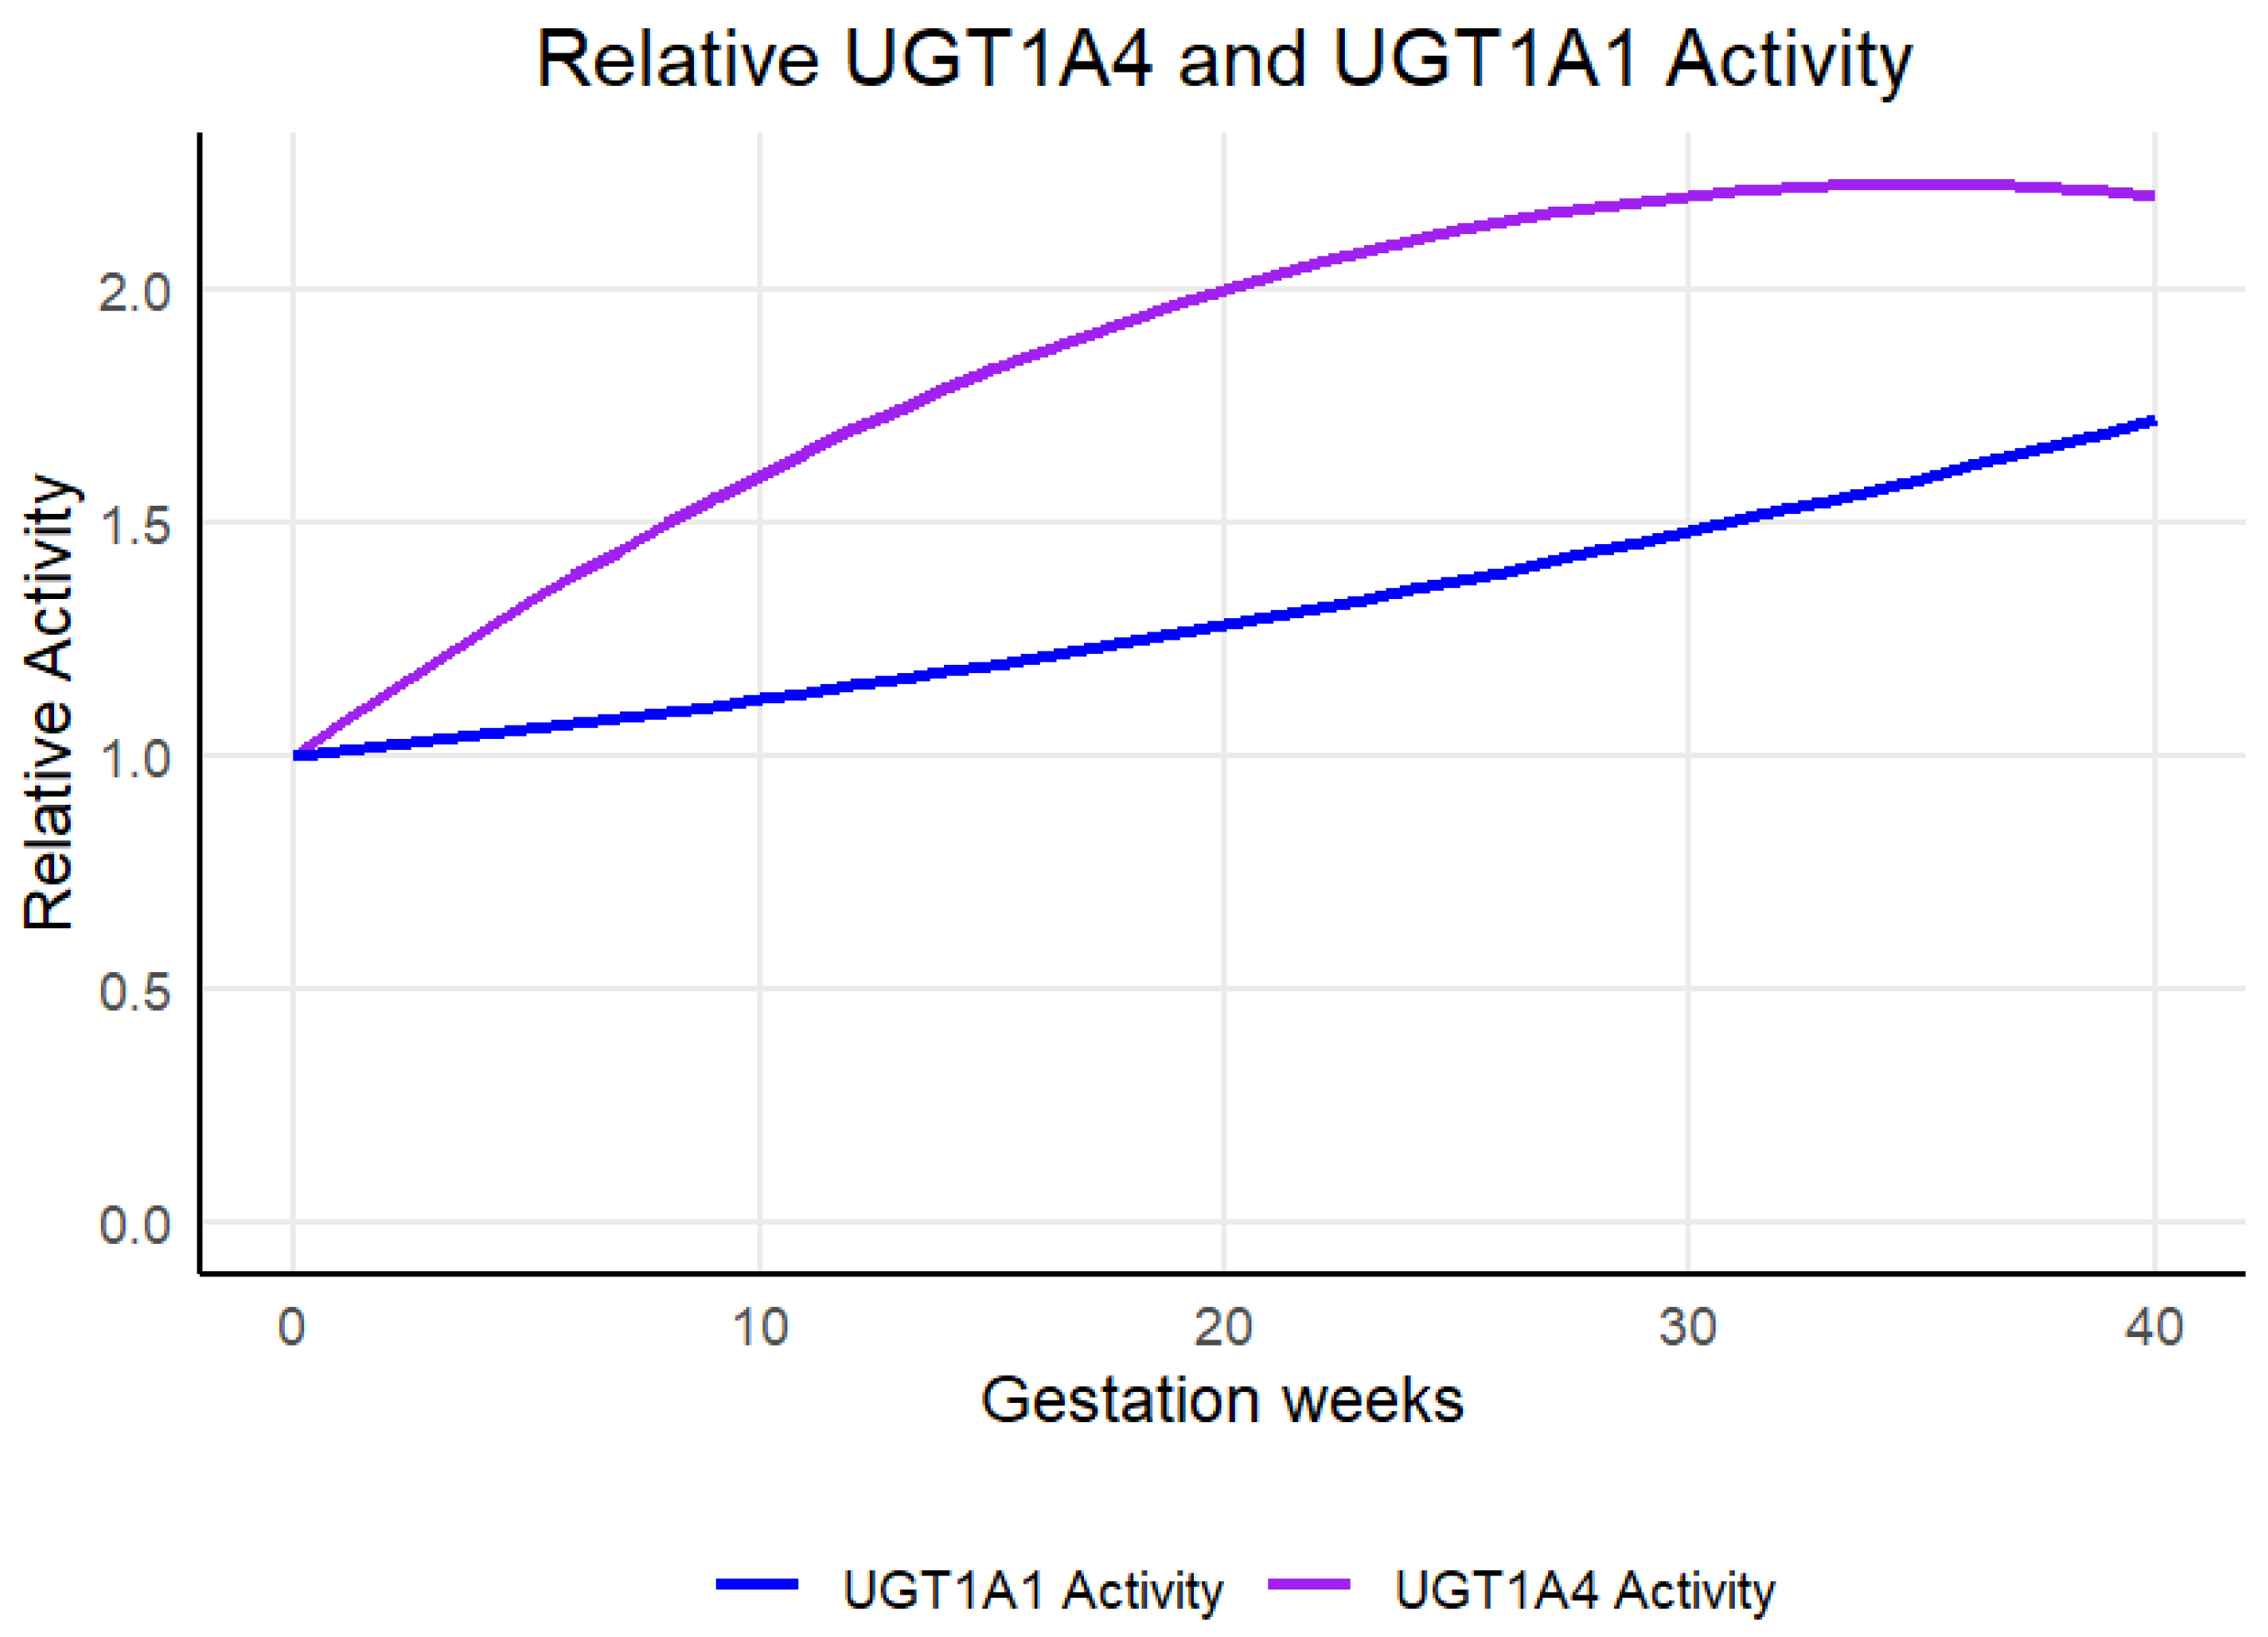
To develop a pregnancy population model for lamotrigine, temporal changes in UGT1A4 activity over the gestational period (Figure 2) were incorporated in the following mathematical expression (Equation (4)) based on an in vitro study that reported a 2.3-fold increase in the expression of endogenous mRNA expression levels of UGT1A4 by 17β-estradiol (female hormone that increases in pregnancy) [61]. UGT1A1 up-regulation was seen in progesterone-treated HEPG2 cells co-transfected with PXR as compared to control cells [62]. Progesterone treatment caused up-regulation of UGT1A in pregnant humanized UGT1A/PXR mice as opposed to pregnant humanized UGT1A mice with PXR knockout, suggesting the role of PXR activation leading to the up-regulation of UGT1A enzymes [63]. Caroline et al. [64], the authors used conjugated bilirubin concentrations in pregnant and non-pregnant women to extrapolate increases in UGT1A1 liver enzyme abundance 1.58-fold for trimester two and 1.74-fold for trimester three. The Simcyp PBPK modelling platform provides pregnancy population models with default UGT1A1 expression profiles (Figure 2), determined using Equation (4) (parameterised in Table 4), confirms most of these preclinical and clinical reports and was used in this work to model raltegravir concentrations in pregnant women.
Figure 2. Changes in UGT1A4 activity during pregnancy.
Futurepharmacol 04 00018 g002
R = G W 0 ( 1 + B 1 G W + B 2 G W 2 + B 3 G W 3 + B 4 G W 4 )
where
R = fold change in enzyme expression in pregnant versus non-pregnant population
GW0 = basal value in the prepregnant or non-pregnant state =1
GW = gestational age in weeks
B1, B2 and B3 are coefficients identified from meta-analysis of clinical and literature data.
Table 4. Details of parameters used in Equation (4) to model the changes in enzyme activity throughout pregnancy.
EnzymeB1B2B3B4
UGT1A40.07−0.00100
UGT1A10.010.000200

2.5. Predction of PK in Pregnancy Population Models

For lamotrigine, simulations were conducted based on clinical studies in all trimesters of pregnancy and postpartum. Clearance data across all three trimesters were compared [39,40,41,42], while AUC and Cmax could only be assessed at 8 months and at baseline [38].
Raltegravir clinical studies with a single dose of 400 mg were simulated in the 2nd and 3rd trimester as well as baseline. Mean predicted plasma concentrations were overlayed onto patient plasma concentration profiles [56].
For both drugs, observed and predicted percent changes in AUC, Cmax and CL were calculated. Additionally, for the lamotrigine pregnancy model, clearance AFE and AAFE were calculated, as multiple studies reporting lamotrigine clearance throughout pregnancy were used.
When pregnancy PK was assessed at either baseline or post-partum, this was set as gestational week (GW) 0 in the case of simulations.

3. Results

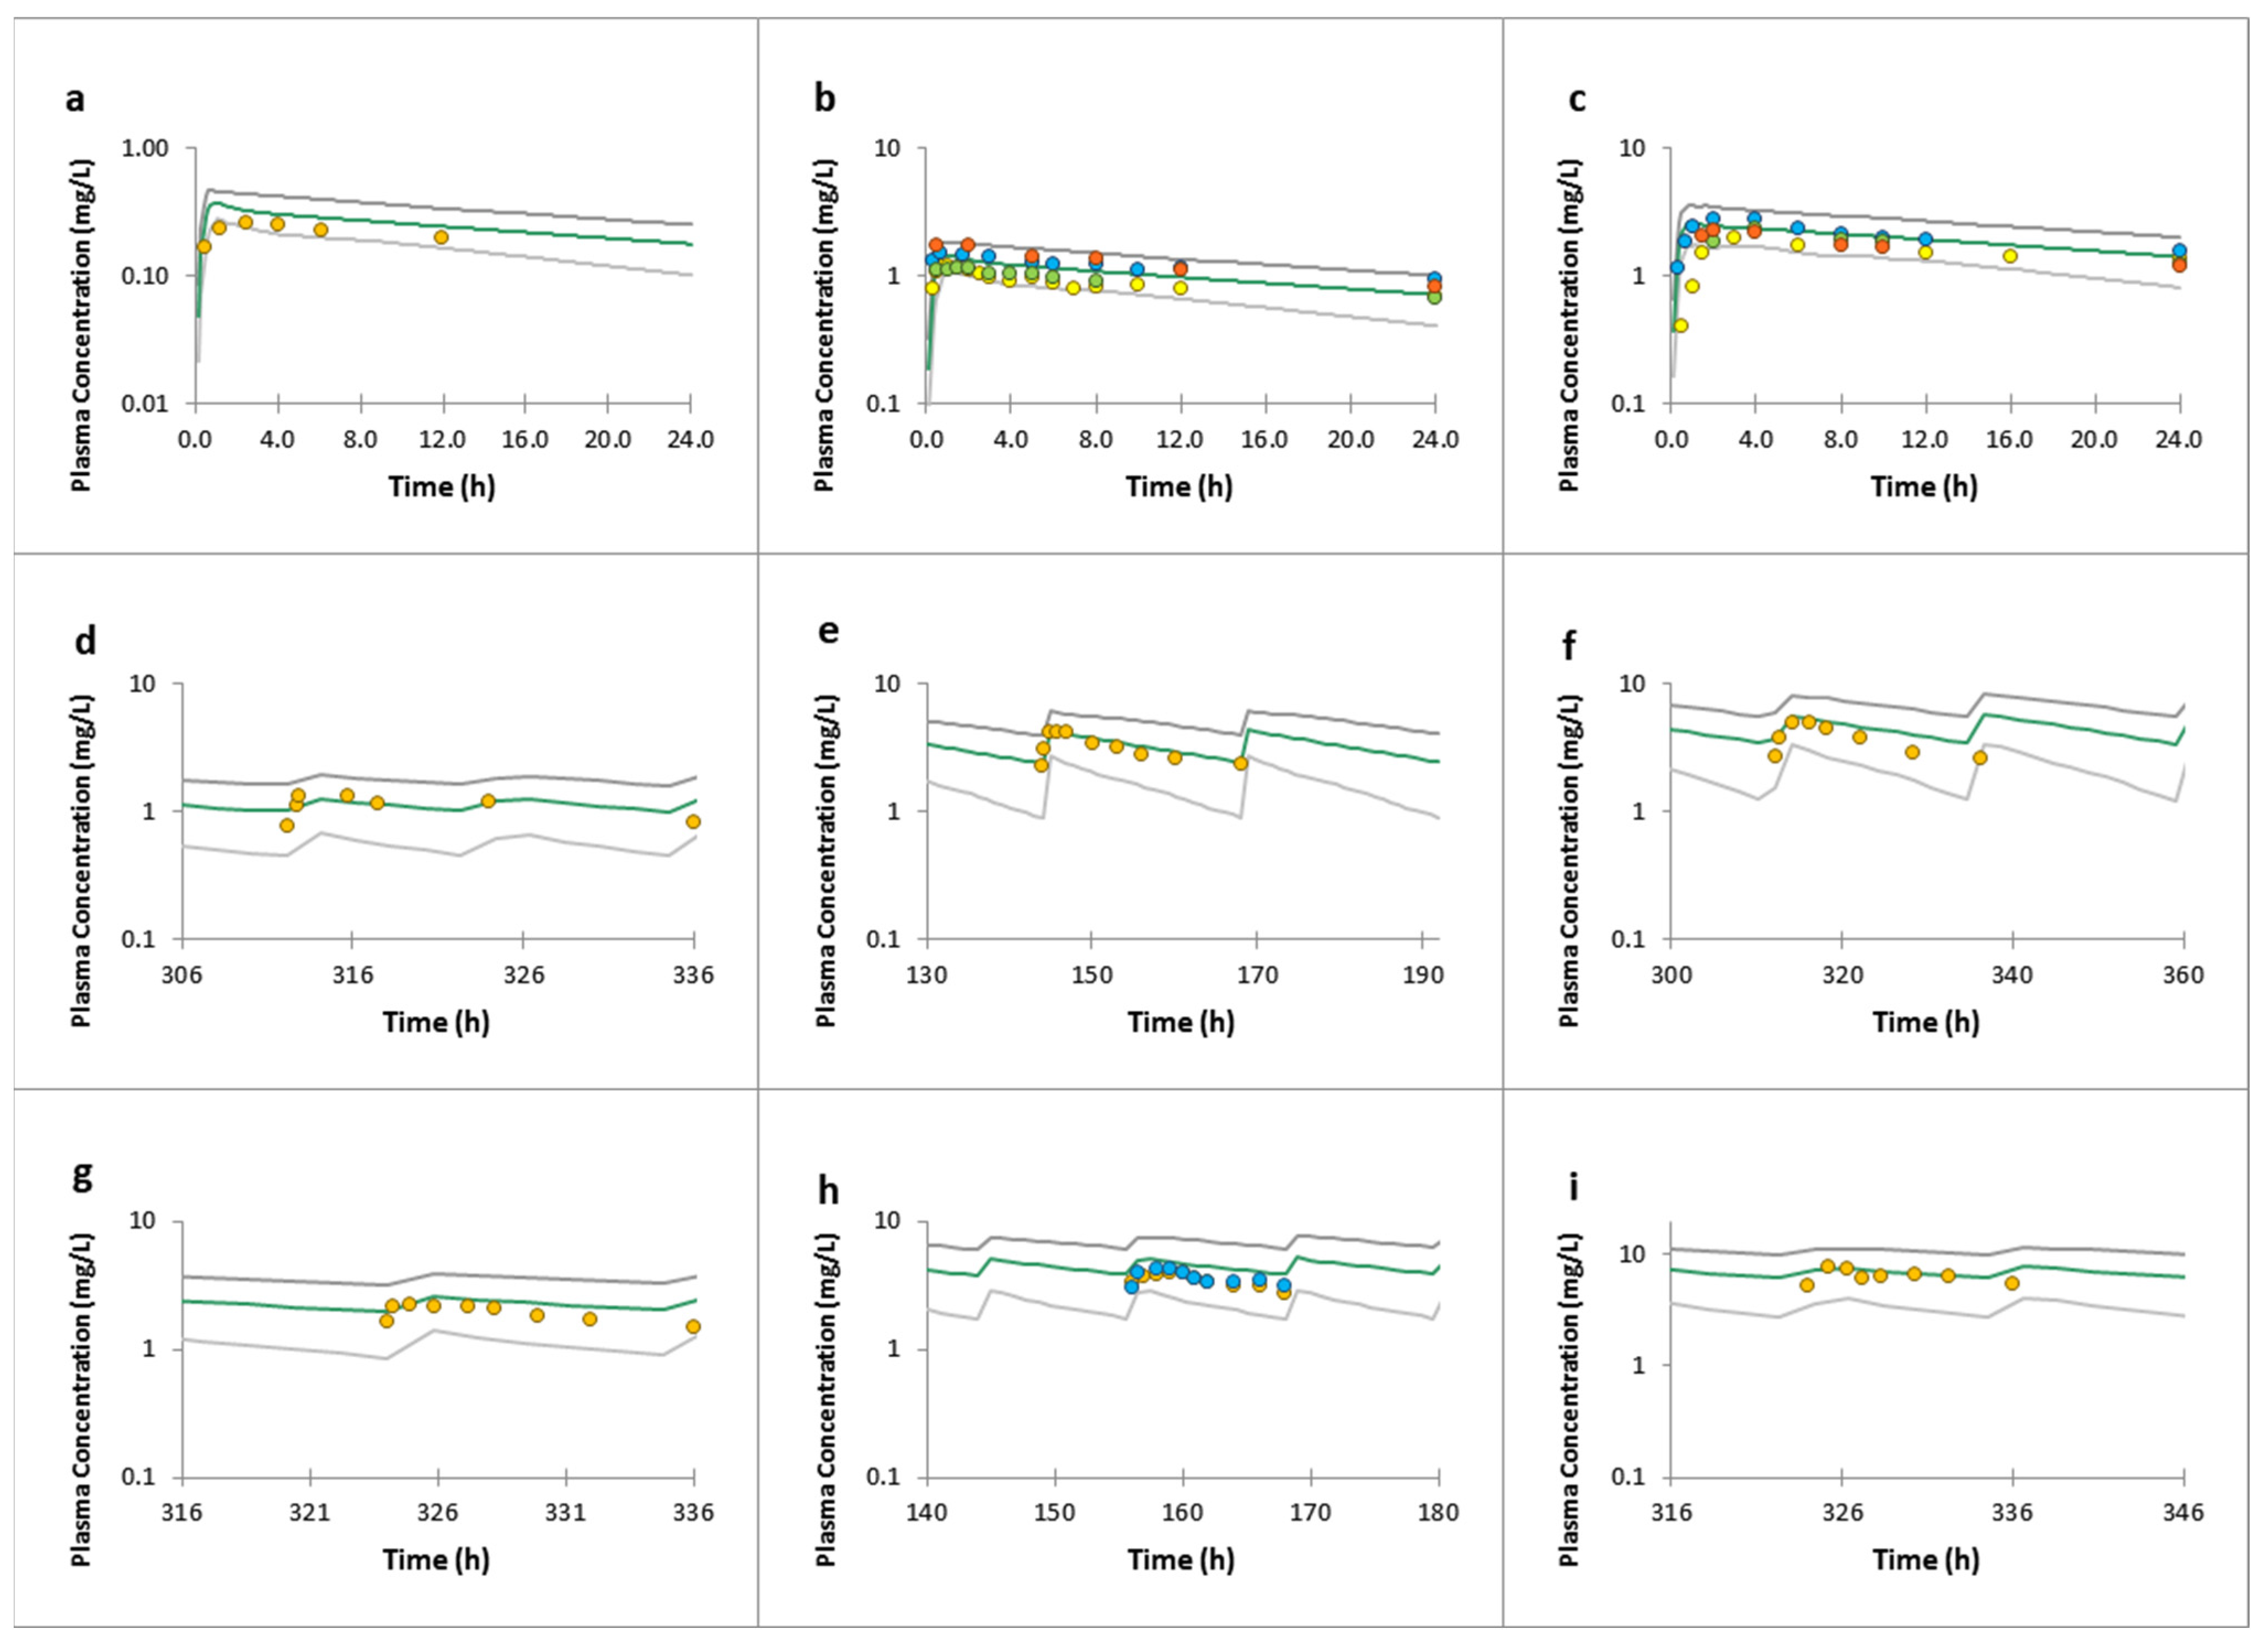
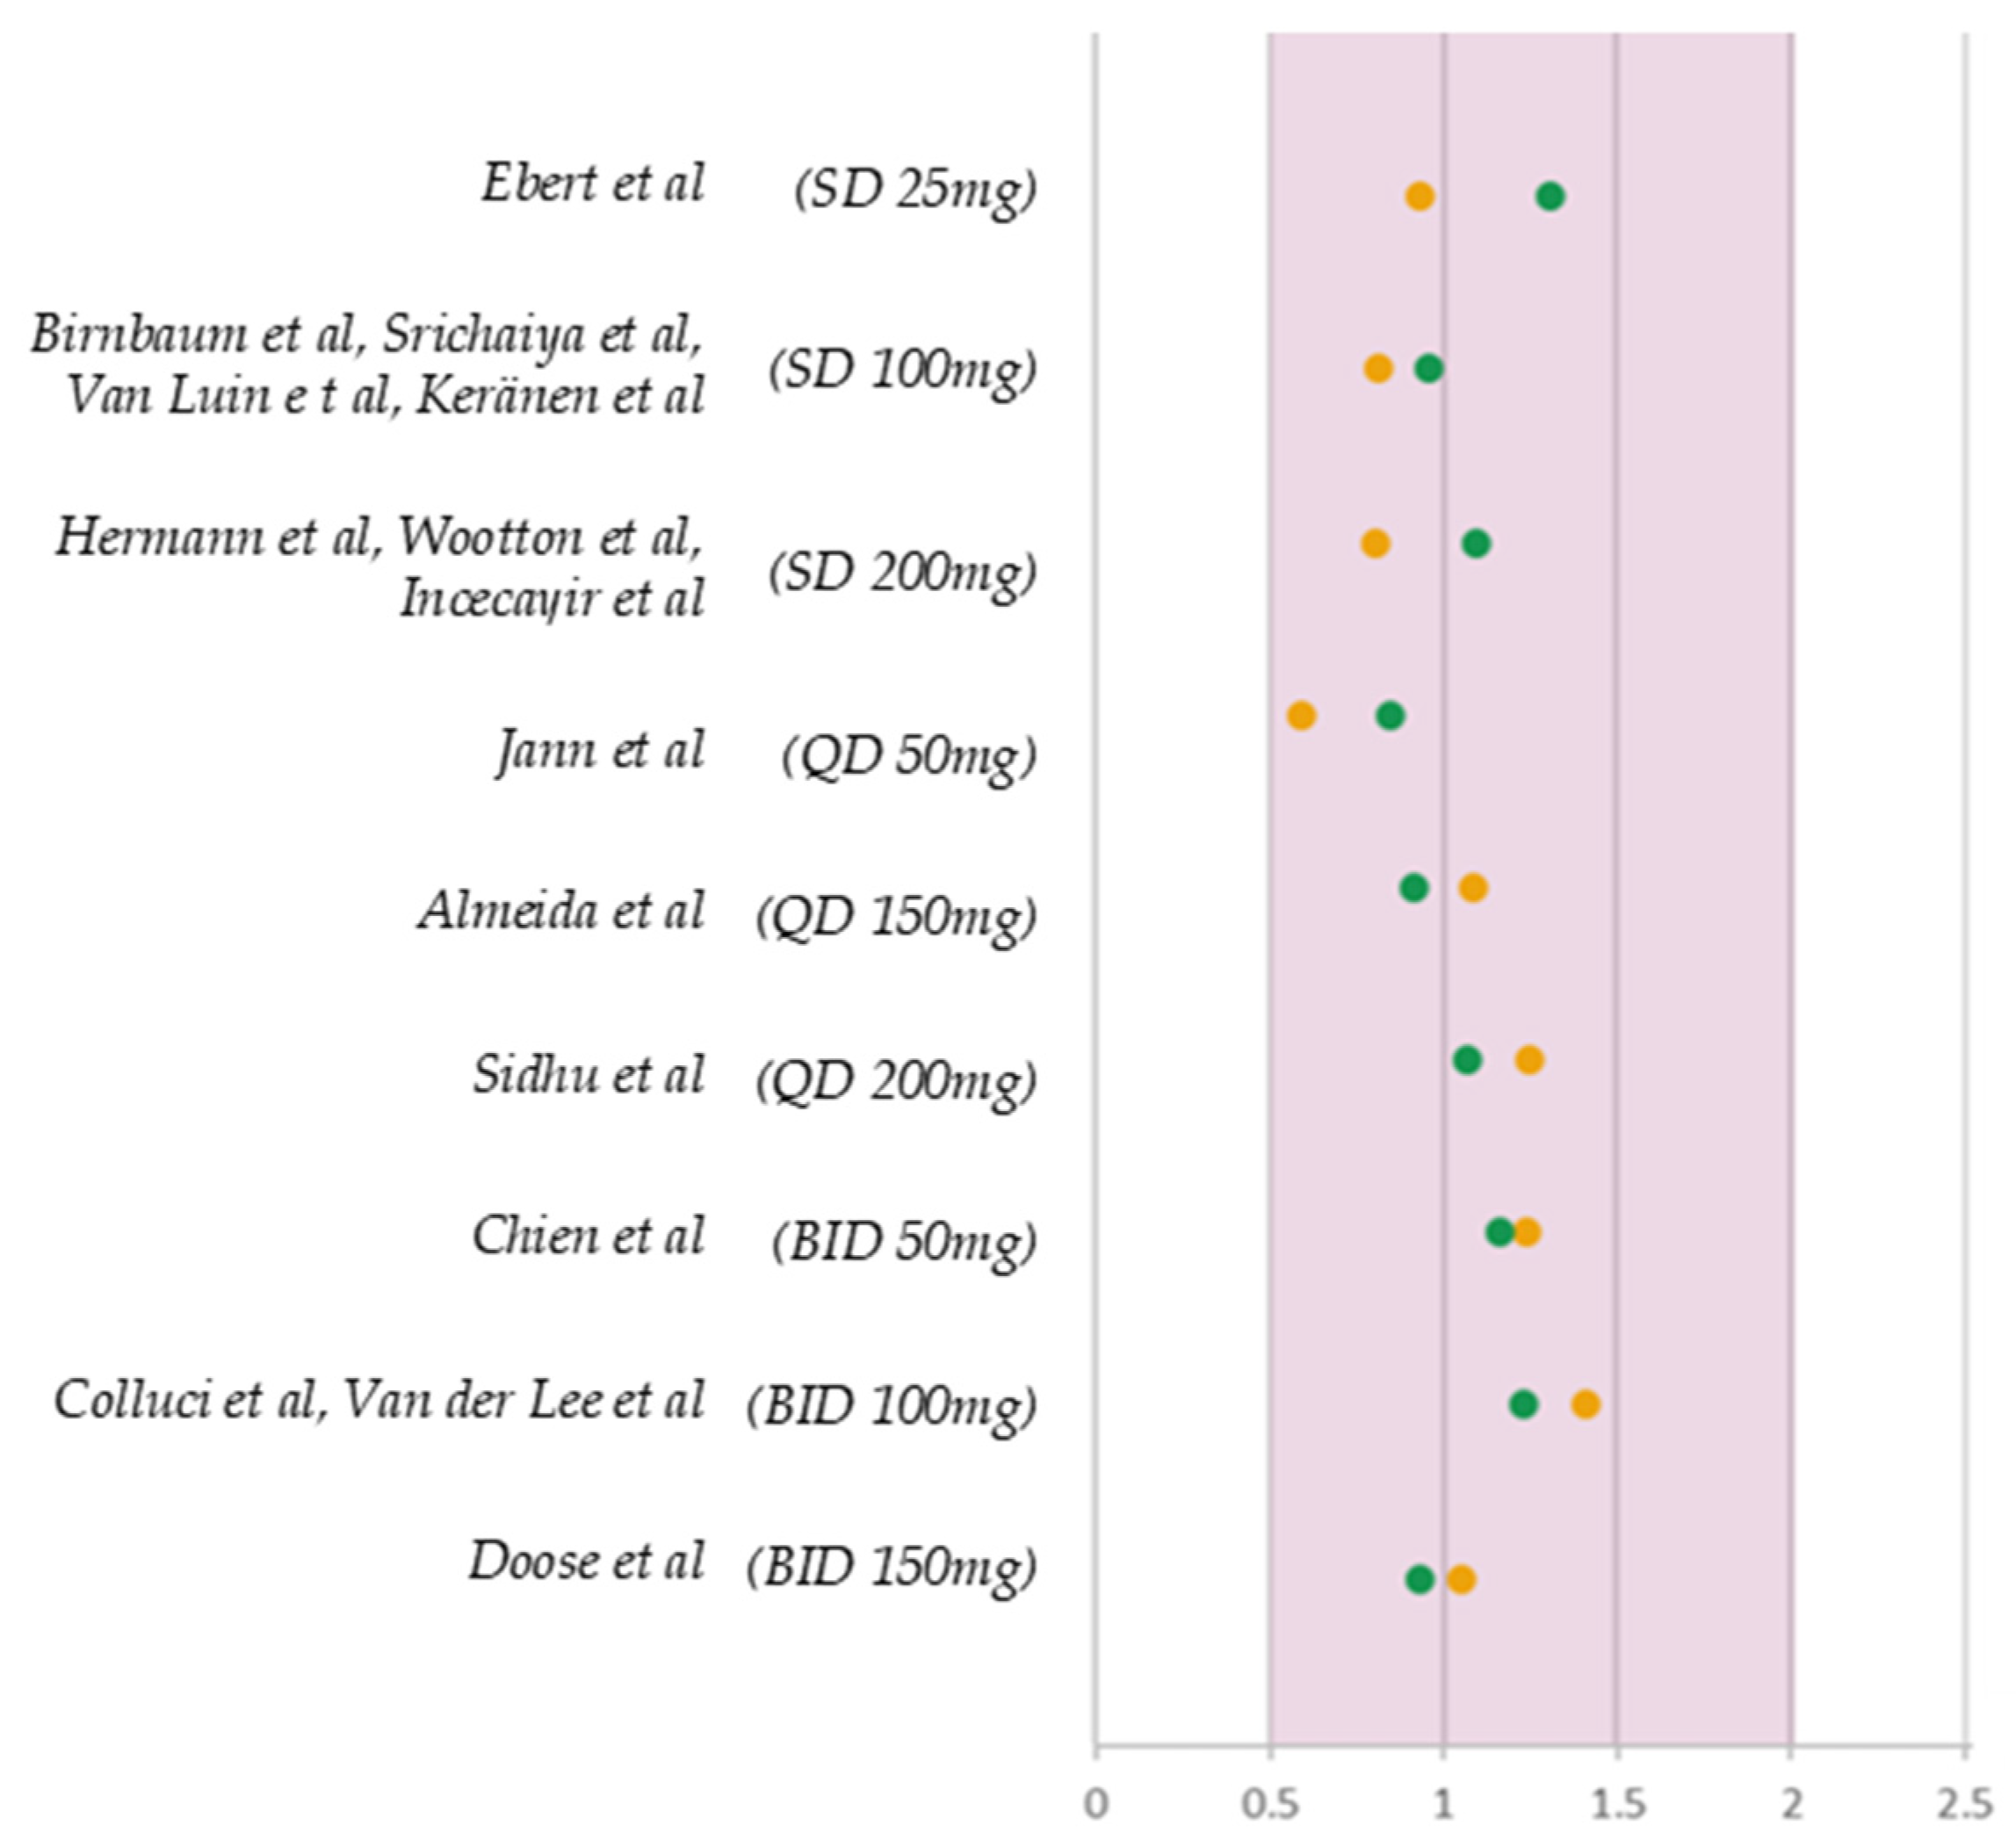
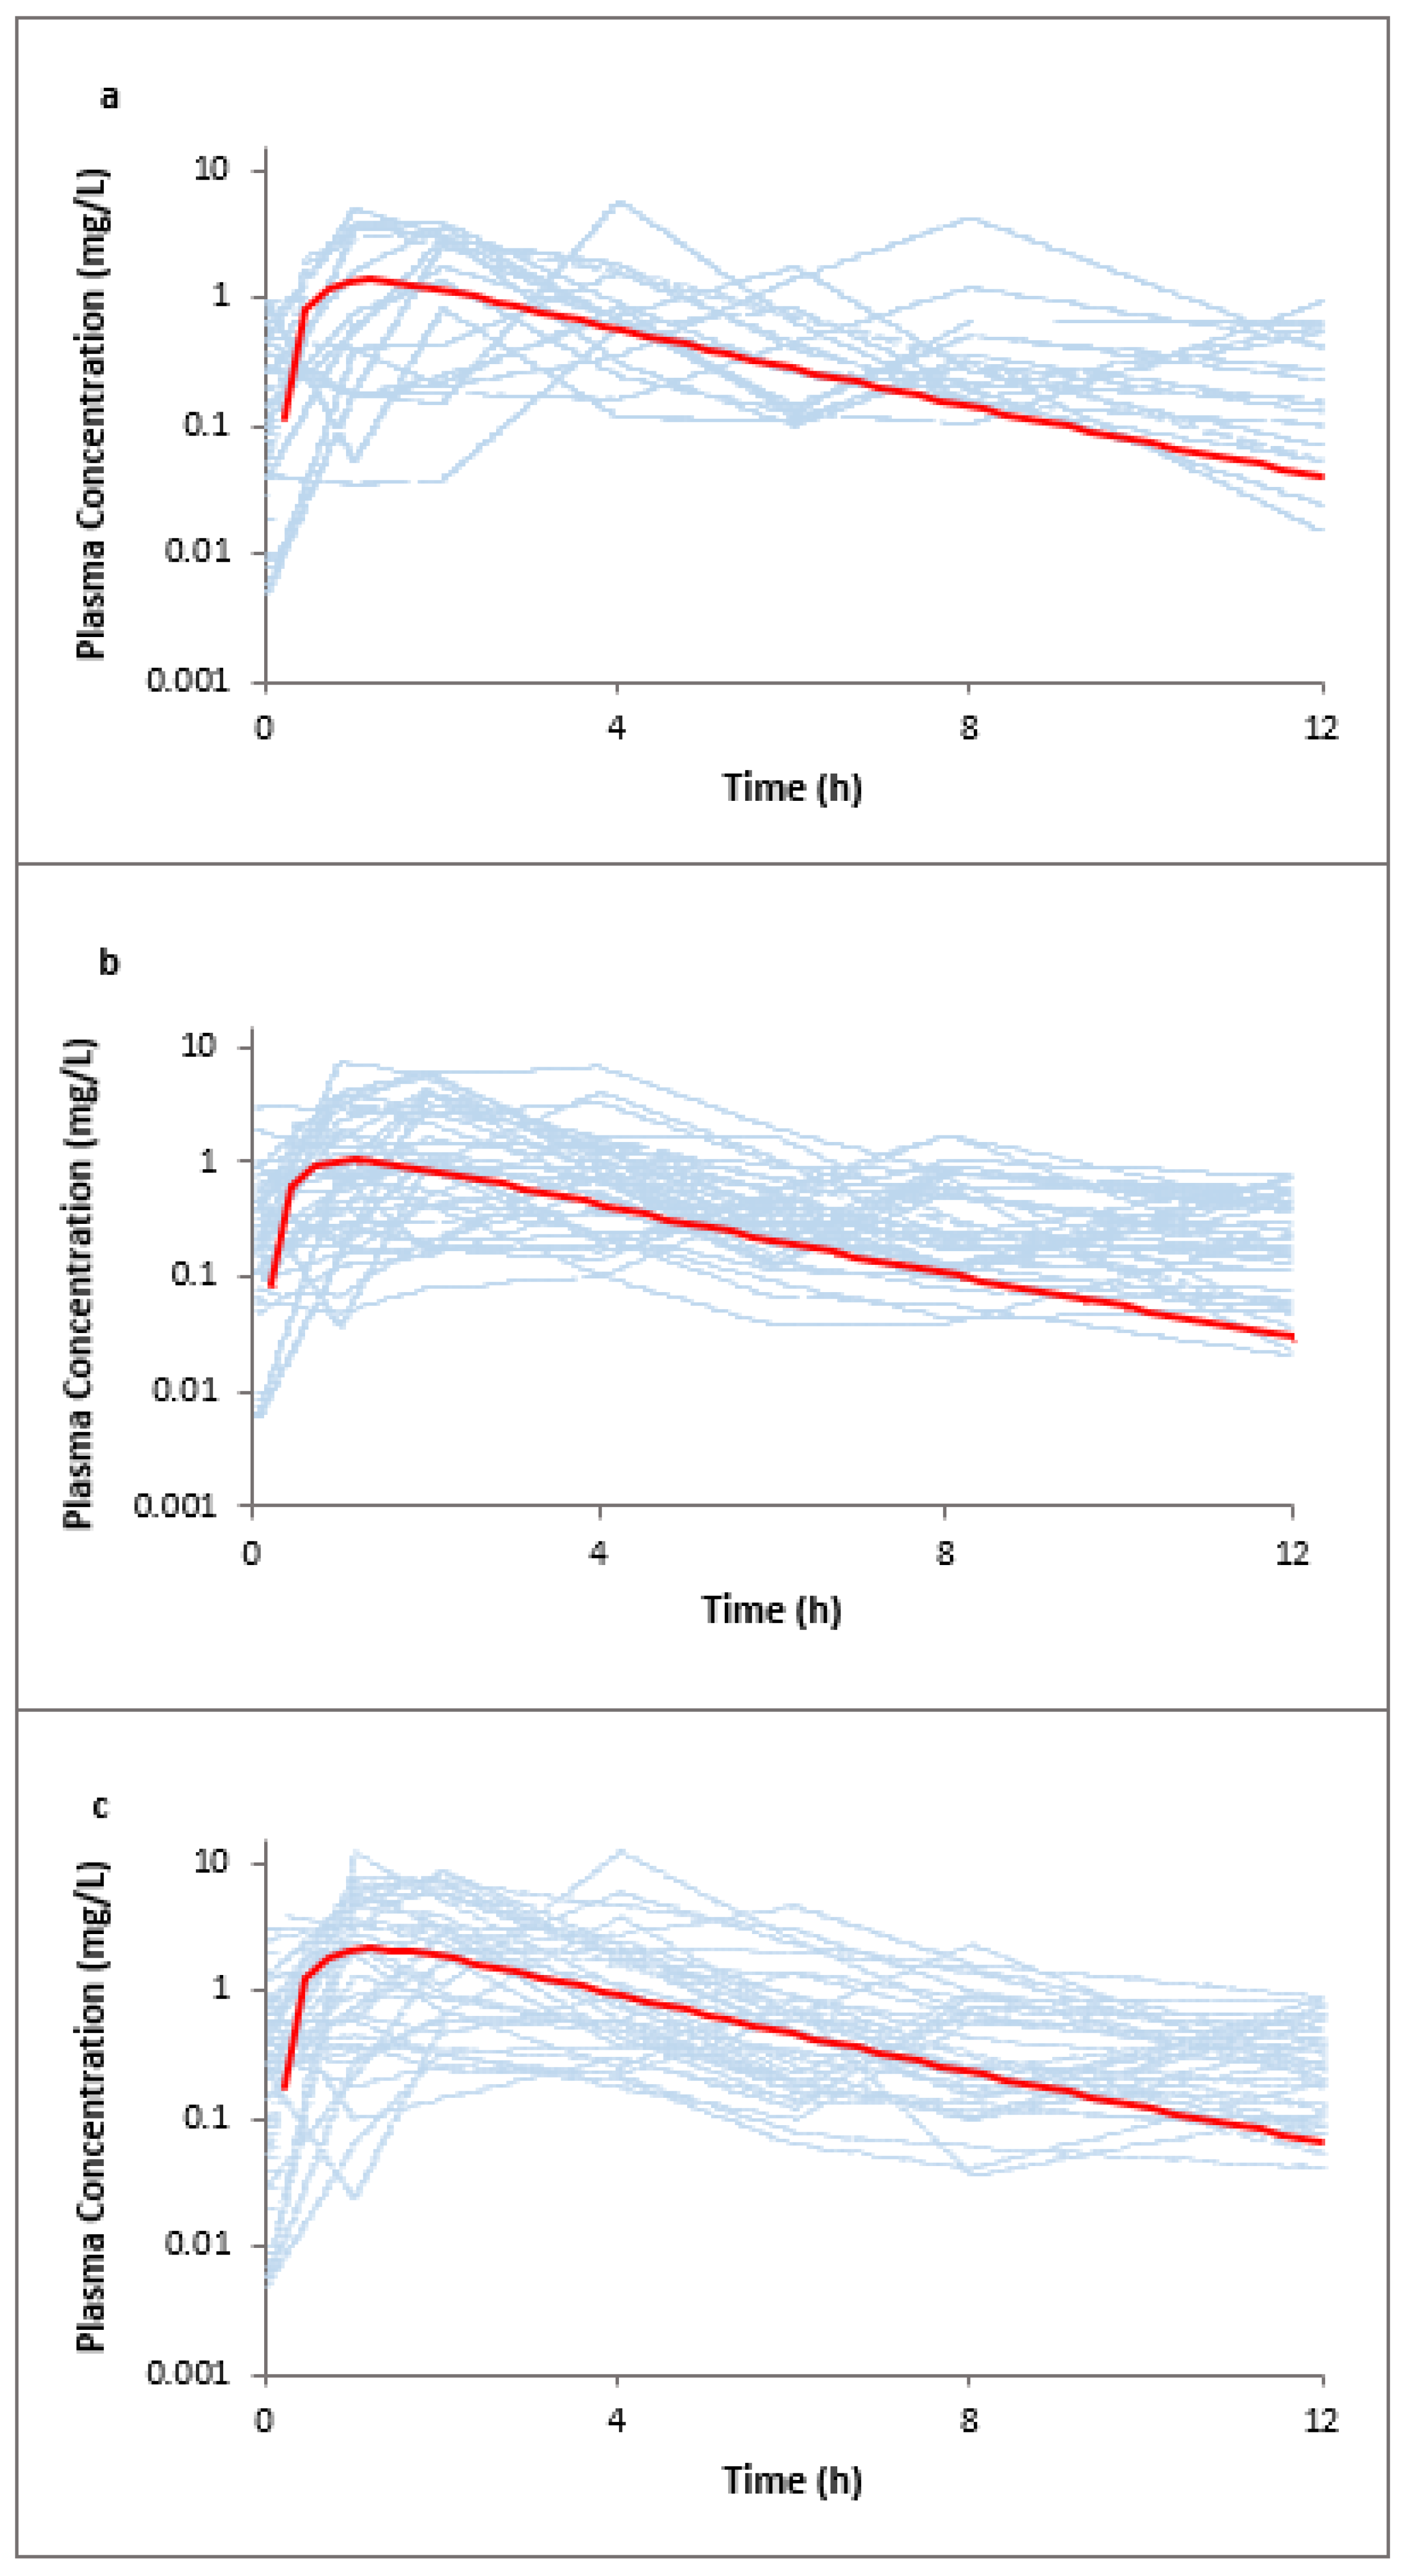
3.1. Lamotrigine Full PBPK Model Validation

Clinical studies were simulated for nine different dosing conditions. The resulting plasma concentration profiles following oral administration of lamotrigine were overlayed with data from corresponding clinical studies. Overall, the predictions lay within the 5th and 95th percentiles (Figure 3). Parameters such as AUC and Cmax were also compared. For all the clinical studies included in validating the adult population model, the simulated parameters fell within a 2-fold range of their observed values (Figure 4).

3.2. Lamotrigine PK Prediction in Pregnancy

Once the adult (non-pregnant) population model was validated, the same full PBPK drug parameters were used to predict PK in the pregnancy population model. The proposed changes in UGT1A4 activity allowed us to adequately capture changes in lamotrigine PK during pregnancy (Table 5). AUC and Cmax values were compared at baseline and during the 3rd trimester (36GW), and percent change over pregnancy was calculated. A 58% observed decrease in AUC was matched with a predicted decrease of 68%. The maximum concentration, which was observed to decrease by 50% at that time, was predicted to decrease by 63%. The apparent clearance of lamotrigine, calculated as Dose/AUC from simulated data, was compared against three clinical studies. The predictions closely matched the clinically observed values, demonstrating good model performance.

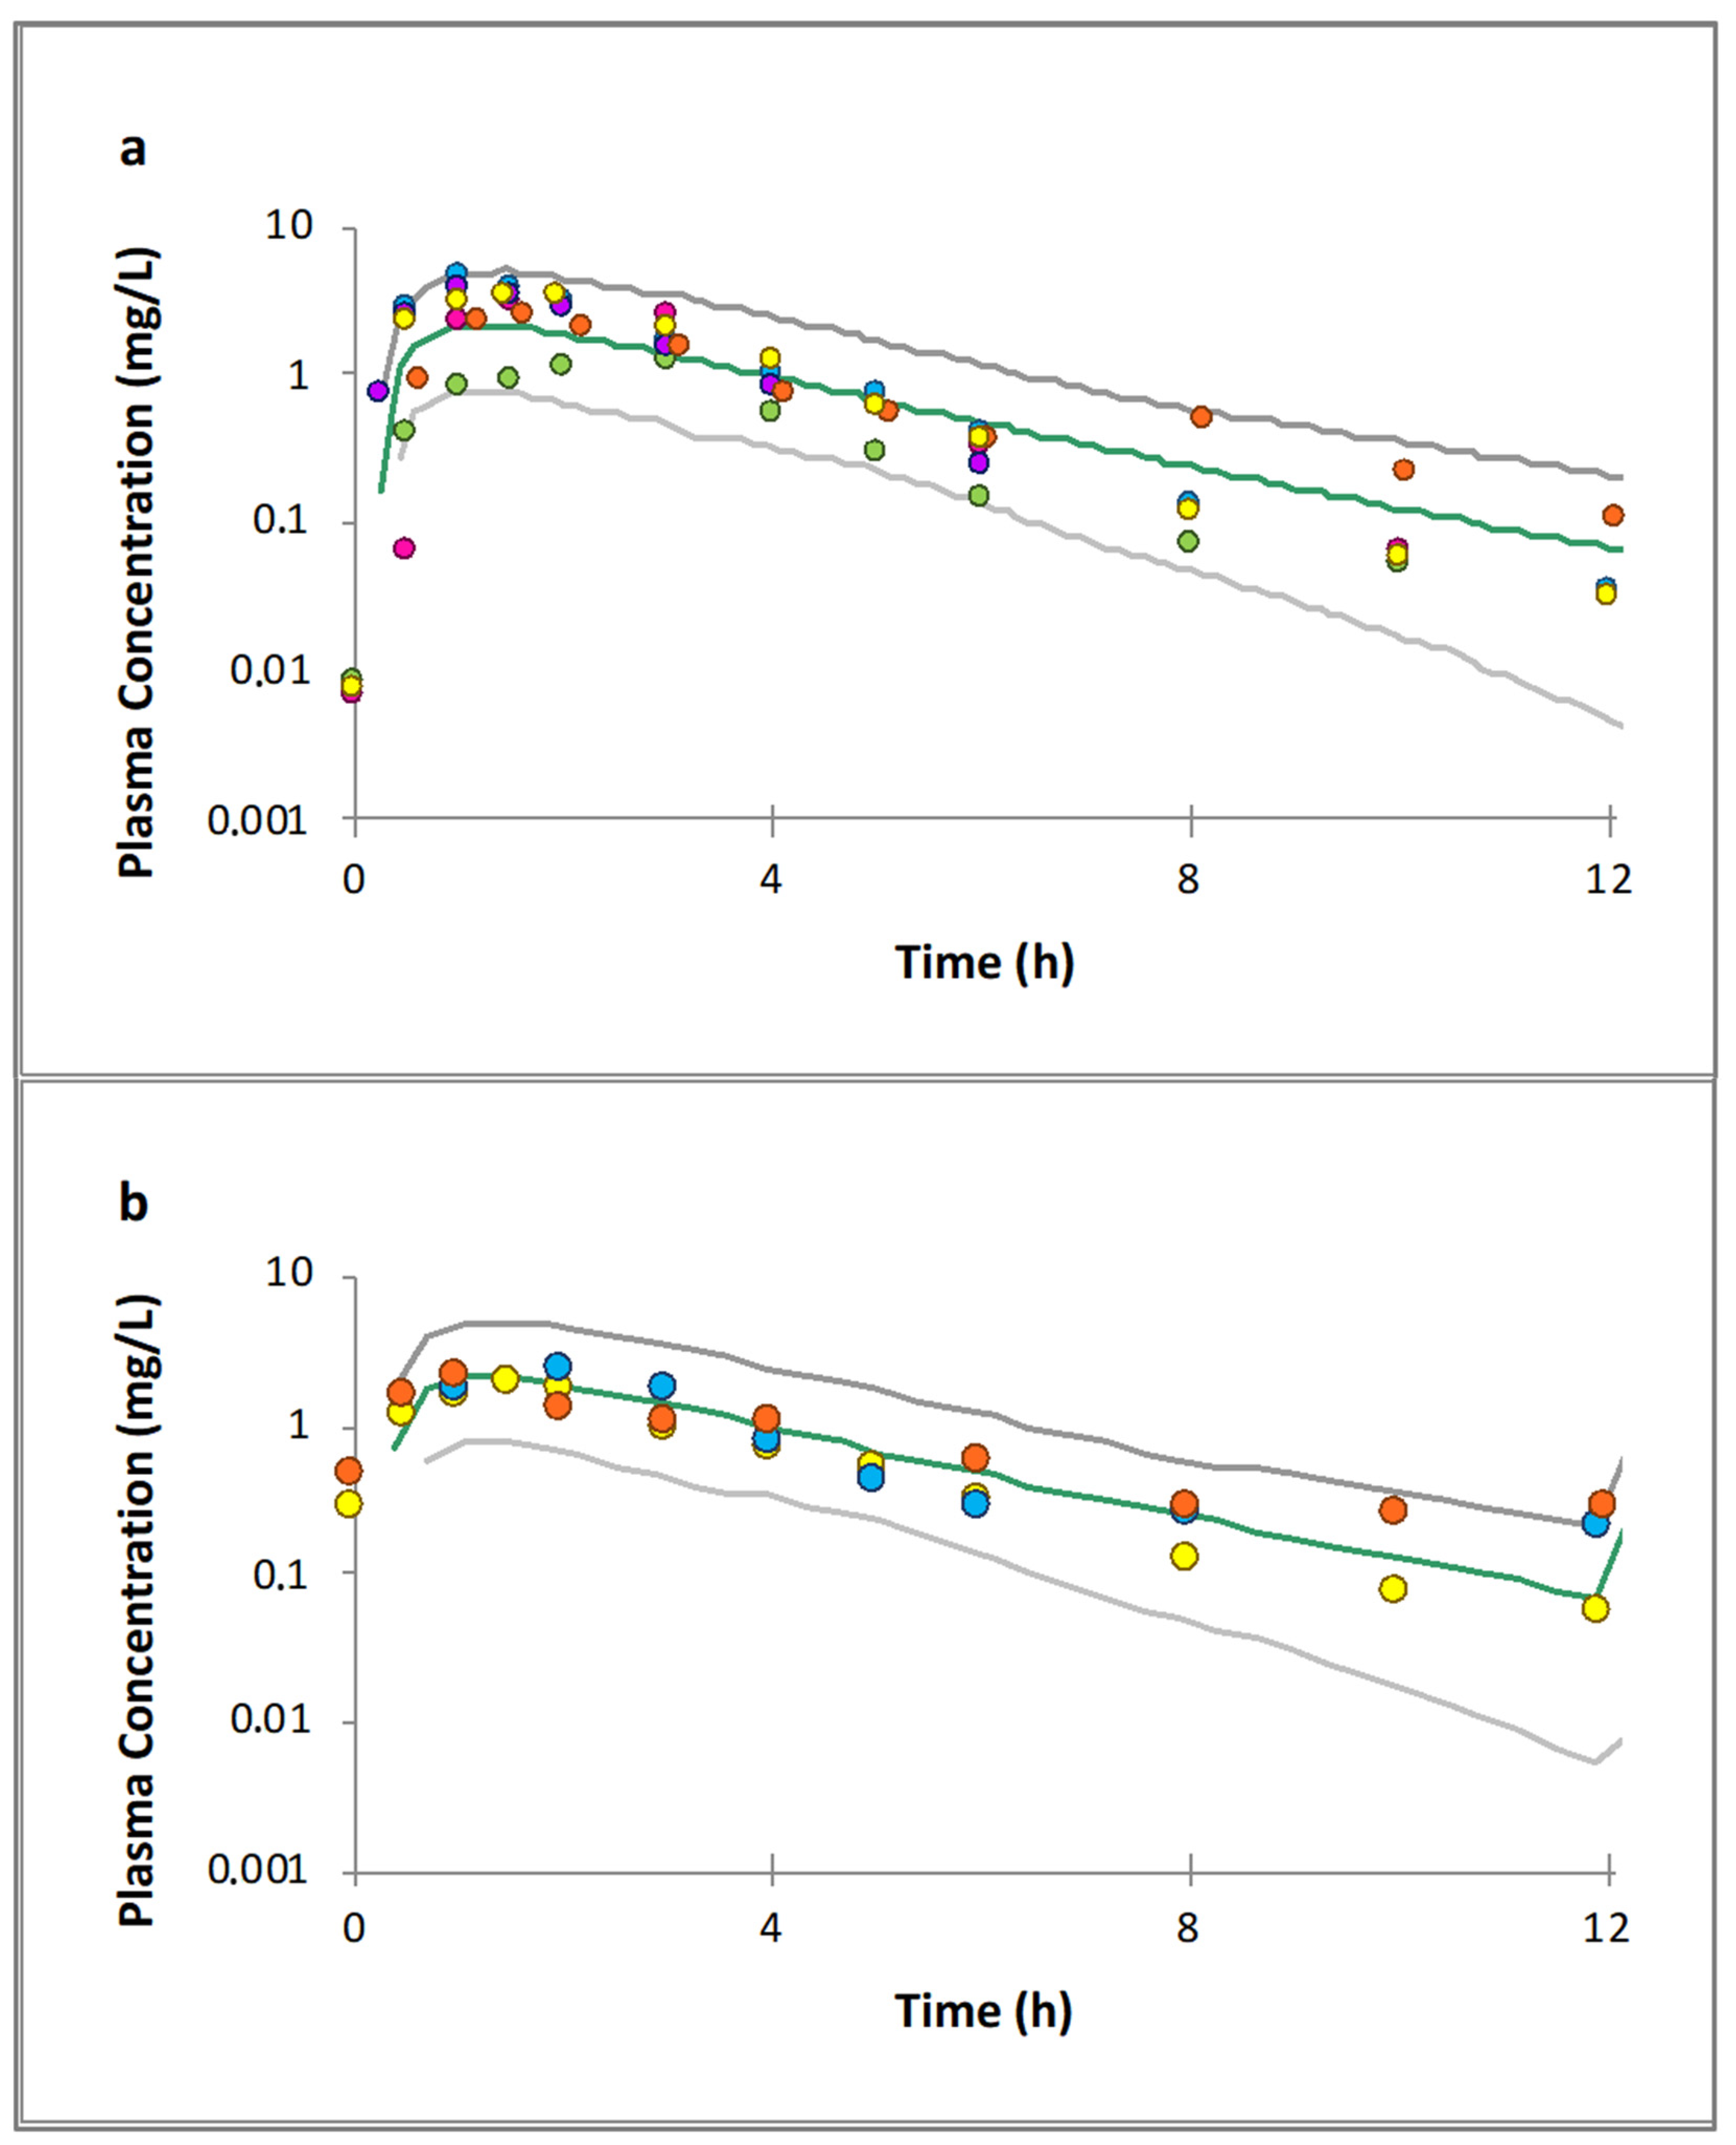
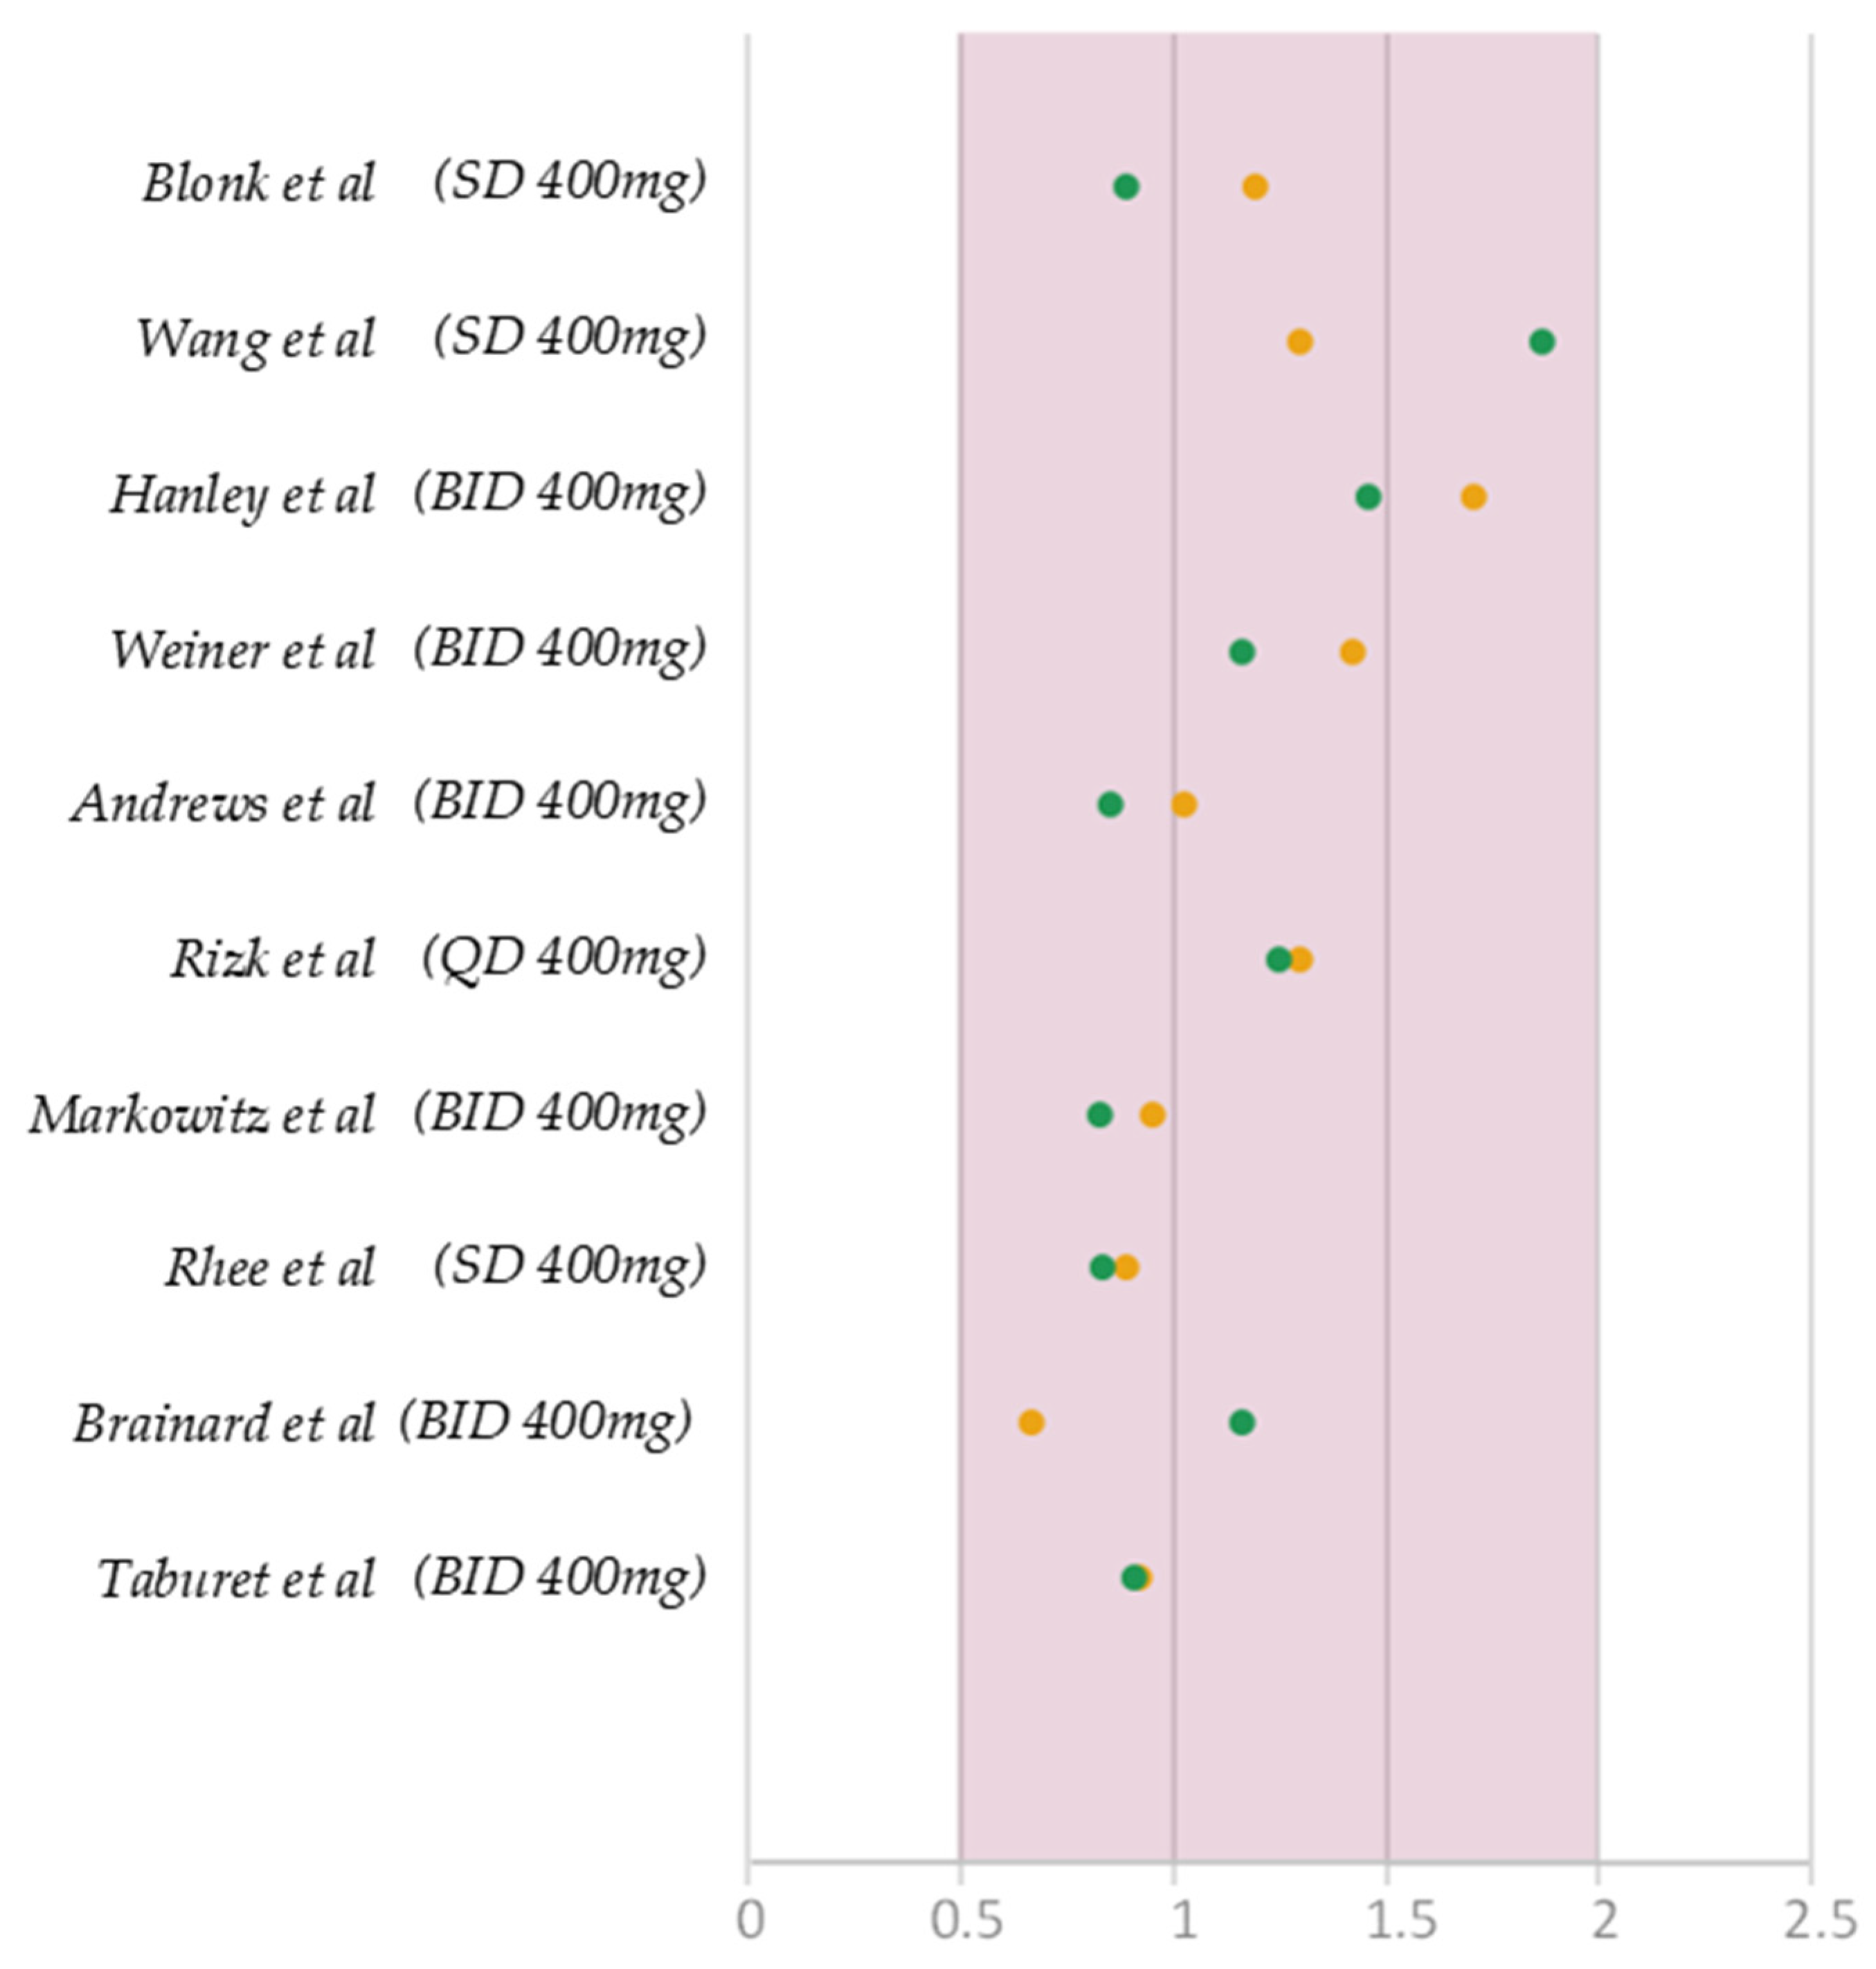
3.3. Raltegravir Full PBPK Model Validation

Compound parameters of raltegravir from the Simcyp software compound library (Simcyp V21) were applied to the healthy adult (non-pregnant) population. Single dose (SD) (Figure 5a) and twice daily (BID) (Figure 5b) regimens of 400 mg of raltegravir were simulated. Clinical data from multiple studies were fit onto the resulting plasma concentration profiles and demonstrated a good match, with the majority of data points falling within the 5th and 95th percentiles of the confidence intervals. Subsequently, predicted-to-observed ratios were calculated for AUC and Cmax (Figure 6). For each study, the model predictions were within a 2-fold range from the observed data.

3.4. Raltegravir PK Prediction in Pregnancy

After validating the model in the non-pregnant population, the raltegravir model was used in pregnancy population models for prediction of PK. The results were analysed over all three trimesters of pregnancy. Mean predicted plasma concentrations were overlayed onto profiles collected from patients (Figure 7). Additionally, the observed and predicted percent changes in PK parameters such as AUC, Cmax and CL were compared between the 2nd and 3rd trimester and baseline (Table 6). All corresponding pairs of values fell within a 2-fold range criterion, indicating a close similarity between predicted and observed data.

3.5. Model Credibility Evaluation

In addition to the qualitative, visual comparison of predicted and observed data through their graphical overlay, and quantitatively calculating the ratio of major PK parameters, further model evaluation analysis was carried out to validate the models. Parameters AFE and AAFE were calculated as an objective measure of the model’s predictive power (Table 7). These indicators were assessed for AUC and Cmax data for lamotrigine [23,24,25,26,27,28,29,30,31,32,33,34,35,36,37] and raltegravir [46,47,48,49,50,51,52,53,54,55] and for both drugs in healthy adult volunteers. Due to a scarcity of sufficient ‘n’ numbers of available PK data in pregnant population models for each trimester, AFE and AAFE were calculated across three trimesters and reported in Table 7 to give gross prediction credibility over a full pregnancy term. Also, only lamotrigine CL data [39,40,41,42] and raltegravir AUC data [56,57,58] were reported in clinical studies from the literature; these parameters were evaluated and reported in Table 7. In each case, the statistical error was insignificant, with calculated values falling within the acceptable 0.8–1.25 range, where 1 signifies a perfect match.

4. Discussion

PBPK modelling of drugs metabolised by Phase I enzymes (CYPs) in pregnant population models had been reported in the past, while its use in Phase II (UGTs) is not known to the authors. Lamotrigine and raltegravir are primarily metabolised by UGT1A4 and UGT1A1, respectively, and comply with all the above-mentioned selection criteria for drug models.
Pre-available lamotrigine and raltegravir non-pregnant population models were used as a starting point for model development, and the initial parameters had to be optimised before they could be applied to the gestating population. The decision to adapt from a “minimal PBPK” to a “full PBPK” model was based on the requirement to incorporate pregnancy population models in Simcyp, which necessitated the use of a full PBPK model. Additionally, the full PBPK model allowed for more comprehensive characterization of the disposition of the drug in the body, enabling a more accurate prediction of drug exposure in the target population. This is due to the difference in the level of complexity between the two models (Figure 1). Minimal PBPK models (Figure 1a) are best used in the early stages of model development, with the use of intravenous plasma profiles, as they treat the body as a single systemic compartment. To fully appreciate the interplay of different organs involved after oral administration of a drug, full PBPK models should be developed, as they incorporate in their mathematical structure several distinct compartments (Figure 1b). For the pregnancy population model, the use of the full PBPK model is needed, regardless of the drug administration route, to account for the impact of pregnancy-related physiological changes on tissues and organs. Moreover, an additional foetal-placental compartment is added to the full PBPK structure. The adaptation of previously available minimal PBPK parameters to full PBPK was therefore considered necessary to improve the reliability of the model in evaluating drug pharmacokinetics during pregnancy.
Moreover, the absorption parameters of a full PBPK model can be further expanded to include an ADAM absorption model (Figure 1c), which describes the changing environment of the intestines at different segments. Once applied, the additional ADAM absorption model allows to account for the impact of food intake on drug disposition and can be used to simulate a drug being administered with a meal. Such additional parameters found in the previous modelling and used as a source of drug parameters were applied to predict lamotrigine PK. In the case of raltegravir, however, the information provided in the Simcyp compound library does not cover the ADAM absorption parameters, and a more simplistic, first order absorption is utilised instead. Therefore, from the Brainard et al. [55] study, which compared the effect of food intake on raltegravir PK, only data regarding the fasted group were considered in model validation, as the model does not account for the impact of food intake in its current stage. In the future, ADAM parameters of raltegravir could be optimised to allow to simulate clinical studies with varied food intake protocols.
For the purpose of developing the lamotrigine model, UGT1A4 activity was added manually (Figure 2), which allowed it to accurately capture the expected change in the disposition of lamotrigine. The proposed changes are based on in vitro and clinical data [38,61]. A study on the expression of UGT1A4 in HepG2 found that 17β-estradiol in high concentrations, representative of the circulating levels of this hormone during pregnancy, upregulates UGT1A4 expression by around 2.3-fold [61]. Similarly, reported clinical clearance of lamotrigine is expected to increase to a similar extent [38]. Based on the aforementioned in vitro findings and clinical lamotrigine clearance profile, a relationship between UGT1A4 activity and duration of pregnancy leading to a ~2.5-fold increase was incorporated into the model. Future modelling studies can utilise the same proposed change when looking at other UGT1A4 substrate drugs. Petrenaite et al. [65] reported that genetic polymorphism of UGT1A4 and the sex of the foetus is known to influence PK and its variability in pregnant population models. Wang et al. [66] developed a statistical population pharmacokinetic model and showed that pharmacogenetic allelic forms and oestrogen levels during pregnancy are important covariates that influence the lamotrigine concentrations during pregnancy. Wegner et al. [67] demonstrated in a clinical drug–drug interaction study that oral contraceptives influence the lamotrigine concentrations and proposed that changes in LTG clearance were due to UGT1A4 induction similar to that seen during pregnancy. The PBPK modelling strategy adopted by us includes the effect of oestrogen hormones during pregnancy but currently excludes the PK variability that may occur due to UGT1A4 genetic polymorphism. Future work may be focused on including the distribution of UGT1A4 genetic variants in our PBPK model and assess the impact of genetic polymorphism in pregnant population models.
However, it should be noted that not all studies reporting lamotrigine use during pregnancy provided the exact doses administered to the patients. To account for this, the simulations of lamotrigine clearance were designed using the doses reported in the Reisinger et al. study [39]. These simulations were then compared to the reported data from other studies that did not provide dosage information, as a means of validation.
In addition, some of the studies included in the analysis did not report the exact timing of blood sample collection after dosing, which could affect the accuracy of the calculated clearance values. To address this limitation, the clearance values for the lamotrigine simulations in pregnancy were calculated based on the average concentration (Cavg) over a 24 h period (AUC/24 h) using the doses reported in the Reisinger et al. study [42]. This approach allowed for the comparison of simulated clearance data with the available literature data, despite the variability in dosing regimens and sampling times across the different studies.
Furthermore, the models themselves may have inherent limitations. For instance, the lamotrigine model presented here did not have full pregnancy plasma concentration profiles available for validation, which could affect the accuracy of the predictions as only case reports, individual concentrations and general PK parameters could be compared. Similarly, the raltegravir model was limited by the fact that it only accounted for first-order absorption, which may not capture the full complexity of drug absorption during pregnancy. Further work could be done to fully parametrise the ADAM absorption model of raltegravir. Even at its current stage however, the raltegravir pregnancy model can accurately predict the percent changes in PK parameters that happen during pregnancy by incorporating the changes in UGT1A1 activity.
The current work focuses on modelling the PK of drugs in the maternal plasma compartment due to availability of plasma concentration data which can be used to develop and/or validate the model. However, the simulation of concentrations in other maternal tissues and foetal compartments is useful for future work for drugs with known clinical data in these compartments to benchmark prediction assessments.
Using prototypical model drugs, our work provides a modelling strategy to mechanistically include variation in drug metabolising enzyme activity/expression in pregnant population models to predict PK in this population. Modelling output from this exercise may be used in clinical drug development in various ways to help dose recommendation in pregnant population models. Firstly, these models can be used to design “informed” first-in-pregnant-population controlled clinical trials and to advise time points for sampling for PK analysis with greater certainty. Secondly, once validated with sparse PK data, these models may be applied to predict exposure, which together with exposure-response and exposure safety data, may be used to propose safe, efficacious doses in pregnant population models.
In conclusion, PBPK models can effectively be used to predict drug exposure in pregnancy, and, upon model validation, this could be useful also for drugs with limited clinical data. However, there are challenges in the model validation process in the absence of relevant clinical data, requiring caution when interpreting the results of such simulations.
Challenges may arise surrounding the implementation of pregnancy population models that are currently available in modelling software. This is due to the limited information on how some pregnancy-related changes may affect the activity of either specific metabolic enzymes or transporters, leading to a drug’s PK alteration. Compound-specific PBPK parameters are reported in the literature, and modelling platforms contain libraries with ”ready-to-use” compound files. Nevertheless, additional work may be required to adapt them to the gestating population.

Author Contributions

Conceptualisation: M.B., P.S., P.C. and V.P.R. Methodology: M.B., P.S. and P.C. Formal analysis: M.B. Writing (original draft preparation): M.B. Writing (review and editing): M.B., P.S., V.P.R. and P.C. All authors have read and agreed to the published version of the manuscript.

Funding

This research received no external funding.

Institutional Review Board Statement

Not applicable.

Informed Consent Statement

Not applicable.

Data Availability Statement

Publicly available data listed in Table 2 were used for model validation in this study. The data from simulations presented in this study are available on request from the corresponding author.

Conflicts of Interest

Pradeep Sharma is a full-time employee and shareholder of AstraZeneca. Paola Coppola and Venkatesh Pilla Reddy were employees of AstraZeneca at the time of the work. Monika Berezowska conducted her industrial internship at AstraZeneca for this work. This contribution was written by the authors in the course of the authors’ employment, and the contribution was owned by the company. The company had no role in the design of the study, in the collection, analysis, or interpretation of data, in the writing of the manuscript, or in the decision to publish the results.

References

  1. Berezowska, M.; Sharma, P.; Pilla Reddy, V.; Coppola, P. Physiologically Based Pharmacokinetic modelling of drugs in pregnancy: A mini-review on availability and limitations. Fundam. Clin. Pharmacol. 2023, e12967. [Google Scholar] [CrossRef]
  2. Lupattelli, A.; Spigset, O.; Twigg, M.J.; Zagorodnikova, K.; Mårdby, A.C.; Moretti, M.E.; Drozd, M.; Panchaud, A.; Hämeen-Anttila, K.; Rieutord, A.; et al. Medication use in pregnancy: A cross-sectional, multinational web-based study. BMJ Open 2014, 4, e004365. [Google Scholar] [CrossRef]
  3. Borda, L.A.; Någård, M.; Boulton, D.W.; Venkataramanan, R.; Coppola, P. A systematic review of pregnancy-related clinical intervention of drug regimens due to pharmacokinetic reasons. Front. Med. 2023, 10, 1241456. [Google Scholar] [CrossRef]
  4. Coppola, P.; Kerwash, E.; Nooney, J.; Omran, A.; Cole, S. Pharmacokinetic data in pregnancy: A review of available literature data and important considerations in collecting clinical data. Front. Med. 2022, 9, 940644. [Google Scholar] [CrossRef]
  5. Abduljalil, K.; Furness, P.; Johnson, T.N.; Rostami-Hodjegan, A.; Soltani, H. Anatomical, physiological and metabolic changes with gestational age during normal pregnancy: A database for parameters required in physiologically based pharmacokinetic modelling. Clin. Pharmacokinet. 2012, 51, 365–396. [Google Scholar] [CrossRef]
  6. Feghali, M.; Venkataramanan, R.; Caritis, S. Pharmacokinetics of drugs in pregnancy. Semin. Perinatol. 2015, 39, 512–519. [Google Scholar] [CrossRef]
  7. Pariente, G.; Leibson, T.; Carls, A.; Adams-Webber, T.; Ito, S.; Koren, G. Pregnancy-Associated Changes in Pharmacokinetics: A Systematic Review. PLoS Med. 2016, 13, e1002160. [Google Scholar] [CrossRef]
  8. Meah, V.L.; Cockcroft, J.R.; Backx, K.; Shave, R.; Stohr, E.J. Cardiac output and related haemodynamics during pregnancy: A series of meta-analyses. Heart 2016, 102, 518–526. [Google Scholar] [CrossRef]
  9. Everson, G.T. Gastrointestinal motility in pregnancy. Gastroenterol. Clin. N. Am. 1992, 21, 751–776. [Google Scholar] [CrossRef]
  10. Aguree, S.; Gernand, A.D. Plasma volume expansion across healthy pregnancy: A systematic review and meta-analysis of longitudinal studies. BMC Pregnancy Childbirth 2019, 19, 508. [Google Scholar] [CrossRef]
  11. Coppola, P.; Butler, A.; Cole, S.; Kerwash, E. Total and Free Blood and Plasma Concentration Changes in Pregnancy for Medicines Highly Bound to Plasma Proteins: Application of Physiologically Based Pharmacokinetic Modelling to Understand the Impact on Efficacy. Pharmaceutics 2023, 15, 2455. [Google Scholar] [CrossRef]
  12. Tracy, T.S.; Venkataramanan, R.; Glover, D.D.; Caritis, S.N.; for the National Institute for Child Health and Human Development Network of Maternal-Fetal-Medicine Units. Temporal changes in drug metabolism (CYP1A2, CYP2D6 and CYP3A Activity) during pregnancy. Am. J. Obs. Gynecol. 2005, 192, 633–639. [Google Scholar] [CrossRef]
  13. Khatri, R.; Fallon, J.K.; Sykes, C.; Kulick, N.; Rementer, R.J.B.; Miner, T.A.; Schauer, A.P.; Kashuba, A.D.M.; Boggess, K.A.; Brouwer, K.L.R.; et al. Pregnancy-Related Hormones Increase UGT1A1-Mediated Labetalol Metabolism in Human Hepatocytes. Front. Pharmacol. 2021, 12, 655320. [Google Scholar] [CrossRef]
  14. Pennell, P.B.; Newport, D.J.; Stowe, Z.N.; Helmers, S.L.; Montgomery, J.Q.; Henry, T.R. The impact of pregnancy and childbirth on the metabolism of lamotrigine. Neurology 2004, 62, 292–295. [Google Scholar] [CrossRef]
  15. Desai, D.K.; Moodley, J.; Naidoo, D.P. Echocardiographic assessment of cardiovascular hemodynamics in normal pregnancy. Obs. Gynecol. 2004, 104, 20–29. [Google Scholar] [CrossRef]
  16. Davison, J.M.; Dunlop, W. Renal hemodynamics and tubular function normal human pregnancy. Kidney Int. 1980, 18, 152–161. [Google Scholar] [CrossRef]
  17. Peng, J.; Ladumor, M.K.; Unadkat, J.D. Prediction of Pregnancy-Induced Changes in Secretory and Total Renal Clearance of Drugs Transported by Organic Anion Transporters. Drug Metab. Dispos. 2021, 49, 929–937. [Google Scholar] [CrossRef]
  18. Bergagnini-Kolev, M.C.; Hebert, M.F.; Easterling, T.R.; Lin, Y.S. Pregnancy Increases the Renal Secretion of N(1)-methylnicotinamide, an Endogenous Probe for Renal Cation Transporters, in Patients Prescribed Metformin. Drug Metab. Dispos. 2017, 45, 325–329. [Google Scholar] [CrossRef]
  19. Green, D.J.; Park, K.; Bhatt-Mehta, V.; Snyder, D.; Burckart, G.J. Regulatory Considerations for the Mother, Fetus and Neonate in Fetal Pharmacology Modeling. Front. Pediatr. 2021, 9, 698611. [Google Scholar] [CrossRef]
  20. Nordmark, A. EMA Draft Guideline on the Qualification and Reporting of Physiologically Based Pharmacokinetic (PBPK) Modelling and Simulation. Dissolution and Translational Modeling Strategies Enabling Patient-Centric Product Development. 2017. Available online: https://www.pharmacy.umaryland.edu/media/SOP/wwwpharmacyumarylandedu/centers/cersievents/dissolution/day3_anna-nordmark.pdf (accessed on 3 January 2024).
  21. Coppola, P.; Kerwash, E.; Cole, S. Physiologically Based Pharmacokinetics Model in Pregnancy: A Regulatory Perspective on Model Evaluation. Front. Pediatr. 2021, 9, 687978. [Google Scholar] [CrossRef]
  22. Vajda, F.J.; O’Brien, T.; Lander, C.; Graham, J.; Eadie, M. The efficacy of the newer antiepileptic drugs in controlling seizures in pregnancy. Epilepsia 2014, 55, 1229–1234. [Google Scholar] [CrossRef]
  23. Ebert, U.; Thong, N.Q.; Oertel, R.; Kirch, W. Effects of rifampicin and cimetidine on pharmacokinetics and pharmacodynamics of lamotrigine in healthy subjects. Eur. J. Clin. Pharmacol. 2000, 56, 299–304. [Google Scholar] [CrossRef]
  24. Birnbaum, A.K.; Kriel, R.L.; Im, Y.; Remmel, R.P. Relative bioavailability of lamotrigine chewable dispersible tablets administered rectally. Pharmacotherapy 2001, 21, 158–162. [Google Scholar] [CrossRef]
  25. Srichaiya, A.; Longchoopol, C.; Oo-Puthinan, S.; Sayasathid, J.; Sripalakit, P.; Viyoch, J. Bioequivalence of generic lamotrigine 100-mg tablets in healthy Thai male volunteers: A randomized, single-dose, two-period, two-sequence crossover study. Clin. Ther. 2008, 30, 1844–1851. [Google Scholar] [CrossRef]
  26. van Luin, M.; Colbers, A.; Wissen, C.P.W.G.M.V.; van Ewijk-Beneken-Kolmer, E.W.J.; van der Kolk, M.; Hoitsma, A.; da Silva, H.G.; Burger, D.M. The effect of raltegravir on the glucuronidation of lamotrigine. J. Clin. Pharmacol. 2009, 49, 1220–1227. [Google Scholar] [CrossRef]
  27. Keränen, T.; Sorri, A.; Moilanen, E.; Ylitalo, P. Effects of charcoal on the absorption and elimination of the antiepileptic drugs lamotrigine and oxcarbazepine. Arzneimittelforschung 2010, 60, 421–426. [Google Scholar] [CrossRef]
  28. Hermann, R.; Knebel, N.G.; Niebch, G.; Richards, L.; Borlak, J.; Locher, M. Pharmacokinetic interaction between retigabine and lamotrigine in healthy subjects. Eur. J. Clin. Pharmacol. 2003, 58, 795–802. [Google Scholar] [CrossRef]
  29. Wootton, R.; Soul-Lawton, J.; Rolan, P.E.; Sheung, C.T.; Cooper, J.D.; Posner, J. Comparison of the pharmacokinetics of lamotrigine in patients with chronic renal failure and healthy volunteers. Br. J. Clin. Pharmacol. 1997, 43, 23–27. [Google Scholar] [CrossRef]
  30. Incecayir, T.; Agabeyoglu, I.; Gucuyener, K. Comparison of plasma and saliva concentrations of lamotrigine in healthy volunteers. Arzneimittelforschung 2007, 57, 517–521. [Google Scholar] [CrossRef]
  31. Jann, M.W.; Hon, Y.Y.; Shamsi, S.A.; Zheng, J.; Awad, E.A.; Spratlin, V. Lack of pharmacokinetic interaction between lamotrigine and olanzapine in healthy volunteers. Pharmacotherapy 2006, 26, 627–633. [Google Scholar] [CrossRef]
  32. Almeida, L.; Nunes, T.; Sicard, E.; Rocha, J.-F.; Falcão, A.; Brunet, J.-S.; Lefebvre, M.; Soares-Da-Silva, P. Pharmacokinetic interaction study between eslicarbazepine acetate and lamotrigine in healthy subjects. Acta Neurol. Scand. 2010, 121, 257–264. [Google Scholar] [CrossRef]
  33. Sidhu, J.; Job, S.; Bullman, J.; Francis, E.; Abbott, R.; Ascher, J.; Theis, J.G.W. Pharmacokinetics and tolerability of lamotrigine and olanzapine coadministered to healthy subjects. Br. J. Clin. Pharmacol. 2006, 61, 420–426. [Google Scholar] [CrossRef]
  34. Chien, S.; Yao, C.; Mertens, A.; Verhaeghe, T.; Solanki, B.; Doose, D.R.; Novak, G.; Bialer, M. An interaction study between the new antiepileptic and CNS drug carisbamate (RWJ-333369) and lamotrigine and valproic acid. Epilepsia 2007, 48, 1328–1338. [Google Scholar] [CrossRef]
  35. Colucci, R.; Glue, P.; Holt, B.; Banfield, C.; Reidenberg, P.; Meehan, J.W.; Pai, S.; Nomeir, A.; Lim, J.; Lin, C.-C.; et al. Effect of felbamate on the pharmacokinetics of lamotrigine. J. Clin. Pharmacol. 1996, 36, 634–638. [Google Scholar] [CrossRef]
  36. van der Lee, M.J.; Dawood, L.; ter Hofstede, H.J.; de Graaff-Teulen, M.J.; van Ewijk-Beneken Kolmer, E.W.; Caliskan-Yassen, N.; Koopmans, P.P.; PharmD, D.M.B. Lopinavir/ritonavir reduces lamotrigine plasma concentrations in healthy subjects. Clin. Pharmacol. Ther. 2006, 80, 159–168. [Google Scholar] [CrossRef]
  37. Doose, D.R.; Brodie, M.J.; Wilson, E.A.; Chadwick, D.; Oxbury, J.; Berry, D.J.; Schwabe, S.; Bialer, M. Topiramate and lamotrigine pharmacokinetics during repetitive monotherapy and combination therapy in epilepsy patients. Epilepsia 2003, 44, 917–922. [Google Scholar] [CrossRef]
  38. Reimers, A.; Helde, G.; Brathen, G.; Brodtkorb, E. Lamotrigine and its N2-glucuronide during pregnancy: The significance of renal clearance and estradiol. Epilepsy Res. 2011, 94, 198–205. [Google Scholar] [CrossRef]
  39. Reisinger, T.L.; Newman, M.; Loring, D.W.; Pennell, P.B.; Meador, K.J. Antiepileptic drug clearance and seizure frequency during pregnancy in women with epilepsy. Epilepsy Behav. 2013, 29, 13–18. [Google Scholar] [CrossRef]
  40. Pennell, P.B.; Peng, L.; Newport, D.J.; Ritchie, J.C.; Koganti, A.; Holley, D.K.; Newman, M.; Stowe, Z.N. Lamotrigine in pregnancy: Clearance, therapeutic drug monitoring, and seizure frequency. Neurology 2008, 70 Pt 2, 2130–2136. [Google Scholar] [CrossRef]
  41. Ding, Y.; Tan, X.; Zhang, S.; Guo, Y. Pharmacokinetic changes and therapeutic drug monitoring of lamotrigine during pregnancy. Brain Behav. 2019, 9, e01315. [Google Scholar] [CrossRef]
  42. Fotopoulou, C.; Kretz, R.; Bauer, S.; Schefold, J.; Schmitz, B.; Dudenhausen, J.W.; Henrich, W. Prospectively assessed changes in lamotrigine-concentration in women with epilepsy during pregnancy, lactation and the neonatal period. Epilepsy Res. 2009, 85, 60–64. [Google Scholar] [CrossRef]
  43. Wenning, L.A.; Hanley, W.D.; Brainard, D.M.; Petry, A.S.; Ghosh, K.; Jin, B.; Mangin, E.; Marbury, T.C.; Berg, J.K.; Chodakewitz, J.A.; et al. Effect of rifampin, a potent inducer of drug-metabolizing enzymes, on the pharmacokinetics of raltegravir. Antimicrob. Agents Chemother. 2009, 53, 2852–2856. [Google Scholar] [CrossRef]
  44. Iwamoto, M.; Wenning, L.A.; Petry, A.S.; Laethem, M.; De Smet, M.; Kost, J.T.; Breidinger, S.A.; Mangin, E.C.; Azrolan, N.; Greenberg, H.E.; et al. Minimal effects of ritonavir and efavirenz on the pharmacokinetics of raltegravir. Antimicrob. Agents Chemother. 2008, 52, 4338–4343. [Google Scholar] [CrossRef]
  45. Iwamoto, M.; Wenning, L.; Petry, A.; Laethem, M.; De Smet, M.; Kost, J.; Merschman, S.; Strohmaier, K.; Ramael, S.; Lasseter, K.; et al. Safety, tolerability, and pharmacokinetics of raltegravir after single and multiple doses in healthy subjects. Clin. Pharmacol. Ther. 2008, 83, 293–299. [Google Scholar] [CrossRef]
  46. Wang, L.; Soon, G.H.; Seng, K.-Y.; Li, J.; Lee, E.; Yong, E.-L.; Goh, B.-C.; Flexner, C.; Lee, L. Pharmacokinetic modeling of plasma and intracellular concentrations of raltegravir in healthy volunteers. Antimicrob. Agents Chemother. 2011, 55, 4090–4095. [Google Scholar] [CrossRef]
  47. Blonk, M.; Colbers, A.; Poirters, A.; Schouwenberg, B.; Burger, D. Effect of ginkgo biloba on the pharmacokinetics of raltegravir in healthy volunteers. Antimicrob. Agents Chemother. 2012, 56, 5070–5075. [Google Scholar] [CrossRef]
  48. Taburet, A.-M.; Sauvageon, H.; Grinsztejn, B.; Assuied, A.; Veloso, V.; Pilotto, J.H.; De Castro, N.; Grondin, C.; Fagard, C.; Molina, J.-M. Pharmacokinetics of raltegravir in HIV-Infected Patients on Rifampicin-Based Antitubercular Therapy. Clin. Infect. Dis. 2015, 61, 1328–1335. [Google Scholar] [CrossRef]
  49. Hanley, W.D.; Wenning, L.A.; Moreau, A.; Kost, J.T.; Mangin, E.; Shamp, T.; Stone, J.A.; Gottesdiener, K.M.; Wagner, J.A.; Iwamoto, M. Effect of tipranavir-ritonavir on pharmacokinetics of raltegravir. Antimicrob. Agents Chemother. 2009, 53, 2752–2755. [Google Scholar] [CrossRef]
  50. Weiner, M.; Egelund, E.F.; Engle, M.; Kiser, M.; Prihoda, T.J.; Gelfond, J.A.L.; Mac Kenzie, W.; Peloquin, C.A. Pharmacokinetic interaction of rifapentine and raltegravir in healthy volunteers. J. Antimicrob. Chemother. 2014, 69, 1079–1085. [Google Scholar] [CrossRef]
  51. Rhee, E.G.; Rizk, M.L.; Brainard, D.M.; Gendrano, I.N., 3rd; Jin, B.; Wenning, L.A.; Wagner, J.A.; Iwamoto, M. A pharmacokinetic comparison of adult and paediatric formulations of raltegravir in healthy adults. Antivir. Ther. 2014, 19, 619–624. [Google Scholar] [CrossRef]
  52. Rizk, M.L.; Hang, Y.; Luo, W.-L.; Su, J.; Zhao, J.; Campbell, H.; Nguyen, B.-Y.T.; Sklar, P.; Eron, J.J.; Wenning, L. Pharmacokinetics and pharmacodynamics of once-daily versus twice-daily raltegravir in treatment-naive HIV-infected patients. Antimicrob. Agents Chemother. 2012, 56, 3101–3106. [Google Scholar] [CrossRef]
  53. Markowitz, M.; O Morales-Ramirez, J.; Nguyen, B.-Y.; Kovacs, C.M.; Steigbigel, R.T.; A Cooper, D.; Liporace, R.; Schwartz, R.; Isaacs, R.; Gilde, L.R.; et al. Antiretroviral activity, pharmacokinetics, and tolerability of MK-0518, a novel inhibitor of HIV-1 integrase, dosed as monotherapy for 10 days in treatment-naive HIV-1-infected individuals. J. Acquir. Immune Defic. Syndr. 2006, 43, 509–515. [Google Scholar] [CrossRef]
  54. Andrews, E.; Glue, P.; Fang, J.; Crownover, P.; Tressler, R.; Damle, B. Assessment of the pharmacokinetics of co-administered maraviroc and raltegravir. Br. J. Clin. Pharmacol. 2010, 69, 51–57. [Google Scholar] [CrossRef]
  55. Brainard, D.M.; Friedman, E.J.; Jin, B.; Breidinger, S.A.; Tillan, M.D.; Wenning, L.A.; Stone, J.A.; Chodakewitz, J.A.; Wagner, J.A.; Iwamoto, M. Effect of low-, moderate-, and high-fat meals on raltegravir pharmacokinetics. J. Clin. Pharmacol. 2011, 51, 422–427. [Google Scholar] [CrossRef]
  56. Watts, D.H.; Stek, A.; Best, B.M.; Wang, J.; Capparelli, E.V.; Cressey, T.R.; Aweeka, F.; Lizak, P.; Kreitchmann, R.; Burchett, S.K.; et al. Raltegravir pharmacokinetics during pregnancy. J. Acquir. Immune Defic. Syndr. 2014, 67, 375–381. [Google Scholar] [CrossRef]
  57. Blonk, M.I.; Colbers, A.P.; Hidalgo-Tenorio, C.; Kabeya, K.; Weizsäcker, K.; Haberl, A.E.; Moltó, J.; Hawkins, D.A.; van der Ende, M.E.; Gingelmaier, A.; et al. Raltegravir in HIV-1-Infected Pregnant Women: Pharmacokinetics, Safety, and Efficacy. Clin. Infect. Dis. 2015, 61, 809–816. [Google Scholar] [CrossRef]
  58. Zheng, Y.; Hirt, D.; Delmas, S.; Lui, G.; Benaboud, S.; Lechedanec, J.; Tréluyer, J.-M.; Chenevier-Gobeaux, C.; Arezes, E.; Gelley, A.; et al. Effect of Pregnancy on Unbound raltegravir Concentrations in the ANRS 160 RalFe Trial. Antimicrob. Agents Chemother. 2020, 64, 10–1128. [Google Scholar] [CrossRef]
  59. Polepally, A.R.; Pennell, P.B.; Brundage, R.C.; Stowe, Z.N.; Newport, D.J.; Viguera, A.C.; Ritchie, J.C.; Birnbaum, A.K. Model-Based lamotrigine clearance changes during pregancy: Clinical implication. Ann. Clin. Transl. Neurol. 2014, 1, 99–106. [Google Scholar] [CrossRef]
  60. Conner, T.M.; Reed, R.C.; Zhang, T. A Physiologically Based Pharmacokinetic Model for Optimally Profiling lamotrigine Disposition and Drug-Drug Interactions. Eur. J. Drug Metab. Pharmacokinet. 2019, 44, 389–408. [Google Scholar] [CrossRef]
  61. Chen, H.; Yang, K.; Choi, S.; Fischer, J.H.; Jeong, H. Up-regulation of UDP-glucuronosyltransferase (UGT) 1A4 by 17beta-estradiol: A potential mechanism of increased lamotrigine elimination in pregnancy. Drug Metab. Dispos. 2009, 37, 1841–1847. [Google Scholar] [CrossRef]
  62. Chaphekar, N.; Dodeja, P.; Shaik, I.H.; Caritis, S.; Venkataramanan, R. Maternal-Fetal Pharmacology of Drugs: A Review of Current Status of the Application of Physiologically Based Pharmacokinetic Models. Front. Pediatr. 2021, 9, 733823. [Google Scholar] [CrossRef]
  63. Chen, S.; Yueh, M.F.; Evans, R.M.; Tukey, R.H. Pregnane-x-receptor controls hepatic glucuronidation during pregnancy and neonatal development in humanized UGT1 mice. Hepatology 2012, 56, 658–667. [Google Scholar] [CrossRef]
  64. Sychterz, C.; Galetin, A.; Taskar, K.S. When special populations intersect with drug-drug interactions: Application of physiologically-based pharmacokinetic modeling in pregnant populations. Biopharm. Drug Dispos. 2021, 42, 160–177. [Google Scholar] [CrossRef]
  65. Petrenaite, V.; Öhman, I.; Ekström, L.; Sæbye, D.; Hansen, T.F.; Tomson, T.; Sabers, A. UGT polymorphisms and lamotrigine clearance during pregnancy. Epilepsy Res. 2018, 140, 199–208. [Google Scholar] [CrossRef]
  66. Wang, M.-L.; Tao, Y.-Y.; Sun, X.-Y.; Guo, Y.; Wang, Z.-Y.; Cao, Y.-F.; Zhao, L. Estrogen profile- and pharmacogenetics-based lamotrigine dosing regimen optimization: Recommendations for pregnant women with epilepsy. Pharmacol. Res. 2021, 169, 105610. [Google Scholar] [CrossRef]
  67. Wegner, I.; Wilhelm, A.J.; Lambrechts, D.A.J.E.; Sander, J.W.; Lindhout, D. Effect of oral contraceptives on lamotrigine levels depends on comedication. Acta Neurol. Scand. 2014, 129, 393–398. [Google Scholar] [CrossRef]
Figure 1. PBPK model structure: (a) Minimal PBPK; (b) Full PBPK; (c) ADAM absorption. As shown in the full PBPK model (panel b), an additional foetal compartment is included in pregnancy-specific models.
Futurepharmacol 04 00018 g001
Figure 3. Lamotrigine healthy adult volunteer population plasma concentration profiles. Green lines represent the predicted mean and grey the 5th and 95th percentiles. The overlayed mean observed data points were extracted from clinical studies including various dosing regimens: (a) 25 mg SD [23]; (b) 100 mg SD yellow [24] blue [25] green [26] red [27]; (c) 200 mg SD yellow [28] blue [29] green [29] red [30]; (d) 50 mg QD [31]; (e) 150 mg QD [32]; (f) 200 mg QD [33] (g) 50 mg BID [34] (h) 100 mg BID yellow [35] blue [36]; (i) 150 mg BID [37].
Futurepharmacol 04 00018 g003
Figure 4. Predicted-to-observed ratios of mean PK parameters for lamotrigine adult population simulations. Yellow dots represent AUC while green represent Cmax. The shaded area represents the 2-fold range. The observed data is quoted from literature [23,24,25,26,27,28,29,30,31,32,33,34,35,36,37]. SD—single dose, QD—once daily, BID—twice daily.
Futurepharmacol 04 00018 g004
Figure 5. Plasma concentration profiles of raltegravir. Green lines represent the predicted mean and grey the 5th and 95th percentiles. The overlayed mean observed data points were extracted from clinical studies, including various dosing regimens. (a) The 400 mg SD adult population: yellow [43], blue [48], red [48], green [49], purple [50] and pink [51], respectively; (b) the 400 mg QD adult population: yellow [52], blue [53] and red [54], respectively.
Futurepharmacol 04 00018 g005
Figure 6. Predicted-to-observed ratios of mean PK parameters for raltegravir adult population simulations. Yellow dots represent AUC while green represent Cmax. The shaded area represents the two-fold range. The observed data is quoted from literature [46,47,48,49,50,51,52,53,54,55].
Futurepharmacol 04 00018 g006
Figure 7. Raltegravir plasma concentration profiles. The blue lines are observed patient data [56]. Red lines are mean model predicted concentrations. (a) Second trimester 21 GW. (b) Third trimester 34 GW. (c) Baseline.
Futurepharmacol 04 00018 g007
Table 1. Examples of physiological changes during pregnancy [5,6,7,8,9,10,11,12,13,14,15,16,17,18].
AbsorptionIncreased gastric pH
Increased cardiac output
Decreased intestinal motility
Nausea/Vomiting
DistributionIncreased plasma volume
Increased body water and fat
Decreased plasma protein concentration
MetabolismIncreased CYP3A4 activity
Increased CYP2B6
Increased CYP2D6
Increased CYP2E1
Increased CYP2C8
Increased CYP2C9
Decreased CYP2C19
Decreased CYP1A2
Increased UGT1A1
Increased UGT1A4
Increased UGT2B7
EliminationIncreased glomerular filtration rate
Increased renal P-gp, OATs, OCTs and MATE transport
Table 2. List of clinical studies used in model validation.
DrugPopulationStart at
Gestational Week
Dosing ScheduleDose Level (mg)Clinical Trial ReferencenData Used for Validation
LamotrigineNon-pregnant-SD25Ebert et al. [23]10Graphical and numerical
100Birnbaum et al. [24]12
Srichaiya et al. [25]24
Van Luin et al. [26]24
Keränen et al. [27]6
200Hermann et al. [28]15
Wootton et al. [29]12
Incecayir et al. [30]14
QD50Jann et al. [31]14
150Almeida et al. [32]32
200Sidhu et al. [33]12
BID50Chien et al. [34]24
100Colluci et al. [35]21
Van der Lee et al. [36]8
150Doose et al. [37]13
Pregnant0BID400Reimers et al. [38]19Numerical
36
0406.54Reisinger et al. [39]69
10426.81Pennell et al. [40]14
20564.90Ding et al. [41]12
36664.49Fotopoulou et al. [42]9
0350Fotopoulou et al. [43]9
40600
RaltegravirNon-pregnant-SD400Wenning et al. [44]10Graphical
Iwamoto a et al. [45]10
Iwamoto b et al. [46]6
Wang et al. [47]6Graphical and numerical
Blonk et al. [48]18
BIDTaburet et al. [48]21
Hanley et al. [49]15
Weiner et al. [50]21
SDRhee et al. [51]10Numerical
QDRizk et al. [52]22
BDMarkowitz et al. [53]8
Andrews et al. [54]18
Brainard et al. [55]20
Pregnant0BID400Watts et al. [56]16Graphical and numerical
2141
3438
0Blonk et al. [57]22Numerical
34
0Zheng et al. [58]43
34
Table 3. Simcyp v.21 Compound file PBPK parameters used to generate lamotrigine and raltegravir models. PO:W—octanol:buffer partition coefficient, B/P—blood-to-plasma partition ratio, Fu—fraction unbound, fa—fraction available from dosage, Fugut—fraction unbound in enterocytes, ka—first-order absorption rate constant, Peff,man—human jejunum effective permeability, Caco-2—Caco-2 permeability, Vss—Volume of distribution, Kp scalar—scalar applied to all predicted Tissue:Plasma partition coefficients, CLint—in vitro intrinsic clearance, Vmax—maximum rate of metabolism, Km—Michaelis–Menten constant, Fumic—fraction unbound in in vitro microsomal incubation, ISEF—Inter System Extrapolation Factor for scaling of recombinant CYP in vitro kinetic data, CLR—renal clearance.
ParameterLamotrigineRaltegravir
Phys Chem And Blood Biding
Molecular weight (g/mol)256.09444.42
LogO:W1.191.07
Molecule typeMonoprotic baseMonoprotic acid
pKa5.56.7
B/P10.62
Fu0.450.17
Absorption
fa0.99915 (Predicted)1
Fugut1 (User input)1
ka(1/h)3.3889 (Predicted)0.4
Lag time (h) 0.3
Peff,man (10−4 cm/s) (Predicted)7.761 2.0864
Caco-2 (10−6 cm/s) 6.5:7:4 P&A73.79.2
Distribution
Full PBPK
Vss (L/kg) (Predicted—Method 2)1.05750.1452
Kp scalar2.21
Elimination
Enzyme kinetics
EnzymeUGT1A4UGT1A1
CLint (pmol/min/pmol of isoform) 1.48
Vmax (pmol/min/pmol of isoform)153
Km (µM)550
Fumic11
ISEF0.0771
EnzymeUGT1A3
Vmax (pmol/min/pmol of isoform)17
Km (µM)700
Fumic1
ISEF0.077
CLR (L/h)0.23.3
Fumic, ISEF and Kp are unitless parameters because they are ratios or numerical scalars.
Table 5. Mean lamotrigine PK parameters during pregnancy.
Baseline1st Trimester2nd Trimester3rd Trimester3rd Trim/Baseline %Change
Pred.Obsv.Pred.Obsv.Pred.Obsv.Pred.ObsvPred.Obsv.
Cmax (mg/L) [38]9.9714.5 ± 9.2----4.955.3 ± 4.3−63%−50%
AUC (mg/Lxh) [38]187.2137.3 ± 66.4----79.443.4 ± 34.2−68%−58%
CL (mg/(mg/L)) [39,40,41,42]40.650.7582.6678.89 115.05120.19 144.45124.20 +256%+164–224%
3977 92 103
52.988.5132.5 171.2
40.373.9122.2120.5
Table 6. Percent changes in mean PK parameters of raltegravir between the 2nd and 3rd trimester and baseline [56,57,58].
Baseline2nd Trimester 3rd Trimester2nd Trim/Baseline %Change3rd Trim/Baseline %Change
Pred.Obsv.Pred.Obsv.Pred.Obsv.Pred.ObsvPred.Obsv.
Cmax (mg/L)2.233.041.422.251.061.77−36%−25% −52%−42%
1.761.43
AUC (mg/L h)8.6511.65.366.64.005.4−38%−43%−53%−53%
7.115
6.773.92
9.295.36
CL (L/h)61.0634.8100.8160139.2174.8+65%+72%+128%+115%
56.280.1
53102
Table 7. AFE and AAFE values.
LamotrigineRaltegravir
AFEAAFEAFEAAFE
Cmax a1.031.071.051.17
AUC a0.991.131.061.18
CL p1.021.11--
AUC p--0.821.24
a—normal (non-pregnant/mixed sex) population model. p—pregnancy population model.
Disclaimer/Publisher’s Note: The statements, opinions and data contained in all publications are solely those of the individual author(s) and contributor(s) and not of MDPI and/or the editor(s). MDPI and/or the editor(s) disclaim responsibility for any injury to people or property resulting from any ideas, methods, instructions or products referred to in the content.

