Article

Crypto Asset Markets vs. Financial Markets: Event Identification, Latest Insights and Analyses

1
Bank of Greece, 10250 Athens, Greece
2
Banque Centrale du Luxembourg, 2983 Luxembourg, Luxembourg
3
European Central Bank, 60314 Frankfurt am Main, Germany
*
Author to whom correspondence should be addressed.
AppliedMath 2025, 5(2), 36; https://doi.org/10.3390/appliedmath5020036
Submission received: 19 November 2024 / Revised: 7 February 2025 / Accepted: 20 February 2025 / Published: 2 April 2025

Abstract

:
As crypto assets become more widely adopted, crypto asset markets and traditional financial markets may become increasingly interconnected. The close linkages between these markets have potentially important implications for price formation, contagion, risk management and regulatory frameworks. In this study, we assess the correlation between traditional financial markets and selected crypto assets, study factors that may impact the price of crypto assets and identify potentially significant events that may have an impact on Bitcoin and Ethereum price dynamics. For the latter analyses, we adopt a Bayesian model averaging approach to identify change points in the Bitcoin and Ethereum daily price time series. We then use the dates and probabilities of these change points to link them to specific events, finding that nearly all of the change points can be associated with known historical crypto asset-related events. The events can be classified into broader geopolitical developments, regulatory announcements and idiosyncratic events specific to either Bitcoin or Ethereum.

1. Introduction

According to Iyer and Popescu [1], crypto asset markets can act both as a source of shocks or as an amplifier of overall market volatility. Consequently, they have the potential to have a significant impact on financial stability, as also indicated by the Financial Stability Board ([2,3]. Policymakers therefore face an imperative to enhance their comprehension of the interconnections and dynamics between crypto assets and financial markets. A better understanding of these linkages will enable policymakers to design regulatory frameworks that can help to mitigate the potential adverse effects of crypto assets on financial stability and risk management. Although crypto asset prices tend to be persistently positively correlated (see e.g., [4]), it is nevertheless interesting to study (a) how their correlation varies in relation to external events, which also have an impact on traditional finance (in this study, we use the term “traditional finance” in the context of the “real economy”, which relates to the system of financial intermediaries comprising commercial banks, investment banks and pension and insurance funds that act in support of the real economy), and (b) the correlation of crypto asset prices with traditional financial indices.
Lahajnar and Rozanec [4] have shown that, during favourable periods, the correlation between crypto asset markets and financial markets tends to be lower compared to bad times. In other words, the presence of strong correlation when prices are falling can hinder the effective diversification of risk. Guesmi et al. [5] showed that hedging strategies involving gold, oil, emerging stock markets and Bitcoin reduce the portfolio’s risk, more than the same portfolios without the crypto asset. In contrast to this, Ibrahim et al. [6] found the existence of a volatility contagion in the long term between stock market indices and Bitcoin, suggesting that its hedging properties might not be so strong. Zhang et al. [7], who also studied the impact of cryptocurrency price volatility on the stock and gold markets, found a positive correlation with the stock markets and negative correlation with the gold markets. Zhou [8] used network science to explore the transmission of financial risk between crypto assets and traditional financial markets, while Kayani et al. [9] analyzed the effect of cryptocurrencies on financial markets and conventional banking systems from a policy and regulatory perspective. Kyriazis et al. [10] studied the correlation between different crypto assets and their diversifying and hedging capabilities during stressed periods (when hedging is more necessary), showing that most crypto assets are complementary to BTC, ETH and XRP. Okorie et al. [11] investigated the volatility spillover and hedging strategy possibilities between the crude oil and cryptocurrency markets. Hsu et al. (2021) [12] investigated the risk spillovers of major cryptocurrencies to traditional currencies and gold and identified significant co-volatility spillover effects. Nakagawa et al. [13] examined the effect of Bitcoin network factors to the expected return of gold. Naeem et al. [14] examined the nonlinear relationship between oil returns/shocks and cryptocurrencies. Huang [15] examined the relationship between cryptocurrencies and convention financial markets, concluding that adding cryptocurrencies to portfolios with only traditional financial assets can significantly reduce risk.
Furthermore, it is worth investigating the effect of external events on the prices and traded volumes of crypto assets. Some authors in the literature (e.g., Yan et al. [16]) have found the relationship between COVID-19 and crypto assets to be significant, with implications for both prices and correlation. Alexakis et al. [17] examined trading activity in cryptocurrencies in times of geopolitical crises. Kayral et al. [18] noticed that the correlation between Bitcoin and G7 stock indices during the Russia–Ukraine war was even more significant than during the COVID-19 pandemic. Nie [19] showed that the correlation between crypto assets indeed changes in correspondence to certain dates when there was an effect on financial markets, but without identifying the events. Coulter [20] studied the impact of news on Bitcoin prices, while Jobst et al. [21] examined the impact of external events, such as the FTX and Luna crashes, to the liquidity of exchanges. There is also a limited number of studies on the effect of more recent events such as the Israeli/Palestinian conflict (see e.g., [22]). We consider that there is a gap in the literature regarding the identification of the events that may have a significant impact on crypto asset price dynamics. One of the contributions of this paper is to try to identify these events through the use of a change point detection methodology. To the best of our knowledge, research on crypto assets is usually based on modeling the time-series volatility using GARCH models, see, e.g., [23,24,25].
The identification of these events may also facilitate an assessment of the degree of interconnection between the traditional financial system (TradFi) and decentralized finance (DeFi). The study of the literature regarding the interconnections between TradFi and DeFi led us to pursue the following three lines of investigation:
(a)
Identified potential breakpoints in the prices/volumes of key crypto assets and mapped them to significant events taking place worldwide.
(b)
Investigated the correlations between crypto asset prices and major stock market indices and commodities.
(c)
Investigated the effects of external events on crypto asset correlation.
The remainder of this paper is structured as follows. In Section 2, we examine the interconnections between the traditional financial markets and crypto asset markets via the analysis of prices and traded volumes of crypto assets by identifying significant events that may have an impact on their price dynamics, e.g., regulatory developments, cryptocurrency-related developments, geopolitical conflicts and idiosyncratic events such as the erroneous report about BlackRock’s Bitcoin ETF. The event analysis is based on the identification of change points in the price series of Bitcoin and Ethereum, the two most prominent cryptocurrencies in terms of their market cap, accounting for around 70% of the entire global cryptocurrency market (https://money.usnews.com/investing/cryptocurrency/articles/bitcoin-vs-ethereum-which-is-a-better-buy) (accessed on 4 February 2025), and subsequently mapping them to specific events. In Section 3, we examine the correlation between the prices of crypto assets and major stock market indices (both globally and in the EU), in order to identify potential interconnections and price co-movements. In Section 4, we examine the correlation between the prices and yields of crypto assets and commodities. In Section 5, we analyze the impact of external events on the correlation of crypto asset prices. It is worth studying these patterns in order to provide insights into the implications for portfolio risk management and to identify possible hedges. In Section 6, we present our conclusions and outline possible future lines of investigation.

2. Interconnections Between Traditional Financial Systems and Crypto Markets via the Analysis of Prices of Crypto Assets in Relation to Key Events

The objective targeted in this section is to identify whether events relevant to cryptocurrency markets can be associated with change points in the price time series. Our methodology is presented in Section 2.1, whereas the results are presented in Section 2.2 together with a categorization of the identified events and presentation of indicative ones. The identified events are catalogued in the Appendix.

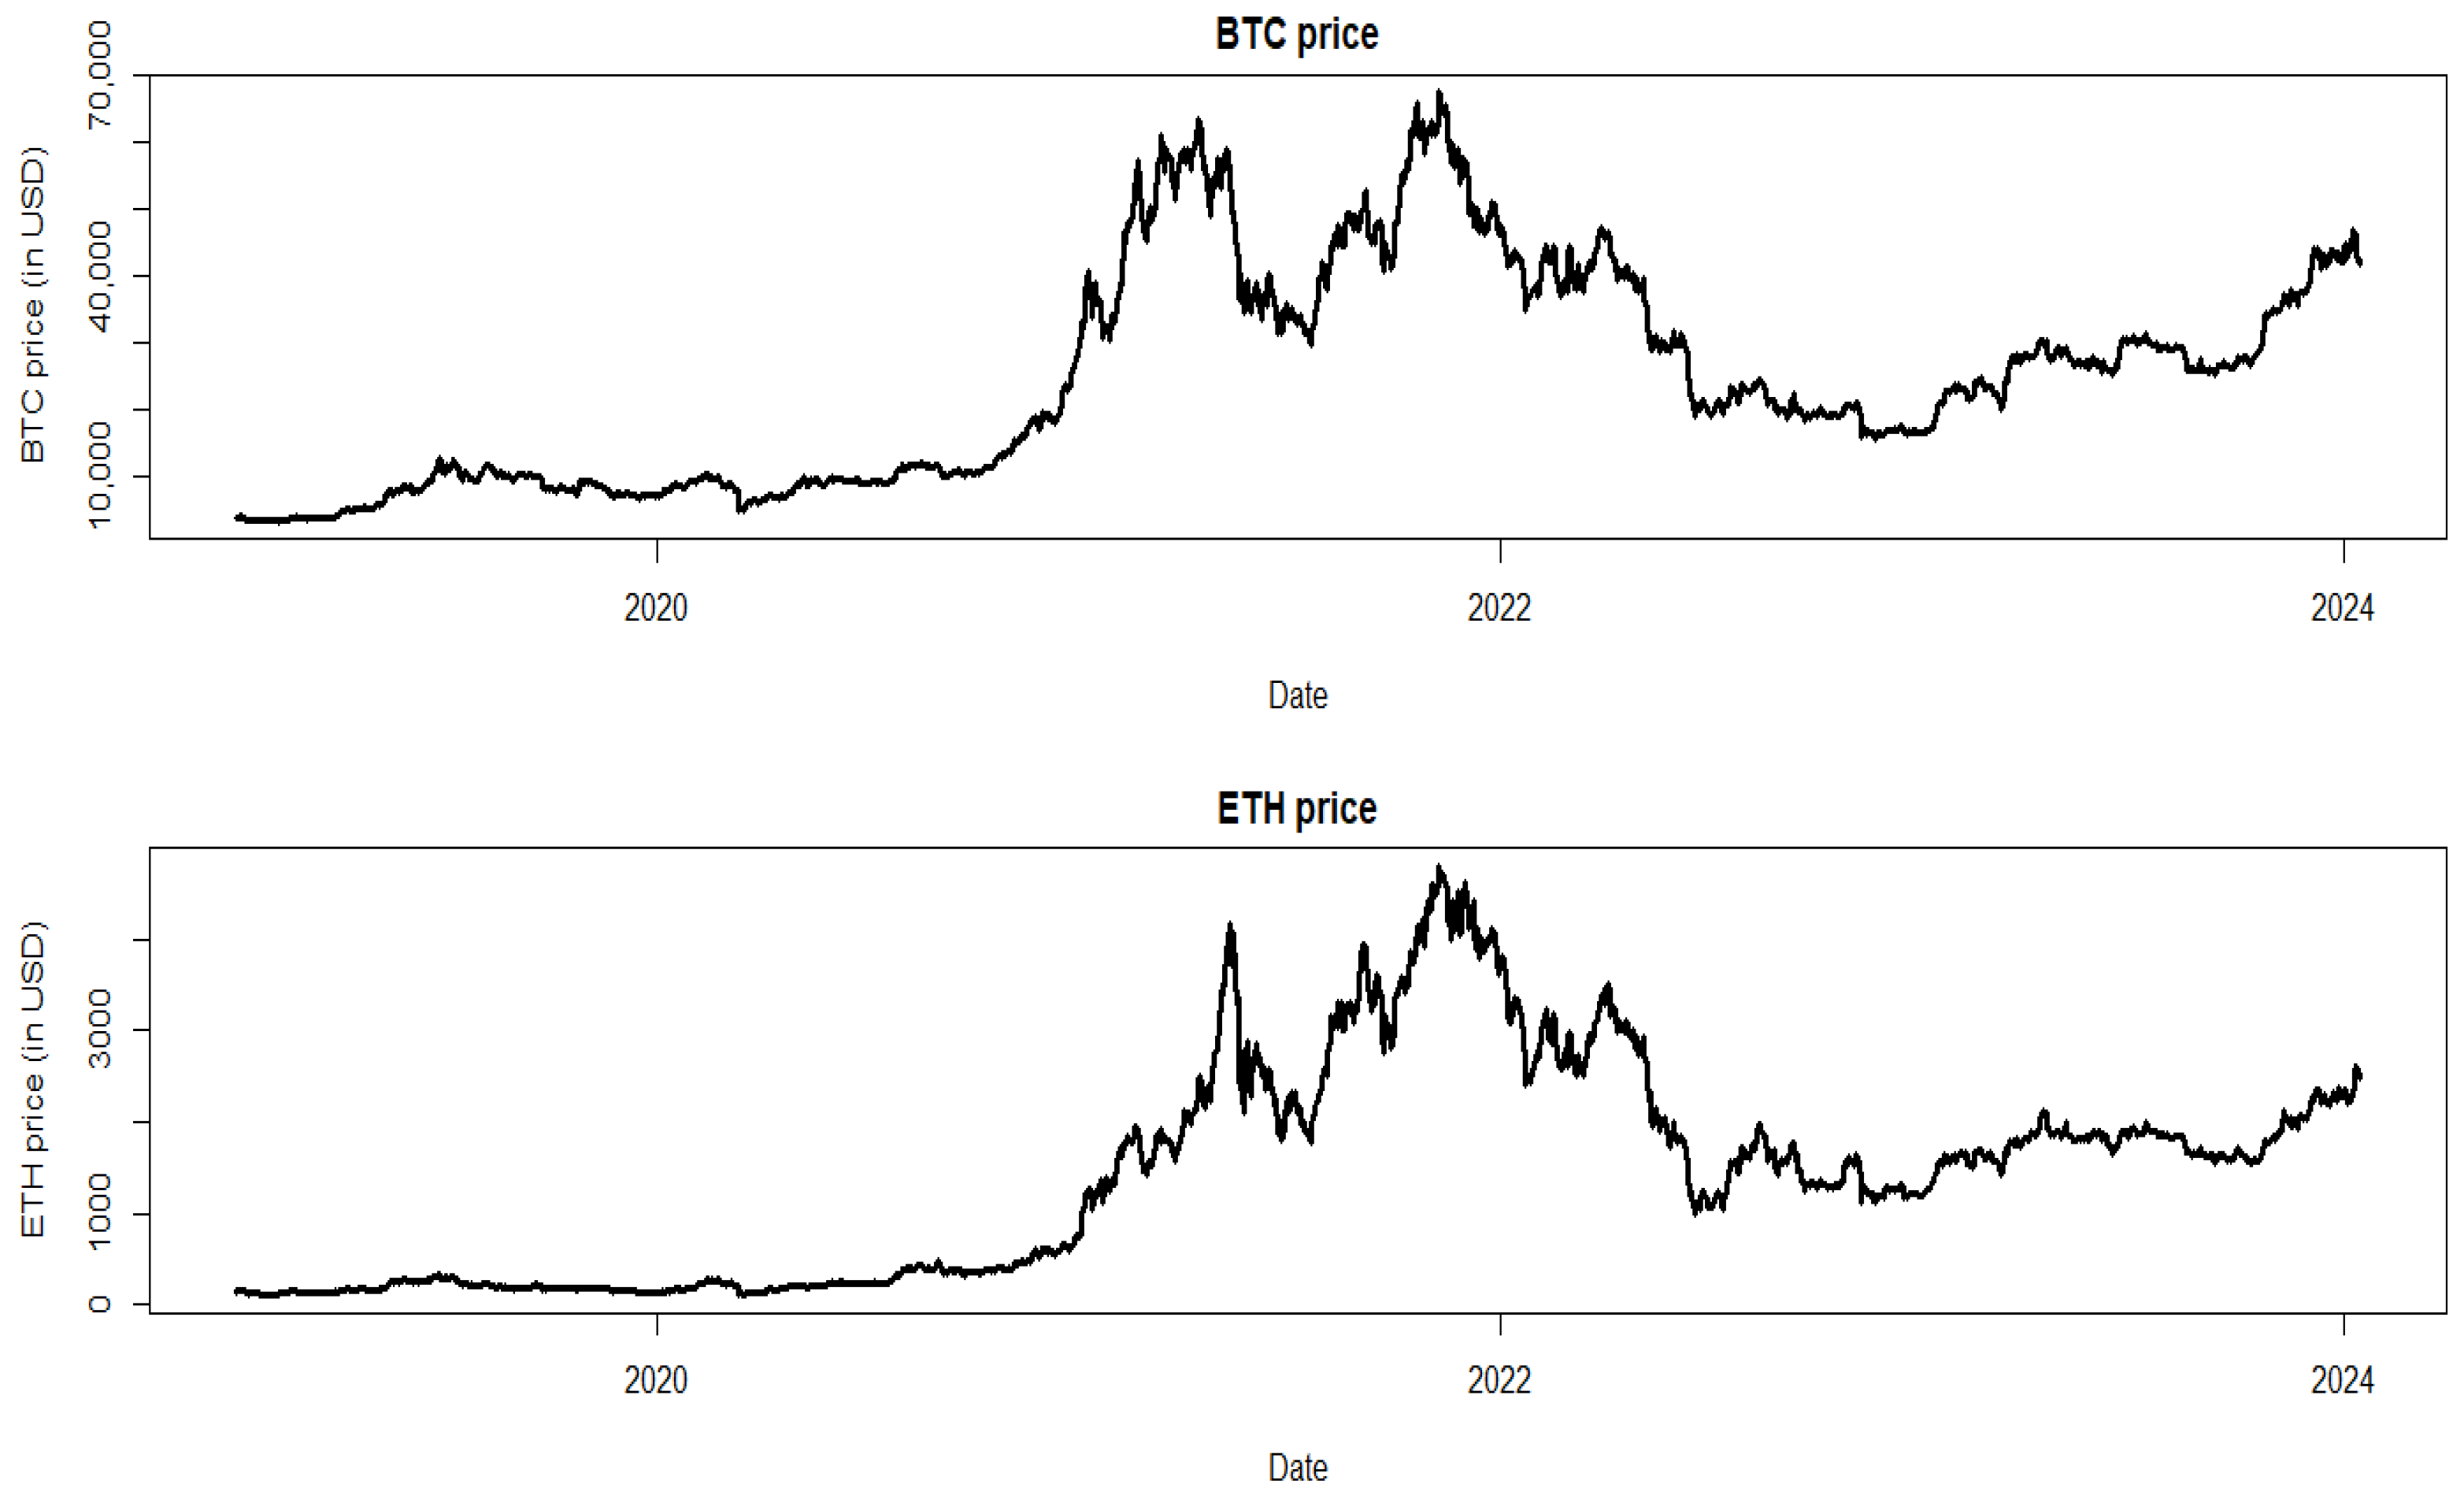
2.1. Change Points in the Price Series of Bitcoin and Ethereum and Event Identification

Techniques for assessing ecosystem dynamics are commonly used in the remote sensing literature (see e.g., [26]) to detect changes in land use and ecosystem change over time. These methods can be applied to satellite imagery in order to decompose a time series of images into terrestrial or vegetation dynamics in order to identify changes in trends or abrupt changes in the image series (e.g., the effect of forest fires or illegal logging). A general approach to the problem is to fit different model specifications in order to identify a “best” model that is selected based on the optimization of an information criterion such as Akaike’s information criterion (AIC) or other metrics like the Bayesian information criterion (BIC). However, the use of such criteria in practice can lead to the identification of different “best” models depending on the model specification, the criterion used or even the optimization algorithm employed. The underlying issue with the formulation of different “best” models is that the use of these different models may result in inconsistent inferences or conclusions about the underlying dynamics. Moreover, model selection based on information criteria can also introduce an element of subjectivity in the choice of model, resulting in overlooking the degree of model uncertainty. Although models specified with a large number of parameters may capture the complexity of the underlying dynamics, they are prone to misspecification as well as overfitting.
Bayesian model averaging (BMA) is an approach that can be used to address the aforementioned modeling challenges. BMA allows for the computation of parameter estimates through averaging the estimates of different candidate models. The approach allows for the construction of a posterior distribution for a given parameter, which is a weighted mixture of the probabilities assigned to the different models. Under the Bayesian approach, conclusions can be drawn based on a range of models rather than on a single model for which an alternative specification may provide different conclusions. We therefore propose to identify significant price-related events in the Bitcoin (BTC) and Ethereum (ETH) price series by adopting the Bayesian methodology used to detect changes in trend in the remote sensing literature. Specifically, we adopt the methodology developed by Zhao et al. [27] that is intended to identify change points as well as structural changes in the trend of a time series.
The approach in [27] is to assume that a time series can be represented as a linear combination of three components, a set of change points, a trend and a seasonal component, as follows:
y i = S t i ; Θ S + T t i ; Θ T + ε i
where S · and T · are the seasonal and trend components, respectively. ε is assumed to be Gaussian noise. The abrupt changes are assumed to be contained in the S · and T · terms, specifically in Θ S and Θ T . Both Θ S and Θ T are estimated directly from the data.
The trend component is modeled by first dividing the time series into m knots located at times τ j , where j = 1 , , m . This divides the time series into m + 1 intervals over τ j , τ j + 1 , where j = 0 , , m . The endpoints of the time series are therefore τ 0 = t 0 and τ m + 1 = t n . Once the time series has been divided into the m + 1 segments, the piecewise trends are modeled as follows:
T t = a j + b j t
where τ t t < τ j + j for j = 0 , , m .
Importantly, the number of change points, m , as well as the times τ j j = 1 , , m at which they occur, are taken as unknown. In view of the above, the ensemble of parameters that defines the trend, T , of the time-series data can therefore be described as follows:
Θ T = m τ j j = 1 , , m a j , b j j = 0 , , m
As mentioned, Θ T encodes the number and temporal location of the change points and the probability that a change point occurs at a knot, as well as the slopes, b j , and intercepts, a j , of the line segments that define the trend.
In the context of our cryptocurrency analysis, we omit the seasonal component and model the price series as a combination of the trend and innovation terms, where the innovation term is used to explain those components of the series not encoded in either the trend or the seasonality. Had we included the seasonality term, according to the approach in [27], it would have been modeled by a piecewise harmonic term. For the purpose of our study, we are most interested in the identified change point dates as well as their respective probabilities, as they will identify the likely timing and probability of a significant event that affects the cryptocurrency price dynamics.
One of the main objectives of this study is to identify whether events relevant to cryptocurrency markets can be associated with change points in the price time series. We therefore also model a seasonal component in order to avoid any spurious event identifications. Nevertheless, the identification of events is based solely on the trend component, thereby assuming that any seasonality in crypto asset prices is transient or due to cyclical price fluctuations (see, e.g., [28]). We model a quarterly seasonal component in order to capture any regular effects such as closing out of financial positions, end-of-year “window dressing” or recurring seasonal fluctuations. As a detailed presentation of the Bayesian modeling framework is beyond the scope of this work, we therefore refer the reader to [27] for a full exposition of the approach.

2.2. Results of the Event Identification Using Bayesian Model Averaging (BMA)

Figure 1 shows the price and volume series for Bitcoin (BTC) and Ethereum (ETH), respectively.
The upper panel of Figure 1 shows the initial relatively low price of BTC prior to 2021, and then the sudden and rapid increase in the price of Bitcoin up until end 2021, where there was a prolonged decline. The period from mid-to-late 2022 until 2024 demonstrates only modest growth. The repeated increase and decline in the price are characteristic of the high level of volatility in the price series and reflects the considerable risk profile of the asset. The numbers of factors that underpin the price formation process are likely diverse and it seems probable that price developments could be highly sensitive to idiosyncratic BTC-related events. The lower panel of Figure 1 shows the price series for the Ethereum cryptocurrency. The price series displays similar characteristics to the BTC price series, but with some differences, including the timing of price peaks and declines and the growth rate, as well as the volatility of the series. Despite these differences and the fact that the ETH price is assumed to be affected by different events than BTC, there nevertheless appears to be a strong co-movement in the two price series over time. The observation of possible strong co-movement between the two price series is supported by the dynamic conditional correlations between BTC and ETH, as shown in Figure 2.
The results of the DCC GARCH [29] estimation in Figure 2 show the very high and persistent level of correlation between the BTC and ETH price series over a prolonged period of time. With the exception of the period between June 2020 and November 2021, the dynamic conditional correlation between the two prices series is consistently between 0.6 and 1 except for a period between late 2020 and 2021 when the level of correlation was between 0.4 and 0.6. The high correlation between BTC and ETH suggests that the two price series may be impacted by common events. We have used the Bayesian model averaging approach to identify potential change points in the two series.

Event Identification

Figure 3 and Figure 4 show the results of the change point detection for the price series of both BTC and ETH. The figures show the daily price series of each cryptocurrency along with the model-estimated probability of a change point at time t . An associated text label describes each of the events. Some events are common to both series including the COVID-19 pandemic in March 2020, the crypto price crash in August 2023 and the Terra-Luna crash in 2022. However, there is also a significant number of idiosyncratic events that are cryptocurrency specific and therefore not common across the two crypto assets.
Figure 5 and Figure 6 show similar charts for the daily volatility series of both Bitcoin and Ethereum. Like the price charts, the volatility plots also show the results of the change point detection for the volatility series of both BTC and ETH. They also include the model-estimated probability of a change point at time t . The dates of these change points are the same as those for the price series. An associated text label describes each of the events. The events broadly coincide with periods of high volatility or significant spikes in the volatility series suggesting that the identified events can have a potentially significant impact on the cryptocurrency price dynamics.
For the Bitcoin-related change points (a catalogue of the identified events, details of their timings and a short description are provided in the Appendix), some of the BTC-specific events include the breaching of historical price highs, geopolitical events, crisis events and calls for cryptocurrency regulations. In the case of ETH, various ETH-specific developments are represented among the events including ETH sell-off events, the Alchemy NFT investment, breaches of historical ETH price thresholds and the FTX deal to sell to Binance.
In view of the events identified in the context of the BTC and ETH price-series change point analysis, these indicative examples of crypto-related developments can provide an indication of events that can also affect traditional finance. In view of these results, we propose the following categories of influential events that could result in a higher degree of interconnectedness between TradFi and DeFi:
(a)
Oracle errors. Oracles are components of the DeFi ecosystem that provide blockchains with real-world prices. It has been shown that in some cases where oracles malfunctioned or were subject to manipulation, there was an impact on the prices or volumes of various crypto assets due to the subsequent negative reputational effects.
(b)
Centralized crypto exchange failures. Such failures may have a negative impact on crypto asset prices due to the subsequent lack of trust and or the adverse impact on price formation.
(c)
Supervisory actions and/or regulatory announcements that concern crypto exchanges or specific crypto assets may have an effect on crypto asset prices.
(d)
Bank failures (e.g., the failure of Silicon Valley Bank (SVB)) with a focus on high-tech industry that destabilized a stablecoin dollar peg and impacted other banks and crypto firms via contagion channels.
(e)
News reports (both real and fake) regarding crypto assets can have a strong impact on crypto asset prices, similar to how adverse news can affect equity prices (e.g., insider trading, market manipulation, so-called meme stocks).
(f)
The impact of significant geopolitical developments such as the Russian invasion of Ukraine and the Israel/Palestinian conflict can affect crypto asset prices due to investor uncertainty, supply disruptions, market volatility, etc.
In order to better understand the impact of these events on cryptocurrency prices, we present a few specific cases in more detail.
A.
Oracle Errors
7 May 2022. In 2022, the algorithmic stablecoin Terra USD lost its dollar peg and the value of its associated LUNA token decreased sharply, resulting in billions of dollars in outflows from DeFi applications associated with Terra, as well as the halting of the Terra blockchain. The failure of Terra together with a misconfiguration of the Chainlink oracle (oracles are third-party services/companies that allow smart contracts to access real-world data, acting as bridges between the real world and DeFi) led to further speculative actions. More specifically, the Chainlink oracle, which was feeding LUNA’s price on chain and was used to value LUNA collateral pledged on DeFi platforms, hardcoded the price of LUNA at USD 0.10 and stopped updating LUNA’s price when the Terra ecosystem was suspended. The price of LUNA dropped below the hardcoded USD 0.10 to USD 0.01 and eventually to USD 0, but this was not reflected on platforms such as Blizz Finance. As such, people who noticed the flaw were able to buy large amounts of LUNA at the market price (USD 0.01) and subsequently post it as collateral and borrow funds from Blizz at a value of USD 0.10.
Apart from the apparent impact of an oracle error on the crypto assets, the price of which is reported erroneously, more crypto assets are expected to be affected due to the interconnections in DeFi markets and to potential panic in crypto asset markets.
B.
Centralized crypto exchange market failure
11 November 2022. In 2022, the insolvency of FTX, at the time one of the largest centralized crypto asset platforms globally, reportedly impacted certain DeFi protocols and ecosystems with which FTX was associated or had supported, and also impacted FTX’s customers, counterparties and investors, with the resulting effects propagating into DeFi protocols with whom those parties had interlinkages.
C.
Supervisory action
On 13 February 2023, the New York Department of Financial Services (NYDFS) announced that it had ordered Paxos Trust Company (Paxos), a regulated blockchain and tokenization infrastructure platform operating in New York state under NYDFS supervision, to cease minting its Paxos-issued Binance-branded stablecoin, Binance USD (BUSD). The announcement indicated that the NYDFS order resulted from unresolved issues relating to Paxos’ oversight of its relationship with the cryptocurrency exchange Binance.
Paxos issued a press release in response to the NYDFS announcing that the cessation of BUSD token issuance would be effective as of 21 February 2023. The release also indicated that BUSD will continue to be supported by Paxos and redeemable to on-boarded customers through at least February 2024 (currently, Paxos no longer mints new BUSD, but allows customers to redeem BUSD for USD or convert their BUSD to USDP).
D.
Silicon Valley Bank Failure, 10 March 2023
Silicon Valley Bank (SVB) was a chartered bank (a chartered bank is a financial institution (FI) whose primary roles are to accept and safeguard monetary deposits from individuals and organizations, as well as to lend money) mainly operating in the San Francisco Bay area and closely tied to the high-tech industry. Its depositor base included start-up companies, fintech companies and crypto firms. SVB started facing large deposit drains. The high vulnerabilities of SVB, inadequate supervision and heavy losses following interest rate increases led to its collapse in March 2023. More specifically, Silicon Valley Bank was ordered to close by the California Department of Financial Protection and Innovation on 10 March 2023.
According to Reuters, on 11 March 2023, the stablecoin USD Coin (USDC) lost its dollar peg and dropped to an all-time low. This was reportedly caused by a tweet from Circle, the issuer of the stablecoin USDC, that said it held USD 3.3 billion of its USD 40 billion in USDC reserves at Silicon Valley Bank. According to Circle’s January reserve report, the firm held USD 9.88 billion in cash deposited at regulated banks to back USDC’s value. According to Circle’s website on March 10, cash deposits in the reserves amounted to USD 11.1 billion. Circle tweeted that Silicon Valley Bank is one of six banking partners Circle used to manage about 25% of USDC reserves held in cash (around USD 3.3 billion). USDC recovered most of its losses after Circle assured investors it would honour the peg despite the exposure to the failed Silicon Valley Bank.
Moreover, while all its deposits were fully guaranteed, SVB’s failure impacted two other banks with a strong crypto focus. These banks were Silvergate Capital and Signature, which held cash for Circle’s USDC. SVB’s specialization in lending to start-up companies also suggests that a relatively large fraction of SVB deposits were also owned by crypto firms, which were exposed to the failure of SVB.
E.
News (fake and real) about regulatory developments, for example, about the approval of an application of BlackRock for a spot Bitcoin ETF
16 October 2023. The price of Bitcoin rallied following a false report on social media that the Securities and Exchange Commission (SEC) approved an application for a spot Bitcoin exchange-traded fund (ETF). Bitcoin prices briefly touched USD 29,900, a more than 10% increase, before losing most of those gains, according to FactSet. Bitcoin prices remained up more than 4% on the day. That followed a now-deleted post on the social platform X by the crypto news service Cointelegraph, which stated that the SEC had approved an application by BlackRock’s (BLK) iShares for a spot Bitcoin ETF. A BlackRock spokesperson told MarketWatch that the iShares Bitcoin ETF is “still under review by the SEC”.
24 October 2023. Bitcoin dropped 3% after BlackRock BTC ETF was pulled from the Depository Trust and Clearing Corporation (DTCC)’s website. More specifically, the DTCC removed BlackRock’s Bitcoin ETF, iBTC, from its ETF list after analysts called attention to it on 24th of October 2023. Bitcoin’s price fell shortly after news of the removal broke out, dropping from USD 34,527 at 15:10 UTC to USD 33,432 (a 3% decline) over the next 30 min. The addition of IBTC to clearinghouse DTCC’s site after a few days had been a factor in Bitcoin’s significant price move.
19 December 2023. The price of Bitcoin had rebounded during the day, passing the USD 43,000 mark and settling above the USD 42,000 level (a 3.4% increase during the day). The increase had come as the asset manager, BlackRock, made key changes to its spot Bitcoin exchange-traded fund (ETF) application. Furthermore, the expectation of a spot Bitcoin ETF from BlackRock had been reported to be driving near-term Bitcoin price highs for weeks. Following the approval, the price of Bitcoin increased further.
F.
Geopolitical Conflicts
Israel/Palestinian conflict, Oct. 2023
7 October 2023. Analysts suggest (https://www.businesstoday.in/personal-finance/news/story/is-israel-hamas-conflict-impacting-the-cryptocurrency-market-here-is-what-investors-must-know-402248-2023-10-17 (Accessed on 4 February 2025)) that if the Israel–Hamas conflict contributes to a broader sense of global uncertainty, it could potentially drive some investors towards assets like Bitcoin, which may be considered by some investors as a store of value during times of uncertainty.
Russia–Ukraine war
24 February 2022. Reuters reported that Bitcoin slumped to its lowest value in a month after Russian forces invaded Ukraine.
Bitcoin fell by as much as 7.9% to USD 34,324, its lowest value since 24 January, and trading was down by 4.5%. Smaller cryptocurrencies that typically move in tandem with Bitcoin also declined, with Ether losing as much as 10.8% of its value.
There are additional analyses on the impact of the Russia–Ukraine conflict (https://a-e-l.scholasticahq.com/article/53110-the-impact-of-the-russia-ukraine-war-on-the-cryptocurrency-market (Accessed on 4 February 2025)) on Bitcoin (and other crypto assets’) prices and trading. Appiah-Otoo [30] provided the first empirical investigation of the impact of the Russia–Ukraine war on the cryptocurrency market (Bitcoin trading volume and returns). The findings indicate that the Russia–Ukraine war has impeded Bitcoin trading volume, showing that a 1% increase in the interest to the Russia–Ukraine war (as calculated by Google Trends) leads to a 0.2% reduction in Bitcoin trading volume. The findings also indicate that the impact has been more pronounced during the post-invasion period, especially after one week of the invasion, and that the Russia–Ukraine war has led to Bitcoin returns in both the short and long run.
There is also anecdotal evidence of the impact of the conflict on the price of Bitcoin. For example, according to Euronews, Bitcoin fell by as much as 7.9 per cent to USD 34,324 (EUR 30,570), its lowest since January 2022, with trading pushing the price lower. Smaller cryptocurrencies that typically move in tandem with Bitcoin also fell, with Ether losing as much as 10.8 per cent. In addition, more than USD 150 billion (EUR 133.64 billion) was reported as being lost across the cryptocurrency market in the first 24 h after the start of the war, according to Coinmarket cap data (https://www.euronews.com/next/2022/02/24/bitcoin-and-other-cryptocurrencies-plummet-after-russia-invades-ukraine) (Accessed on 4 February 2025).
The sanctions imposed on Russia have been considered as an impetus for the use of cryptocurrencies for the purpose of sanction evasion. One possible scenario is that Russian miners leverage the country’s plentiful energy reserves to mine Bitcoin (BTC) and then use unhosted wallets to move those Bitcoins in a series of crypto transactions. These transactions likely involving chain-hopping, tumblers and peer-to-peer (P2P) marketplaces to convert them into USD to pay for goods. Mixers could also be used with the well-known mixer Tornado Cash, which the U.S. Treasury Department sanctioned in August, which has already been used to launder around USD 9 billion. Reports suggest that the Russian government has an interest in building alternative financial rails to counter the dollar-based SWIFT financial communications system. This includes Russia’s SWIFT competitor SPFS (System for Transfer of Financial Messages) and its Visa/Mastercard competitor, MIR payments (https://www.coindesk.com/opinion/2022/09/19/why-russia-isnt-relying-on-crypto-to-evade-sanctions (Accessed on 4 February 2025)).

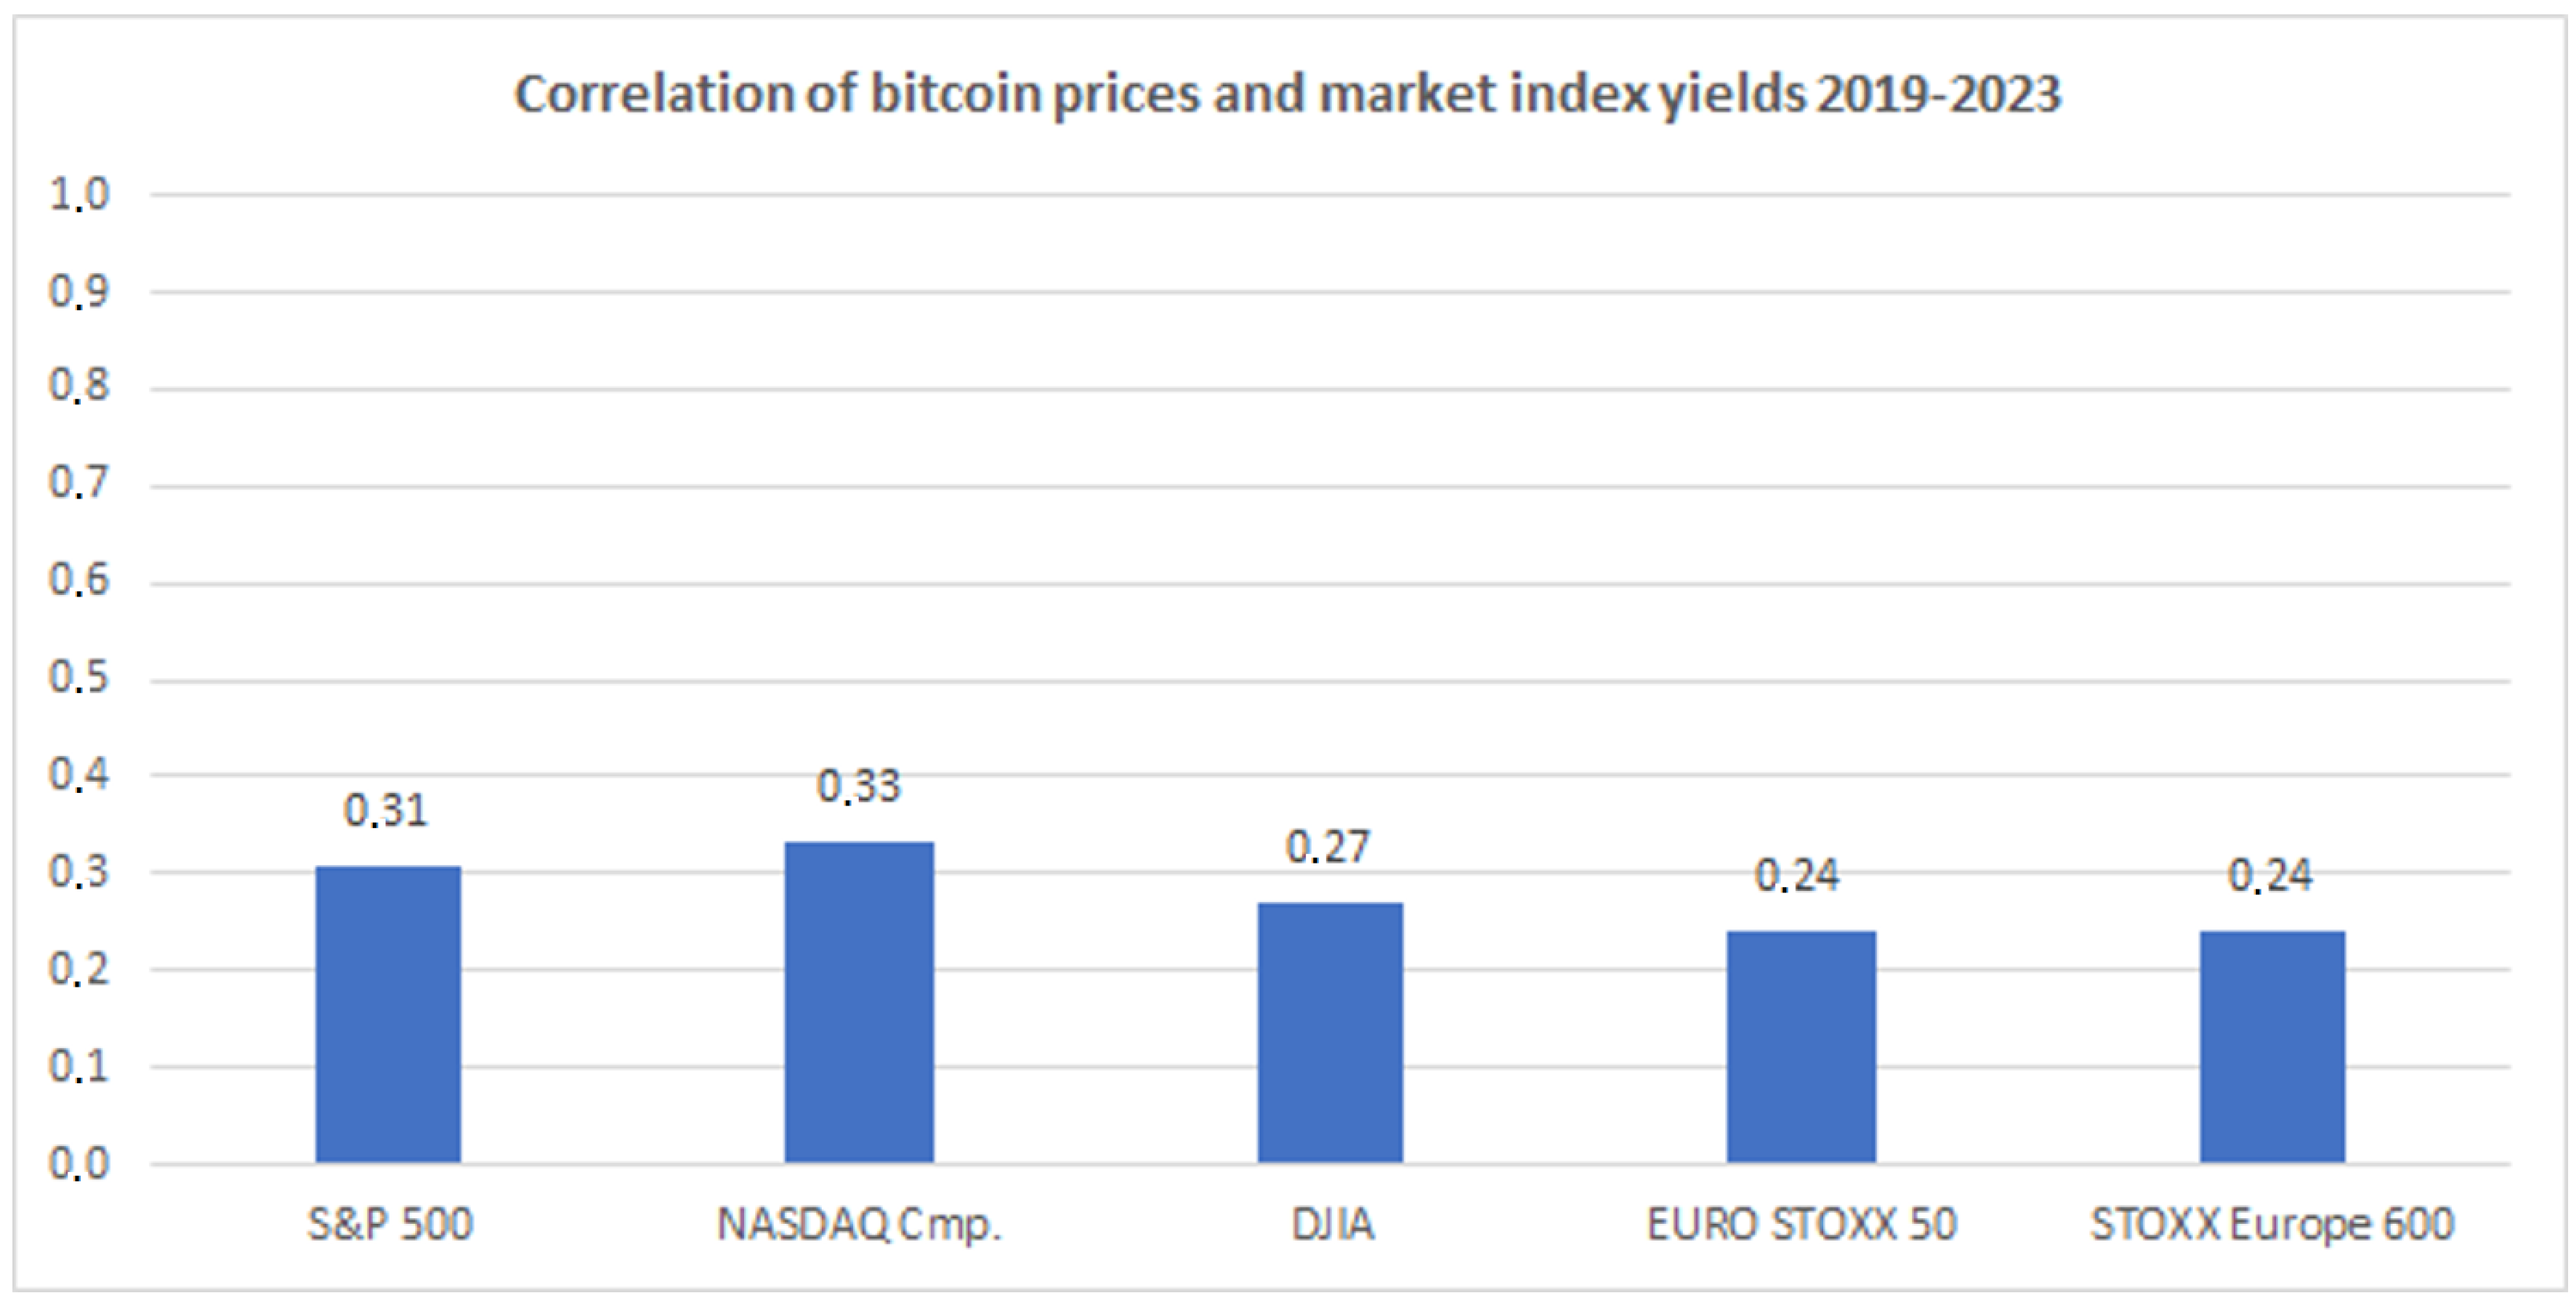
3. Correlation Between the Prices and Yields of Crypto Assets and Major Stock Market Indices

In this section, we explore the correlation between the prices and yields of cryptocurrencies and major stock market indices. Our intention is to explore the interconnections and interdependencies between mainstream financial markets and crypto asset markets. Specifically, we focus on Bitcoin in comparison to the S&P 500, NASDAQ Composite, Dow Jones Industrial Average, EURO STOXX 50 and STOXX Europe 600 indices. The indices are presented in Table 1, while their selection was made in order to provide an adequate sample of the global economy. The European market indices present additional interest from a Eurosystem point of view.
We examine the correlation of Bitcoin and the aforementioned indices for a 5-year period, namely 2019–2023, in total as well as per year. The price correlations for the whole period are presented in Table 2 and Figure 7, while the price correlations per year are presented in Table 3 and Figure 8. Similarly, the yield correlations for the whole period are presented in Table 4 and Figure 9, while the yield correlations per year are presented in Table 5 and Figure 10.
In general, the results indicate a high correlation of prices for the 5-year period. The breakdown per year shows fluctuations, the most notable being a considerable decrease for all stock market indices during 2021, where the minimum of the 5-year period is reached. Moreover, we notice that the correlation during 2019 is lower than the correlation of the years 2020, 2022 and 2023. The fact that the correlations increased after 2019 with a decrease in 2021 can be possibly explained by the increase in the institutional adoption of crypto assets around the world, on the one hand, and the financial implications of COVID-19, on the other hand; more research would be needed, however, to strengthen these assumptions.
The low correlation may also be explained by the fact that 2020 was characterized by very high market volatility due to the impact of the COVID-19 pandemic and its adverse impact on the global financial markets. During 2021, financial market volatility declined, and towards the end of 2021, the financial markets underwent a recovery, particularly in U.S. equities. The difference in the underlying dynamics of adverse market conditions during 2020 and the subsequent recovery in 2021 may be one reason for the low level of correlation calculated in 2021 compared to the previous year. Interestingly, Wang et al. [31] have shown that the COVID-19 pandemic shock had an impact on both Bitcoin and the traditional financial markets, and caused a decline in both the price of Bitcoin as well as a decline in market index levels, leading to a positive linkage between Bitcoin and the broader financial markets. These increased linkages throughout 2020 could also partly explain why 2021 exhibits much lower correlation compared to other years, particularly given the post-COVID-19 recovery and a possible disentangling of the COVID-19-induced linkages.
Despite these possible explanations for the notable decrease in correlation in 2021, work by English and Loretan [32] suggests that variation in the correlations between two assets may arise solely as a result of expected but unlikely variations in their realized conditional volatilities. More specifically, the lower correlation between Bitcoin and the broader financial markets computed for 2021 may result not from a change in the underlying data distribution or generating process but rather from correlation values arising from the lower tail of the distribution. We leave a more thorough examination of the lower correlation issue to future research.
It is also interesting that, in most cases, the correlation of Bitcoin prices to the U.S indices is higher than the correlation to the European indices. A potential explanation for this might be that cryptocurrency investors are either mostly located in the U.S. or mostly affected by U.S. markets in their investment decisions.
Concerning the correlation of Bitcoin yields and stock market indices yields, the results indicate a low correlation of yields for the 5-year period. The breakdown per year also shows fluctuations, where again a decrease is noted for 2021. However, the lowest correlations are presented in 2019 and 2023, where there is negligible correlation. It is interesting to note that in 2019, the correlations for all indices are negative, although very low. The maximum correlations in terms of yields are presented in the years 2020 and 2022, where a low-to-moderate correlation is presented. As in the case of price correlations, the correlation of Bitcoin yields to the U.S indices is higher than the correlation to the European indices, reinforcing the argument of a U.S./European market split in terms of their correlation to crypto asset markets.

4. Correlation Between the Prices and Yields of Crypto Assets and Commodities

In this section, we explore the correlation between the prices and yields of cryptocurrencies and various commodities. Our intention is to explore the potential differences compared to the Bitcoin/stock market index correlations presented in the previous section. Specifically, we focus on Bitcoin in comparison to gold and oil. We examine the correlation of Bitcoin and the aforementioned commodities for a 5-year period, namely 2019–2023, in total as well as per year. The price correlations for the whole period are presented in Table 6 and Figure 11, while the price correlations per year are presented in Table 7 and Figure 12. Similarly, the yield correlations for the whole period are presented in Table 8 and Figure 13, while the yield correlations per year are presented in Table 9 and Figure 14.
In general, the results indicate a moderate correlation of prices for the 5-year period. However, the breakdown per year shows considerable fluctuations. The case of gold exhibits more similarities to the stock market indices; a moderate-to-high correlation is presented for all years except 2021, where a considerable decrease is presented, being negative. The case of oil is somewhat different, where there is a low positive correlation of prices between 2020 and 2022, while there is negative but virtually negligible correlation in 2019 and 2023.
Concerning that correlation of Bitcoin and commodity yields, the results indicate that virtually no correlation exists for the 5-year period. The breakdown per year shows no significant fluctuations, with the only mild exception being the years 2019 and 2022 for gold, where a very low correlation is exhibited.
Conclusively, while there exists a correlation between Bitcoin and stock market indices (moderate/high for prices and low/moderate for the yields) for certain (but not all) periods, the results for the correlation between Bitcoin and commodities indicate a moderate correlation for the prices (mainly for gold) and no considerable correlation for the yields.

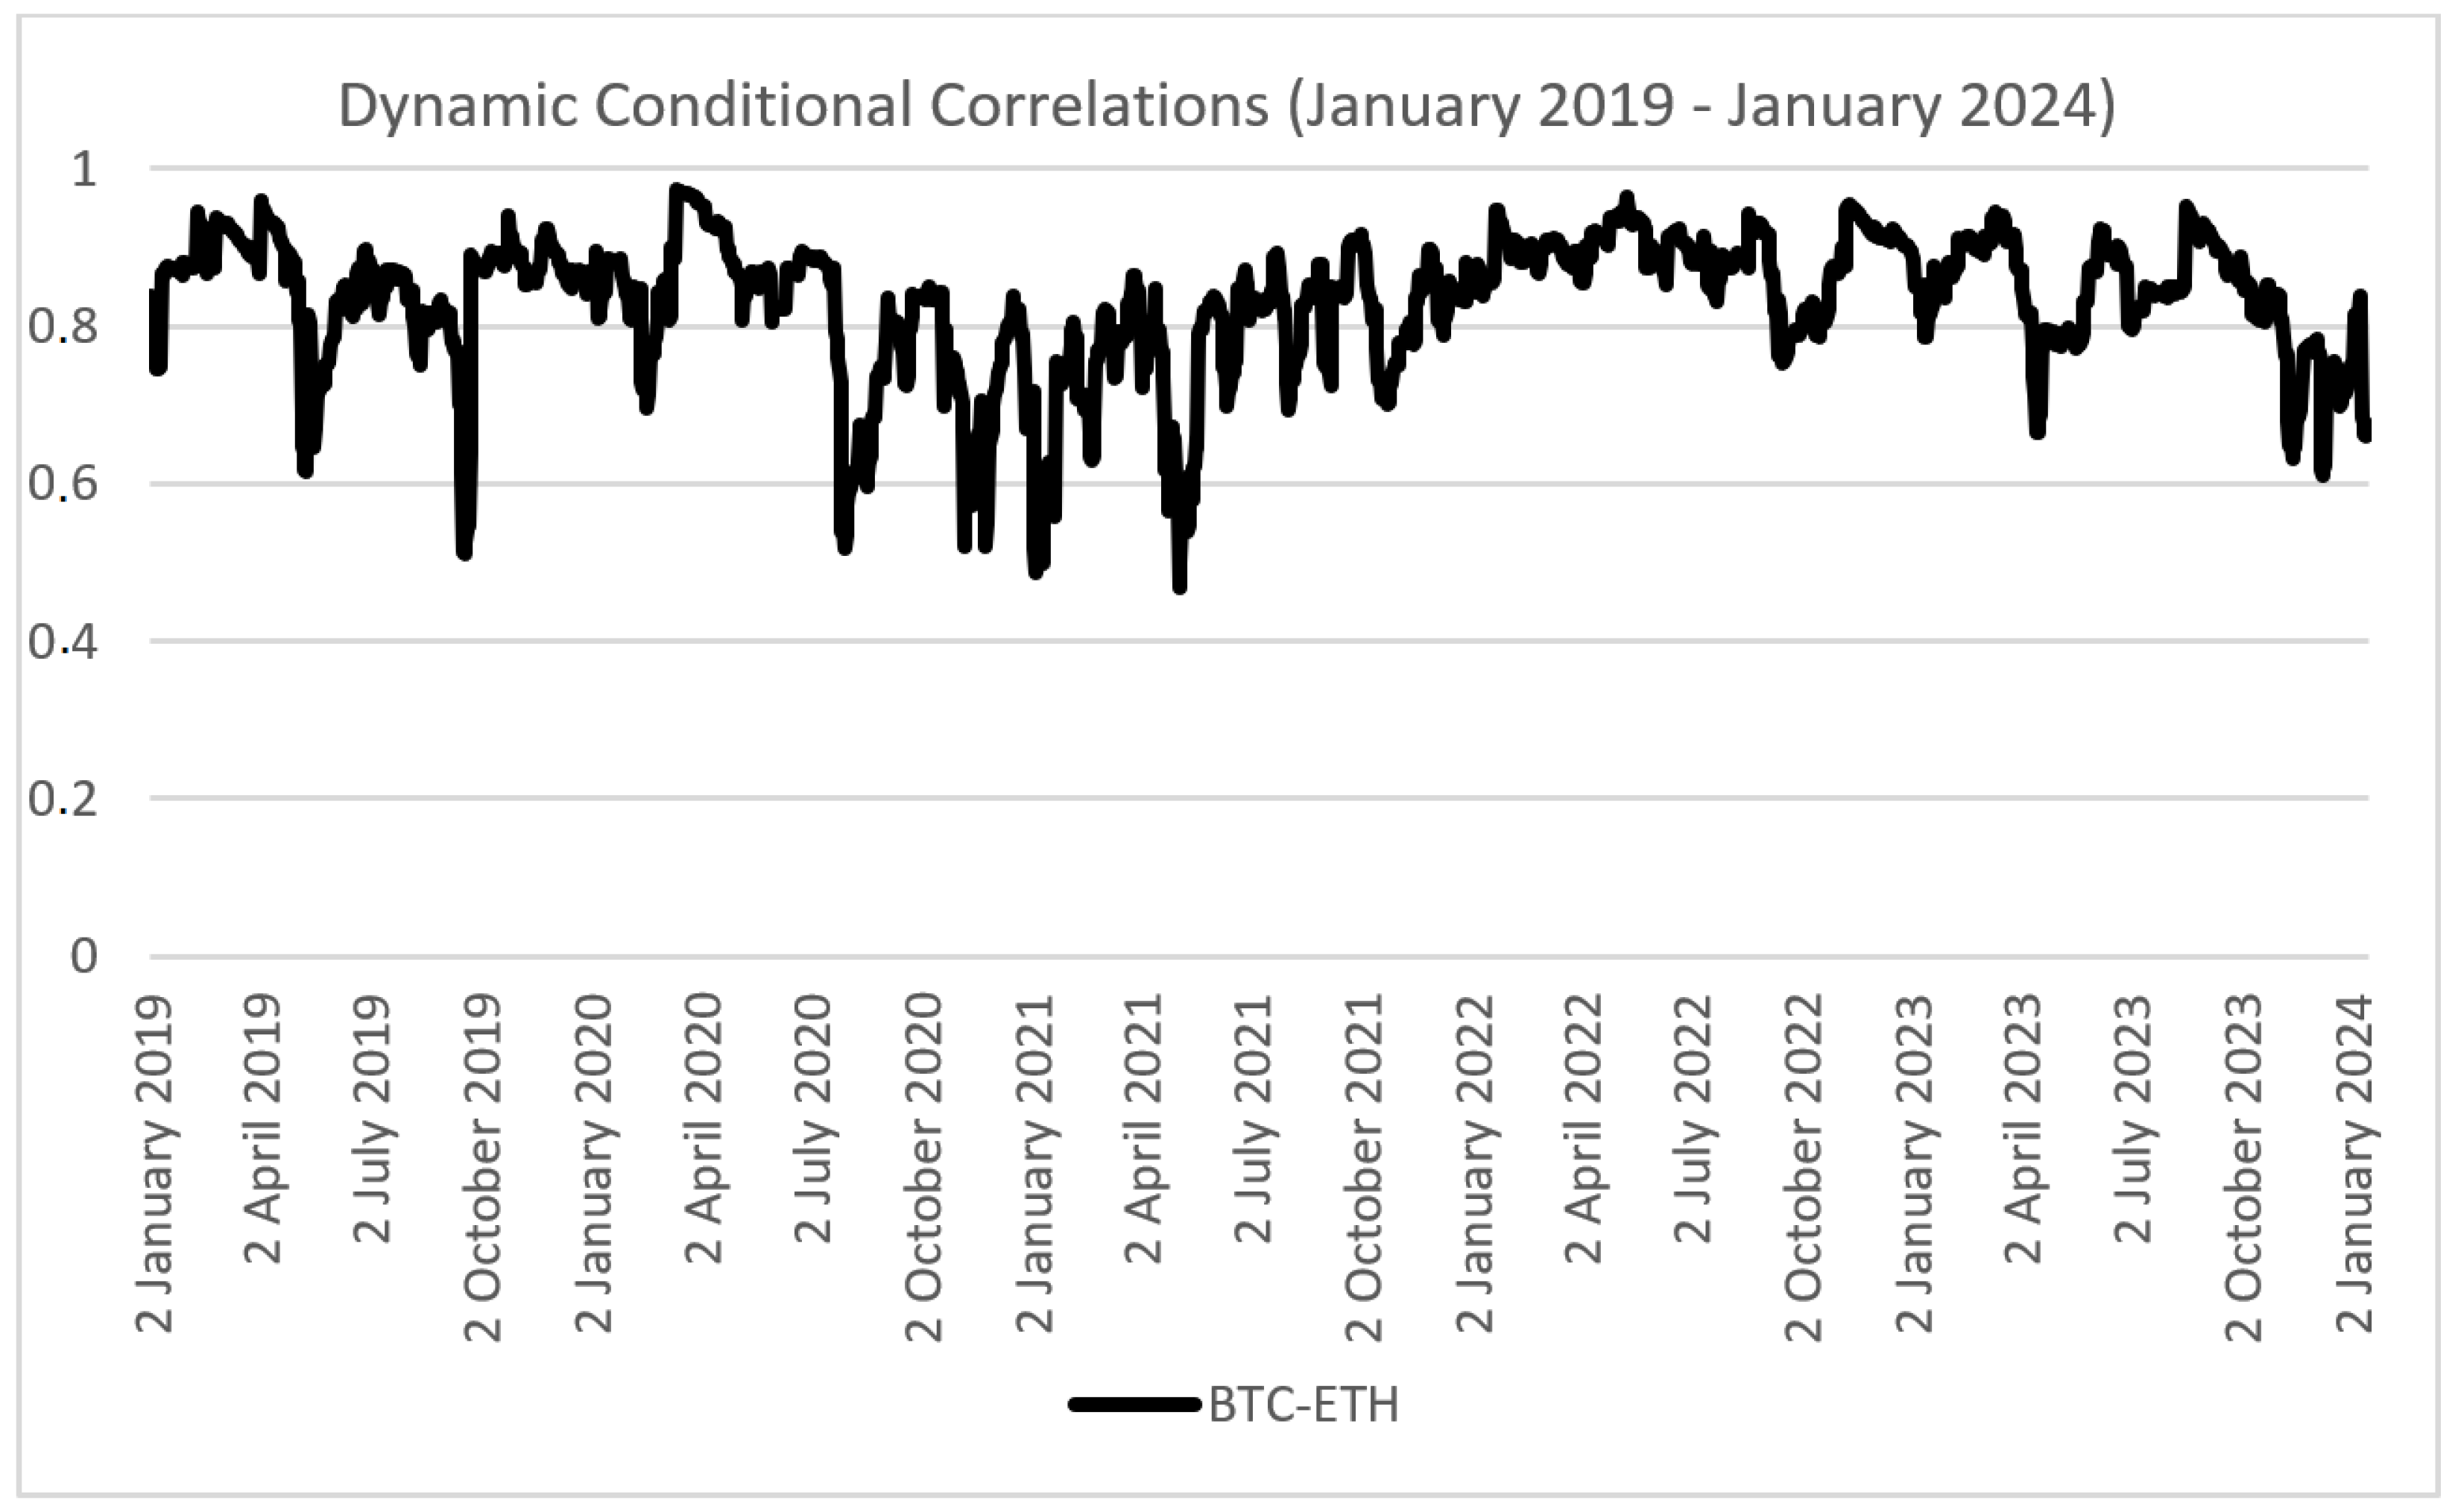
5. Impact of External Events on Crypto Asset Price Correlations

In this section, we explore how the correlation between crypto assets changed after certain events. The event-related analysis could be relevant for the monitoring of portfolio risk. For example, if the correlation across multiple cryptocurrencies increases, then common exposure to multiple cryptocurrencies at the same time has the potential to significantly increase portfolio risk. It is therefore important to understand how to hedge these risks.
Using the dynamic conditional correlation (DCC) model, we calculated the correlation between 12 cryptocurrencies that were chosen based on their trading volume and market cap. In particular, we have selected ADA, BCH, BNB, BTC, DOGE, DOT, ETH, LINK, LTC, SOL, UNI and XRP.
The dynamic conditional correlation models are a class of GARCH models that are useful for estimating correlations over time, particularly for assets that display substantial temporal volatility (as proposed by Engle in [29]). This approach has been adopted in other studies, such as that of Kyriazis et al. [10], who showed that many assets basically track the three main cryptocurrencies (measured by market capitalization) (BTC, ETH and XRP). Yan et al. [16] noticed how USDT behaves differently than other assets in the context of the COVID-19 pandemic and it may therefore have potential suitability as a hedging instrument.
For the purpose of our analysis, we examined the correlations of different cryptocurrencies in the context of the following events: the COVID-19 pandemic, the Russian invasion of Ukraine and the recent Israeli–Palestinian conflict. Our findings suggest that, for our sample of cryptocurrencies, there is significant positive correlation around these events. Moreover, for some periods, and for some assets, the correlation is much more pronounced. This is particularly notable when the correlation across multiple cryptocurrencies increased in March 2020 during the COVID-19 pandemic, as shown in [16].
Figure 15, Figure 16 and Figure 17 show the difference between the average correlation of two cryptocurrencies during the periods immediately following the COVID-19 pandemic, the Russian invasion of Ukraine and the Israeli–Palestinian conflict. The figures also show the average correlation during the period prior to these events. In the figures, the cells coloured in red show that the correlation increased and those in blue show a decrease in correlation. The deepness/intensity of the colour increases with the absolute value of the difference. After the beginning of the COVID-19 pandemic, the correlation increased for all cryptocurrencies with the exception of BNB, which displayed the opposite behavior.
The effect was the same when we examined the correlations in relation to the Russian invasion of Ukraine. Compared to the COVID-19 pandemic, the level of correlation was not as high (as shown by the lighter colours) and differed across some cryptocurrencies (e.g., UNI and SOL behaved differently). A very small decrease in the correlation level can be generally observed after the beginning of the Israeli–Palestinian conflict.

6. Concluding Remarks and Further Work

In this work, we studied the interconnections between traditional finance and crypto asset markets from a number of perspectives and with a particular emphasis on the impact of different events, both financial and non-financial in nature, on multiple cryptocurrencies. These interconnections can be considered as a key determinant of financial stability, which is becoming more important as crypto assets increase in popularity and undergo wider adoption. Our findings have potential relevance for risk monitoring and risk management, as well as for the design of a regulatory framework for crypto assets.
In particular, using a Bayesian model averaging approach, we identified a number of change points in cryptocurrency prices and mapped these events both directly and indirectly to specific crypto asset-related developments or more general non-crypto asset-related developments or events, such as geopolitical conflicts. To the best of our knowledge, there are not many studies of this nature in the literature, and in the context of the event identification, there was no comprehensive or complete dataset of events that could be used in for the change point identification. We therefore had to manually search for and compile a list of events to associate with the identified change points. We consider the absence of a comprehensive crypto asset-related event database as a significant data gap that should be addressed in the near future. A comprehensive dataset of crypto-related events could help to facilitate a more effective monitoring of the risks stemming from the cryptocurrency markets, provide insight into hedging strategies and prove useful in understanding the impact of future developments in cryptocurrency prices. In this context, some further contributions of our work include the identification of specific categories of events that are either (a) directly related to crypto assets and have an impact not only on their trading but also on traditional finance or (b) indirectly related to crypto assets as they originate from the traditional financial sector but nevertheless have an impact on crypto assets through the interconnections between the TradFi and DeFi markets. The event categories can be further analyzed together with the identified change points in order to better predict movements in the DeFi markets.
In another line of research, we examined the correlation between crypto assets and mainstream financial markets. Specifically, we focused on the correlation between Bitcoin and five major stock market indices for the period 2019–2023. The results indicate a high correlation of prices and a low correlation of yields for the 5-year period, with fluctuations per year, the most notable being a considerable decrease during 2021. Moreover, we examined the correlation between Bitcoin and commodities, namely gold and oil, for the same period. The results indicate a low-to-moderate correlation of prices and a negligible correlation of yields. A question that arises is whether the correlation coefficients alone can provide an accurate answer to the research topic. Potential enhancements would be (a) including additional indicators so as to have a deeper understanding of the relevant interconnections, e.g., exploring potential nonlinear relationships between crypto assets and traditional financial markets, or (b) considering factors idiosyncratic to the crypto assets that would affect their prices independently of the traditional financial markets movements during the correlation calculation.
Moreover, we explored how the correlation between crypto assets changed after certain significant global events, using a dynamic conditional correlation (DCC) model on a set of 12 cryptocurrencies. We found that crypto assets exhibit persistent and high levels of correlation, which may become even more pronounced in the presence of significant events such as the COVID-19 pandemic or geopolitical conflicts. This suggests that for a portfolio highly exposed to crypto assets, there could be substantial increases in the level of risk, especially in temporal proximity to extreme events. When interpreting these results, there are several factors that should be considered. First, the DCC model, while effective for estimating time-varying correlations, assumes a certain level of stationarity and may not fully capture the impact of extreme market conditions or structural breaks in the data. The reliance on historical correlation data might not account for rapidly evolving market dynamics influenced by technological advancements or regulatory changes. Furthermore, geopolitical events are often accompanied by other concurrent economic or financial shocks, making it challenging to isolate the specific impacts on cryptocurrency markets. For instance, during the COVID-19 pandemic, central bank policies and fiscal interventions might have also played a significant role in shaping market behaviors. Lastly, the analysis focuses on three specific events and does not encompass a broader spectrum of geopolitical or economic disruptions. As such, the generalizability of findings to other contexts may be limited. Potential enhancements in this line of research would be (a) expanding the dataset to include smaller or emerging assets as well as other digital assets, such as stablecoins or tokenized securities, that could exhibit different behaviors during global events, (b) employing alternative models or methodologies, such as machine learning techniques, to capture nonlinear relationships and adapt to evolving market conditions, (c) exploring the interplay between cryptocurrency correlations and other financial markets, such as equities, bonds, or commodities, during global events, (d) investigating the role of stablecoins like USDT in mitigating portfolio risks during periods of heightened volatility, yielding valuable insights into their effectiveness as hedging instruments, (e) performing a comparative analysis of different geopolitical or economic disruptions, e.g., trade wars, monetary policy shifts or technological advancements, and (f) incorporating sentiment analysis and on-chain metrics in order to provide a more nuanced perspective on market behaviors. All of the above could provide a more comprehensive view and enhance our understanding of the unique and common factors influencing cryptocurrency markets.
In addition to the ideas mentioned previously, another line of investigation in the cryptocurrency markets is to evaluate the possible macro-financial risk that arises from the crypto asset market, ideally at the country level. A relevant methodology, for example, has been proposed by Hacibedel and Perez-Saiz [33], who focused on assessing the degree of macro-financial risk stemming from cryptocurrencies for an individual country. The results of such a study would contribute to our understanding of the effects of crypto assets.
The work presented in this paper contributes to our understanding of the effect of external events on cryptocurrency markets as well as the interconnections between cryptocurrency markets and the traditional financial system. Our findings indicate that the study of these interconnections via the identified lines of investigation can help in predicting changes in the cryptocurrency ecosystem that could also affect the traditional financial ecosystem, while the identification of the influential external events is a significant factor in this direction.

Author Contributions

Conceptualization, E.K., P.M., J.T. and L.T.; Methodology, E.K., P.M., J.T. and L.T.; Validation, E.K., P.M., J.T. and L.T.; Investigation, E.K., P.M., J.T. and L.T.; Writing—original draft, E.K., P.M., J.T. and L.T.; Writing—review & editing, E.K., P.M., J.T. and L.T. All authors have read and agreed to the published version of the manuscript.

Funding

This research received no external funding.

Data Availability Statement

Dataset available on request from the authors.

Acknowledgments

The research presented in this paper is part of the work carried out by the authors in the context of the Crypto-Assets Monitoring Expert Group (CAMEG) of the Eurosystem Innov8 Forum (2024). The authors would like to thank all the members of the CAMEG group for their useful feedback. The views expressed in this paper are solely those of the authors and do not represent the views of the institutions to which these authors are affiliated or the European Central Bank.

Conflicts of Interest

The authors declare no conflict of interest.

Appendix A

Table of Identified Cryptocurrency-Related Events
Table A1. Bitcoin price-series events.
DateChart LabelDescription
21 June 2019BTC breaches 96 kThe price of Bitcoin reached a 400-day high.
Source: coindesk.com (accessed on 4 February 2025)
9 January 2020BTC drop US–Iran tensionsPresident Trump downplayed the situation in Iran, resulting in a decline in BTC price.
Source: forbes.com (accessed on 4 February 2025)
11 March 2020COVID-19 pandemicThe price of Bitcoin declined markedly following the onset of the COVID-19 pandemic.
Source: cnbc.com (accessed on 4 February 2025)
10 December 2020Mass Mutual invests in BTCMassachusetts Mutual, a large insurance firm, invests a significant amount of money into Bitcoin.
Source: Bloomberg.com (accessed on 4 February 2025)
6 January 2021Capitol riot in the USCapitol riot in the United States.
Source: cnbc.com (accessed on 4 February 2025)
21 January 2021BTC crashTwo-day Bitcoin sell-off results in a loss of over USD 100 billion from the entire crypto market.
Source: cnbc.com (accessed on 4 February 2025)
8 February 2021Tesla buys BTCTesla announced in an SEC filing on Monday that it has bought USD 1.5 billion worth of Bitcoin. The company also said it would start accepting Bitcoin as a payment method for its products.
Source: cnbc.com (accessed on 4 February 2025)
13 April 2021BTC new high above 62 k (Coinbase debut)Bitcoin reaches new all-time high as Coinbase prepares to go public.
Source: cnbc.com (accessed on 4 February 2025)
26 April 2021Record BTC outflowsBitcoin experiences record weekly outflow as investor sentiment turns cautious.
Source: reuters.com (accessed on 4 February 2025)
12 May 2021Tesla stops taking BTCElon Musk announces that Tesla will no longer accept Bitcoin for car purchases.
Source: reuters.com (accessed on 4 February 2025)
24 May 2021BTC sustainability initiativeElon Musk meets with Bitcoin miners to discuss making cryptocurrency mining more environmentally friendly.
Source: cnbc.com (accessed on 4 February 2025)
26 July 2021BTC breaches 39 kThe price of Bitcoin breaches a USD 39 k threshold.
Source: cnbc.com (accessed on 4 February 2025)
30 September 2021China crypto crackdownChinese regulators ban cryptocurrency trading and mining.
Source: retuers.com (accessed on 4 February 2025)
21 October 2021BTC Binance crashThe price of Bitcoin decreased significantly on the U.S. Binance exchange.
Source: Bloomberg.com (accessed on 4 February 2025)
8 November 2021BTC and ETH reach new highsBoth BTC and ETH reach record highs based on investor concern about inflation.
Source: cnbc.com (accessed on 4 February 2025)
18 December 2021Fed announces rate increasesFederal Reserve begins to wind down pandemic-related support measures.
Source: cnbctv18.com (accessed on 4 February 2025)
3 February 2022Crypto network wormholeCryptocurrency platform Wormhole loses a significant amount after a cyber attack.
Source: reuters.com (accessed on 4 February 2025)
12 February 2022BTC hits two-year high on rate cutsPrice of Bitcoin increases based on expectations of interest rate cuts and favorable U.S. regulatory views on an ETF to track BTC price.
Source: reuters.com (accessed on 4 February 2025)
24 March 2022BTC reaches 3-week highThe price of BTC reaches a 3-week high on speculation that Terra will buy BTC as a reserve.
Source: Bloomberg.com (accessed on 4 February 2025)
9 May 2022Terra collapseDate of the Terra Luna stablecoin collapse.
Source: coindesk.com (accessed on 4 February 2025)
13 June 2022BTC fall—Celsius, Fed ratesBitcoin drops as much as 17%, falling below USD 23,000, as USD 200 billion wiped off crypto market over the weekend.
Source: cnbc.com (accessed on 4 February 2025)
19 August 2022Broad crypto sell-offBitcoin dropped below the USD 22,000 level, to its lowest level in more than three weeks, on the back of a broader crypto sell-off.
Source: Bloomberg.com (accessed on 4 February 2025)
13 January 2023Winklevoss twins chargedCryptocurrency firms Gemini and Genesis have been charged by U.S. regulators with illegally selling crypto assets to hundreds of thousands of investors.
Source: Bloomberg.com (accessed on 4 February 2025)
17 March 2023BTC increase on low inflationBitcoin (BTC) prices broke above the strong USD 25 k resistance, reaching ~USD 27 k on Friday morning.
Source: reuters.com (accessed on 4 February 2025)
21 June 2023First 30 k breach of yearBitcoin breaches USD 30 k mark fueled by Powell’s comments on spot ETF filings.
Source: business-standard.com (accessed on 4 February 2025)
17 August 2023Crypto crashThe crypto market crash occurred on 17 August 2023.
Source: retuers.com (accessed on 4 February 2025)
23 October 2023Increase on ETF announcementBitcoin soared 10% to 1-1/2-year highs on Monday, and crypto-linked stocks followed it higher after speculation about the possibility of a Bitcoin exchange-traded fund.
Source: cnbc.com (accessed on 4 February 2025)
3 December 2023BTC sees record influxBitcoin price sets another all-time high against record inflows into the cryptocurrency markets.
Source: news.bitcoin.com (accessed on 4 February 2025)
Table A2. Ethereum price-series events.
DateChart LabelDescription
14 July 2019Crypto fall on Trump commentsBitcoin slumped in another large weekend move after U.S. President Donald Trump’s criticism of cryptocurrencies.
Source: Bloomberg.com (accessed on 4 February 2025)
11 March 2020COVID-19 pandemicThe onset of the COVID-19 pandemic.
26 July 2020ETH new highThe price of ETH reaches a new high for 2020.
Source: cointelegraph.com (accessed on 4 February 2025)
3 January 2021ETH price surgeEthereum (ETH), the second leading cryptocurrency by market cap, has gained over 18.19% in the last 24 h and was trading at USD 951.85 at press time, with a current capitalization at over USD 103 billion.
Source: finance.yahoo.com (accessed on 4 February 2025)
23 February 2021ETH sell-offThe CEO of Kraken says that a sudden 50% crash in Ether’s price on the exchange on Monday was caused by a sell-off and not a system glitch.
Source: Bloomberg.com (accessed on 4 February 2025)
21 March 2021Alchemy NFT investmentTrump criticizes cryptocurrencies.
Source: Bloomberg.com (accessed on 4 February 2025)
3 May 2021ETH breaks 3000Cryptocurrency Ether broke past USD 3000 on Monday to set a new record high in a dazzling rally that has outshone the bigger Bitcoin, with investors betting that Ether will be of ever greater use in a decentralized future financial system.
Source: reuters.com (accessed on 4 February 2025)
19 May 2021Crypto price dropBitcoin and Ethereum posted their largest one-day drop since March last year on Wednesday, with losses in the market capitalization for the entire cryptocurrency sector approaching USD 1 trillion.
Source: reuters.com (accessed on 4 February 2025)
21 June 2021Mining crackdownBitcoin tumbled on Monday to a two-week low on China’s expanding crackdown on Bitcoin mining, as investors grew more uncertain about the future of the leading cryptocurrency.
Source: reuters.com (accessed on 4 February 2025)
19 July 2021ETH price declineEthereum slid by 11.67% in the week ending 18 July. Following a 7.85% decline from the previous week, Ethereum ended the week at USD 1891.46.
Source: finance.yahoo.com (accessed on 4 February 2025)
16 August 2021Crypto price rallyThe crypto market topped USD 2 trillion for the first time since May.
Source: cnbc.com (accessed on 4 February 2025)
20 September 2021Crypto market sell-offCryptocurrency prices sank on Monday as concerns over the spillover risk to the global economy from Chinese property group Evergrande’s troubles spread across financial markets.
Source: reuters.com (accessed on 4 February 2025)
10 November 2021Crypto price rallyBitcoin price surges to record high of more than USD 68,000. Other cryptocurrencies such as Ethereum also reach records as investors hedge against inflation.
Source: theguardian.com (accessed on 4 February 2025)
9 December 2021Evergrande defaultThree days after a deadline passed, leaving bondholders with nothing but silence from the company, a major credit ratings firm declared that Evergrande was in default.
Source: nytimes.com (accessed on 4 February 2025)
21 January 2022Crypto crashCrypto prices decline. Cryptocurrencies have had a dismal start to the year, and continue to plunge as major economies around the world look to curb their growing popularity.
Source: edition.cnn.com (accessed on 4 February 2025)
4 February 2022Wormhole tokenMillions of dollars in cryptocurrency stolen late Wednesday from accounts on crypto platform Wormhole have been returned to users.
Source: merklescience.com (accessed on 4 February 2025)
17 February 2022Crypto price dropThe value of cryptocurrencies dropped rapidly on Thursday as investors try to decipher what kind of regulation is coming to the industry in the U.S. The White House appears ready to push for regulation on the cryptocurrency industry and that uncertainty alone is spooking investors.
Source: fool.com (accessed on 4 February 2025)
16 March 2022ETH criticizes SolanaEthereum co-founder hits out at economics of fast-growing Solana blockchain.
Source: ft.com (accessed on 4 February 2025)
5 April 2022Solana as ETH alternativeSolana: the blockchain touted as an alternative to Ethereum.
Source: ft.com (accessed on 4 February 2025)
9 May 2022Luna crashAfter the UST depeg, the price of UST and LUNA dramatically plummeted.
Source: binance.com (accessed on 4 February 2025)
16 June 2022Fed interest rate announceFollowing the announcement of interest rate hike by the U.S. Federal Reserve, the prices of top cryptos, including Bitcoin and Ethereum, have seen some recovery even as the market sentiments remain in the “extreme fear” zone.
Source: financialexpress.com (accessed on 4 February 2025)
19 August 2022Crypto price dropCryptocurrencies fell sharply on Friday, with sudden selling dragging Bitcoin to a three-week low, with analysts divided over the reason behind the decline.
Source: reuters.com (accessed on 4 February 2025)
25 October 2022Crypto price rallyEthereum reaches levels unseen since soon after the merge as the wider crypto market takes a break from the doldrums.
Source: decrypt.co (accessed on 4 February 2025)
8 November 2022FTX deal to sell to BinanceFTX reached a deal to sell itself to Binance, the crypto exchange whose executive had helped trigger the selloff.
Source: abcnews.go.com (accessed on 4 February 2025)
12 January 2023Treasury calls for crypto regulationThe collapse of Bahamas-based cryptocurrency exchange FTX points to the need for the United States to cooperate with other countries to develop effective international regulations for the crypto sector, U.S. Deputy Treasury Secretary Wally Adeyemo said on Thursday.
Source: reuters.com (accessed on 4 February 2025)
17 March 2023Crypto rallyThe cryptocurrency markets were trading higher in Friday’s trade, with crypto heavyweights like BTC and ETH leading the rally.
Source: economictimes.indiatimes.com (accessed on 4 February 2025)
18 August 2023Crypto price declinesCrypto traders were hit with USD 1 billion worth of liquidations over the past 24 h.
Source: coindesk.com (accessed on 4 February 2025)
23 October 2023Safereum exit scamOn 23 October 2023, Safereum experienced a severe rug pull, resulting in a loss of approximately USD 1.3 million in an exit scam.
Source: immunebytes.com (accessed on 4 February 2025)

References

  1. Iyer, R.; Popescu, A. New Evidence on Spillovers Between Crypto Assets and Financial Markets; International Monetary Fund Working Paper, WP/23/213; International Monetary Fund, Washington, D.C, USA. 2023. Available online: https://www.imf.org/en/Publications/WP/Issues/2023/09/30/New-Evidence-on-Spillovers-Between-Crypto-Assets-and-Financial-Markets-539476 (accessed on 4 February 2025).
  2. Financial Stability Board. The Financial Stability Risks of Decentralised Finance. 16 February 2023. Available online: https://www.fsb.org/2023/02/the-financial-stability-risks-of-decentralised-finance/ (accessed on 4 February 2025).
  3. Financial Stability Board. The Financial Stability Implications of Multifunction Crypto-Asset Intermediaries. 28 November 2023. Available online: https://www.fsb.org/2023/11/the-financial-stability-implications-of-multifunction-crypto-asset-intermediaries/ (accessed on 4 February 2025).
  4. Lahajnar, S.; Rozanec, A. The correlation strength of the most important cryptocurrencies in the bull and bear market. Invest. Manag. Financ. Innov. 2020, 17, 67–81. [Google Scholar] [CrossRef] [PubMed]
  5. Guesmi, K.; Saadi, S.; Abid, I.; Ftiti, Z. Portfolio diversification with virtual currency: Evidence from bitcoin. Int. Rev. Financ. Anal. 2019, 63, 431–437. [Google Scholar] [CrossRef]
  6. Ibrahim, B.A.; Elamer, A.A.; Alasker, T.H.; Mohamed, M.A.; Abdou, H.A. Volatility contagion between cryptocurrencies, gold and stock markets pre-and-during COVID-19: Evidence using DCC-GARCH and cascade-correlation network. Financ. Innov. 2024, 10, 104. [Google Scholar] [CrossRef]
  7. Zhang, X.; Chen, Z.; Wang, S. A study of the impact of cryptocurrency price volatility on the stock and gold markets. Financ. Res. Lett. 2024, 69, 106114. [Google Scholar] [CrossRef]
  8. Zhou, F. Cryptocurrency: A new player or a new crisis in financial markets?—Evolutionary analysis of association and risk spillover based on network science. Phys. A Stat. Mech. Its Appl. 2024, 648, 129955. [Google Scholar] [CrossRef]
  9. Kayani, U.; Hasan, F. Unveiling Cryptocurrency Impact on Financial Markets and Traditional Banking Systems: Lessons for Sustainable Blockchain and Interdisciplinary Collaborations. J. Risk Financ. Manag. 2024, 17, 58. [Google Scholar] [CrossRef]
  10. Kyriazis, N.A.; Daskalou, K.; Arampatzis, M.; Prassa, P.; Papaioannou, E. Estimating the volatility of cryptocurrencies during bearish markets byemploying GARCH models. Heliyon 2019, 5, e02239. [Google Scholar] [CrossRef]
  11. Okorie, D.I.; Lin, B. Crude oil price and cryptocurrencies: Evidence of volatility connectedness and hedging strategy. Energy Econ. 2020, 87, 104703. [Google Scholar] [CrossRef]
  12. Hsu, S.-H.; Sheu, C.; Yoon, J. Risk spillovers between cryptocurrencies and traditional currencies and gold under different global economic conditions. N. Am. J. Econ. Financ. 2021, 57, 101443. [Google Scholar] [CrossRef]
  13. Nakagawa, K.; Sakemoto, R. Cryptocurrency network factors and gold. Financ. Res. Lett. 2022, 46, 102375. [Google Scholar] [CrossRef]
  14. Naeem, M.A.; Karim, S.; Abrar, A.; Yarovaya, L.; Shah, A.A. Non-linear relationship between oil and cryptocurrencies: Evidence from returns and shocks. Int. Rev. Financ. Anal. 2023, 89, 102769. [Google Scholar] [CrossRef]
  15. Huang, L. The relationship between cryptocurrencies and convention financial market: Dynamic causality test and time-varying influence. Int. Rev. Econ. Financ. 2024, 91, 811–826. [Google Scholar] [CrossRef]
  16. Yan, K.; Yan, H.; Gupta, R. Are GARCH and DCC Values of 10 Cryptocurrencies Affected by COVID-19? J. Risk Financ. Manag. 2022, 15, 113. [Google Scholar] [CrossRef]
  17. Alexakis, C.; Anselmi, G.; Petrella, G. Flight to cryptos: Evidence on the use of cryptocurrencies in times of geopolitical tensions. Int. Rev. Econ. Financ. 2024, 89, 498–523. [Google Scholar] [CrossRef]
  18. Kayral, I.E.; Jeribi, A.; Loukil, S. Are Bitcoin and Gold a Safe Haven during COVID-19 and the 2022 Russia-Ukraine War? J. Risk Financ. Manag. 2023, 16, 222. [Google Scholar] [CrossRef]
  19. Nie, C.-X. Analysis of critical events in the correlation dynamics of cryptocurrency market. Phys. A Stat. Mech. Its Appl. 2022, 586, 126462. [Google Scholar] [CrossRef]
  20. Coulter, K.A. The impact of news media on Bitcoin prices: Modelling data driven discourses in the crypto-economy with natural language processing. R. Soc. Open Sci. 2022, 9, 220276. [Google Scholar] [CrossRef]
  21. Jobst, A.; Atzberger, D.; Henker, R.; Vollmer, J.; Scheibel, W.; Döllner, J. Examining Liquidity of Exchanges and Assets and the Impact of External Events in Centralized Crypto Markets: A 2022 Study. In Proceedings of the 2023 IEEE International Conference on Blockchain and Cryptocurrency (ICBC), Dubai, United Arab Emirates, 1–5 May 2023; pp. 1–6. [Google Scholar] [CrossRef]
  22. Can Ergün, Z. The Impact of International Conflicts on the Cryptocurrency Market: The Case of Israel-Palestine Conflict. Polit. Ekon. Kuram. 2024, 8, 67–76. [Google Scholar] [CrossRef]
  23. Dyhrberg, A.H. Hedging capabilities of bitcoin. Is it the virtual gold? Financ. Res. Lett. 2016, 16, 139–144. [Google Scholar] [CrossRef]
  24. Gronwald, M. The Economics of Bitcoins—Market Characteristics and Price Jumps; CESifo Working Paper 5121; ifo Institute—Center for Economic Studies, Munich, Germany. 2014. Available online: https://www.cesifo.org/node/18925 (accessed on 4 February 2025).
  25. Klein, T.; Hien, P.T.; Walther, T. Bitcoin Is Not the New Gold: A Comparison of Volatility, Correlation, and Portfolio Performance. Int. Rev. Financ. Anal. 2018, 59, 105–116. [Google Scholar] [CrossRef]
  26. Gharbi, W.; Chaari, L.; Benazza-Benyahia, A. Unsupervised Bayesian change detection for remotely sensed images. Signal Image Video Process. 2021, 15, 205–213. [Google Scholar] [CrossRef]
  27. Zhao, K.; Wulder, M.A.; Hu, T.; Bright, R.; Wu, Q.; Qin, H.; Li, Y.; Toman, E.; Mallick, B.; Zhang, X.; et al. Detecting change-point, trend, and seasonality in satellite time series data to track abrupt changes and nonlinear dynamics: A Bayesian ensemble algorithm. Remote Sens. Environ. 2019, 232, 111181. [Google Scholar] [CrossRef]
  28. Mueller, L. Revisiting seasonality in cryptocurrencies. Financ. Res. Lett. 2024, 64, 105429. [Google Scholar] [CrossRef]
  29. Engle, R. Dynamic Conditional Correlation—A Simple Class of Multivariate GARCH models. J. Bus. Econ. Stat. 2002, 20, 339–350. [Google Scholar] [CrossRef]
  30. Appiah-Otoo, I. The Impact of the Russia-Ukraine War on the Cryptocurrency Market. Asian Econ. Lett. 2023, 4, 1–5. [Google Scholar] [CrossRef]
  31. Wang, P.; Liu, X.; Wu, S. Dynamic linkage between bitcoin and traditional financial assets: A comparative analysis of different time frequencies. Entropy 2022, 24, 1565. [Google Scholar] [CrossRef]
  32. English, W.; Loretan, M. Special feature: Evaluating changes in correlations during periods of high market volatility. BIS Q. Rev. 2000, 2, 29–36. Available online: https://www.bis.org/publ/r_qt0006e.pdf (accessed on 4 February 2025).
  33. Hacibedel, B.; Peres-Saiz, H. Assessing Macro-Financial Risks from Crypto Assets; IMF Working Paper No. 214; International Monetary Fund: Washington, DC, USA, 2023. [Google Scholar] [CrossRef]
Figure 1. The upper panel shows the price series for BTC while the lower panel shows the price series for ETH over the period spanning January 2019 until January 2024. Prices are shown in USD. The price series is daily frequency.
Appliedmath 05 00036 g001
Figure 2. The chart shows the dynamic conditional correlation (DCC) between the price of BTC and the price of ETH over the period from January 2019 to January 2024. The dynamic conditional correlations were modeled using a DCC GARCH(1,1) specification with multivariate normal innovations.
Appliedmath 05 00036 g002
Figure 3. The chart shows the daily price series for Bitcoin (BTC) in black and the estimated change point probability in red. The scale for the BTC price is on the left-hand side, while that for the change point probability is on the right-hand side. Significant events associated with the dates of the BTC-related change points are indicated in black text. The complete list of the identified BTC-related events is presented in Table A1 of the Appendix.
Appliedmath 05 00036 g003
Figure 4. The chart shows the daily price series for Ethereum (ETH) in black and the estimated change point probability in red. The scale for the ETH price is on the left-hand side, while that for the change point probability is on the right-hand side. Significant events associated with the dates of the ETH-related change points are indicated in black text. The complete list of the identified ETH-related events is presented in Table A2 of the Appendix.
Appliedmath 05 00036 g004
Figure 5. The chart shows the daily price volatility series for Bitcoin (BTC) in black and the estimated change point probability in red. The scale for the BTC price volatility is on the left-hand side, while that for the change point probability is on the right-hand side. Significant events associated with the dates of the BTC-related change points are indicated in black text. The complete list of the identified BTC-related events is presented in Table A1 of the Appendix.
Appliedmath 05 00036 g005
Figure 6. The chart shows the daily price volatility series for Ethereum (ETH) in black and the estimated change point probability in red. The scale for the ETH volatility is on the left-hand side, while that for the change point probability is on the right-hand side. Significant events associated with the dates of the ETH-related change points are indicated in black text. The complete list of the identified ETH-related events is presented in Table A2 of the Appendix.
Appliedmath 05 00036 g006
Figure 7. Correlation of Bitcoin prices and market index prices (2019–2023).
Appliedmath 05 00036 g007
Figure 8. Correlation of Bitcoin prices and market index prices per year.
Appliedmath 05 00036 g008
Figure 9. Correlation of Bitcoin yields and market index yields (2019–2023).
Appliedmath 05 00036 g009
Figure 10. Correlation of Bitcoin yields and market index yields per year.
Appliedmath 05 00036 g010
Figure 11. Correlation of Bitcoin prices and commodity prices (2019–2023).
Appliedmath 05 00036 g011
Figure 12. Correlation of Bitcoin prices and commodity prices per year.
Appliedmath 05 00036 g012
Figure 13. Correlation of Bitcoin yields and commodity yields (2019–2023).
Appliedmath 05 00036 g013
Figure 14. Correlation of Bitcoin yields and commodity yields per year.
Appliedmath 05 00036 g014
Figure 15. Difference between average correlation of pairs of cryptocurrencies during the beginning of the COVID-19 pandemic (March 2020) and the average in the period January 2019–February 2020. DOT, LINK, SOL and UNI are not included since they were not traded at the moment.
Appliedmath 05 00036 g015
Figure 16. Differences between average correlation of pairs of cryptocurrencies during the first two months after Russia’s attack on Ukraine and the average during February 2021–February 2022.
Appliedmath 05 00036 g016
Figure 17. Differences between average correlation of pairs of cryptocurrencies during the first two months after the start of the Israel–Palestine conflict (7 October 2023–7 December 2023) and the period January 2023–September 2023. Cells in blue show where it was higher in the pre-Israel–Palestine conflict period and those in red show the contrary. Deeper color indicates a larger difference in absolute terms.
Appliedmath 05 00036 g017
Table 1. Stock market indices selected to examine for potential correlation to cryptocurrencies.
Market IndexDescription
S&P 500Market capitalization-weighted index of 500 largest companies publicly traded in the U.S.
NASDAQ Market capitalization-weighted index of more than 2500 stocks listed on the Nasdaq stock exchange
Dow Jones Industrial AveragePrice-weighted index of 30 blue-chip companies publicly traded in the U.S.
EURO STOXX 50Market capitalization-weighted index of 50 blue-chip Eurozone companies
STOXX Europe 600Market capitalization-weighted index of 600 European companies
Table 2. Correlation of Bitcoin prices and market index prices (2019–2023).
PeriodS&P 500NASDAQ CompositeDJIAEURO
STOXX 50
STOXX
Europe 600
2019–20230.838660.885710.816100.682250.74723
Table 3. Correlation of Bitcoin prices and market index prices per year.
YearS&P 500NASDAQ CompositeDJIAEURO STOXX 50STOXX Europe 600
20190.548380.517110.485000.492320.39176
20200.768430.826190.665590.383490.37799
20210.277870.267740.291370.316810.25583
20220.868530.892450.660810.594380.75695
20230.728710.741930.672510.580990.29293
Table 4. Correlation of Bitcoin yields and market index yields (2019–2023).
PeriodS&P 500NASDAQ CompositeDJIAEURO STOXX 50STOXX Europe 600
2019–20230.309540.334740.272260.241350.24125
Table 5. Correlation of Bitcoin yields and market index yields per year.
YearS&P 500NASDAQ CompositeDJIAEURO STOXX 50STOXX Europe 600
2019−0.11837−0.10737−0.13234−0.09215−0.10558
20200.428840.450090.411940.394650.40996
20210.261950.271150.216050.235800.22664
20220.563210.595820.502290.360120.36445
20230.152110.189170.139250.035910.01363
Table 6. Correlation of Bitcoin prices and commodity prices (2019–2023).
PeriodGoldWTI Crude Oil
2019–20230.553250.48013
Table 7. Correlation of Bitcoin prices and commodity prices per year.
YearGoldWTI Crude Oil
20190.70581−0.03252
20200.510060.33613
2021−0.424620.30959
20220.759590.37128
20230.68466−0.18470
Table 8. Correlation of Bitcoin yields and commodity yields (2019–2023).
PeriodGoldWTI Crude Oil
2019–20230.136860.05634
Table 9. Correlation of Bitcoin yields and commodity yields per year.
YearGoldWTI Crude Oil
20190.21508−0.03558
20200.277420.11551
2021−0.051180.05014
20220.099090.10582
20230.11218−0.08165
Disclaimer/Publisher’s Note: The statements, opinions and data contained in all publications are solely those of the individual author(s) and contributor(s) and not of MDPI and/or the editor(s). MDPI and/or the editor(s) disclaim responsibility for any injury to people or property resulting from any ideas, methods, instructions or products referred to in the content.

