
What’s Going on Down There? Impacts of Long-Term Elevated CO2 and Community Composition on Components of Below-Ground Biomass in a Chesapeake Bay Saltmarsh


Abstract
1. Introduction
2. Methods
2.1. Experimental Treatments
2.2. Belowground Biomass and Litter
2.3. Organic Carbon, Nitrogen, and δ13C
2.4. Aboveground Biomass, Shoot Density, and Root Growth
3. Results
3.1. Community-Level Responses to Elevated CO2
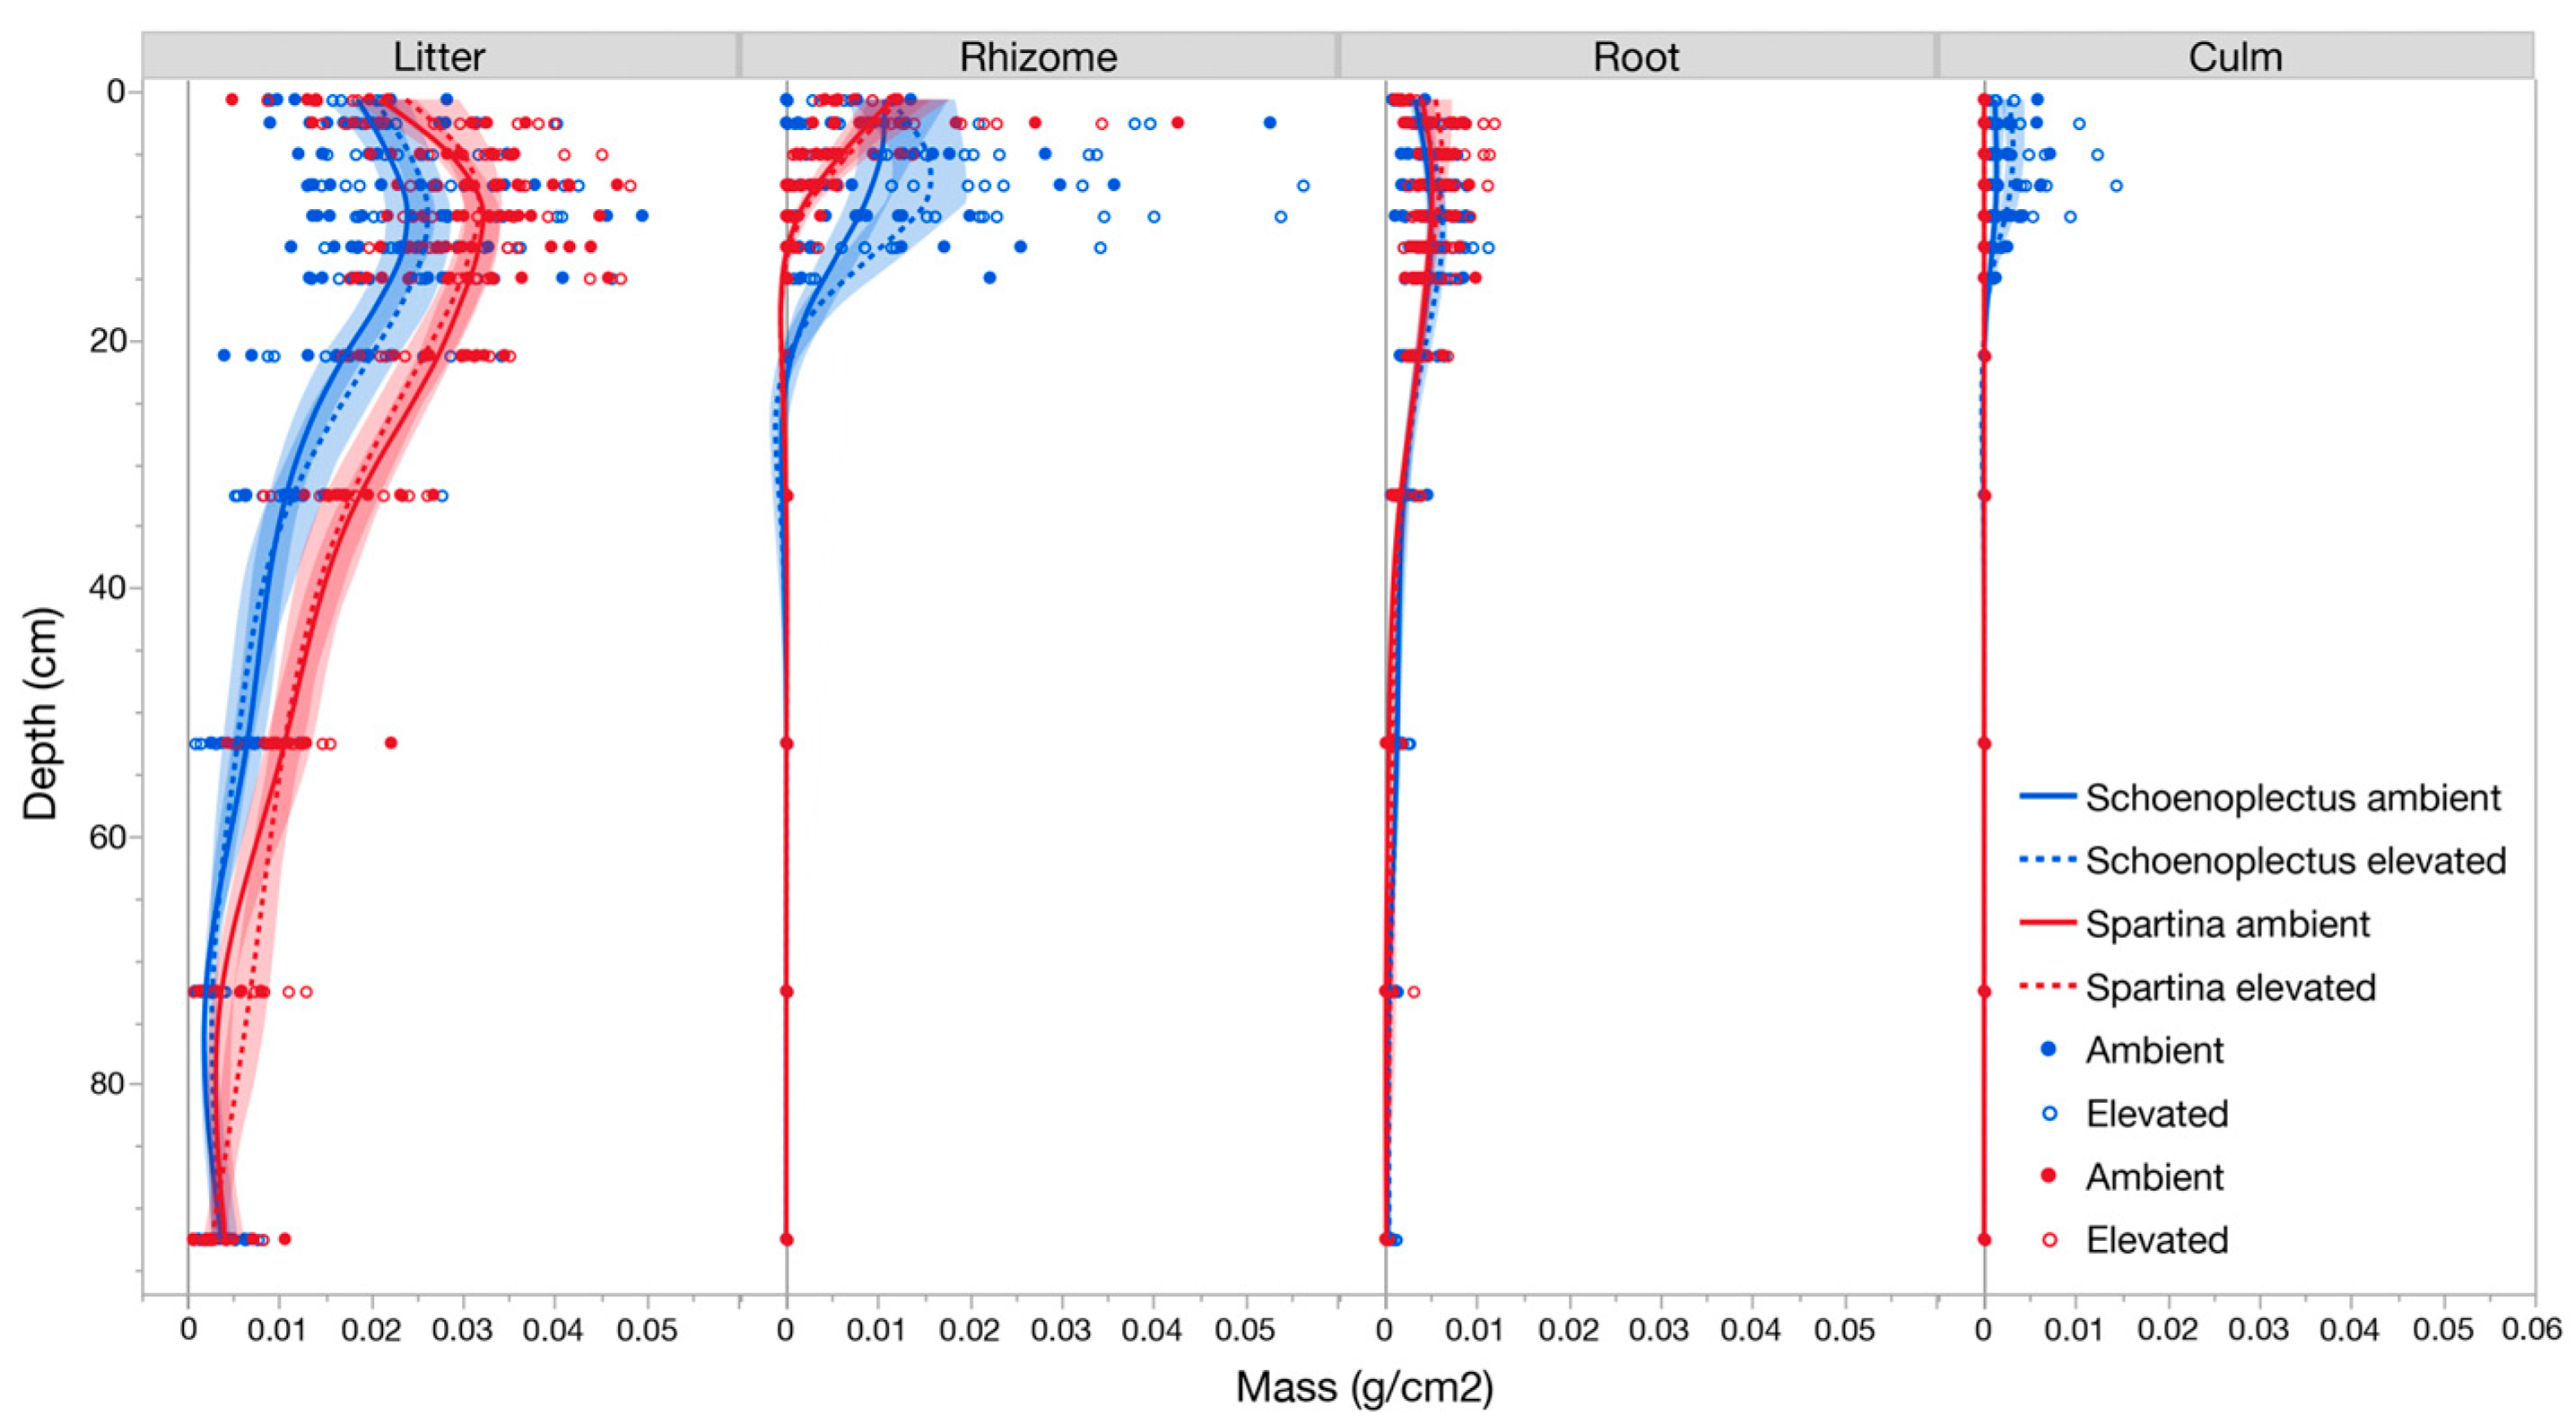
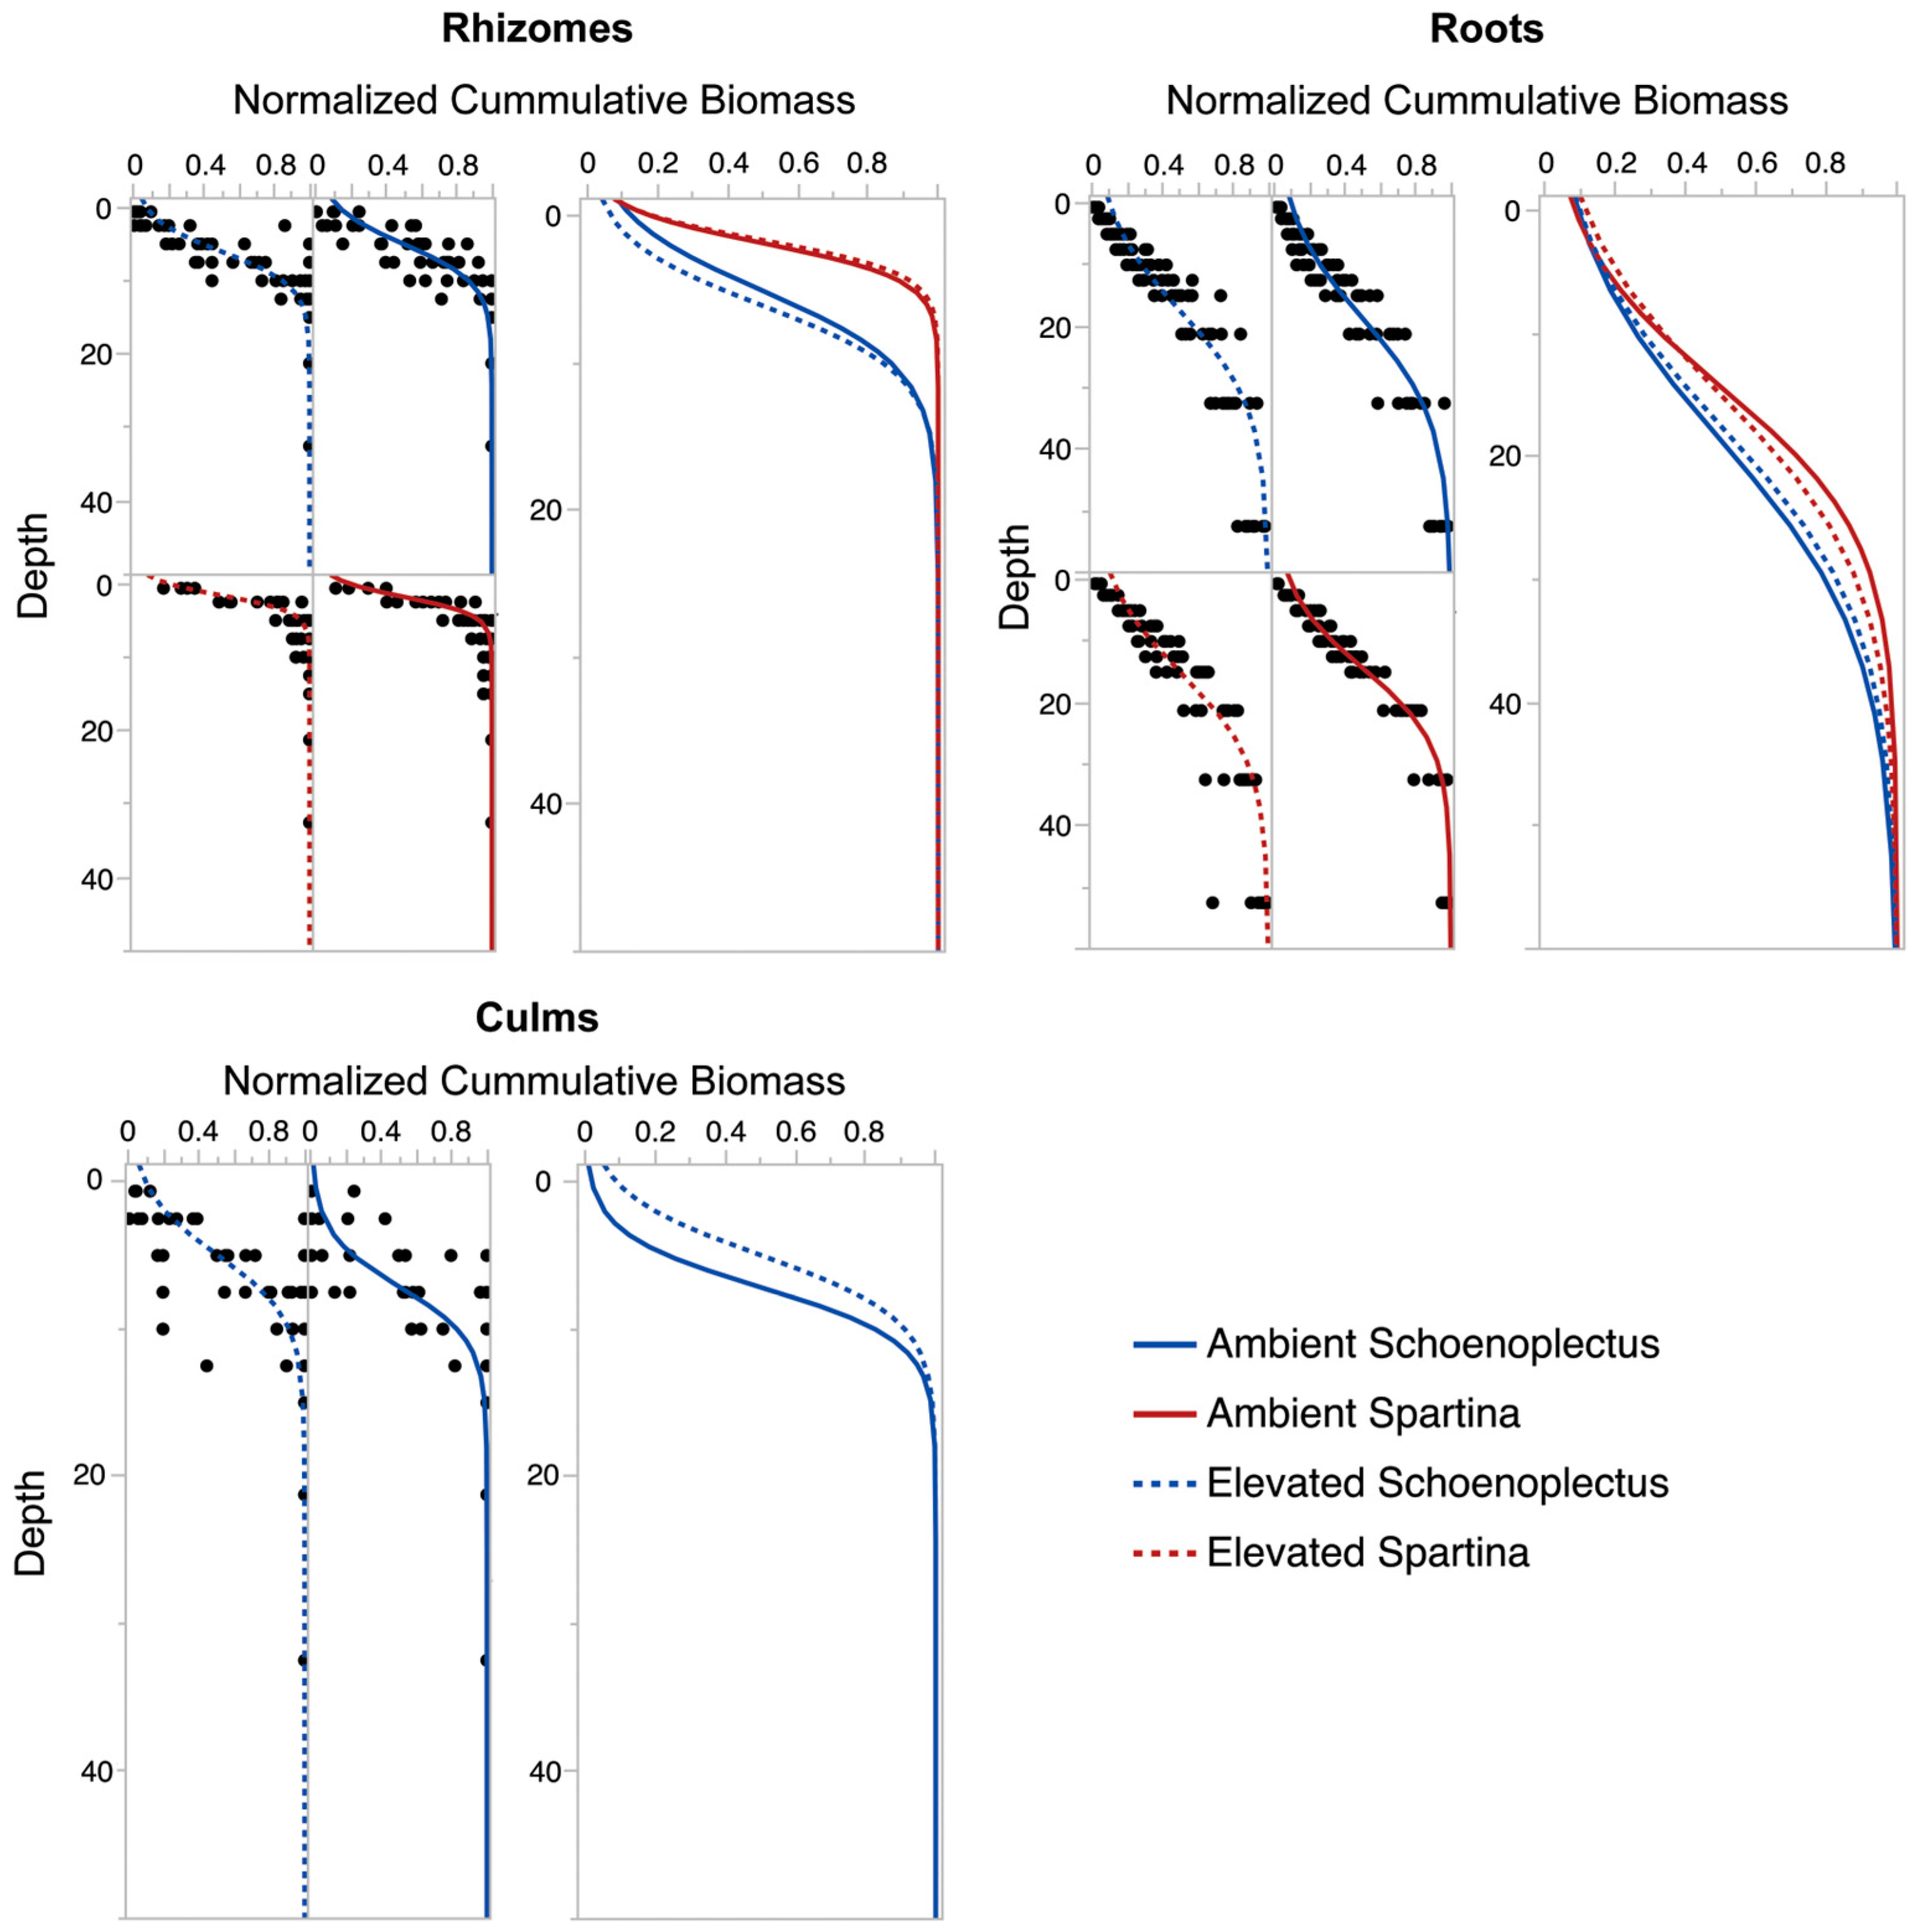
3.2. Belowground Biomass Separated by Plant Functional Group
3.3. Community Composition, Root:Shoot, and Plant Functional Type Responses to CO2 Treatment
4. Discussion
4.1. Effects of CO2 Treatment
4.2. How Community Differences Impact Soil Carbon, Responses to SLR, and Methane Fluxes
Supplementary Materials
Author Contributions
Funding
Institutional Review Board Statement
Informed Consent Statement
Data Availability Statement
Acknowledgments
Conflicts of Interest
References
- Megonigal, J.P.; Neubauer, S.C. Biogeochemistry of Tidal Freshwater Wetlands. In Coastal Wetlands; Elsevier: Amsterdam, The Netherlands, 2019; pp. 641–683. [Google Scholar]
- Costanza, R.; Anderson, S.J.; Sutton, P.; Mulder, K.; Mulder, O.; Kubiszewski, I.; Wang, X.; Liu, X.; Pérez-Maqueo, O.; Martinez, M.L.; et al. The Global Value of Coastal Wetlands for Storm Protection. Glob. Environ. Change 2021, 70, 102328. [Google Scholar] [CrossRef]
- Kirwan, M.L.; Megonigal, J.P. Tidal Wetland Stability in the Face of Human Impacts and Sea-Level Rise. Nature 2013, 504, 53–60. [Google Scholar] [CrossRef]
- FitzGerald, D.M.; Hughes, Z. Marsh Processes and Their Response to Climate Change and Sea-Level Rise. Annu. Rev. Earth Planet. Sci. 2019, 47, 481–517. [Google Scholar] [CrossRef]
- Cahoon, D.R.; Lynch, J.C.; Roman, C.T.; Schmit, J.P.; Skidds, D.E. Evaluating the Relationship among Wetland Vertical Development, Elevation Capital, Sea-Level Rise, and Tidal Marsh Sustainability. Estuaries Coasts 2019, 42, 1–15. [Google Scholar] [CrossRef]
- Schile, L.M.; Callaway, J.C.; Morris, J.T.; Stralberg, D.; Parker, V.T.; Kelly, M. Modeling Tidal Marsh Distribution with Sea-Level Rise: Evaluating the Role of Vegetation, Sediment, and Upland Habitat in Marsh Resiliency. PLoS ONE 2014, 9, e88760. [Google Scholar] [CrossRef]
- Rietl, A.J.; Megonigal, J.P.; Herbert, E.R.; Kirwan, M.L. Vegetation Type and Decomposition Priming Mediate Brackish Marsh Carbon Accumulation Under Interacting Facets of Global Change. Geophys. Res. Lett. 2021, 48, e2020GL092051. [Google Scholar] [CrossRef]
- Moor, H.; Rydin, H.; Hylander, K.; Nilsson, M.B.; Lindborg, R.; Norberg, J. Towards a Trait-Based Ecology of Wetland Vegetation. J. Ecol. 2017, 105, 1623–1635. [Google Scholar] [CrossRef]
- Cherry, J.A.; McKee, K.L.; Grace, J.B. Elevated CO2 Enhances Biological Contributions to Elevation Change in Coastal Wetlands by Offsetting Stressors Associated with Sea-Level Rise. J. Ecol. 2009, 97, 67–77. [Google Scholar] [CrossRef]
- Jones, J.A.; Cherry, J.A.; McKee, K.L. Species and Tissue Type Regulate Long-Term Decomposition of Brackish Marsh Plants Grown under Elevated CO2 Conditions. Estuar. Coast. Shelf Sci. 2016, 169, 38–45. [Google Scholar] [CrossRef]
- Moseman-Valtierra, S.; Abdul-Aziz, O.I.; Tang, J.; Ishtiaq, K.S.; Morkeski, K.; Mora, J.; Quinn, R.K.; Martin, R.M.; Egan, K.; Brannon, E.Q.; et al. Carbon Dioxide Fluxes Reflect Plant Zonation and Belowground Biomass in a Coastal Marsh. Ecosphere 2016, 7, e01560. [Google Scholar] [CrossRef]
- Chambers, L.G.; Steinmuller, H.E.; Breithaupt, J.L. Toward a Mechanistic Understanding of “Peat Collapse” and Its Potential Contribution to Coastal Wetland Loss. Ecology 2019, 100, e02720. [Google Scholar] [CrossRef]
- Blum, L.K.; Christian, R.R.; Cahoon, D.R.; Wiberg, P.L. Processes Influencing Marsh Elevation Change in Low-and High-Elevation Zones of a Temperate Salt Marsh. Estuaries Coasts 2021, 44, 818–833. [Google Scholar] [CrossRef]
- Cahoon, D.R.; McKee, K.L.; Morris, J.T. How Plants Influence Resilience of Salt Marsh and Mangrove Wetlands to Sea-Level Rise. Estuaries Coasts 2021, 44, 883–898. [Google Scholar] [CrossRef]
- Noyce, G.L.; Smith, A.J.; Kirwan, M.L.; Rich, R.L.; Megonigal, J.P. Oxygen Priming Induced by Elevated CO2 Reduces Carbon Accumulation and Methane Emissions in Coastal Wetlands. Nat. Geosci. 2023, 16, 63–68. [Google Scholar] [CrossRef]
- Haviland, K.A.; Noyce, G.L. Assessing Root–Soil Interactions in Wetland Plants: Root Exudation and Radial Oxygen Loss. Biogeosciences 2024, 21, 5185–5198. [Google Scholar] [CrossRef]
- Maher, N.; Starke, A. Suboptimal Rootzone Growth Prevents Long Island (NY) Salt Marshes from Keeping Pace with Sea Level Rise. Estuaries Coasts 2024, 47, 1766–1783. [Google Scholar] [CrossRef]
- Cahoon, D.R.; Ree, D.J.; Kolker, A.S.; Brinson, M.M.; Stevenson, J.C.; Riggs, S.; Christian, R.; Reyes, E.; Voss, C.; Kunz, D. Coastal Wetland Sustainability. In Coastal Sensitivity to Sea-Level Rise: A Focus on the Mid-Atlantic Region; U.S. Environmental Protection Agency: Washington, DC, USA, 2009; pp. 43–56. [Google Scholar]
- Feher, L.C.; Osland, M.J.; McKee, K.L.; Whelan, K.R.; Coronado-Molina, C.; Sklar, F.H.; Krauss, K.W.; Howard, R.J.; Cahoon, D.R.; Lynch, J.C.; et al. Soil Elevation Change in Mangrove Forests and Marshes of the Greater Everglades: A Regional Synthesis of Surface Elevation Table-Marker Horizon (SET-MH) Data. Estuaries Coasts 2024, 47, 2027–2056. [Google Scholar] [CrossRef]
- Weston, N.B.; Rodriguez, E.; Donnelly, B.; Solohin, E.; Jezycki, K.; Demberger, S.; Sutter, L.A.; Morris, J.T.; Neubauer, S.C.; Craft, C.B. Recent Acceleration of Wetland Accretion and Carbon Accumulation Along the U.S. East Coast. Earth’s Future 2023, 11, e2022EF003037. [Google Scholar] [CrossRef]
- Nyman, J.A.; Walters, R.J.; Delaune, R.D.; Patrick, W.H., Jr. Marsh Vertical Accretion via Vegetative Growth. Estuar. Coast. Shelf Sci. 2006, 69, 370–380. [Google Scholar] [CrossRef]
- Langley, J.A.; McKee, K.L.; Cahoon, D.R.; Cherry, J.A.; Megonigal, J.P. Elevated CO2 Stimulates Marsh Elevation Gain, Counterbalancing Sea-Level Rise. Proc. Natl. Acad. Sci. USA 2009, 106, 6182–6186. [Google Scholar] [CrossRef]
- Curtis, P.S.; Balduman, L.M.; Drake, B.G.; Whigham, D.F. Elevated Atmospheric CO2 Effects on Belowground Processes in C3 and C4 Estuarine Marsh Communities. Ecology 1990, 71, 2001–2006. [Google Scholar] [CrossRef]
- Ainsworth, E.A.; Long, S.P. What Have We Learned from 15 Years of Free-Air CO2 Enrichment (FACE)? A Meta-Analytic Review of the Responses of Photosynthesis, Canopy Properties and Plant Production to Rising CO2. New Phytol. 2005, 165, 351–372. [Google Scholar] [CrossRef] [PubMed]
- Erickson, J.E.; Megonigal, J.P.; Peresta, G.; Drake, B.G. Salinity and Sea Level Mediate Elevated CO2 Effects on C3–C4 Plant Interactions and Tissue Nitrogen in a Chesapeake Bay Tidal Wetland. Glob. Change Biol. 2007, 13, 202–215. [Google Scholar] [CrossRef]
- Langley, A.J.; Mozdzer, T.J.; Shepard, K.A.; Hagerty, S.B.; Patrick Megonigal, J. Tidal Marsh Plant Responses to Elevated CO2, Nitrogen Fertilization, and Sea Level Rise. Glob. Change Biol. 2013, 19, 1495–1503. [Google Scholar] [CrossRef]
- Lu, M.; Herbert, E.R.; Langley, J.A.; Kirwan, M.L.; Megonigal, J.P. Nitrogen Status Regulates Morphological Adaptation of Marsh Plants to Elevated CO2. Nat. Clim. Change 2019, 9, 764–768. [Google Scholar] [CrossRef]
- Saunders, C.J.; Megonigal, J.P.; Reynolds, J.F. Comparison of Belowground Biomass in C3-and C4-Dominated Mixed Communities in a Chesapeake Bay Brackish Marsh. Plant Soil 2006, 280, 305–322. [Google Scholar] [CrossRef]
- Haitao, W.; Xianguo, L.; Qing, Y.; Ming, J.; Shouzheng, T. Early-Stage Litter Decomposition and Its Influencing Factors in the Wetland of the Sanjiang Plain, China. Acta Ecol. Sin. 2007, 27, 4027–4035. [Google Scholar] [CrossRef]
- Liao, C.Z.; Luo, Y.Q.; Fang, C.M.; Chen, J.K.; Li, B. Litter Pool Sizes, Decomposition, and Nitrogen Dynamics in Spartina Alterniflora-Invaded and Native Coastal Marshlands of the Yangtze Estuary. Oecologia 2008, 156, 589–600. [Google Scholar] [CrossRef]
- Carrasco-Barea, L.; Llorens, L.; Romaní, A.M.; Gispert, M.; Verdaguer, D. Litter Decomposition of Three Halophytes in a Mediterranean Salt Marsh: Relevance of Litter Quality, Microbial Activity and Microhabitat. Sci. Total Environ. 2022, 838, 155743. [Google Scholar] [CrossRef]
- Treplin, M.; Pennings, S.C.; Zimmer, M. Decomposition of Leaf Litter in a US Saltmarsh Is Driven by Dominant Species, Not Species Complementarity. Wetlands 2013, 33, 83–89. [Google Scholar] [CrossRef]
- Stagg, C.L.; Baustian, M.M.; Perry, C.L.; Carruthers, T.J.; Hall, C.T. Direct and Indirect Controls on Organic Matter Decomposition in Four Coastal Wetland Communities along a Landscape Salinity Gradient. J. Ecol. 2018, 106, 655–670. [Google Scholar] [CrossRef]
- Xia, S.; Song, Z.; Van Zwieten, L.; Guo, L.; Yu, C.; Hartley, I.P.; Wang, H. Silicon Accumulation Controls Carbon Cycle in Wetlands through Modifying Nutrients Stoichiometry and Lignin Synthesis of Phragmites Australis. Environ. Exp. Bot. 2020, 175, 104058. [Google Scholar] [CrossRef]
- Drake, B.G. Rising Sea Level, Temperature, and Precipitation Impact Plant and Ecosystem Responses to Elevated CO2 on a Chesapeake Bay Wetland: Review of a 28-year Study. Glob. Change Biol. 2014, 20, 3329–3343. [Google Scholar] [CrossRef]
- Curtis, P.S.; Drake, B.G.; Whigham, D.F. Nitrogen and Carbon Dynamics in C3 and C4 Estuarine Marsh Plants Grown under Elevated CO2 in Situ. Oecologia 1989, 78, 297–301. [Google Scholar] [CrossRef] [PubMed]
- Curtis, P.S.; Drake, B.G.; Leadley, P.W.; Arp, W.J.; Whigham, D.F. Growth and Senescence in Plant Communities Exposed to Elevated CO2 Concentrations on an Estuarine Marsh. Oecologia 1989, 78, 20–26. [Google Scholar] [CrossRef] [PubMed]
- Rasse, D.P.; Peresta, G.; Drake, B.G. Seventeen Years of Elevated CO2 Exposure in a Chesapeake Bay Wetland: Sustained but Contrasting Responses of Plant Growth and CO2 Uptake. Glob. Change Biol. 2005, 11, 369–377. [Google Scholar] [CrossRef]
- Rasse, D.P.; Li, J.-H.; Drake, B.G. Carbon Dioxide Assimilation by a Wetland Sedge Canopy Exposed to Ambient and Elevated CO2 Measurements and Model Analysis. Funct. Ecol. 2003, 17, 222–230. [Google Scholar] [CrossRef]
- Zhu, C.; Langley, J.A.; Ziska, L.H.; Cahoon, D.R.; Megonigal, J.P. Accelerated Sea-Level Rise Is Suppressing CO2 Stimulation of Tidal Marsh Productivity: A 33-Year Study. Sci. Adv. 2022, 8, eabn0054. [Google Scholar] [CrossRef]
- Drake, B.G.; Leadley, P.W.; Arp, W.J.; Nassiry, D.; Curtis, P.S. An Open Top Chamber for Field Studies of Elevated Atmospheric CO2 Concentration on Saltmarsh Vegetation. Funct. Ecol. 1989, 3, 363–371. [Google Scholar] [CrossRef]
- Megonigal, J.P.; Holmquist, J. Dataset: 1999 CO2xCommunity Experiment Belowground Biomass; Smithsonian Environmental Research Center: Edgewater, MD, USA, 2021. [Google Scholar] [CrossRef]
- Turner, R.E.; Swenson, E.M.; Milan, C.S.; Lee, J.M.; Oswald, T.A. Below-Ground Biomass in Healthy and Impaired Salt Marshes. Ecol. Res. 2004, 19, 29–35. [Google Scholar] [CrossRef]
- Erickson, J.E.; Peresta, G.; Montovan, K.J.; Drake, B.G. Direct and Indirect Effects of Elevated Atmospheric CO2 on Net Ecosystem Production in a Chesapeake Bay Tidal Wetland. Glob. Change Biol. 2013, 19, 3368–3378. [Google Scholar] [CrossRef] [PubMed]
- Lu, M.; Caplan, J.S.; Bakker, J.D.; Mozdzer, T.J.; Drake, B.G.; Megonigal, J.P.; Langley, J.A. Allometry Data and Equations for Coastal Marsh Plants. Ecology 2016, 97, 3554. [Google Scholar] [CrossRef]
- Muff, S.; Nilsen, E.B.; O’Hara, R.B.; Nater, C.R. Rewriting Results Sections in the Language of Evidence. Trends Ecol. Evol. 2022, 37, 203–210. [Google Scholar] [CrossRef] [PubMed]
- Goodman, S.N. Aligning Statistical and Scientific Reasoning. Science 2016, 352, 1180–1181. [Google Scholar] [CrossRef]
- Burnham, K.P.; Anderson, D.R. P Values Are Only an Index to Evidence: 20th-vs. 21st-Century Statistical Science. Ecology 2014, 95, 627–630. [Google Scholar] [CrossRef]
- Langley, J.A.; Megonigal, J.P. Ecosystem Response to Elevated CO2 Levels Limited by Nitrogen-Induced Plant Species Shift. Nature 2010, 466, 96–99. [Google Scholar] [CrossRef]
- Ainsworth, E.A.; Long, S.P. 30 Years of Free-Air Carbon Dioxide Enrichment (FACE): What Have We Learned about Future Crop Productivity and Its Potential for Adaptation? Glob. Change Biol. 2021, 27, 27–49. [Google Scholar] [CrossRef]
- Mateos-Naranjo, E.; Redondo-Gomez, S.; Alvarez, R.; Cambrolle, J.; Gandullo, J.; Figueroa, M.E. Synergic Effect of Salinity and CO2 Enrichment on Growth and Photosynthetic Responses of the Invasive Cordgrass Spartina densiflora. J. Exp. Bot. 2010, 61, 1643–1654. [Google Scholar] [CrossRef]
- Mateos-Naranjo, E.; Redondo-Gómez, S.; Andrades-Moreno, L.; Davy, A. Growth and Photosynthetic Responses of the Cordgrass Spartina maritima to CO2 Enrichment and Salinity. Chemosphere 2010, 81, 725–731. [Google Scholar] [CrossRef]
- Kathilankal, J.C.; Mozdzer, T.J.; Fuentes, J.D.; McGlathery, K.J.; D’Odorico, P.; Zieman, J.C. Physiological Responses of Spartina alterniflora to Varying Environmental Conditions in Virginia Marshes. Hydrobiologia 2011, 669, 167–181. [Google Scholar] [CrossRef]
- Arnone, J.A.; Zaller, J.G.; Spehn, E.M.; Niklaus, P.A.; Wells, C.E.; Körner, C. Dynamics of Root Systems in Native Grasslands: Effects of Elevated Atmospheric CO2. New Phytol. 2000, 147, 73–85. [Google Scholar] [CrossRef]
- Eissenstat, D.M.; Wells, C.E.; Yanai, R.D.; Whitbeck, J.L. Building Roots in a Changing Environment: Implications for Root Longevity. New Phytol. 2000, 147, 33–42. [Google Scholar] [CrossRef]
- Chen, H.Y.H.; Brassard, B.W. Intrinsic and Extrinsic Controls of Fine Root Life Span. Crit. Rev. Plant Sci. 2013, 32, 151–161. [Google Scholar] [CrossRef]
- Langley, J.A.; Chapman, S.K.; La Pierre, K.J.; Avolio, M.; Bowman, W.D.; Johnson, D.S.; Isbell, F.; Wilcox, K.R.; Foster, B.L.; Hovenden, M.J.; et al. Ambient Changes Exceed Treatment Effects on Plant Species Abundance in Global Change Experiments. Glob. Change Biol. 2018, 24, 5668–5679. [Google Scholar] [CrossRef]
- McKee, K.L.; Cahoon, D.R.; Feller, I.C. Caribbean Mangroves Adjust to Rising Sea Level through Biotic Controls on Change in Soil Elevation. Glob. Ecol. Biogeogr. 2007, 16, 545–556. [Google Scholar] [CrossRef]
- Graham, S.A.; Mendelssohn, I.A. Coastal Wetland Stability Maintained through Counterbalancing Accretionary Responses to Chronic Nutrient Enrichment. Ecology 2014, 95, 3271–3283. [Google Scholar] [CrossRef]
- Stagg, C.L.; Krauss, K.W.; Cahoon, D.R.; Cormier, N.; Conner, W.H.; Swarzenski, C.M. Processes Contributing to Resilience of Coastal Wetlands to Sea-Level Rise. Ecosystems 2016, 19, 1445–1459. [Google Scholar] [CrossRef]
- Morris, J.T.; Sundberg, K. Responses of Coastal Wetlands to Rising Sea-Level Revisited: The Importance of Organic Production. Estuaries Coasts 2024, 47, 1735–1749. [Google Scholar] [CrossRef]
- Langley, J.; Wang, L.; Yedman, B.; Megonigal, J. Rising Plant Demand Strengthens Nitrogen Limitation in Tidal Marsh. Glob. Change Biol. 2024, 30, e17342. [Google Scholar] [CrossRef]
- Zhang, D.; Hui, D.; Luo, Y.; Zhou, G. Rates of Litter Decomposition in Terrestrial Ecosystems: Global Patterns and Controlling Factors. J. Plant Ecol. 2008, 1, 85–93. [Google Scholar] [CrossRef]
- Mueller, P.; Mozdzer, T.J.; Langley, J.A.; Aoki, L.R.; Noyce, G.L.; Megonigal, J.P. Plant Species Determine Tidal Wetland Methane Response to Sea Level Rise. Nat. Commun. 2020, 11, 5154. [Google Scholar] [CrossRef] [PubMed]
- Mueller, P.; Jensen, K.; Megonigal, J.P. Plants Mediate Soil Organic Matter Decomposition in Response to Sea Level Rise. Glob. Change Biol. 2016, 22, 404–414. [Google Scholar] [CrossRef] [PubMed]
- Noyce, G.L.; Megonigal, J.P. Biogeochemical and Plant Trait Mechanisms Drive Enhanced Methane Emissions in Response to Whole-Ecosystem Warming. Biogeosciences 2021, 18, 2449–2463. [Google Scholar] [CrossRef]


| Community | Variable | Treatment | Mean Biomass (g/m2) (s.e.) | F-Ratio | p-Value |
|---|---|---|---|---|---|
| Community Totals | |||||
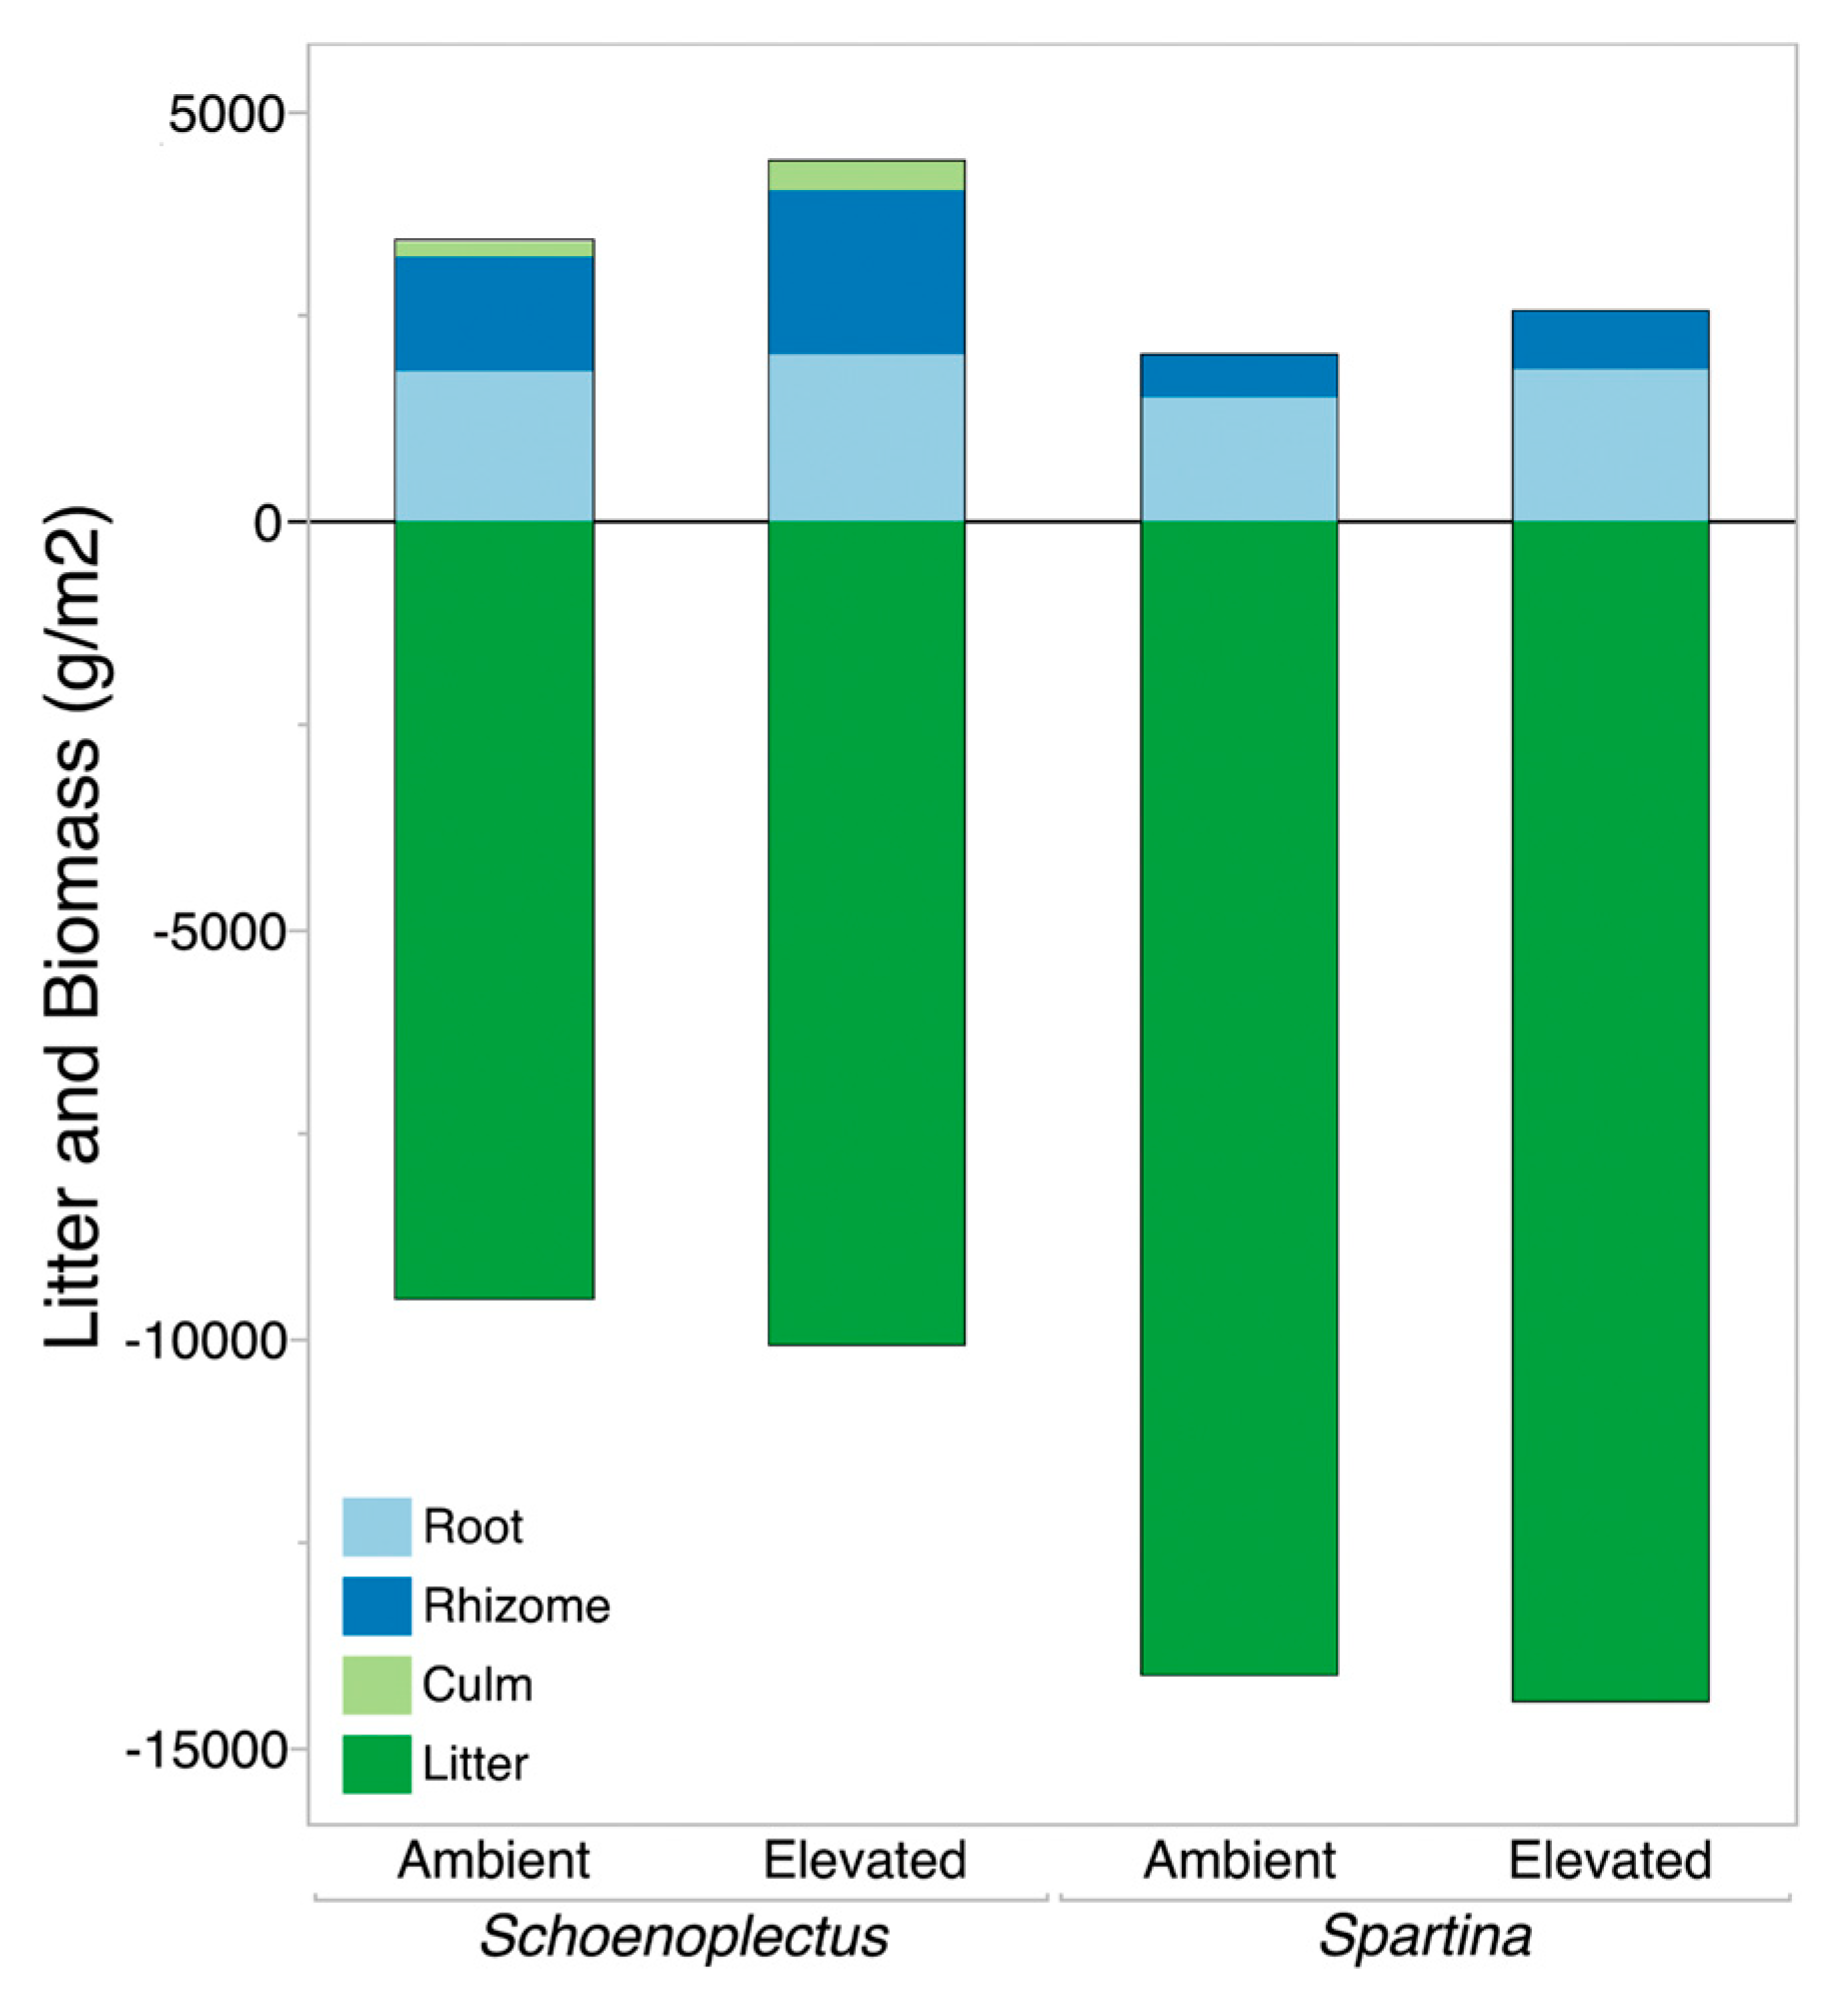
| Schoenoplectus | BGB | Ambient | 3409 (369) | 8.01 | 0.022 |
| Elevated | 4407 (450) | ||||
| Spartina | BGB | Ambient | 2042 (105) | 4.52 | 0.066 |
| Elevated | 2579 (182) | ||||
| Schoenoplectus | Litter | Ambient | 9514 (517) | 0.39 | 0.55 |
| Elevated | 10,069 (551) | ||||
| Spartina | Litter | Ambient | 14,105 (542) | 0.080 | 0.78 |
| Elevated | 14,426 (676) | ||||
| Schoenoplectus | All Roots | Ambient | 1837 (156) | 0.57 | 0.47 |
| Elevated | 2044 (179) | ||||
| Spartina | All Roots | Ambient | 1515 (66) | 3.66 | 0.092 |
| Elevated | 1862 (120) | ||||
| Schoenoplectus | All Rhizomes | Ambient | 1397 (292) | 3.99 | 0.08 |
| Elevated | 2002 (318) | ||||
| Spartina | All Rhizomes | Ambient | 527 (78) | 2.34 | 0.16 |
| Elevated | 717 (91) | ||||
| Schoenoplectus | All Culms | Ambient | 174 (48) | 13.33 | 0.0065 |
| Elevated | 361 (66) | ||||
| Roots and Rhizomes Divided by Category | |||||
| Schoenoplectus | White rhizomes | Ambient | 676 (146) | 0.55 | 0.48 |
| Elevated | 519 (154) | ||||
| Spartina | White rhizomes | Ambient | 527 (78) | 2.34 | 0.16 |
| Elevated | 717 (91) | ||||
| Schoenoplectus | Red rhizomes | Ambient | 760 (235) | 5.54 | 0.046 |
| Elevated | 1482 (264) | ||||
| Spartina | Red rhizomes | Ambient | - | - | - |
| Elevated | - | - | - | ||
| Schoenoplectus | White roots | Ambient | 957 (84) | 0.41 | 0.54 |
| Elevated | 856 (104) | ||||
| Spartina | White roots | Ambient | 1485 (69) | 2.97 | 0.12 |
| Elevated | 1803 (122) | ||||
| Schoenoplectus | Red roots | Ambient | 581 (95) | 0.97 | 0.35 |
| Elevated | 776 (117) | ||||
| Spartina | Red roots | Ambient | 18 (5) | 1.13 | 0.32 |
| Elevated | 28 (7) | ||||
| Schoenoplectus | Dark roots | Ambient | 300 (33) | 4.06 | 0.078 |
| Elevated | 412 (42) | ||||
| Spartina | Dark roots | Ambient | 12 (6) | 1.06 | 0.34 |
| Elevated | 31 (12) | ||||
| Community | Variable | Treatment | Mean C:N (s.e.) | F-Ratio | p-Value |
|---|---|---|---|---|---|
| Schoenoplectus | White rhizomes | Ambient | 98.80 (5.63) | 0.70 | 0.43 |
| Elevated | 107.15 (8.26) | ||||
| Spartina | White rhizomes | Ambient | 75.52 (5.41) | 1.64 | 0.24 |
| Elevated | 88.91 (8.96) | ||||
| Schoenoplectus | Red rhizomes | Ambient | 52.49 (8.04) | 1.94 | 0.20 |
| Elevated | 70.39 (10.02) | ||||
| Spartina | Red rhizomes | Ambient | - | - | - |
| Elevated | - | - | - | ||
| Schoenoplectus | White roots | Ambient | 71.48 (2.18) | 2.28 | 0.17 |
| Elevated | 80.02 (5.22) | ||||
| Spartina | White roots | Ambient | 105.71 (3.14) | 0.21 | 0.65 |
| Elevated | 108.21 (4.40) | ||||
| Schoenoplectus | Red roots | Ambient | 84.73 (1.99) | 3.82 | 0.09 |
| Elevated | 94.55 (4.61) | ||||
| Spartina | Red roots | Ambient | - | - | - |
| Elevated | - | - | - | ||
| Schoenoplectus | Dark roots | Ambient | 79.08 (2.52) | 2.31 | 0.17 |
| Elevated | 85.71 (3.56) | ||||
| Spartina | Dark roots | Ambient | - | - | - |
| Elevated | - | - | - | ||
| Schoenoplectus | Culms | Ambient | 81.86 (4.04) | 6.62 | 0.02 |
| Elevated | 99.51 (5.39) |
Disclaimer/Publisher’s Note: The statements, opinions and data contained in all publications are solely those of the individual author(s) and contributor(s) and not of MDPI and/or the editor(s). MDPI and/or the editor(s) disclaim responsibility for any injury to people or property resulting from any ideas, methods, instructions or products referred to in the content. |
© 2025 by the authors. Licensee MDPI, Basel, Switzerland. This article is an open access article distributed under the terms and conditions of the Creative Commons Attribution (CC BY) license (https://creativecommons.org/licenses/by/4.0/).
Share and Cite
Collin, R.; Drake, B.G.; Megonigal, J.P. What’s Going on Down There? Impacts of Long-Term Elevated CO2 and Community Composition on Components of Below-Ground Biomass in a Chesapeake Bay Saltmarsh. Hydrobiology 2025, 4, 8. https://doi.org/10.3390/hydrobiology4010008
Collin R, Drake BG, Megonigal JP. What’s Going on Down There? Impacts of Long-Term Elevated CO2 and Community Composition on Components of Below-Ground Biomass in a Chesapeake Bay Saltmarsh. Hydrobiology. 2025; 4(1):8. https://doi.org/10.3390/hydrobiology4010008
Chicago/Turabian StyleCollin, Rachel, Bert G. Drake, and J. Patrick Megonigal. 2025. "What’s Going on Down There? Impacts of Long-Term Elevated CO2 and Community Composition on Components of Below-Ground Biomass in a Chesapeake Bay Saltmarsh" Hydrobiology 4, no. 1: 8. https://doi.org/10.3390/hydrobiology4010008
APA StyleCollin, R., Drake, B. G., & Megonigal, J. P. (2025). What’s Going on Down There? Impacts of Long-Term Elevated CO2 and Community Composition on Components of Below-Ground Biomass in a Chesapeake Bay Saltmarsh. Hydrobiology, 4(1), 8. https://doi.org/10.3390/hydrobiology4010008