
Spatial Changes in Trace Elemental Water Chemistry in the Piedmont Ecoregion with Applications for Understanding Fish Movement


Abstract
:1. Introduction
2. Methods
3. Results
4. Discussion
Supplementary Materials
Author Contributions
Funding
Institutional Review Board Statement
Informed Consent Statement
Data Availability Statement
Acknowledgments
Conflicts of Interest
References
- Hamid, A.; Bhat, S.U.; Jehangir, A. Local determinants influencing stream water quality. Appl. Water Sci. 2020, 10, 24. [Google Scholar]
- Gaillardet, J.; Viers, J.; Dupré, B. Trace Elements in River Waters. Treatise Geochem. 2014, 7, 195–235. [Google Scholar]
- Konieczka, P.; Cieślik, B.; Namieśnik, J. Trace Elements in Aquatic Environments. In Recent Advances in Trace Elements; John Wiley & Sons Ltd.: Chichester, UK, 2018; pp. 143–160. [Google Scholar]
- Carling, G.T.; Tingey, D.G.; Fernandez, D.P.; Nelson, S.T.; Aanderud, Z.T.; Goodsell, T.H.; Chapman, T.R. Evaluating natural and anthropogenic trace element inputs along an alpine to urban gradient in the Provo River, Utah, USA. Appl. Geochem. 2015, 63, 398–412. [Google Scholar] [CrossRef]
- Potot, C.; Féraud, G.; Schärer, U.; Barats, A.; Durrieu, G.; Le Poupon, C.; Travi, Y.; Simler, R. Groundwater and river baseline quality using major, trace elements, organic carbon and Sr–Pb–O isotopes in a Mediterranean catchment: The case of the Lower Var Valley (south-eastern France). J. Hydrol. 2012, 472–473, 126–147. [Google Scholar] [CrossRef]
- Asano, Y.; Uchida, T. Is representative elementary area defined by a simple mixing of variable small streams in headwater catchments? Hydrol. Process. 2010, 24, 666–671. [Google Scholar] [CrossRef]
- Ollivier, P.; Radakovitch, O.; Hamelin, B. Major and trace element partition and fluxes in the Rhône River. Chem. Geol. 2011, 285, 15–31. [Google Scholar] [CrossRef]
- Négrel, P.; Allègre, C.J.; Dupré, B.; Lewin, E. Erosion sources determined by inversion of major and trace element ratios and strontium isotopic ratios in river water: The Congo Basin case. Earth Planet. Sci. Lett. 1993, 120, 59–76. [Google Scholar] [CrossRef]
- Fröhlich, H.L.; Breuer, L.; Frede, H.-G.; Huisman, J.A.; Vaché, K.B. Water source characterization through spatiotemporal patterns of major, minor and trace element stream concentrations in a complex, mesoscale German catchment. Hydrol. Process. 2008, 22, 2028–2043. [Google Scholar] [CrossRef]
- Singh, B.R.; Steinnes, E. Soil and water contamination by heavy metals. In Soil Processes and Water Quality; CRC Press: Boca Raton, FL, USA, 2020; pp. 233–271. [Google Scholar]
- Xu, S.; Lang, Y.; Zhong, J.; Xiao, M.; Ding, H. Coupled controls of climate, lithology and land use on dissolved trace elements in a karst river system. J. Hydrol. 2020, 591, 125328. [Google Scholar] [CrossRef]
- Pracheil, B.M.; Hogan, J.D.; Lyons, J.; McIntyre, P.B. Using Hard-Part Microchemistry to Advance Conservation and Management of North American Freshwater Fishes. Fisheries 2014, 39, 451–465. [Google Scholar] [CrossRef]
- Thomas, O.R.B.; Swearer, S.E. Otolith Biochemistry—A Review. Rev. Fish. Sci. Aquac. 2019, 27, 458–489. [Google Scholar] [CrossRef]
- Campana, S.E.; Thorrold, S.R. Otoliths, increments, and elements: Keys to a comprehensive understanding of fish populations? Can. J. Fish. Aquat. Sci. 2001, 58, 30–38. [Google Scholar] [CrossRef]
- Payan, P.; De Pontual, H.; Bœuf, G.; Mayer-Gostan, N. Endolymph chemistry and otolith growth in fish. Comptes Rendus Palevol 2004, 3, 535–547. [Google Scholar] [CrossRef]
- Hüssy, K.; Limburg, K.E.; de Pontual, H.; Thomas, O.R.B.; Cook, P.K.; Heimbrand, Y.; Blass, M.; Sturrock, A.M. Trace Element Patterns in Otoliths: The Role of Biomineralization. Rev. Fish. Sci. Aquac. 2021, 29, 445–477. [Google Scholar] [CrossRef]
- Campana, S.E. Chemistry and composition of fish otoliths: Pathways, mechanisms and applications. Mar. Ecol. Prog. Ser. 1999, 188, 263–297. [Google Scholar] [CrossRef]
- Carlson, A.K.; Phelps, Q.E.; Graeb, B.D.S. Chemistry to conservation: Using otoliths to advance recreational and commercial fisheries management. J. Fish Biol. 2017, 90, 505–527. [Google Scholar] [CrossRef] [PubMed]
- Collen, B.; Whitton, F.; Dyer, E.E.; Baillie, J.E.M.; Cumberlidge, N.; Darwall, W.R.T.; Pollock, C.; Richman, N.I.; Soulsby, A.-M.; Böhm, M. Global patterns of freshwater species diversity, threat and endemism. Glob. Ecol. Biogeogr. 2014, 23, 40–51. [Google Scholar] [CrossRef]
- Elkins, D.; Sweat, S.C.; Kuhajda, B.R.; George, A.L.; Hill, K.S.; Wenger, S.J. Illuminating hotspots of imperiled aquatic biodiversity in the southeastern US. Glob. Ecol. Conserv. 2019, 19, e00654. [Google Scholar] [CrossRef]
- Jelks, H.L.; Walsh, S.J.; Burkhead, N.M.; Contreras-Balderas, S.; Diaz-Pardo, E.; Hendrickson, D.A.; Lyons, J.; Mandrak, N.E.; McCormick, F.; Nelson, J.S.; et al. Conservation Status of Imperiled North American Freshwater and Diadromous Fishes. Fisheries 2008, 33, 372–407. [Google Scholar] [CrossRef]
- Scott, M.C. Winners and losers among stream fishes in relation to land use legacies and urban development in the southeastern US. Biol. Conserv. 2006, 127, 301–309. [Google Scholar] [CrossRef]
- Melvin Jr, L.; Angermeier, P.L.; Burr, B.M.; Haag, W.R. Decline of a diverse fish fauna: Patterns of imperilment and protection in the Southeastern United States. In Aquatic Fanua in Peril: The Southeastern Perspective; Lenz Design & Communications: Decatur, GA, USA, 1997; pp. 105–164. [Google Scholar]
- Gregory, M.B.; Calhoun, D.L. Chapter B. Physical, Chemical, and Biological Responses of Streams to Increasing Watershed Urbanization in the Piedmont Ecoregion of Georgia and Alabama, 2003; 2006-5101B; Geological Survey (US): Reston, VA, USA, 2007. [Google Scholar]
- U.S. Department of Agriculture. Georgia’s Land: Its Use and Condition, 4th ed.; Natural Resources Conservation Service: Athens, GA, USA; Center for Survey Statistics and Methodology, Iowa State University: Ames, IA, USA, 2016. [Google Scholar]
- Burton, M.L.; Samuelson, L.J. Influence of urbanization on riparian forest diversity and structure in the Georgia Piedmont, US. Plant Ecol. 2008, 195, 99–115. [Google Scholar] [CrossRef]
- Ciepiela, L.R.; Walters, A.W. Life-history variation of two inland salmonids revealed through otolith microchemistry analysis. Can. J. Fish. Aquat. Sci. 2019, 76, 1971–1981. [Google Scholar] [CrossRef]
- Shiller, A.M. Syringe Filtration Methods for Examining Dissolved and Colloidal Trace Element Distributions in Remote Field Locations. Environ. Sci. Technol. 2003, 37, 3953–3957. [Google Scholar] [CrossRef]
- R Core Team. R: A Language and Environment for Statistical Computing; R Foundation for Statistical Computing: Vienna, Austria, 2024; Available online: https://www.R-project.org/ (accessed on 11 January 2025).
- Abdi, H.; Williams, L.J. Principal component analysis. WIREs Comput. Stat. 2010, 2, 433–459. [Google Scholar] [CrossRef]
- Greenacre, M.; Groenen, P.J.F.; Hastie, T.; D’Enza, A.I.; Markos, A.; Tuzhilina, E. Principal component analysis. Nat. Rev. Methods Primers 2022, 2, 100. [Google Scholar] [CrossRef]
- Schloerke, B.; Cook, D.; Larmarange, J.; Briatte, F.; Marbach, M.; Thoen, E.; Elberg, A.; Crowley, J. GGally: Extension to ‘ggplot2’, R Package Version 2.2.1; 2024. Available online: https://github.com/ggobi/ggally/ (accessed on 11 January 2025).
- Hermann, T.W.; Stewart, D.J.; Limburg, K.E.; Castello, L. Unravelling the life history of Amazonian fishes through otolith microchemistry. R. Soc. Open Sci. 2016, 3, 160206. [Google Scholar] [CrossRef] [PubMed]
- Jolliffe, I. Principal Component Analysis. In Encyclopedia of Statistics in Behavioral Science; John Wiley & Sons Ltd.: Chichester, UK, 2005. [Google Scholar]
- Olsen, R.L.; Chappell, R.W.; Loftis, J.C. Water quality sample collection, data treatment and results presentation for principal components analysis—Literature review and Illinois River watershed case study. Water Res. 2012, 46, 3110–3122. [Google Scholar] [CrossRef]
- Meyer, J.L.; McDowell, W.H.; Bott, T.L.; Elwood, J.W.; Ishizaki, C.; Melack, J.M.; Peckarsky, B.L.; Peterson, B.J.; Rublee, P.A. Elemental Dynamics in Streams. J. N. Am. Benthol. Soc. 1988, 7, 410–432. [Google Scholar] [CrossRef]
- Halliday, S.J.; Wade, A.J.; Skeffington, R.A.; Neal, C.; Reynolds, B.; Rowland, P.; Neal, M.; Norris, D. An analysis of long-term trends, seasonality and short-term dynamics in water quality data from Plynlimon, Wales. Sci. Total Environ. 2012, 434, 186–200. [Google Scholar] [CrossRef]
- Stewart, B.; Shanley, J.B.; Kirchner, J.W.; Norris, D.; Adler, T.; Bristol, C.; Harpold, A.A.; Perdrial, J.N.; Rizzo, D.M.; Sterle, G.; et al. Streams as Mirrors: Reading Subsurface Water Chemistry From Stream Chemistry. Water Resour. Res. 2022, 58, e2021WR029931. [Google Scholar] [CrossRef]
- Négrel, P. Water–granite interaction: Clues from strontium, neodymium and rare earth elements in soil and waters. Appl. Geochem. 2006, 21, 1432–1454. [Google Scholar] [CrossRef]
- Friedrich, L.; Halden, N. Otolith microchemistry: Monitoring trace elements in lacustrine environments. Geochim. Cosmochim. Acta Suppl. 2008, 72, A285. [Google Scholar]
- Tabit, C.R.; Johnson, G.M. Influence of Urbanization on the Distribution of Fishes in a Southeastern Upper Piedmont Drainage. Southeast. Nat. 2002, 1, 253–268. [Google Scholar] [CrossRef]
- Freeman, M.C.; Marcinek, P.A. Fish Assemblage Responses to Water Withdrawals and Water Supply Reservoirs in Piedmont Streams. Environ. Manag. 2006, 38, 435–450. [Google Scholar] [CrossRef]
- Warren, M.L., Jr.; Burr, B.M.; Walsh, S.J.; Bart Jr., H.L.; Cashner, R.C.; Etnier, D.A.; Freeman, B.J.; Kuhajda, B.R.; Mayden, R.L.; Robison, H.W.; et al. Diversity, Distribution, and Conservation Status of the Native Freshwater Fishes of the Southern United States. Fisheries 2000, 25, 7–31. [Google Scholar] [CrossRef]

| Watershed | Chattahoochee | Ocmulgee | Oconee | Savannah |
|---|---|---|---|---|
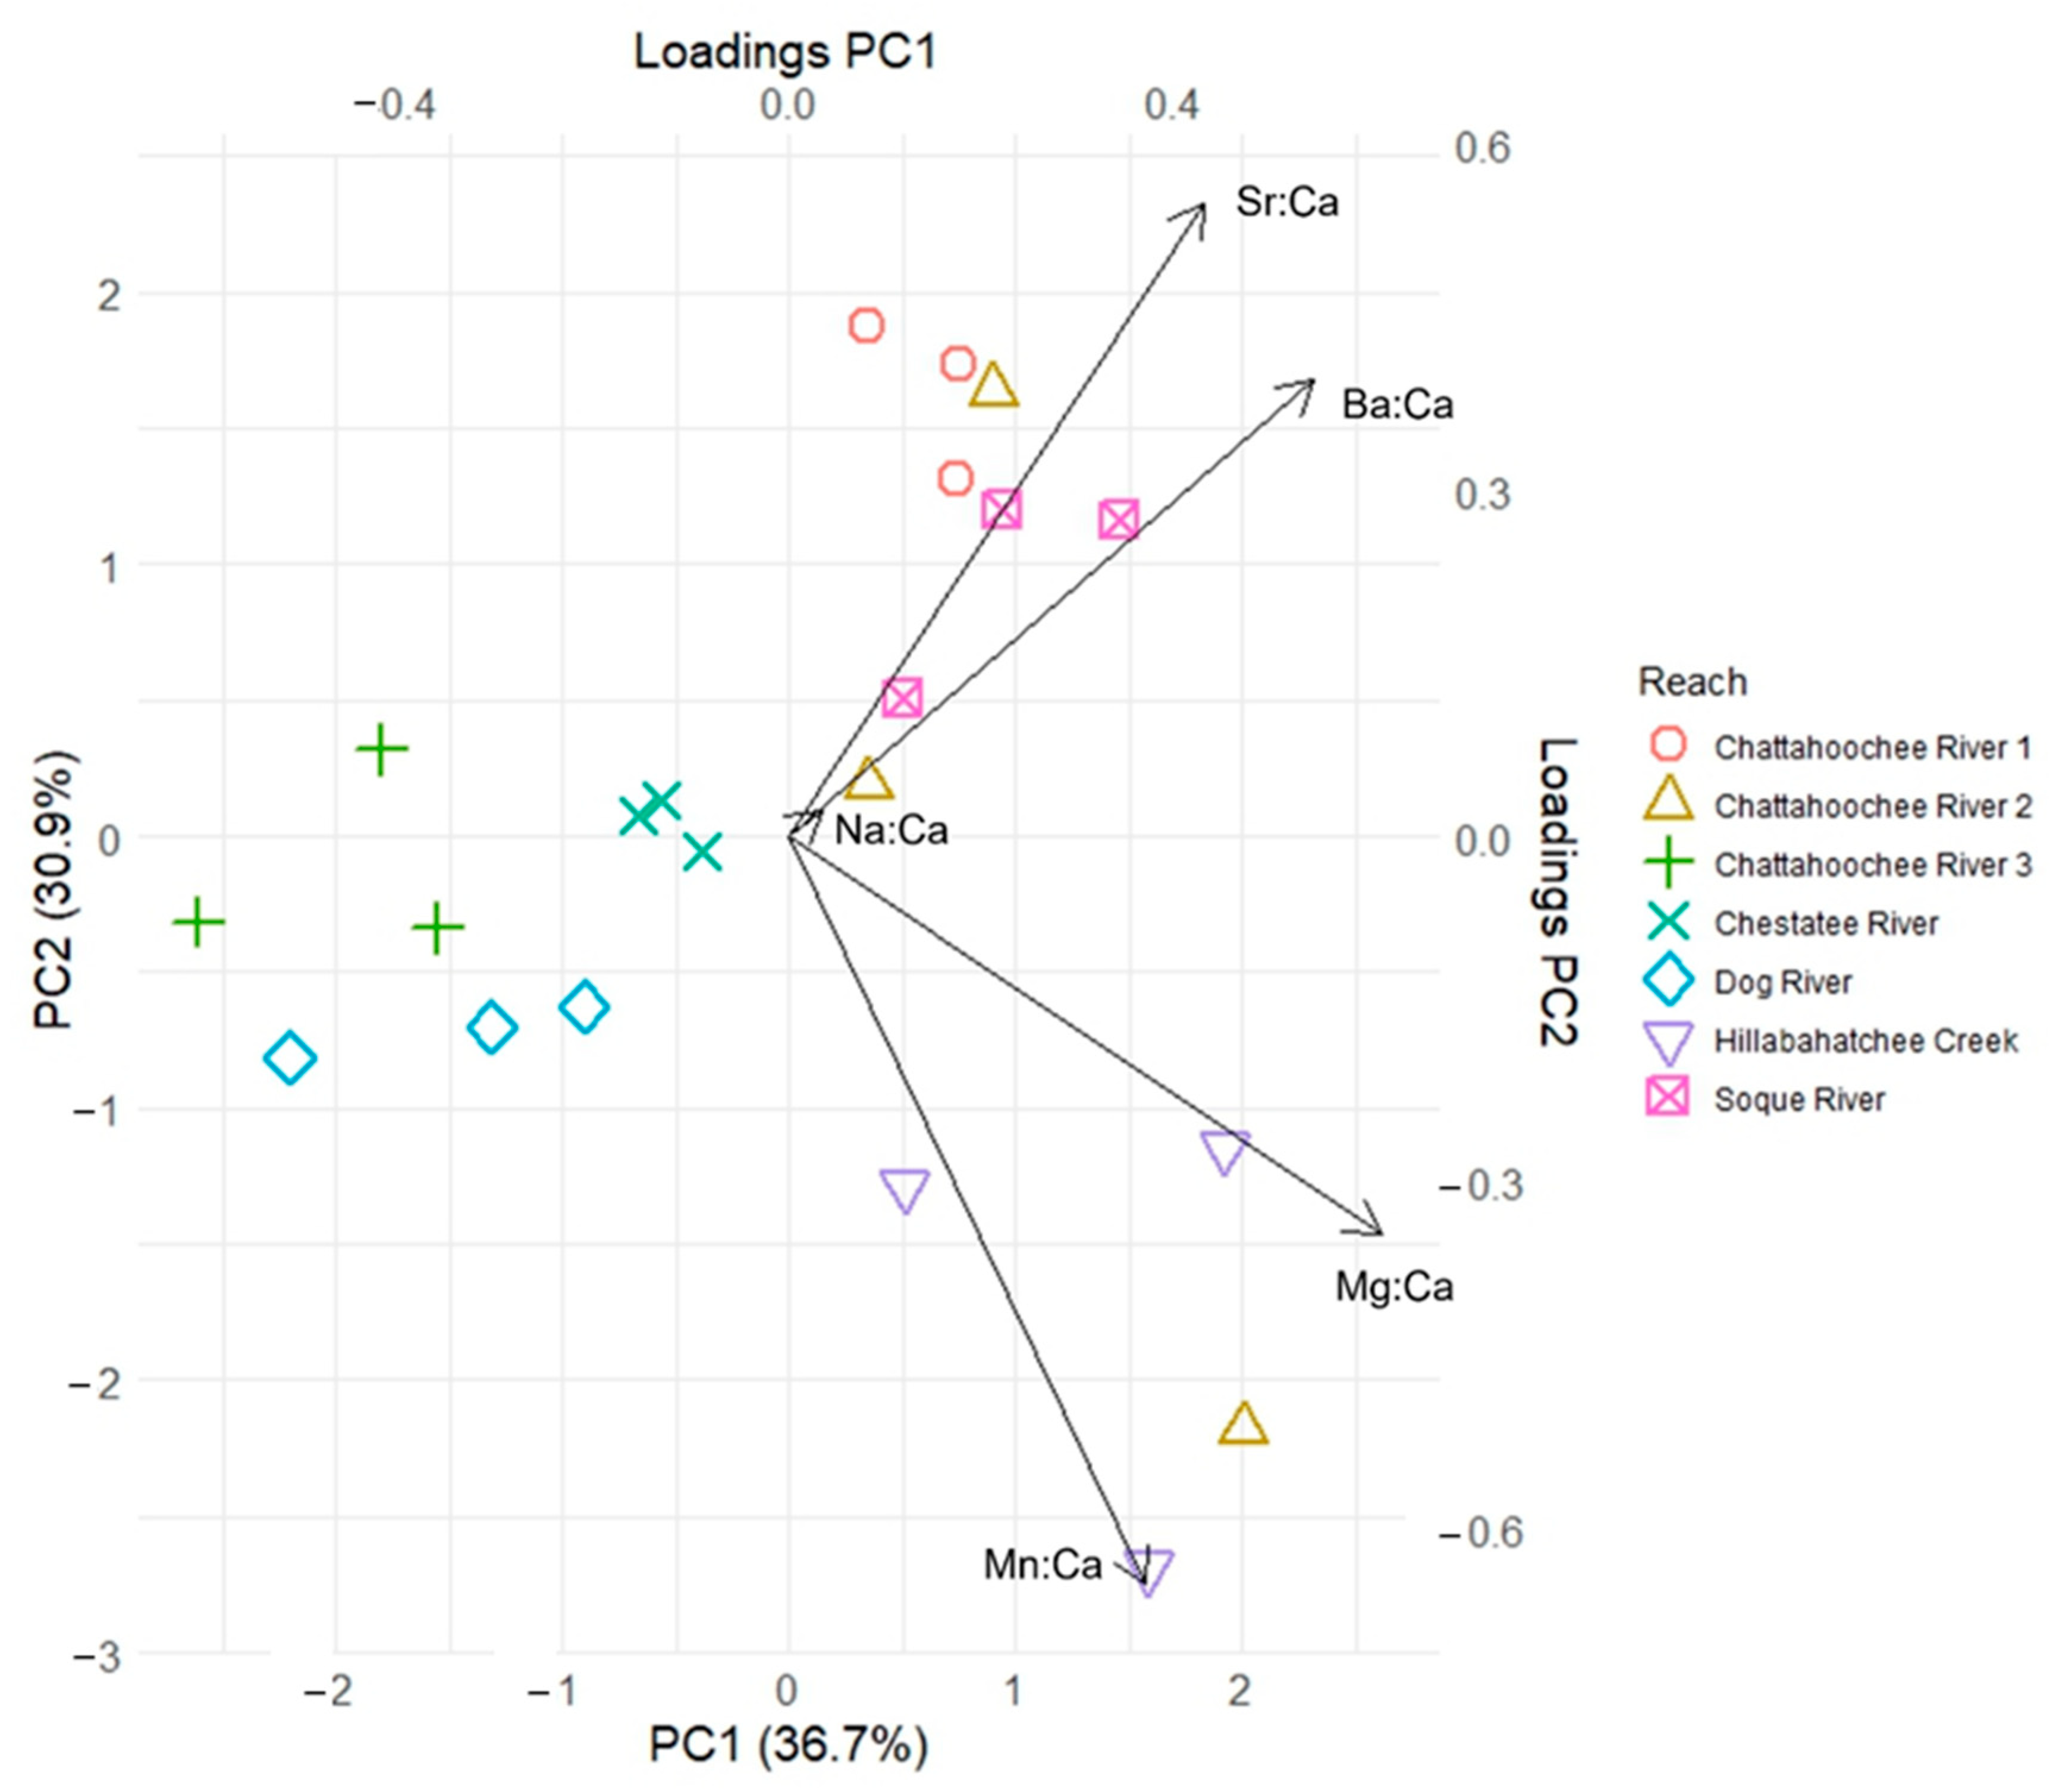
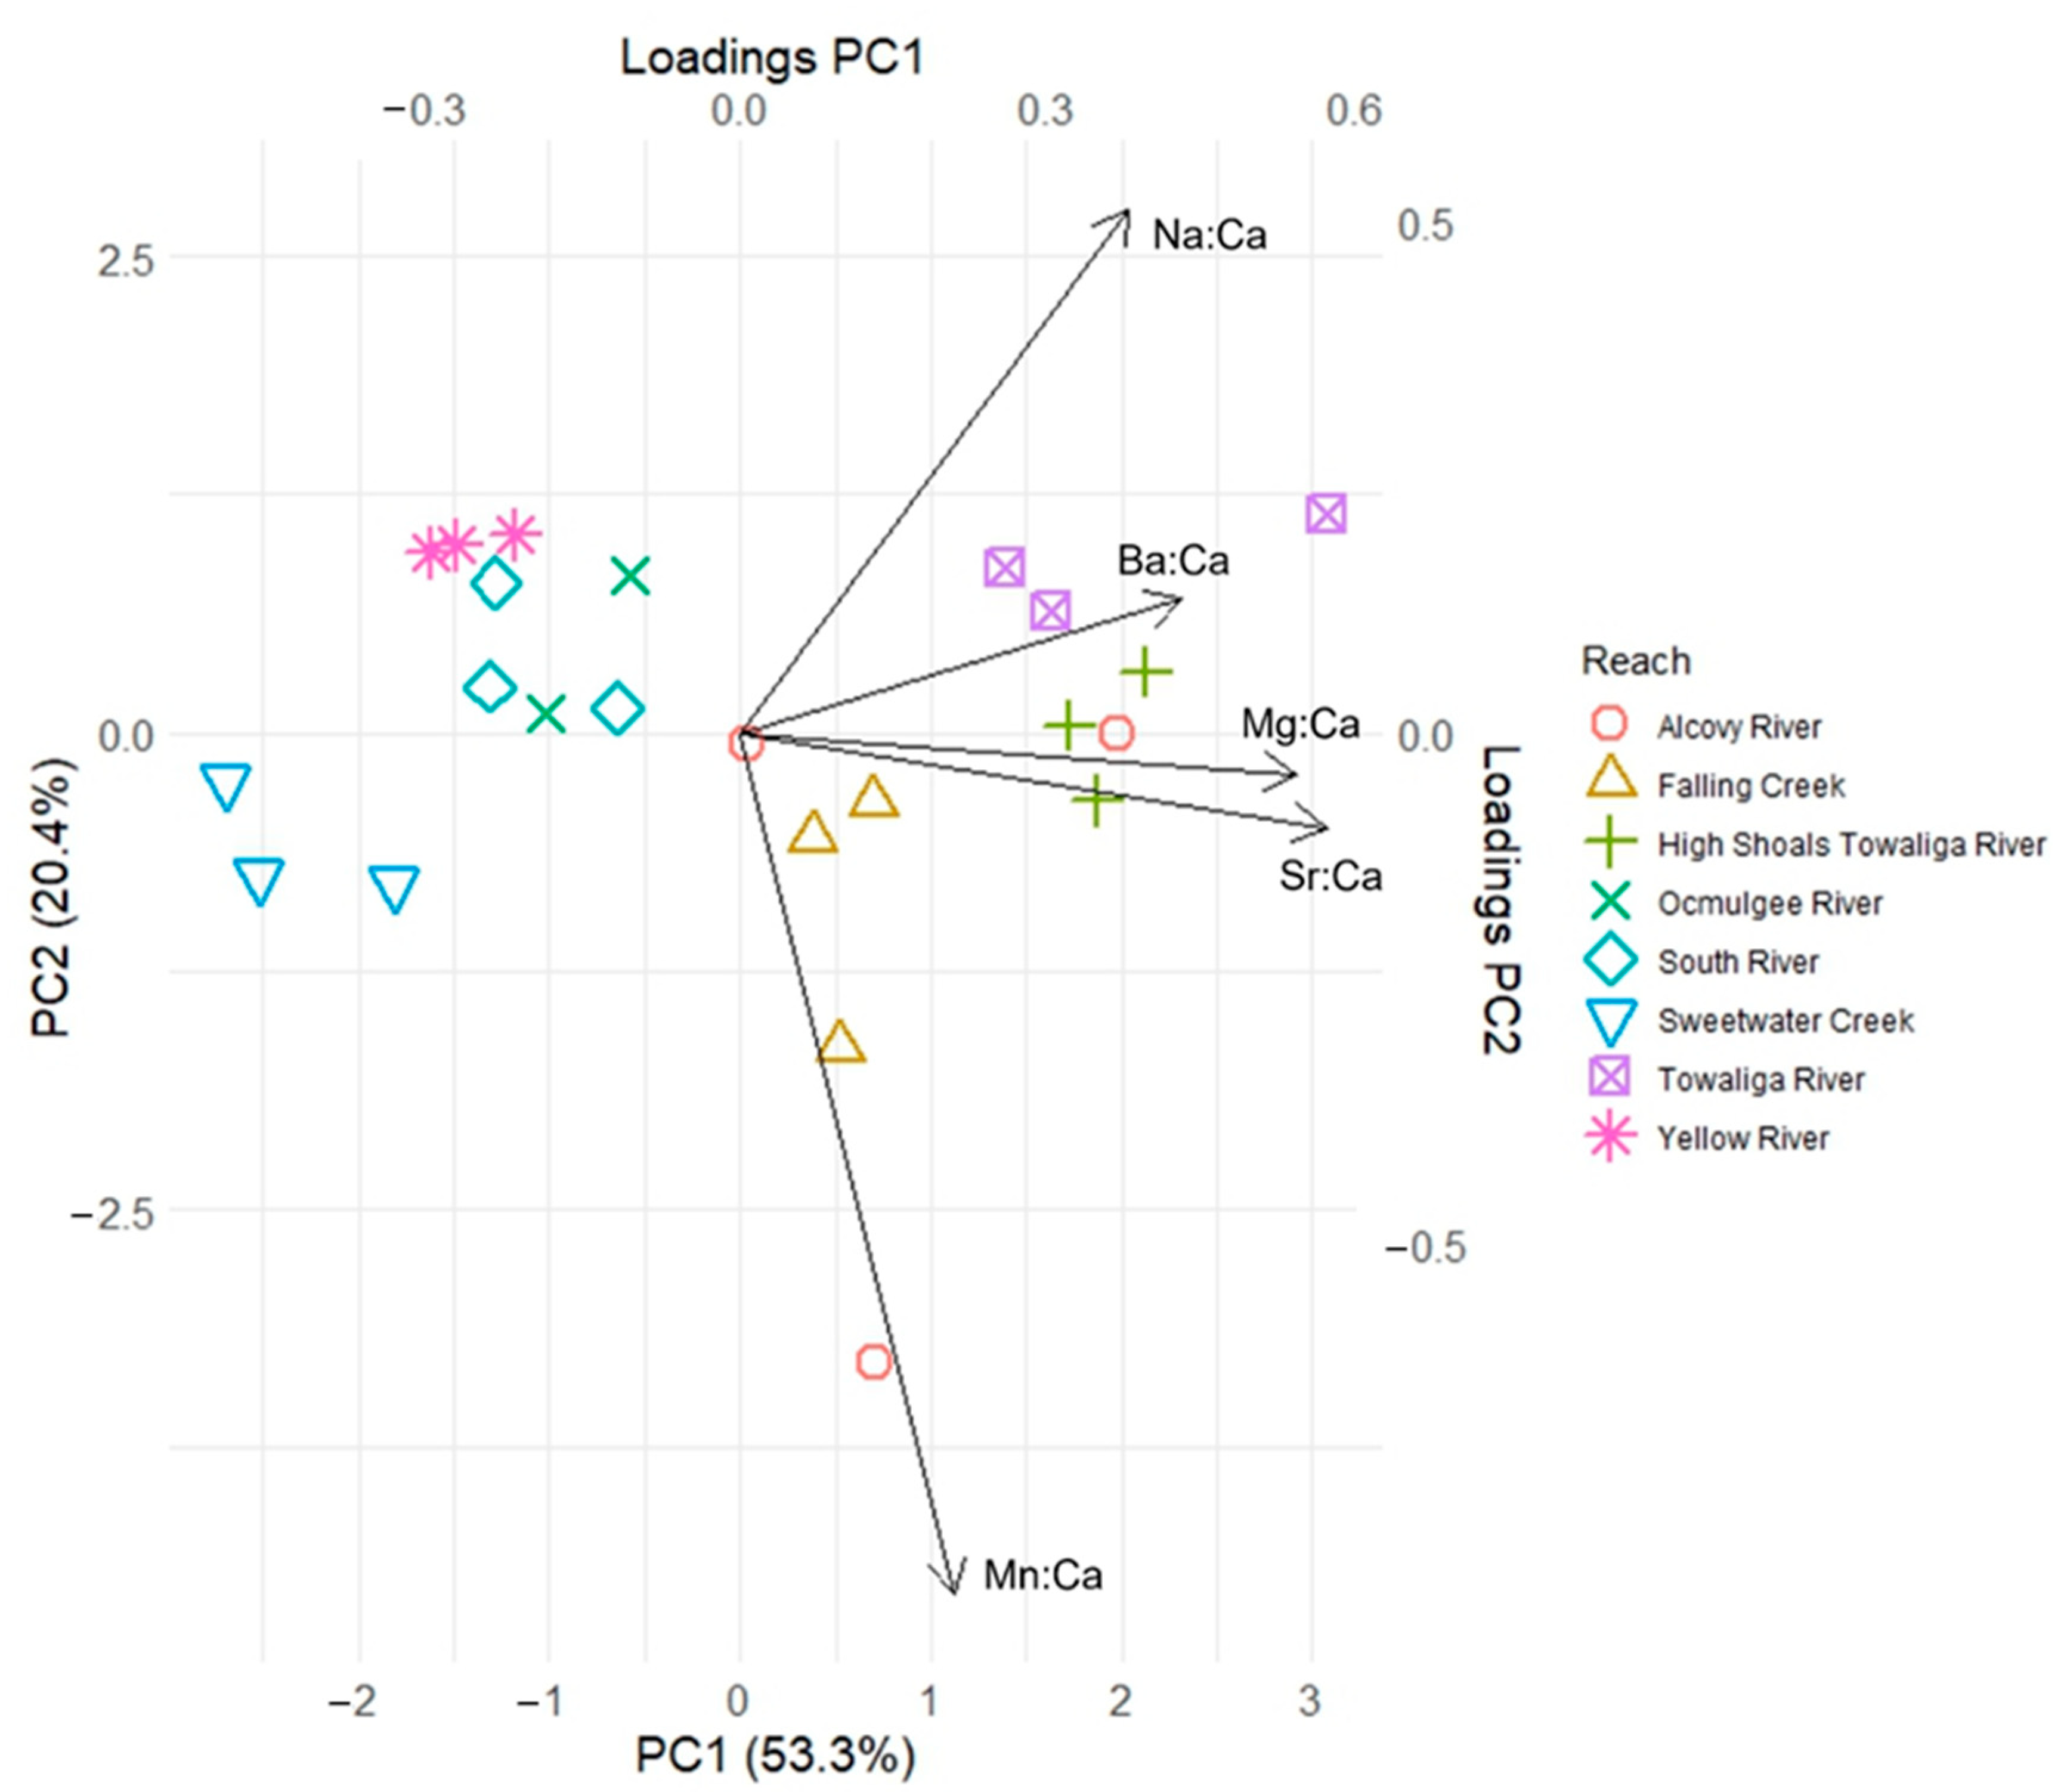
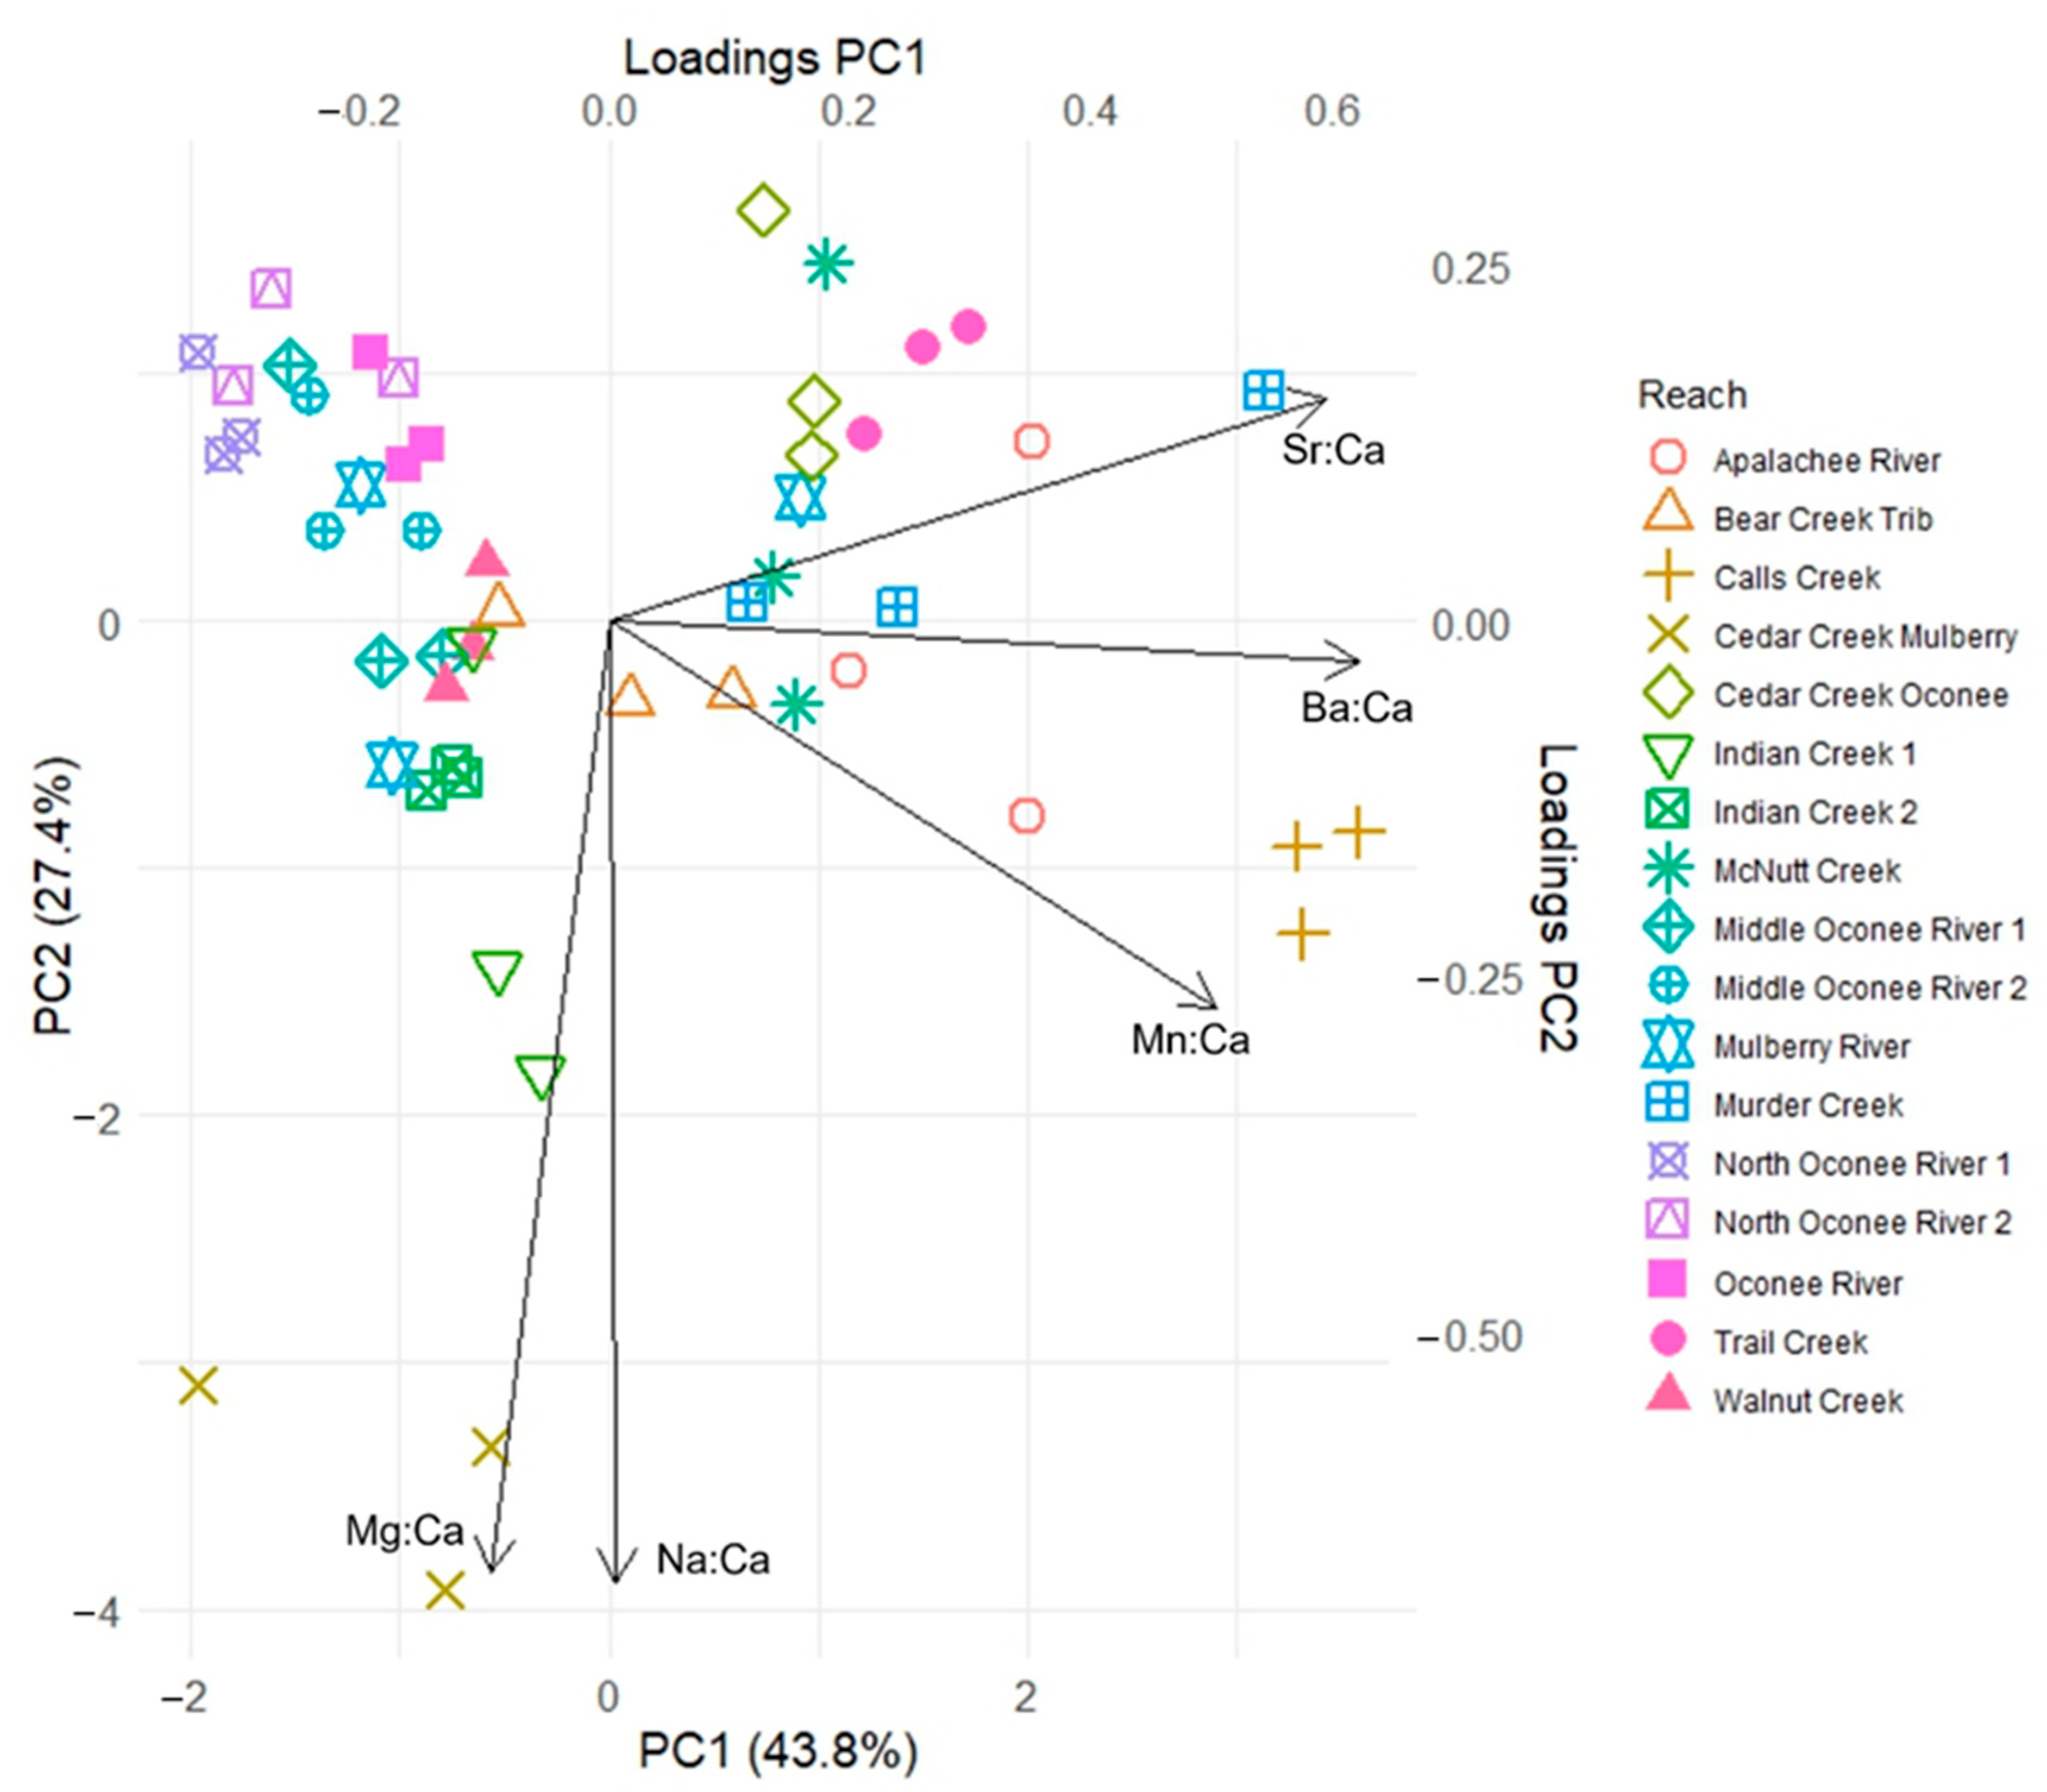
| PC 1 | 0.367 | 0.533 | 0.438 | 0.484 |
| PC 2 | 0.309 | 0.204 | 0.274 | 0.260 |
| PC 3 | 0.210 | 0.144 | 0.142 | 0.184 |
| Total | 0.886 | 0.881 | 0.855 | 0.927 |
| Chattahoochee | Ocmulgee | Oconnee | Savannah | |||||||||
|---|---|---|---|---|---|---|---|---|---|---|---|---|
| PC 1 | PC 2 | PC 3 | PC 1 | PC 2 | PC 3 | PC 1 | PC 2 | PC 3 | PC 1 | PC 2 | PC 3 | |
| Na:Ca | 0.034 | 0.022 | −0.966 | 0.380 | 0.513 | −0.335 | 0.006 | −0.675 | −0.716 | −0.526 | 0.407 | −0.171 |
| Mg:Ca | 0.616 | −0.346 | 0.161 | 0.544 | 0.040 | 0.517 | −0.098 | −0.667 | 0.669 | −0.378 | 0.657 | 0.156 |
| Mn:Ca | 0.371 | −0.649 | −0.108 | 0.210 | −0.842 | −0.361 | 0.503 | −0.271 | 0.175 | 0.238 | 0.209 | −0.934 |
| Sr:Ca | 0.431 | 0.550 | 0.107 | 0.574 | −0.092 | 0.328 | 0.593 | 0.157 | 0.053 | −0.466 | −0.508 | −0.217 |
| Ba:Ca | 0.545 | 0.396 | −0.131 | 0.431 | 0.132 | −0.618 | 0.621 | −0.029 | −0.080 | −0.554 | −0.317 | −0.163 |
Disclaimer/Publisher’s Note: The statements, opinions and data contained in all publications are solely those of the individual author(s) and contributor(s) and not of MDPI and/or the editor(s). MDPI and/or the editor(s) disclaim responsibility for any injury to people or property resulting from any ideas, methods, instructions or products referred to in the content. |
© 2025 by the authors. Licensee MDPI, Basel, Switzerland. This article is an open access article distributed under the terms and conditions of the Creative Commons Attribution (CC BY) license (https://creativecommons.org/licenses/by/4.0/).
Share and Cite
Bond, A.T.; Gerrin, W.L.; McNair, S.F.; Hamel, M.J. Spatial Changes in Trace Elemental Water Chemistry in the Piedmont Ecoregion with Applications for Understanding Fish Movement. Hydrobiology 2025, 4, 9. https://doi.org/10.3390/hydrobiology4020009
Bond AT, Gerrin WL, McNair SF, Hamel MJ. Spatial Changes in Trace Elemental Water Chemistry in the Piedmont Ecoregion with Applications for Understanding Fish Movement. Hydrobiology. 2025; 4(2):9. https://doi.org/10.3390/hydrobiology4020009
Chicago/Turabian StyleBond, Alan T., Wesley L. Gerrin, Sarah F. McNair, and Martin J. Hamel. 2025. "Spatial Changes in Trace Elemental Water Chemistry in the Piedmont Ecoregion with Applications for Understanding Fish Movement" Hydrobiology 4, no. 2: 9. https://doi.org/10.3390/hydrobiology4020009
APA StyleBond, A. T., Gerrin, W. L., McNair, S. F., & Hamel, M. J. (2025). Spatial Changes in Trace Elemental Water Chemistry in the Piedmont Ecoregion with Applications for Understanding Fish Movement. Hydrobiology, 4(2), 9. https://doi.org/10.3390/hydrobiology4020009