
Transcriptome Characterization of Different Tissues of Stone Pine (Pinus pinea L.): De Novo Assembly †

 , and
, and
Abstract
:1. Introduction
2. Materials and Methods
2.1. Sample Preparation, RNA Extraction, and Sequencing
2.2. Sequencing Data, Transcriptome Assembly, and Annotation
2.3. Tissue-Specific Characterization
3. Results
3.1. Transcriptome Assembly and Annotation
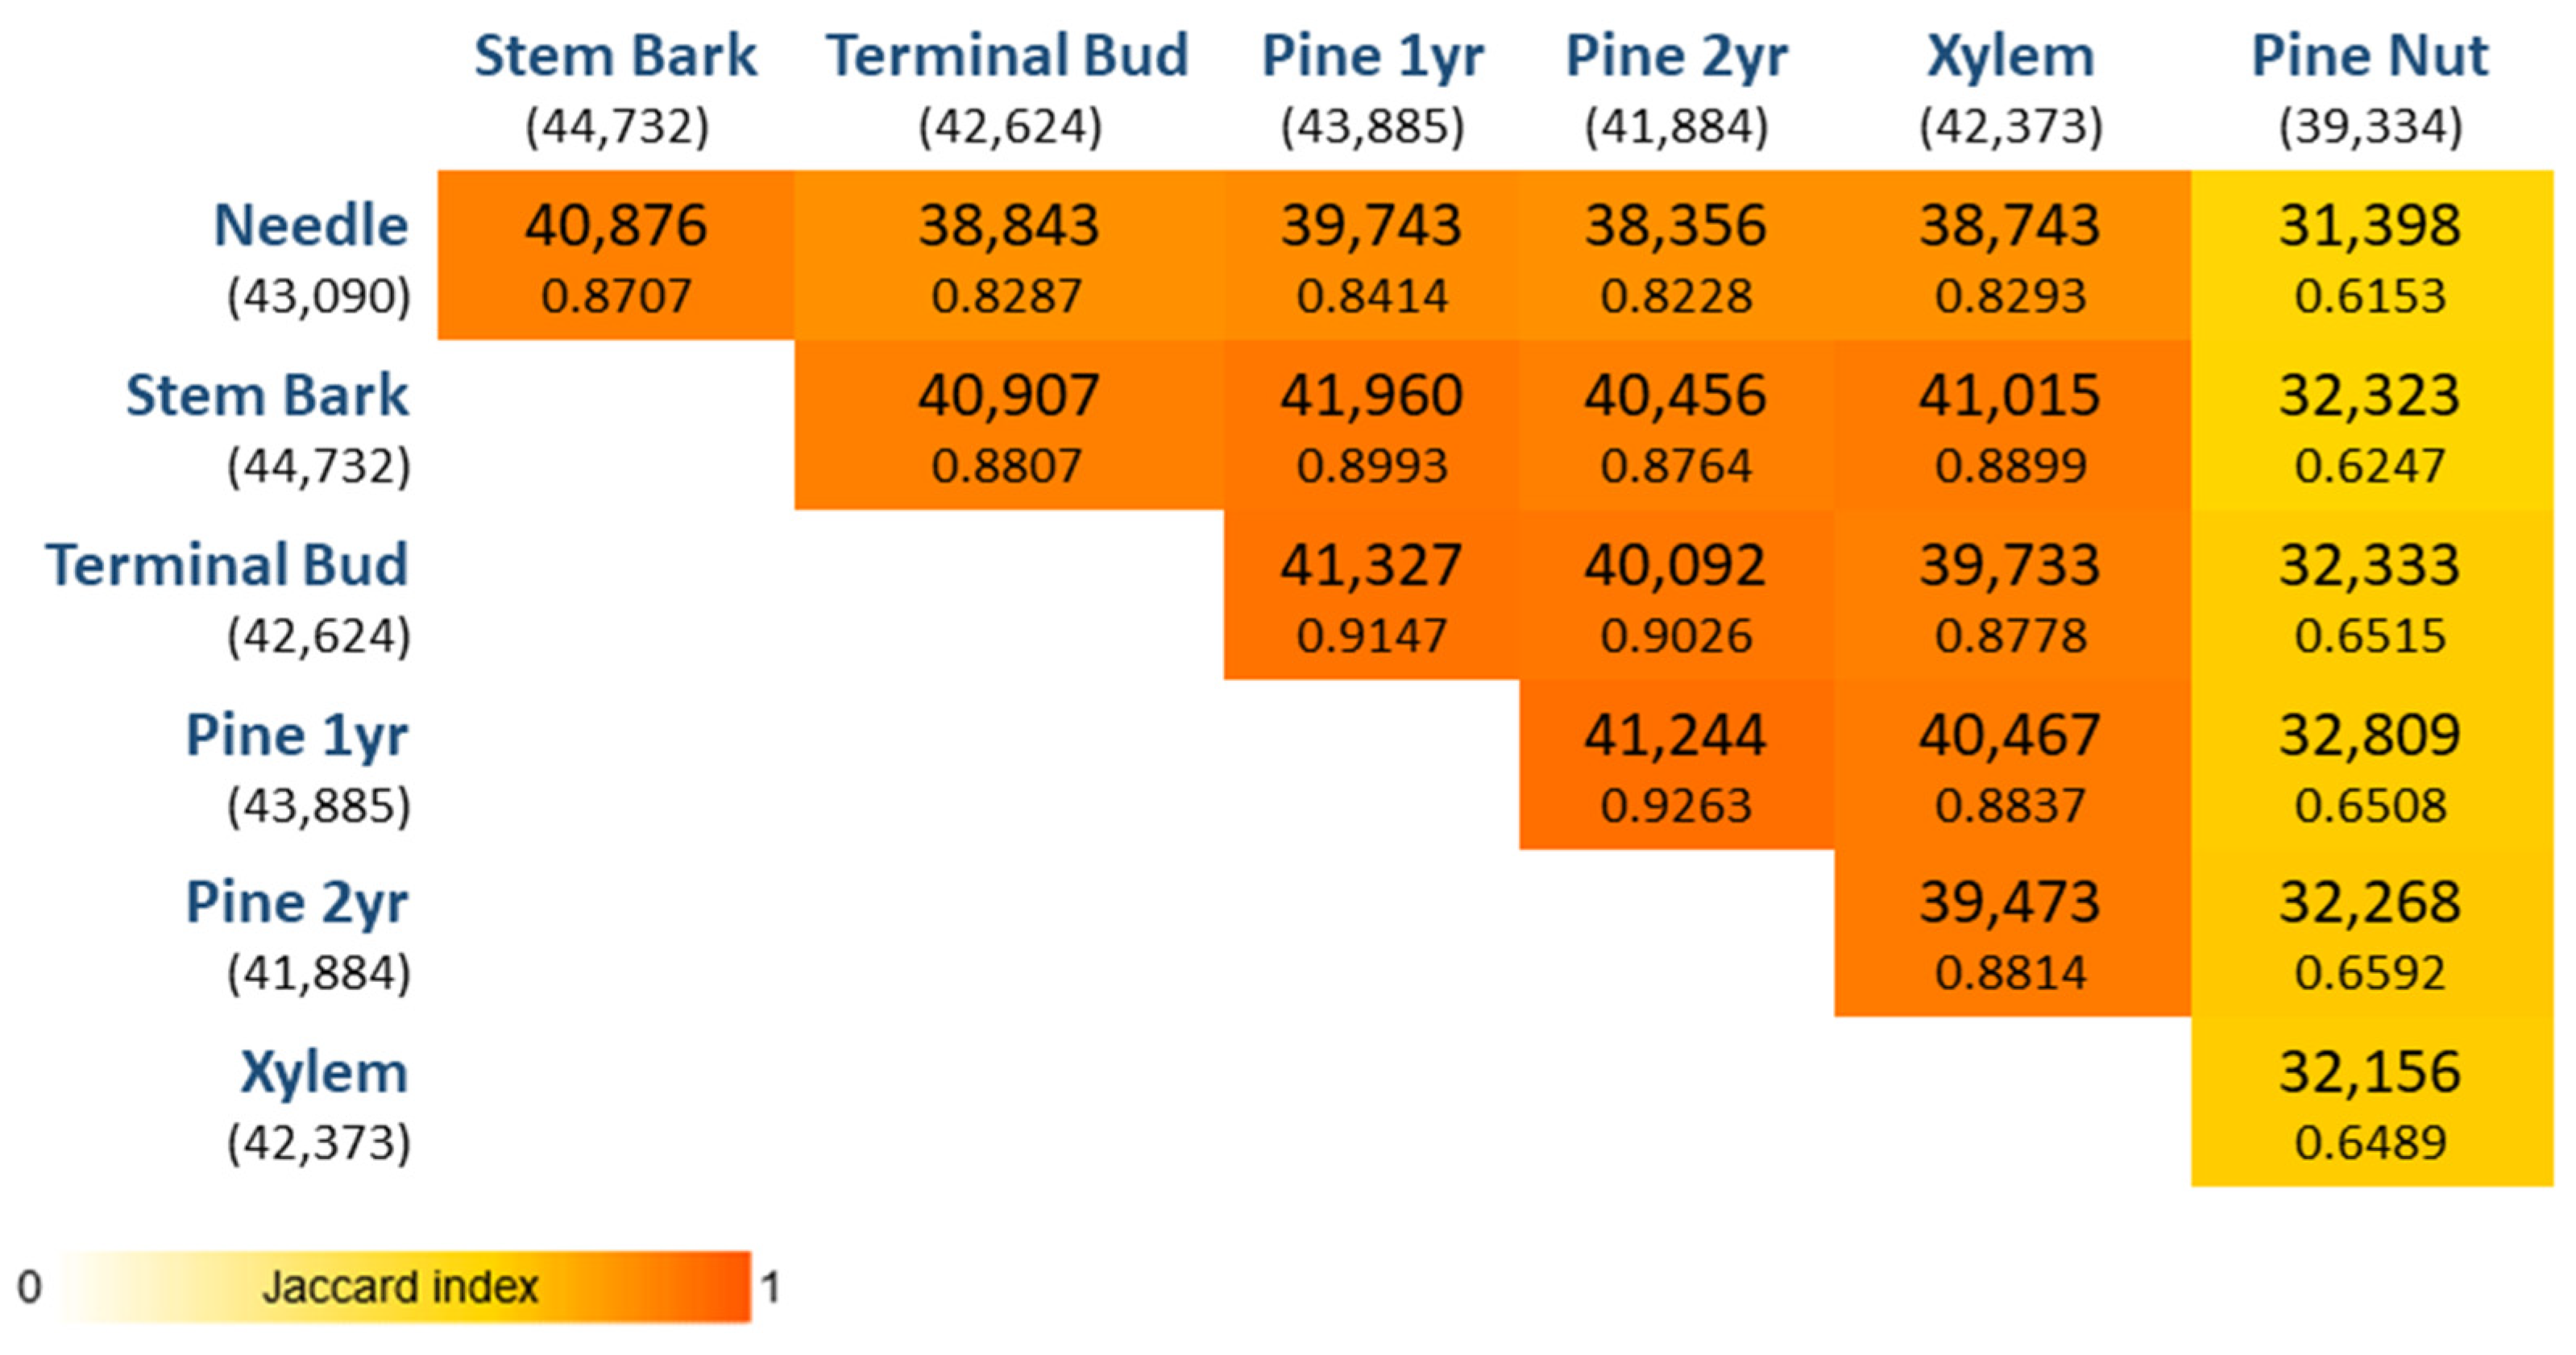
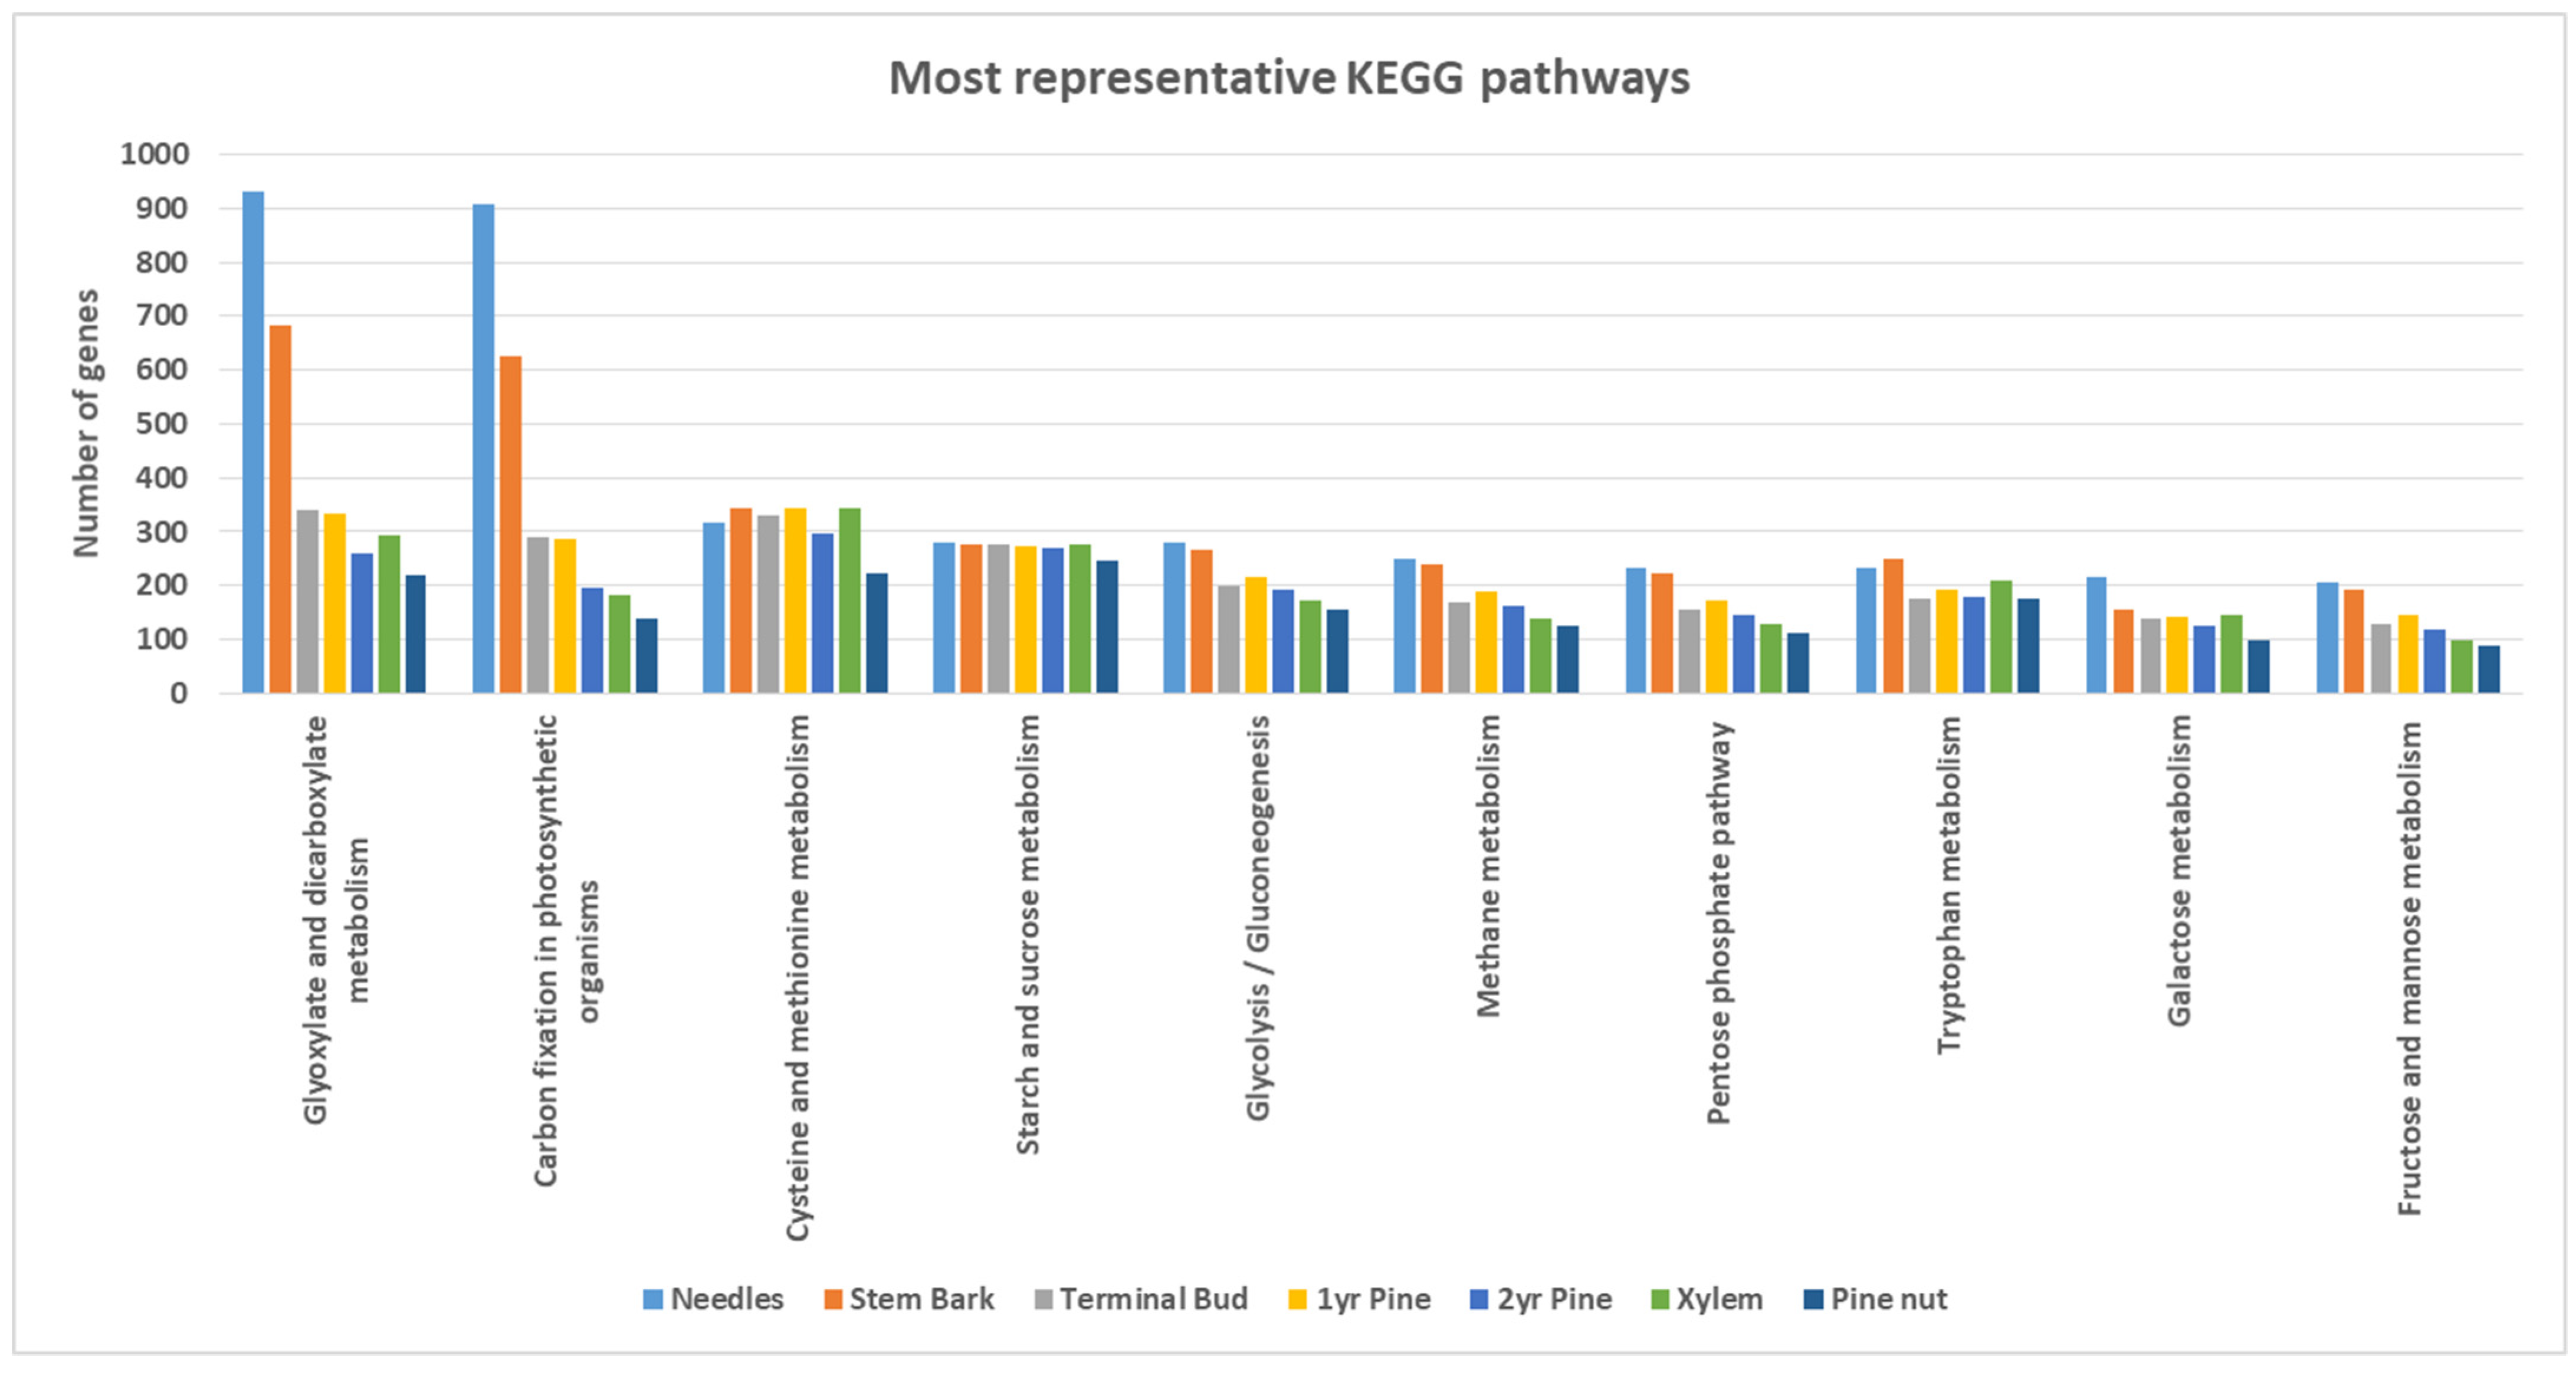
3.2. Tissue-Specific Characterization
4. Conclusions
Author Contributions
Funding
Institutional Review Board Statement
Informed Consent Statement
Data Availability Statement
Conflicts of Interest
References
- Quézel, P.; Médail, F. Ecologie et Biogéographie des Forêts du Bassin Méditerranéen; Elsevier: Amsterdam, The Netherlands, 2003; p. 574. ISBN 2-84299-451-5. [Google Scholar]
- Nergiz, C.; Dönmez, I. Chemical composition and nutritive value of Pinus pinea L. seeds. Food Chem. 2004, 86, 365–368. [Google Scholar] [CrossRef]
- Bolling, B.W.; Chen, C.Y.; McKay, D.L.; Blumberg, J.B. Tree nut phytochemicals: Composition, antioxidant capacity, bioactivity, impact factors. A systematic review of almonds, Brazils, cashews, hazelnuts, macadamias, pecans, pine nuts, pistachios and walnuts. Nutr. Res. Rev. 2011, 24, 244–275. [Google Scholar] [CrossRef] [PubMed] [Green Version]
- Evaristo, I.; Batista, D.; Correia, I.; Correia, P.; Costa, R. Chemical profiling of Portuguese Pinus pinea L. nuts. J. Sci. Food Agric. 2010, 90, 1041–1049. [Google Scholar] [CrossRef] [PubMed]
- ICNF. 2019. Available online: http://www2.icnf.pt/portal/florestas/ifn/resource/doc/ifn/ifn6/IFN6_Relatorio_completo-2019-11-28.pdf (accessed on 28 August 2021).
- Grotkopp, E.; Marcel, R.; Sanderson, M.J.; Rost, T.L. Evolution of genome size in pines (Pinus) and its life-history correlates: Supertree analyses. Evolution 2004, 58, 1705–1729. [Google Scholar] [CrossRef]
- Zimin, A.V.; Stevens , K.A.; Crepeau, M.W.; Puiu, D.; Wegrzyn, J.L.; Yorke, J.A.; Langley, C.H.; Neale, D.B.; Salzberg, S.L. An improved assembly of the loblolly pine mega-genome using long-read single-molecule sequencing. Gigascience 2017, 6, 1–4. [Google Scholar] [CrossRef] [PubMed]
- Le Provost, G.; Herrera, R.; Paiva, J.A.P.; Chaumeil, P.; Salin, F.; Plomion, C. A micromethod for high throughput RNA extraction in forest trees. Biol. Res. 2007, 40, 291–297. [Google Scholar] [CrossRef] [PubMed] [Green Version]
- Bolger, A.M.; Lohse, M.; Usadel, B. Trimmomatic: A flexible trimmer for Illumina sequence data. Bioinformatics 2014, 30, 2114–2120. [Google Scholar] [CrossRef] [PubMed] [Green Version]
- Chevreux, B.; Suhai, S. Genome Sequence Assembly Using Trace Signals and Additional Sequence Information. Ger. Conf. Bioinform. 1999, 99, 45–56. [Google Scholar]
- Haas, B.; Papanicolaou, A.J.G.S. TransDecoder (Find Coding Regions within Transcripts) Version 5.5.0. Available online: http://transdecoder.github.io (accessed on 28 August 2021).
- Camacho, C.; Coulouris, G.; Avagyan, V.; Ma, N.; Papadopoulos, J.; Bealer, K.; Madden, T.L. BLAST+: Architecture and applications. BMC Bioinform. 2009, 10, 421. [Google Scholar] [CrossRef] [PubMed] [Green Version]
- Boeckmann, B.; Bairoch, A.; Apweiler, R.; Blatter, M.C.; Estreicher, A.; Gasteiger, E.; Martin, M.J.; Michoud, K.; O’Donovan, C.; Phan, I.; et al. The SWISS-PROT protein knowledgebase and its supplement TrEMBL in 2003. Nucleic Acids Res. 2003, 31, 365–370. [Google Scholar] [CrossRef]
- Wheeler, D.L.; Barrett, T.; Benson, D.A.; Bryant, S.H.; Canese, K.; Chetvernin, V.; Church, D.M.; DiCuccio, M.; Edgar, R.; Federhen, S.; et al. Database resources of the National Center for Biotechnology Information. Nucleic Acids Res. 2018, 46, D8–D13. [Google Scholar] [CrossRef] [Green Version]
- Jones, P.; Binns, D.; Chang, H.Y.; Fraser, M.; Li, W.; McAnulla, C.; McWilliam, H.; Maslen, J.; Mitchell, A.; Nuka, G.; et al. InterProScan 5: Genome-scale protein function classification. Bioinformatics 2014, 30, 1236–1240. [Google Scholar] [CrossRef] [PubMed] [Green Version]
- Dobin, A.; Davis, C.A.; Schlesinger, F.; Drenkow, J.; Zaleski, C.; Jha, S.; Batut, P.; Chaisson, M.; Gingeras, T.R. STAR: Ultrafast universal RNA-seq aligner. Bioinformatics 2013, 29, 15–21. [Google Scholar] [CrossRef]
- Pertea, M.; Pertea, G.M.; Antonescu, C.M.; Chang, T.C.; Mendell, J.T.; Salzberg, S.L. StringTie enables improved reconstruction of a transcriptome from RNA-seq reads. Nat. Biotechnol. 2015, 33, 290–295. [Google Scholar] [CrossRef] [Green Version]
- Maere, S.; Heymans, K.; Kuiper, M. BiNGO: A Cytoscape plugin to assess overrepresentation of Gene Ontology categories in Biological Networks. Bioinformatics 2005, 21, 3448–3449. [Google Scholar] [CrossRef] [PubMed] [Green Version]


| Tissue | Nº Samples | Nº Raw Reads | Nº Reads after QC | % Reads after QC |
|---|---|---|---|---|
| BGI- Illumina Platform HiSeq 4000 | ||||
| Needle | 5 | 146,326,868 | 138,159,558 | 94.4 |
| Xylem | 5 | 138,531,098 | 133,130,580 | 96.1 |
| Stem bark | 5 | 143,731,678 | 135,937,996 | 94.6 |
| Terminal bud | 5 | 135,949,880 | 130,136,482 | 95.7 |
| 1st year pine cone | 5 | 135,310,934 | 125,938,522 | 93.1 |
| 2nd year pine cone | 5 | 69,963,354 | 65,575,696 | 93.7 |
| Pine nut | 5 | 144,025,338 | 135,919,536 | 94.4 |
| Total | 35 | 913,839,150 | 864,798,370 | 94.6 |
| BIOCANT-Illumina Platform NextSeq 550 | ||||
| Needle | 2 | 131,986,590 | 121,104,596 | 91.8 |
| Xylem | 3 | 157,461,310 | 149,028,612 | 94.6 |
| Stem bark | 4 | 160,306,566 | 140,699,320 | 87.8 |
| Terminal bud | 2 | 150,995,220 | 141,263,030 | 93.6 |
| 1st year pine cone | 3 | 203,695,358 | 190,859,772 | 93.7 |
| 2nd year pine cone | 3 | 154,578,072 | 145,230,246 | 94,0 |
| Pine nut | 3 | 153,854,114 | 145,392,336 | 94.5 |
| Total | 20 | 1,112,877,230 | 1,033,577,912 | 92.9 |
| Metric | Value |
|---|---|
| Total number of contigs | 165,179 |
| Nº of contigs ≥ 200 bp | 165,179 |
| Nº of contigs ≥ 500 bp | 45,648 |
| Nº of contigs ≥ 1000 bp | 13,912 |
| Nº of contigs ≥ 2000 bp | 4043 |
| Nº of contigs ≥ 4000 bp | 467 |
| Nº of contigs ≥ 6000 bp | 58 |
| Nº of contigs ≥ 8000 bp | 13 |
| Total length of contigs | 813,10,033 bp |
| Largest contig | 11,938 bp |
| GC% | 45.32 |
| N50 | 567 |
| Tissue | BP | MF | CC | Total |
|---|---|---|---|---|
| Needles | 73 | 31 | 10 | 114 |
| Stem bark | 2 | 2 | 0 | 4 |
| Terminal bud | 7 | 3 | 1 | 11 |
| First year pine cone | 0 | 3 | 0 | 3 |
| Second year pine cone | 2 | 3 | 0 | 5 |
| Pine nut | 181 | 14 | 36 | 231 |
| Xylem | 30 | 6 | 5 | 41 |
| TOTAL | 295 | 62 | 52 | 409 |
Publisher’s Note: MDPI stays neutral with regard to jurisdictional claims in published maps and institutional affiliations. |
© 2022 by the authors. Licensee MDPI, Basel, Switzerland. This article is an open access article distributed under the terms and conditions of the Creative Commons Attribution (CC BY) license (https://creativecommons.org/licenses/by/4.0/).
Share and Cite
Usié, A.; Mendes, B.; Antunes, M.; Leão, C.; Marum, L.; Ramos, A.M. Transcriptome Characterization of Different Tissues of Stone Pine (Pinus pinea L.): De Novo Assembly. Biol. Life Sci. Forum 2022, 11, 77. https://doi.org/10.3390/IECPS2021-11937
Usié A, Mendes B, Antunes M, Leão C, Marum L, Ramos AM. Transcriptome Characterization of Different Tissues of Stone Pine (Pinus pinea L.): De Novo Assembly. Biology and Life Sciences Forum. 2022; 11(1):77. https://doi.org/10.3390/IECPS2021-11937
Chicago/Turabian StyleUsié, Ana, Bruna Mendes, Marta Antunes, Célia Leão, Liliana Marum, and António Marcos Ramos. 2022. "Transcriptome Characterization of Different Tissues of Stone Pine (Pinus pinea L.): De Novo Assembly" Biology and Life Sciences Forum 11, no. 1: 77. https://doi.org/10.3390/IECPS2021-11937
APA StyleUsié, A., Mendes, B., Antunes, M., Leão, C., Marum, L., & Ramos, A. M. (2022). Transcriptome Characterization of Different Tissues of Stone Pine (Pinus pinea L.): De Novo Assembly. Biology and Life Sciences Forum, 11(1), 77. https://doi.org/10.3390/IECPS2021-11937