1. Introduction
GPS and GIS techniques, i.e., the global positioning system and geographical information system, are widely utilized to delineate fertility maps of macro- and micronutrients. In agriculture, the global positioning system is utilized for land surveys, dams’ and canals’ construction, animal behavior research, and marine creature research. It is also used to obtain digital road maps in vehicles when GPS and GIS are integrated. Soil samples collected with GPS data can help in making critical decisions on nutrients management. The fertilizer required needs to be established to calculate the exact amount of straight fertilizer rather than a ready-mixed, complex, compound fertilizer. Fertilizer used can be better optimized by utilizing knowledge of fertility maps prepared with the help of GPS-GIS techniques. Money spent on fertilizers can be modified to the amount actually needed to supply nutrients in soil for cropping systems. Fertilizer use can be customized to the area and quantities needed in various parts of fields for better nutrient management. The collection of soil samples by using GPS is very important for the preparation of thematic soil fertility maps [
1]. This device assists in determining the location’s latitude and longitude. It is extremely important in agriculture for future soil nutrient monitoring in various locations/villages. It also helps to determine elevation, road map, nearest city/town, and speed of movement.
Nandurbar district is located between 21.228° N and 74.1422° E North Latitude and East Longitude. The geographical area of the district is 5035 km
2. Its annual rainfall is 769 mm. The maximum and minimum temperature of this district is 43.3 °C and 11.9 °C, respectively. Nandurbar district comprises six tahsils; out of these, Shahada is considered for this study. The global positioning system (GPS) is a space-based navigation and positioning system managed by the United States military that aids in determining an object’s exact position on the Earth’s surface in terms of geographical coordinates [
2]. The geographical information system (GIS) is a computer system for capturing, storing, querying, and displaying geographical data [
3]. It is feasible to alter data about an area’s fertility status once soil fertility maps have been developed. These maps give site-specific recommendations and assessments for future soil fertility [
4]. The adoption of high-yielding varieties and intensive cropping together with a shift towards the use of high NPK fertilizers has caused a decline in the level of micronutrients in soil below the normal level at which the productivity of crops cannot be sustained. The deficiency of micronutrients has become a major constraint for the productivity and sustainability of soil [
5]. The main crops grown in Shahada tahsil are cotton, sugarcane, banana, wheat, and papaya.
2. Materials and Methods
Shahada is located between 21.54296910° N and 74.44691462° E. It is one of the 6 tahsils in the Nandurbar district; it is a town in the northwest corner (Khandesh situated 30 km away in the north-east direction of Nandurbar district). It is spread between the banks of Tapi and Gomai River. The town has been famous for its grain market, co-operative dairy farming, sugar industry, cotton spinning industry, etc. There are 172 villages and four Revenue Circles.
Shahada had a population of 61,376 people as per the 2011 India census, with 52 percent being men and 48 being percent women. Shahada has an average literacy rate of 86.62%, higher than the national average of 74.04%: male literacy is 90.67%, and female literacy is 82.40%. A total of 12.95 percent of the inhabitants of Shahada is under the age of six. The languages/dialects spoken in Shahada town and Nandurbar districts are many local, tribal languages such as Bhilu, Ladshi, Dogari, Bayadi, etc., and other languages are Marathi, Ahirani, and Gujarati.
The Shahada tahsil in Nandurbar district was chosen for the project to create thematic soil fertility maps using GPS and GIS. Latitude (Lat.) and Longitude (Long.) were recorded using a GPS instrument from soil sampling areas in Shahada. The soils were collected at a depth of 0–22.5 cm from farmers’ fields. The number of samples collected from Shahada tahsil was588.
Soil samples were obtained from Shahada tahsil in Nandurbar district, completely mixed, air dried in the shade, pulverized with a wooden mortar and pestle, and put through a two-millimeter sieve for examination. For further analysis, the sieved soil samples were stored in cotton bags with suitable labeling. While processing the soil samples in the laboratory, all measures were taken. The analysis of soil samples was carried out by using standard methods, i.e., pH (1:2.5), EC (1:2.5), and organic carbon (percentage).
3. Results
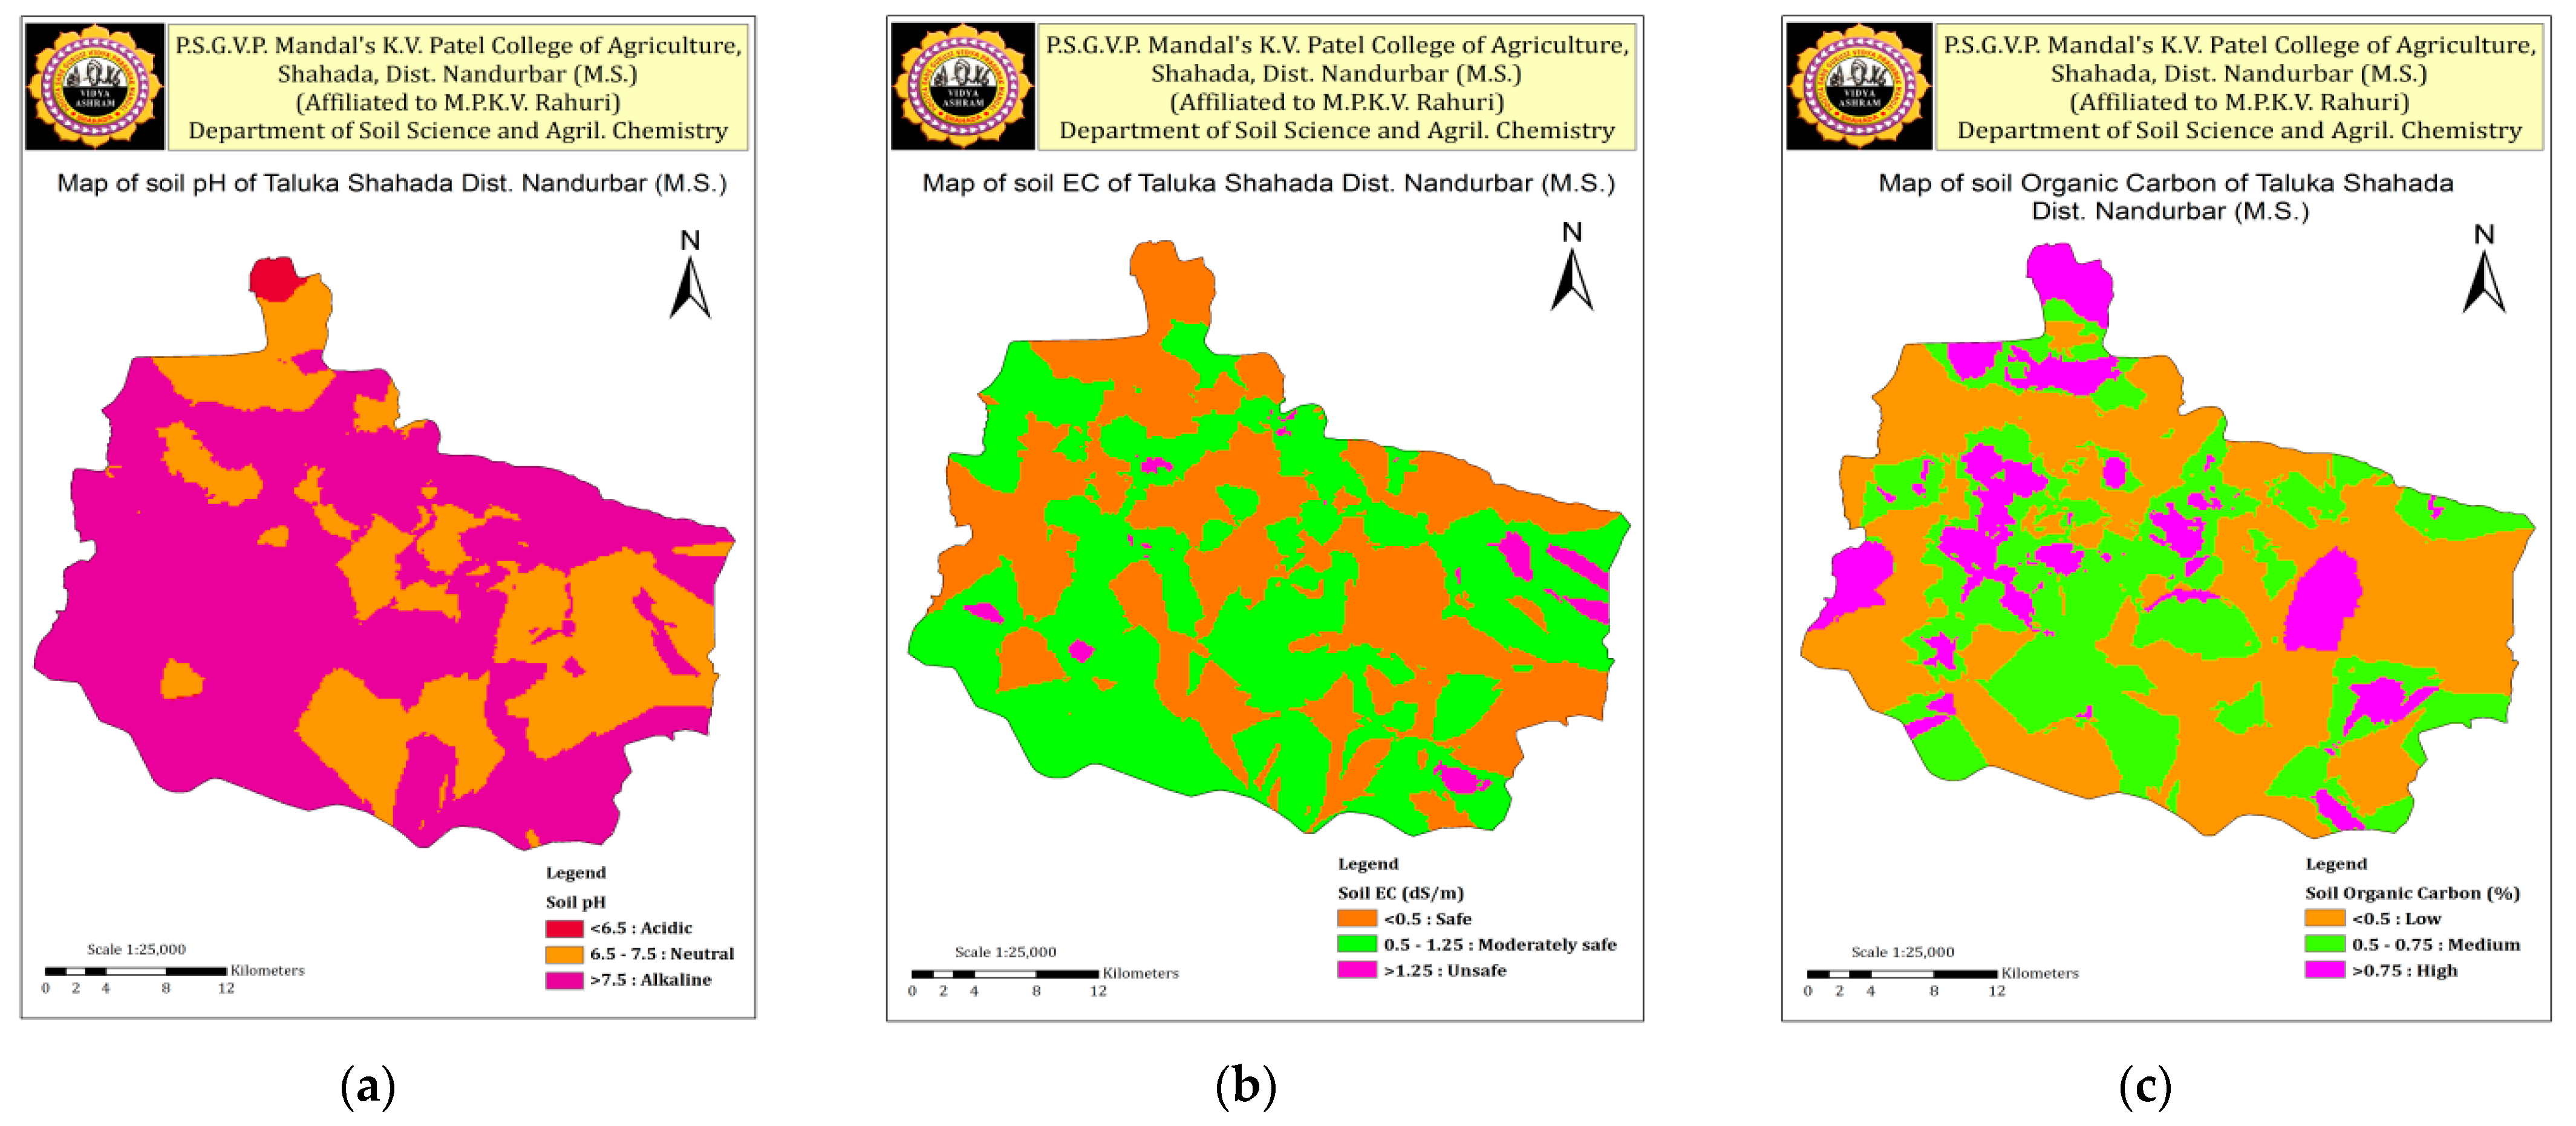
The GPS-GIS-based soil fertility maps of Shahada tahsil inNandurbar district (M.S.) wereprepared by using Arc-4 software. The cultivated soils of Shahada tahsil were saline to alkaline in reaction. Soils of Shahada tahsil were moderately saline according to their electrical conductivity. The EC of soils inShahada tahsil was found to be in arange between 0.06 to 2.90 dSm
−1 with an average value of 0.60 dSm
−1. The organic carbon content in soil of Shahada was in the range of 0.01 to 2.40 g kg
−1. The average value of organic carbon in Shahada areas was 0.57 g kg
−1. The results of range and average values of soil chemical properties are mentioned in
Table 1. The Thematic maps of soil fertility are shown in
Figure 1. The
Table 2 indicates number of samples and percent distribution of soil chemical properties.
4. Discussion
The alkaline condition of mostsoil samples might have beendue to intensive sugarcane cultivation, in whichexcessively cultivated soils were irrigated with flood irrigation, and organic material to improve the physical condition of soil was used the least. The soil’s alkalinity inShahada tahsil was observed because of the accumulation of salts due to high temperatures and use of high analysis fertilizers. The cultivated soils of Shahada tahsil are medium deep to deep black soil, so drainage is restricted, which also leads to higher pH.
5. Conclusions
It was observed from the maps that the major portion of the study area in Shahada area wasalkaline in nature, moderately safe withrespect to EC, and low in organic carbon. This approach is proposed as a method for the evaluation of sustainable soil management. These fertility maps could be used to predict the potentials and constraints of land for specific crop production. The soil test values werefurther utilized to prescribe fertilizer recommendations for optimum crop production in order to maintain the soil fertility, productivity, sustainability, and better crop quality in the studied area. Thesedata and fertility maps will help in planning and maintaining the fertility, productivity, and quality of growing crops viz., banana, papaya, sugarcane, onion, cotton, chili, etc., in the soils of Shahada tahsil.
Author Contributions
Conceptualization, B.C. and V.N.P.; methodology, B.C.; software, V.N.P.; validation, J.P.; formal analysis, V.N.P.; investigation, B.C.; resources, V.N.P.; writing—original draft preparation, B.C.; writing—review and editing, J.P. and B.C.; visualization, B.C.; supervision, V.N.P.; project administration, V.N.P. All authors have read and agreed to the published version of the manuscript.
Funding
This research received no external funding.
Institutional Review Board Statement
Not applicable.
Informed Consent Statement
Not applicable.
Acknowledgments
We would like to convey our thanks to the President, Coordinator and Principal, K.V.Patel, from the College of Agriculture, Shahada, Dist- Nandurbar, for providing all the necessary facilities to carry out the research.
Conflicts of Interest
The authors declare no conflict of interest.
References
- Sharma, P.K. Emerging technology of remote sensing and GIS for the development of spatial data infrastructure. J. Indian Soc. Soil Sci. 2004, 52, 384–406. [Google Scholar]
- French, G.T. Understanding the GPS; Geo Research Publishers: Bethesda, MD, USA, 1996; p. 255. [Google Scholar]
- Chang, K. Introduction to Geographic Information System; Tata Mc-Graw Hill Publishing Co.: New Delhi, India, 2002; p. 348. [Google Scholar]
- Sood Anil Sctia, R.K.; Bansal, R.L.; Sharma, P.K.; Nayyar, V.K. Spatial Distribution of Micro Nutrients in Soils of Amritsar District Using Frontier Technology; Gurunanak dev University: Amritsar, India, 2004; p. Aiv-4. [Google Scholar]
- Yadav, R.L.; Meena, M.C. Available micronutrient status and their relationship with soil properties of Degana soil series of Rajsthan. J. Indian Soc. Soil Sci. 2009, 57, 90–92. [Google Scholar]
| Publisher’s Note: MDPI stays neutral with regard to jurisdictional claims in published maps and institutional affiliations. |
© 2022 by the authors. Licensee MDPI, Basel, Switzerland. This article is an open access article distributed under the terms and conditions of the Creative Commons Attribution (CC BY) license (https://creativecommons.org/licenses/by/4.0/).


