1. Introduction
Pigments or colorants are the most attractive additives that consumers can perceive when buying their food; even if the color is changed the consumer could perceive another flavor. In 2017, natural pigments comprised 31% of the market, 40% were synthetic and 29% semi-synthetic. Due to their potentially undesirable mutagenicity and carcinogenicity the number of synthetic dyes allowed will continue to decrease over time, which is why currently new sources of production such as plants, animals and microorganisms are sought; among them presenting greater advantages are the pigments that come from microorganisms, since optimal conditions can be given for their production [
1,
2].
Monascus purpureus is a fungus used thousands of years ago as a food additive in Asian cultures [
3]. This fungus, in the process of solid state fermentation, produces several secondary metabolites of interest such as pigments, which are a mixture of different metabolites classified as polyketides, where the best known are: Monascine and Ankaflavine (yellow pigments); Rubropunctatin and Monascorubrin (orange pigments); and Rubropunctamine and Monascorubramine (red pigments) [
4].
Fish hydrolysate is considered a rich source of amino acids, since the hydrolysis process decreases the size of the peptides making these amino acids more available [
5]. In addition, this substrate is a source of nitrogen, important for the growth and metabolism of
Monascus and essential for amino acid biosynthesis through the ammonia pathway and other pathways that are linked to pigment production [
6].
On the other hand, it has been shown that environmental factors affect the response of the fungus to produce a greater or lesser amount of pigment, which is why including sodium chloride in the fermentation would generate salt stress, and the fungus would produce a greater amount of pigment, although this concentration of salts must be low otherwise it could be detrimental to the microorganism [
7].
Therefore, the objectives of this study were to optimize the hydroethanol extraction conditions for the pigments of the fermented product supplemented with fish hydrolysate and sodium chlorite, in order to maximize the yield, using a response surface design, and to construct a linear equation by spectrophotometry to predict the concentration of the hydroethanol extracts.
2. Materials and Methods
2.1. Microbial Strain and Culture Conditions
The filamentous fungus Monascus purpureus CECT 2955, from the Spanish Type Culture Collection (CECT), was used in this study. The strain was resuspended and seeded in PDA (Potato Dextrose Agar) in a Petri dish at 30 °C for 7 days, then seeded in QFH (Quinoa Flour Agar) adjusted to pH 6, and incubated at 30 °C for 7 days. The spore suspension was made by adding 10 mL of 0.01% Tween-80; hyphae and spores were removed, then filtered and vortexed for 5 min, and the spores were counted in a Neubauer chamber and adjusted to 1.0 × 10⁶ spores/mL.
2.2. Solid-State Fermentation of Quinoa
Solid-state fermentation was carried out in 250 cc flasks containing quinoa grains (30 g), NaCl 0.05% (w/w), fish hydrolysate 1% (w/w) and distilled water (25 mL) with the pH adjusted to 6, and then sterilized at 121 °C for 15 min. Subsequently, 1 mL of inoculum (1.0 × 10⁶ spores/mL) was added to the flasks previously cooled to room temperature, and each flask was capped with sterile absorbent cotton and then kept in an incubator (ILW, Pol Eko, Poland) at 30 °C for up to 8 days. After the time had elapsed, the substrate was dried at 65 °C for ~24 h and milled in a mill (CS-1000, Shang-Jun, Beijing, China) to obtain the pigmented quinoa flour.
2.3. Pigment Extraction
In centrifuge tubes (round base) 1 g of fermented quinoa flour supplemented with fish hydrolysate and sodium chloride was mixed with ethanol at 40, 50 and 60% (v/v), maintaining an ethanol: sample ratio of 30:1, 40:1 and 50:1 mL/g, respectively, and then agitated at 400 rpm for 180 min at 50, 55 and 60 °C, respectively. After the time had elapsed, it was centrifuged at 10,000 rpm for 20 min, and the supernatant was recovered for later analysis.
2.4. Spectrophotometric Analyses of Ethanol Extracts
The ethanol extracts of the pigments were measured with a UV-Vis spectrophotometer (C-7100, Peak Instruments Inc., Houston, TX, USA) at 400 (yellow), 470 (orange) and 500 (red) nm. A 1 mL of sample was taken and diluted with ethanol, where the ratio was 1:6 (v:v); as a blank for quantification, ethanol was used.
2.5. Yield
The ethanol extract was taken to an oven (J.P. SELECTA, Barcelona, Spain) and dried at 65 °C to a constant weight for approximately 48 h, then the extraction yield was calculated from Equation (1), being 1 g dry weight of sample:
where, MS1 represents the dry weight of the ethanolic extract of the pigments (g), MS2 is the dry weight of quinoa flour pigmented by
M. purpureus (g).
2.6. Experimental Design Using a Box–Behnken Design with RSM
The design used in the experiment was the Box–Behnken design, having three independent variables, ethanol graduation, extraction temperature and ethanol: sample ratio, and applying 14 treatments in the design with three repetitions, to generate a second-order polynomial quadratic model on the response surface. The statistical analysis was conducted in the R software (version 4.1.0, R Foundation for Statistical Computing, Vienna, Austria).
3. Results and Discussions
To obtain a higher yield in pigment extraction, the Box–Behnken design with a response surface was used, having as the variables, the ethanol: sample ratio, ethanol graduation and the extraction temperature, with a total of 14 experimental trials in triplicate, where the extraction variables affected the yield, density and absorbance in the pigment extraction (
Table 1).
Table 2 shows the results of the final response surface analysis model, where the second-order polynomial model presented an adjusted regression coefficient (R
2 = 0.721), i.e., 72.89% of the variability could be explained by the independent variables as a whole. In addition, the linear terms for the extraction temperature, ethanol strength, ethanol: sample and ethanol: sample ratio, and the quadratic terms for the ethanol strength, extraction temperature, ethanol: sample ratio and ethanol × ethanol: sample interaction were highly significant predictors (
p < 0.0001) of the pigment extraction yield of fermented quinoa flour. The other terms were not significant and were therefore removed from the model.
The negative interaction term for ethanol × ethanol: sample may raise issues related to the polarity of the ethanol gradient, as it implies that at the same ethanol: sample ratio, a higher ethanol grade results in lower extraction yields.
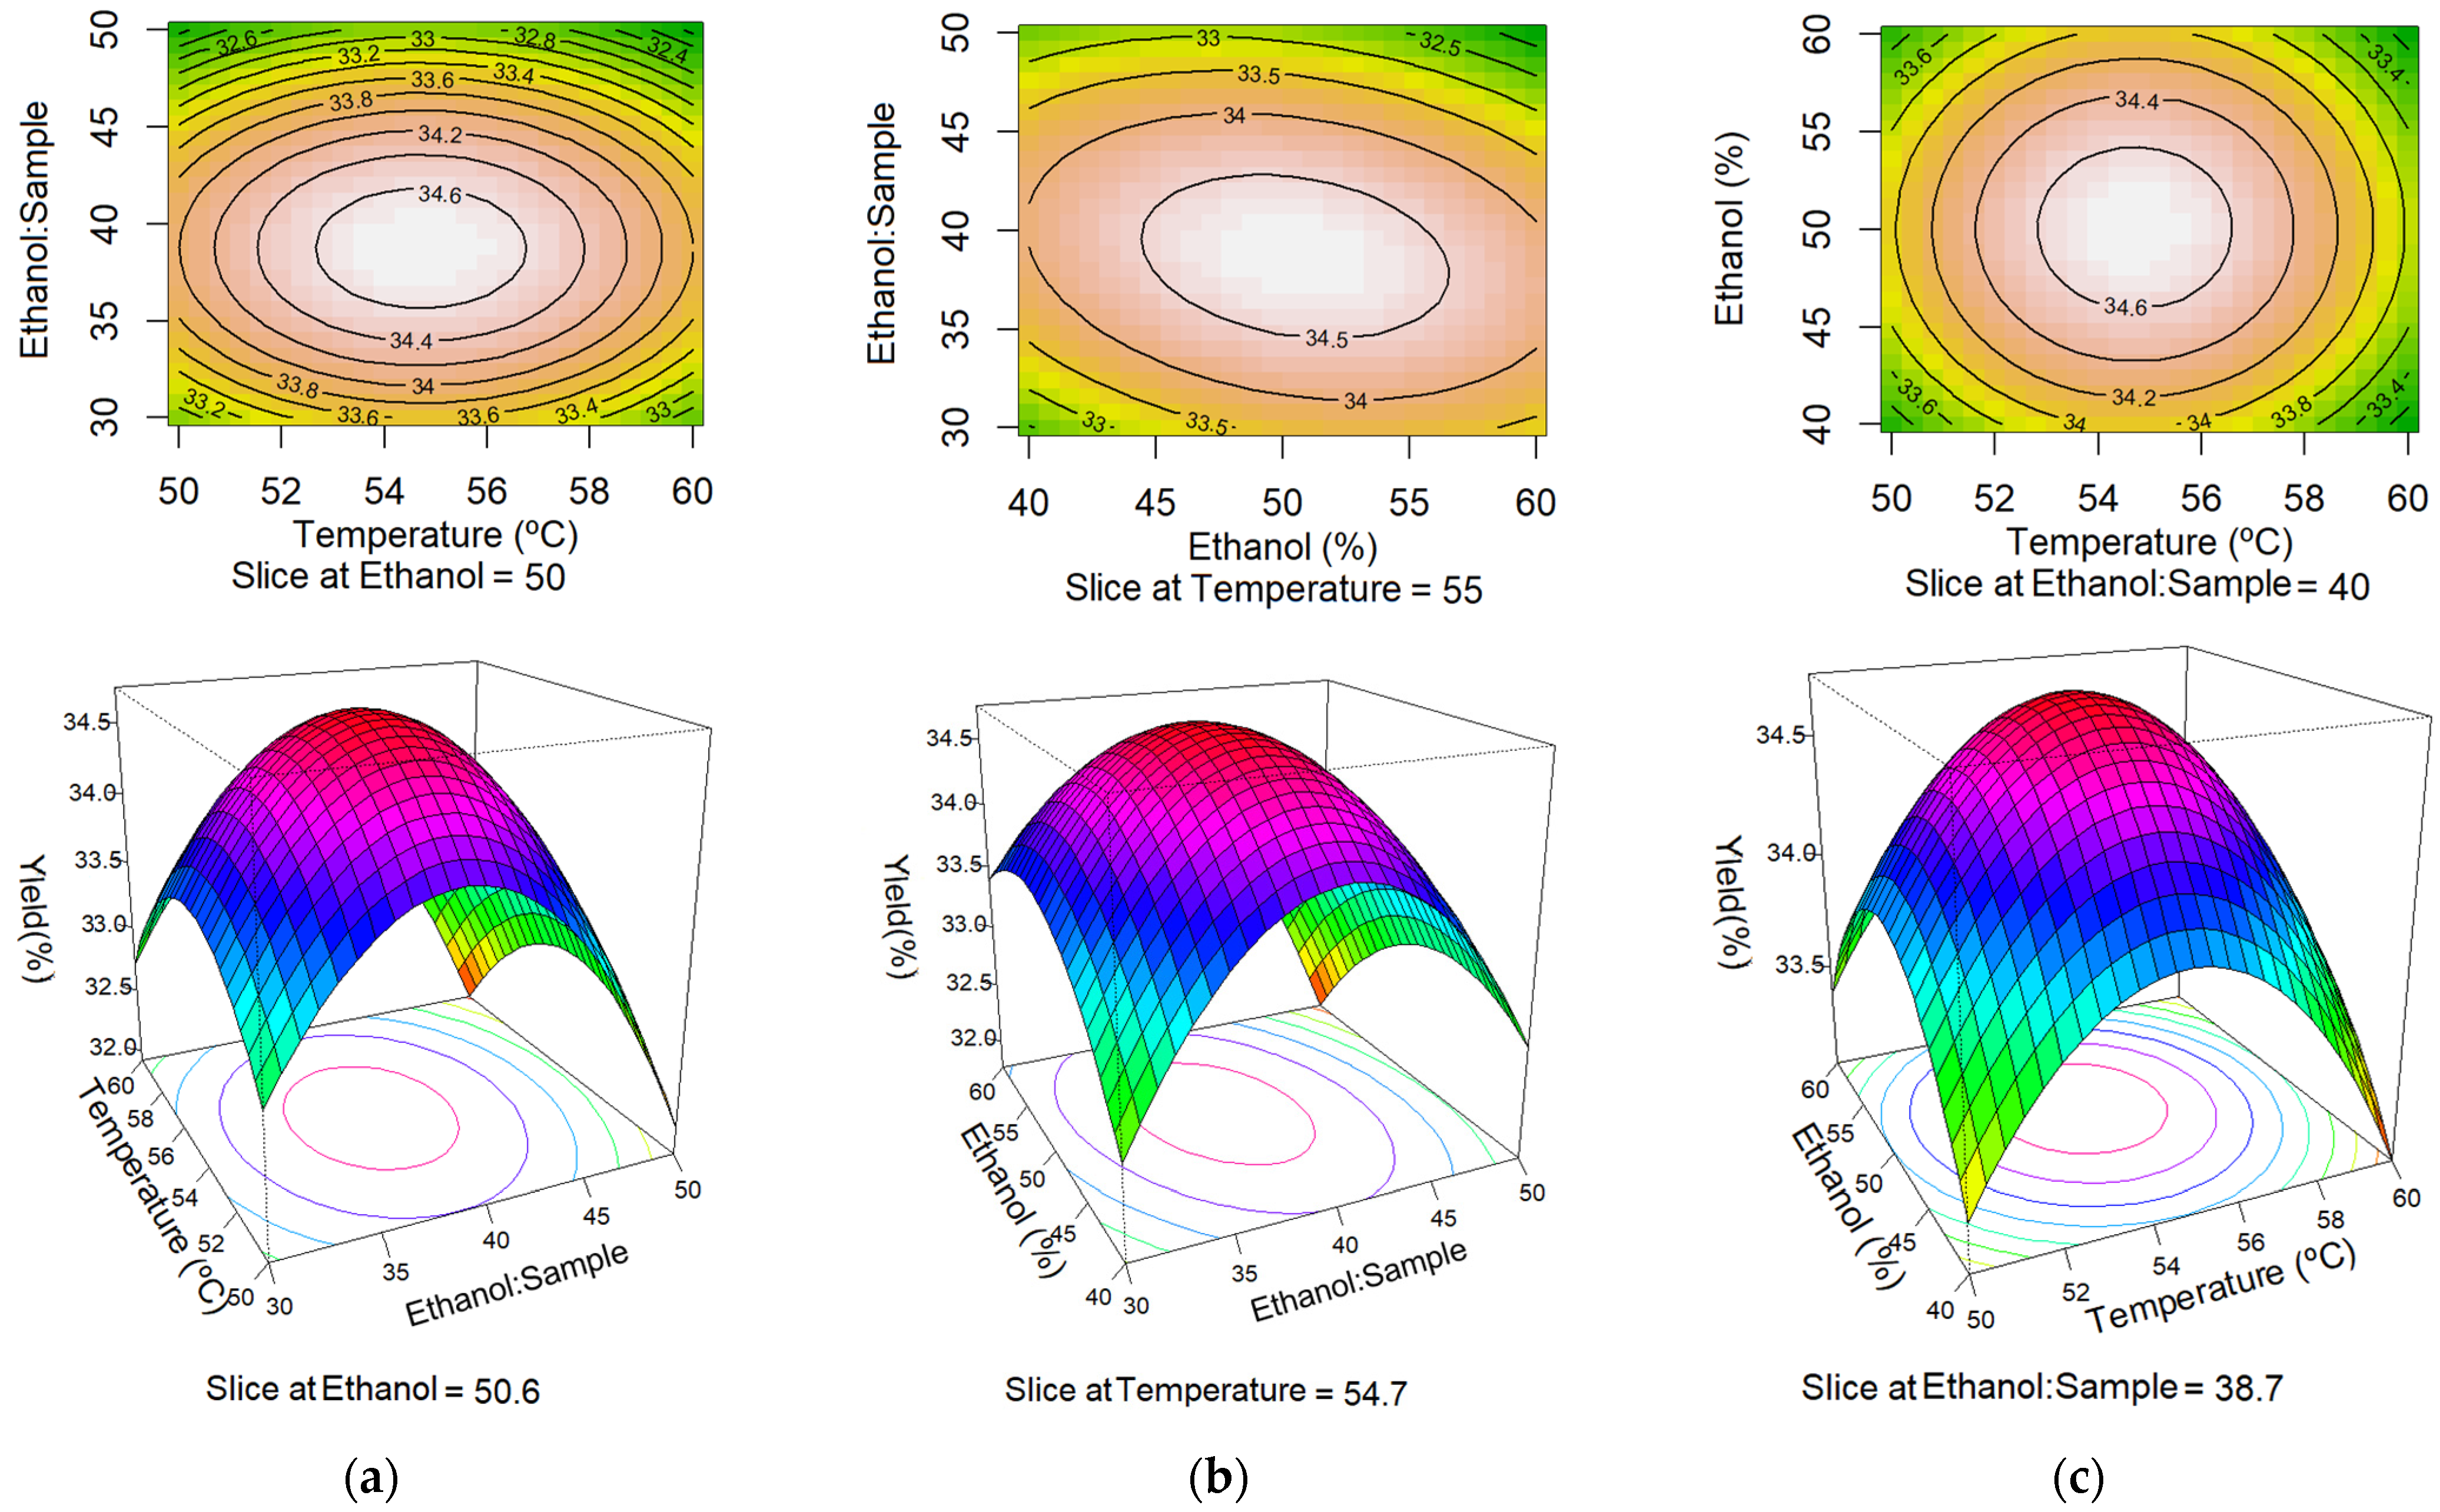
Figure 1a shows the contour plot with a central point of 50% ethanol, where it is observed that the highest extraction yield is found in the central zone of the temperature and the ethanol: sample ratio; the surface plot shows a maximum yield with a central point of 50.6% ethanol.
Figure 1b shows the contour plot with a central temperature point of 55 °C, where it is observed that the highest extraction yield is found in the central zone of the ethanol:sample ratio and the ethanol grade; the surface plot shows a maximum yield with a central point of a 54.7 °C temperature.
Figure 1c shows the contour plot with a central point of the ethanol:sample ratio at 40, where it is observed that the highest extraction yield is found in the central zone of the ethanol grade ratio and the temperature; the surface plot shows a maximum yield with a central point of 38.7 °C for the ethanol: sample ratio. It was also possible to obtain the highest extraction yield in %, which was 34.72 ± 0.18 with the optimum points of: ethanol degree of 50.6°, an extraction temperature of 54.7 °C and an ethanol: sample ratio of 38.7, taking into account the data of the second-order polynomial equation.
In addition, the concentration of the extract in solution can be predicted with a linear equation of the sum of the absorbances at 400, 470 and 500 nm at a 1:6 dilution; where a high coefficient of determination (R
2 = 0.974) was obtained from the data in
Table 3, the equation will allow for rapid concentration estimations in the calculations after extraction, providing that the extract is diluted 1:6 with ethanol at the same gradient (%).
4. Conclusions
This study helped to determine the optimal conditions for hydroethanol extraction of pigments from fermented quinoa flour by M. purpureus supplemented with fish hydrolysate and sodium chloride. In contrast to other investigations of hydroethanolic extractions, a low ethanol gradient of 50.6% at 50.6 °C was found to maximize yield. This implies that pigment extraction from fermented quinoa flour may be economically feasible. A very useful equation was derived for future rapid estimates of extract concentrations.
Author Contributions
Conceptualization, V.C., M.S.-J. and U.G.-B.; methodology, F.T.-H., E.Q.-R., V.C. and U.G.-B.; software, F.T.-H., V.C. and U.G.-B.; validation, V.C. and U.G.-B.; formal analysis, F.T.-H., V.C. and U.G.-B.; investigation, F.T.-H. and E.Q.-R.; resources, M.S.-J., U.G.-B. and V.C.; data curation, F.T.-H., U.G.-B. and V.C.; writing—original draft preparation, F.T.-H. and V.C.; writing—review and editing, V.C. and U.G.-B.; visualization, F.T.-H., E.Q.-R., V.C. and U.G.-B.; supervision, M.S.-J., V.C. and U.G.-B.; project administration, M.S.-J., V.C. and U.G.-B.; funding acquisition, M.S.-J., V.C. and U.G.-B. All authors have read and agreed to the published version of the manuscript.
Funding
This research was funded by CONCYTEC-PROCIENCIA under the Basic Research Project 2019-01 [contract 383-2019-FONDECYT].
Institutional Review Board Statement
Not applicable.
Informed Consent Statement
Not applicable.
Data Availability Statement
Summary data available upon request.
Acknowledgments
The authors gratefully acknowledge the financial support obtained from CONCYTEC-PROCIENCIA under the Basic Research Project 2019-01 [contract 383-2019-FONDECYT]. We would also like to thank the Laboratorio de Microbiología de Alimentos UNALM, Laboratorio de Biotecnología Ambiental-Biorremediación UNALM and FCT for their financial support through national funds FCT/MCTES (PIDDAC) to CIMO (UIDB/00690/2020 and UIDP/00690/2020) and SusTEC (LA/P/0007/2021). Gonzales-Barron acknowledges the national funding by FCT, P.I., through the Institutional Scientific Employment Programme contract.
Conflicts of Interest
The authors declare no conflict of interest.
References
- Lv, J.; Zhang, B.B.; Liu, X.D.; Zhang, C.; Chen, L.; Xu, G.R.; Cheung, P.C. Enhanced production of natural yellow pigments from Monascus purpureus by liquid culture: The relationship between fermentation conditions and mycelial morphology. J. Biosci. Bioeng. 2017, 124, 452–458. [Google Scholar] [CrossRef] [PubMed]
- Srianta, I.; Zubaidah, E.; Estiasih, T.; Yamada, M. Comparison of Monascus purpureus growth, pigment production and composition on different cereal substrates with solid state fermentation. Biocatal. Agric. Biotechnol. 2016, 7, 181–186. [Google Scholar] [CrossRef]
- Hong, J.L.; Wu, L.; Lu, J.Q.; Zhou, W.B.; Cao, Y.J.; Lv, W.L.; Liu, B.; Rao, P.F.; Li, N.; Lv, X.C. Comparative transcriptomic analysis reveals the regulatory effects of inorganic nitrogen on the biosynthesis of Monascus pigments and citrinin. RSC Adv. 2020, 10, 5268–5282. [Google Scholar] [CrossRef]
- Chalamaiah, M.; Hemalatha, R.; Jyothirmayi, T. Fish protein hydrolysates: Proximate composition, amino acid composition, antioxidant activities and applications: A review. Food Chem. 2012, 135, 3020–3038. [Google Scholar] [CrossRef]
- Dikshit, R.; Tallapragada, P. Comparative study of Monascus sanguineus and Monascus purpureus for red pigment production under stress condition. Int. Food Res. J. 2013, 20, 1235. [Google Scholar]
- Spence, C. Background colour & its impact on food perception & behaviour. Food Qual. Prefer. 2018, 68, 156–166. [Google Scholar] [CrossRef]
- Huang, Z.R.; Zhou, W.B.; Yang, X.L.; Tong, A.J.; Hong, J.L.; Guo, W.L.; Li, T.T.; Jia, R.B.; Pan, Y.Y.; Lin, J.; et al. The regulation mechanisms of soluble starch and glycerol for production of azaphilone pigments in Monascus purpureus FAFU618 as revealed by comparative proteomic and transcriptional analyses. Food Res. Int. 2018, 106, 626–635. [Google Scholar] [CrossRef] [PubMed]
| Disclaimer/Publisher’s Note: The statements, opinions and data contained in all publications are solely those of the individual author(s) and contributor(s) and not of MDPI and/or the editor(s). MDPI and/or the editor(s) disclaim responsibility for any injury to people or property resulting from any ideas, methods, instructions or products referred to in the content. |
© 2022 by the authors. Licensee MDPI, Basel, Switzerland. This article is an open access article distributed under the terms and conditions of the Creative Commons Attribution (CC BY) license (https://creativecommons.org/licenses/by/4.0/).


 ,
, 


