Proceeding Paper

The Effect of Carbon Black Content on Viscoelastic Properties of Vulcanized Natural Rubber †

Department of Aerospace Engineering, Indian Institute of Technology (IIT) Kanpur, Kanpur 208016, UP, India
*
Author to whom correspondence should be addressed.
Presented at the 19th International Conference on Experimental Mechanics, Kraków, Poland, 17–21 July 2022.
Phys. Sci. Forum 2022, 4(1), 9; https://doi.org/10.3390/psf2022004009
Published: 2 August 2022
(This article belongs to the Proceedings of The 19th International Conference on Experimental Mechanics)

Abstract

:
The effect of filler content on viscoelastic properties of carbon black filled vulcanized natural rubber is here studied. The filled natural rubber specimens are subjected to dynamic mechanical loading with the temperature varying from −80 °C to 100 °C. While the storage modulus of unfilled and filled rubber materials remains nearly the same in the glassy state, the glass transition temperature significantly increased in the case of latter. The data also indicate that the rubbery modulus of filled rubber increases with increasing carbon black content. The loss factor data suggest that the damping characteristics of filled rubber decrease with increasing carbon black content.

1. Introduction

Natural rubber (NR) reinforced with different grades of carbon black (CB) is extensively used in modern industries owing to its deformability and damping characteristics. The high abrasion furnace (HAF) CB, grade N330, is used for tyres, O rings and conveyor belts due to their excellent tear-resistance and energy absorption properties [1]. The mechanical properties of filled rubber have been of great interest for a long time due to its hyperelastic [2] and viscoelastic [3] nature. This viscoelastic behaviour is studied either by conducting creep and relaxation experiments [4] or by obtaining a steady-state response by subjecting the material to oscillatory loading. Often for the latter mode of study, a dynamic mechanical analyzer (DMA) [5] is used to assess the viscoelastic response of the rubbery materials. The DMA helps in the measurement of storage modulus and loss modulus. While storage modulus corresponds to the elastic behaviour of the material, loss modulus indicates the dissipation associated with the same. Temperature sweeps and isothermal frequency sweeps can be carried out in the DMA to analyze the variation of the properties of the vulcanizates. The rubbery storage modulus and the loss tangent (tan δ) have been used to investigate polymers’ polymeric crosslink properties and the damping characteristics, respectively [6].
Dynamic testing has been carried out on carbon black filled rubber compounds to assess their frequency-dependent behaviour. High-frequency viscoelasticity spectrometers using ultrasonic technology have been used to find the glass transition temperature range for such compounds [7]. Rheometers like rheospectolers have been used to analyze the dynamic properties of silica-reinforced butadiene rubber (BR) at a constant frequency [8]. The thermorheological behaviour of vulcanized NR across a temperature and frequency range has been documented with the help of temperature and frequency sweep experiments in DMA [9]. Furthermore, the effect of the variation of different filler constituents in rubber compounds, specifically on the rubbery modulus and the tan δ peak values, were analyzed [10] to find an inverse relationship between the two parameters. The effect of filler and fiber content in polymeric matrices on their dynamic properties has been studied recently, and their polymeric behaviour has been documented [11,12,13]. However, the effect of the presence and proportion of CB as a filler on the viscoelastic properties of vulcanized NR compared to the properties of an unfilled NR remains of interest. In this study, NR filled with CB at four different proportions was subjected to temperature sweep experiments in DMA at a single frequency in tensile loading. The materials’ response was recorded, and the effect of CB content on the variation of viscoelastic parameters, such as storage and loss moduli and glass transition temperature, was analyzed.

2. Materials and Method

2.1. Material Description

Filled and unfilled vulcanized NR sheets of an average thickness of 2 mm were obtained from Supreme Rubber Industries, Coimbatore, India. Four different vulcanizates were prepared by varying the proportion of HAF N330 grade CB in the materials. The constituents of the materials and their proportion (as provided by the suppliers) are given in Table 1.
While the proportion of all other constituents was kept constant, the CB content was varied from 0 PHR to 60 PHR at a step of 20 PHR. The associated vulcanized rubbers are referred to as VR00, VR20, VR40 and VR60, respectively. The uniformity of CB distribution is assessed by scanning the material through FESEM (field emission scanning electron microscope). A representative image of the cross-section of the VR60 sheet is illustrated in Figure 1. The relative dark greyish region indicates the presence of the NR matrix, whereas the bright white spots are the CB particles. The image confirms distribution uniformity without any agglomeration.

2.2. Experimental Procedure

A dynamic mechanical analyzer, Metravib DMA+ with 100 N load cell, was employed to conduct temperature sweep tests. The 40 mm × 10 mm rectangular strips are cut from the 2 mm thick NR sheets to prepare the test specimens. The gauge length of 30 mm was considered in the experiments. The specimens were loaded under tension at a constant frequency of 1 Hz. The specimens were subjected to a static displacement of 80 μm (0.27% strain) combined with an excitation sinusoidal displacement of amplitude 20 μm (0.07% strain). The specimens were first cooled from room temperature to −80 °C at a rate of −5 °C per minute, followed by a dwelling time of 15 min at −80 °C. Subsequently, the temperature was swept from −80 °C to 100 °C at 2 °C per minute rate. The storage modulus (E’), loss modulus (E”) and loss factor (tan δ) are recorded as a function of temperature. Two to three samples for each of the four different vulcanizates were subjected to the experiment, and repeatability was assessed and assured in the data.

3. Results and Discussion

3.1. Effect of Fillers on Storage Modulus

The variation of storage modulus (E’) with temperature for the test specimens is plotted in Figure 2a. The temperature varied from −80 °C to 100 °C, and the viscoelastic properties of vulcanizates were recorded. The plots show distinctly characteristic glassy, glass transition and rubbery states. The glass transition stage begins at about −65 °C for the unfilled NR, which delays to approximately −45 °C for all filled CB cases. While the proportion of CB in the vulcanizates does not affect the initiation of the glass transition process, its presence in the material significantly extends the glassy stage.
The region in the glassy state is expanded and illustrated in Figure 2b. The plots show that the storage modulus of the material marginally but consistently decreases with increasing CB content. The decrease in the storage modulus in the glassy state with increasing CB content is attributed to the dilution of the matrix in the filled rubber. A polymer is said to be diluted when there is a lack of interaction between the polymeric chains. It is speculated that at low temperatures, the polymeric chain network between the fillers and the matrix gets weaker and/or gets partially broken. The associated decrease in the load transfer capability, in turn, decreases the storage modulus of filled rubber. A similar observation was reported by Pothan et al. [11], who noted a higher storage modulus in the case of neat polyester compared to the case of filled one. The plots in Figure 2a have been expanded around the rubbery stage and are depicted in Figure 2c. The curves show that the rubbery modulus consistently increases as the CB proportion is increased in the rubber material. This is attributed to the filler driven enhancement in the stiffness of CB reinforced rubber. Following the rubbery plateau, the E’ begins to decrease again after ~20 °C, although the drop is only marginal (See, Figure 2a,c).
To obtain a better understanding of the influence of the filler–matrix interaction on the dynamic elastic properties of the filled rubber, the coefficient of reinforcement (C-factor) is plotted with the proportion of CB in the material in Figure 3. The C-factor indicates the effectiveness of fillers in enhancing the composite stiffness, with a lower C-factor value suggesting effective reinforcement and vice versa [12,13]. The C-factor is calculated by
C = (Eg’/Er’)FNR/(Eg’/Er’)UNR,
where Eg’ and Er’ are the storage moduli in the glassy state and in the rubbery state, respectively. The subscripts, FNR and UNR, indicate filled and unfilled NR, respectively. In this work, the glassy and rubbery moduli are considered at −80 °C and 25 °C, respectively. The plot shows the C-factor to be 1 in the case of unfilled rubber material. As the filler content is increased, the value of the C-factor (logarithmically) decreases, indicating a prominent effect of rigid fillers on the mechanical properties of the filled material.

3.2. Effect of Fillers on Loss Modulus

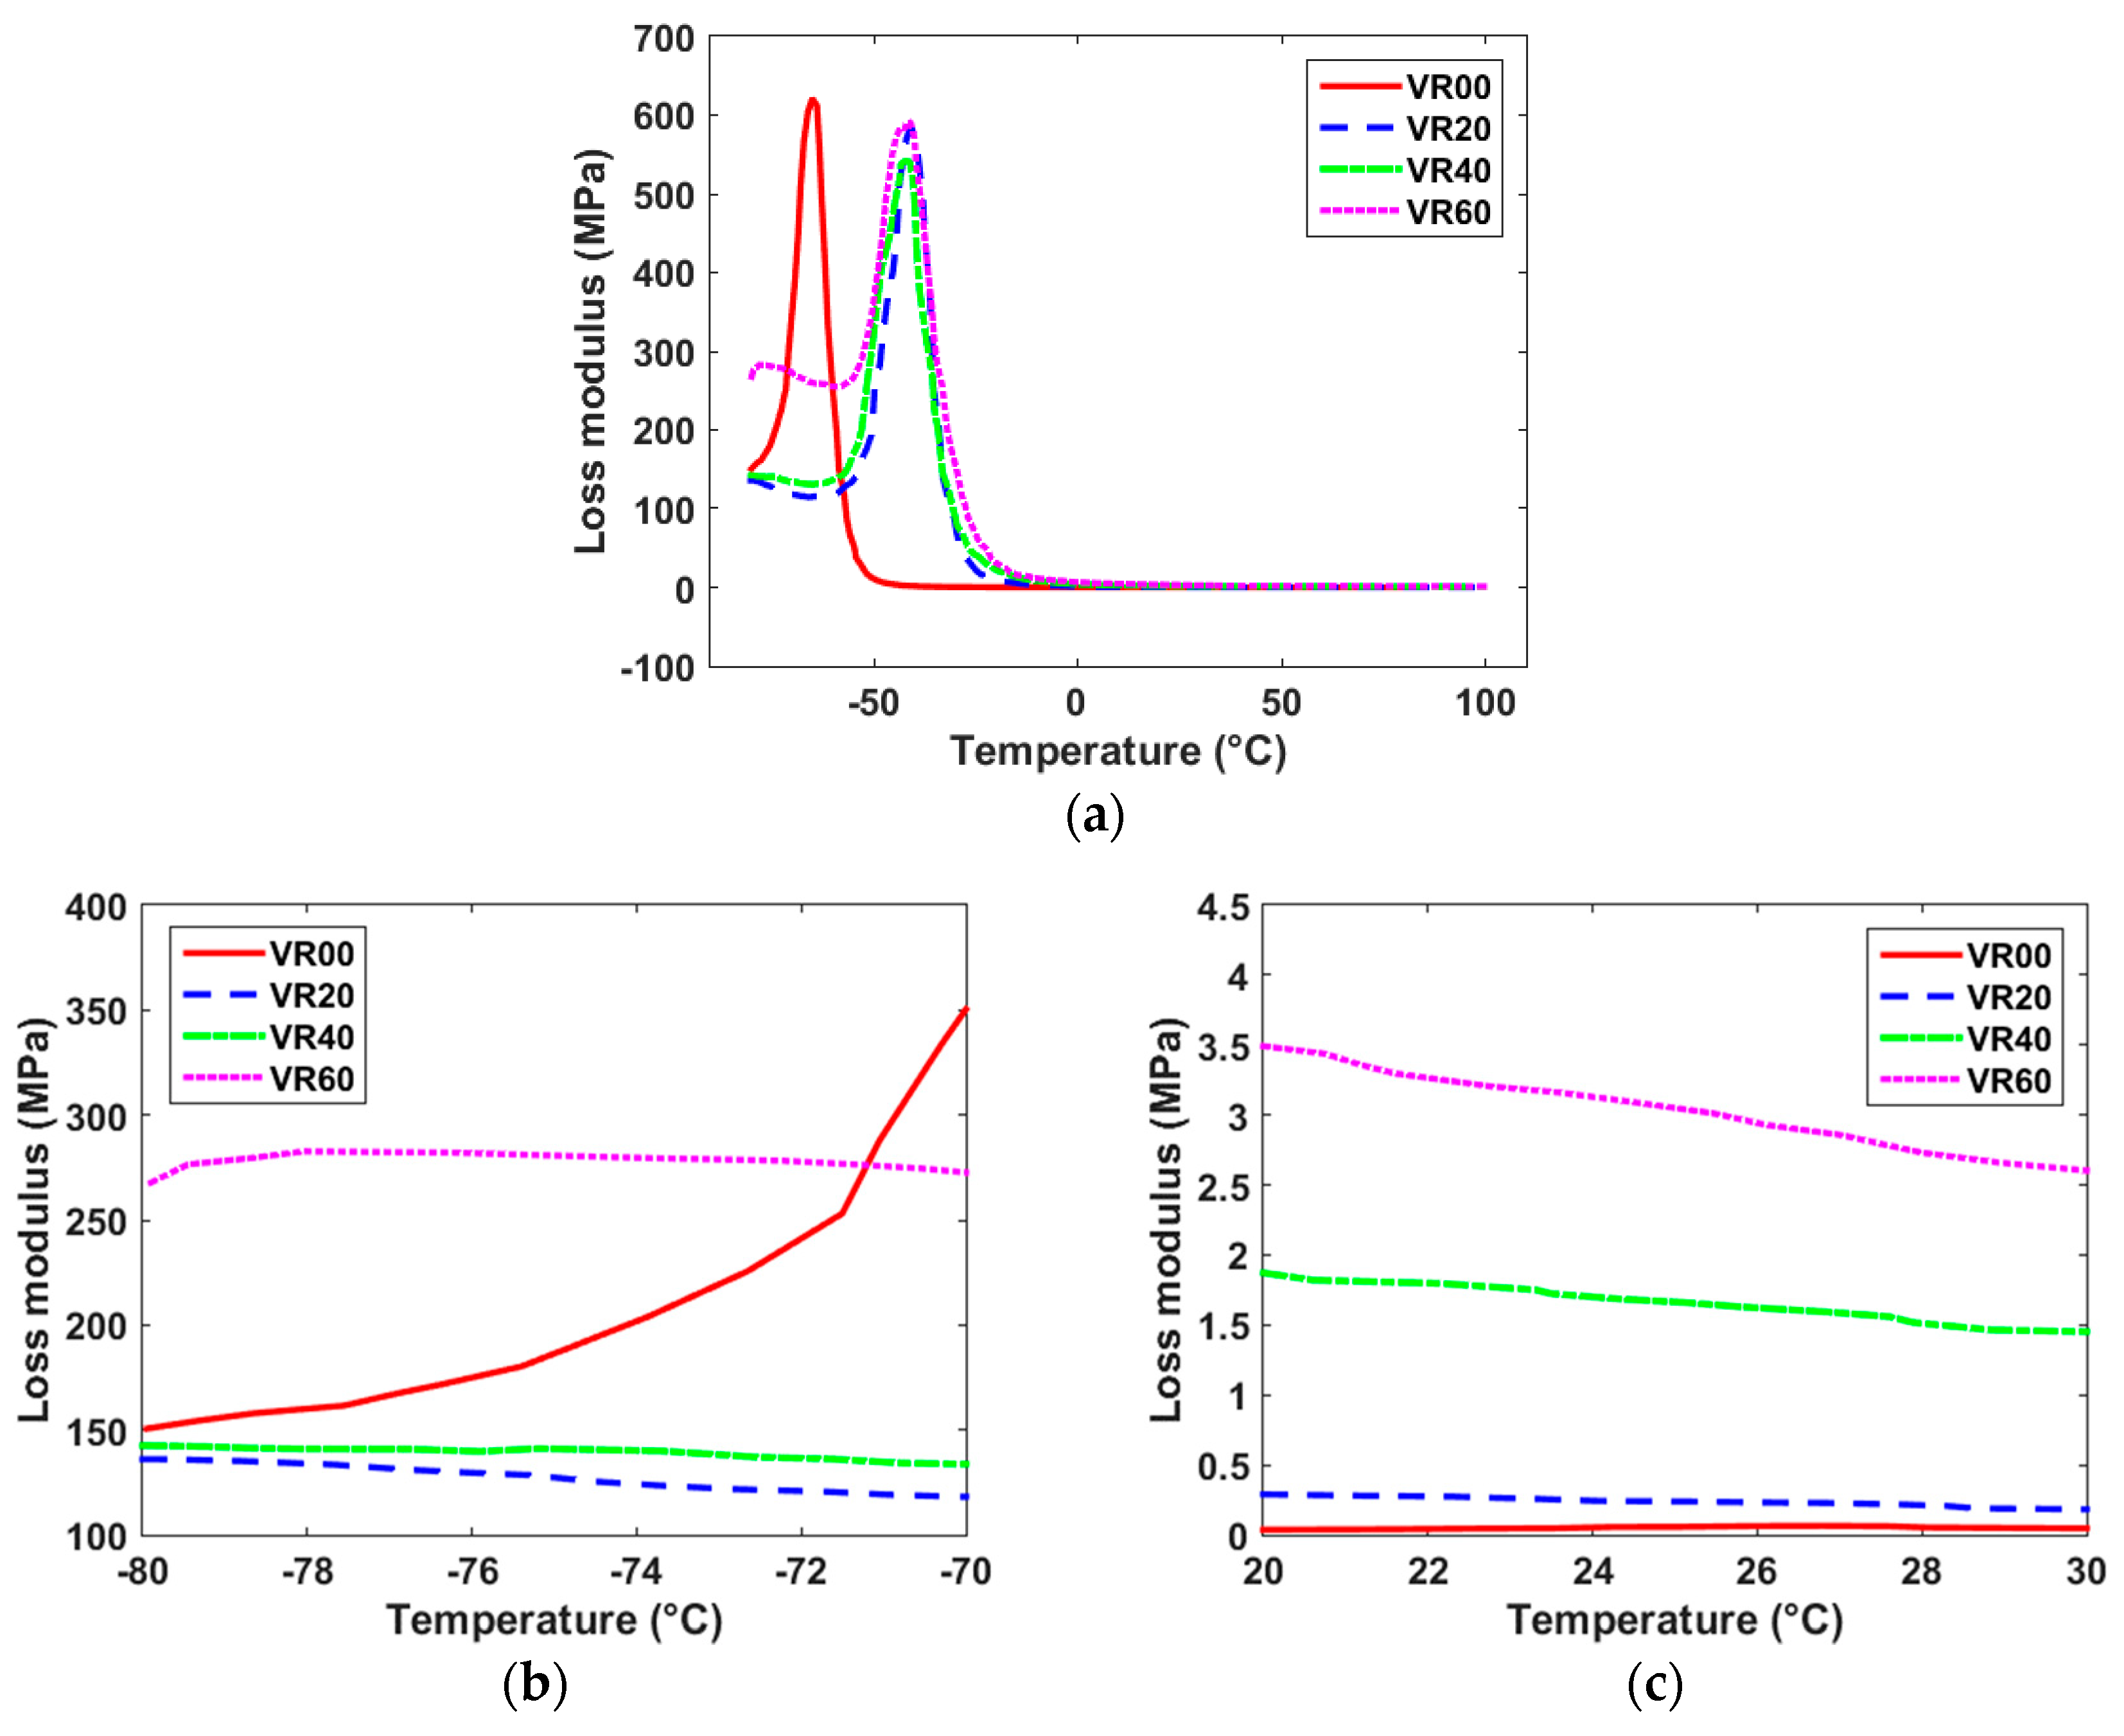
The loss modulus (E”) vs. temperature curves for the unfilled and filled NRs are shown in Figure 4a. The plots show bell-shaped curves for all cases with a peak value of about 600 MPa. This characteristic peak is observed in the glass transition region. The temperature associated with the E” peak is observed to be ~−65 °C and −45 °C for the unfilled and filled NRs, respectively. The E” peak temperature is considered the glass transition temperature. While the curves show a distinct shift in the case of filled material, the filler proportion itself neither influence the magnitude of E” peak nor the glass transition temperature. Nearly the same magnitude of the E” peak for both unfilled and filled rubber cases indicates that the NR material has retained its dissipative nature even after the reinforcement of CB fillers. In other words, the matrix effectively remains the only contributor to the energy dissipation mechanism, with no influence of CB fillers.
The trend of the E” at the temperature ranges of −80 °C to −70 °C and 20°C to 30 °C are shown in Figure 4b,c, respectively. While the initial E” values at −80 °C do not vary significantly for VR00, VR20 and VR40, the E” at −80 °C for VR60 shows a comparatively higher value. A more distinct trend of the loss modulus is observed in the vicinity of room temperature (between 20 °C and 30 °C), where E” increases with an increase in CB proportion. The increased dissipation with increasing filler content is attributed to the presence of an immobilized layer of polymer around the rigid fillers within a relatively softer matrix.

3.3. Effect of Fillers on Loss Factor

The variation of loss factor (tan δ) with temperature is shown in Figure 5a. The loss factor, defined as the ratio between the loss modulus and the storage modulus, indicates the relative dissipative nature of viscoelastic material compared to its elastic behaviour. The plot shows skewed bell-shaped curves. Similar to the E” case, the tan δ peak shifts towards higher temperature in the case of filled materials. The maximum tan δ is observed at ~−55 °C for the unfilled NR, whereas for the filled material case, tan δ peaks at around −35 °C. These tan δ peaks are noted after about 10 °C of attaining the E” peaks. The curves show that the magnitude of the tan δ peak decreases with increasing CB content in the material. This indicates a decrement in the damping characteristics of the vulcanizates upon the addition of the CB fillers. The relative rigidity of the HAF N330 CB fillers with respect to the softer NR matrix is attributed to the lower damping behaviour of filled materials. As shown in Figure 5b, the decrement is exponential, with VR00, VR20, VR40 and VR60 exhibiting the values of ~3.26, 1.67, 0.92 and 0.76, respectively.
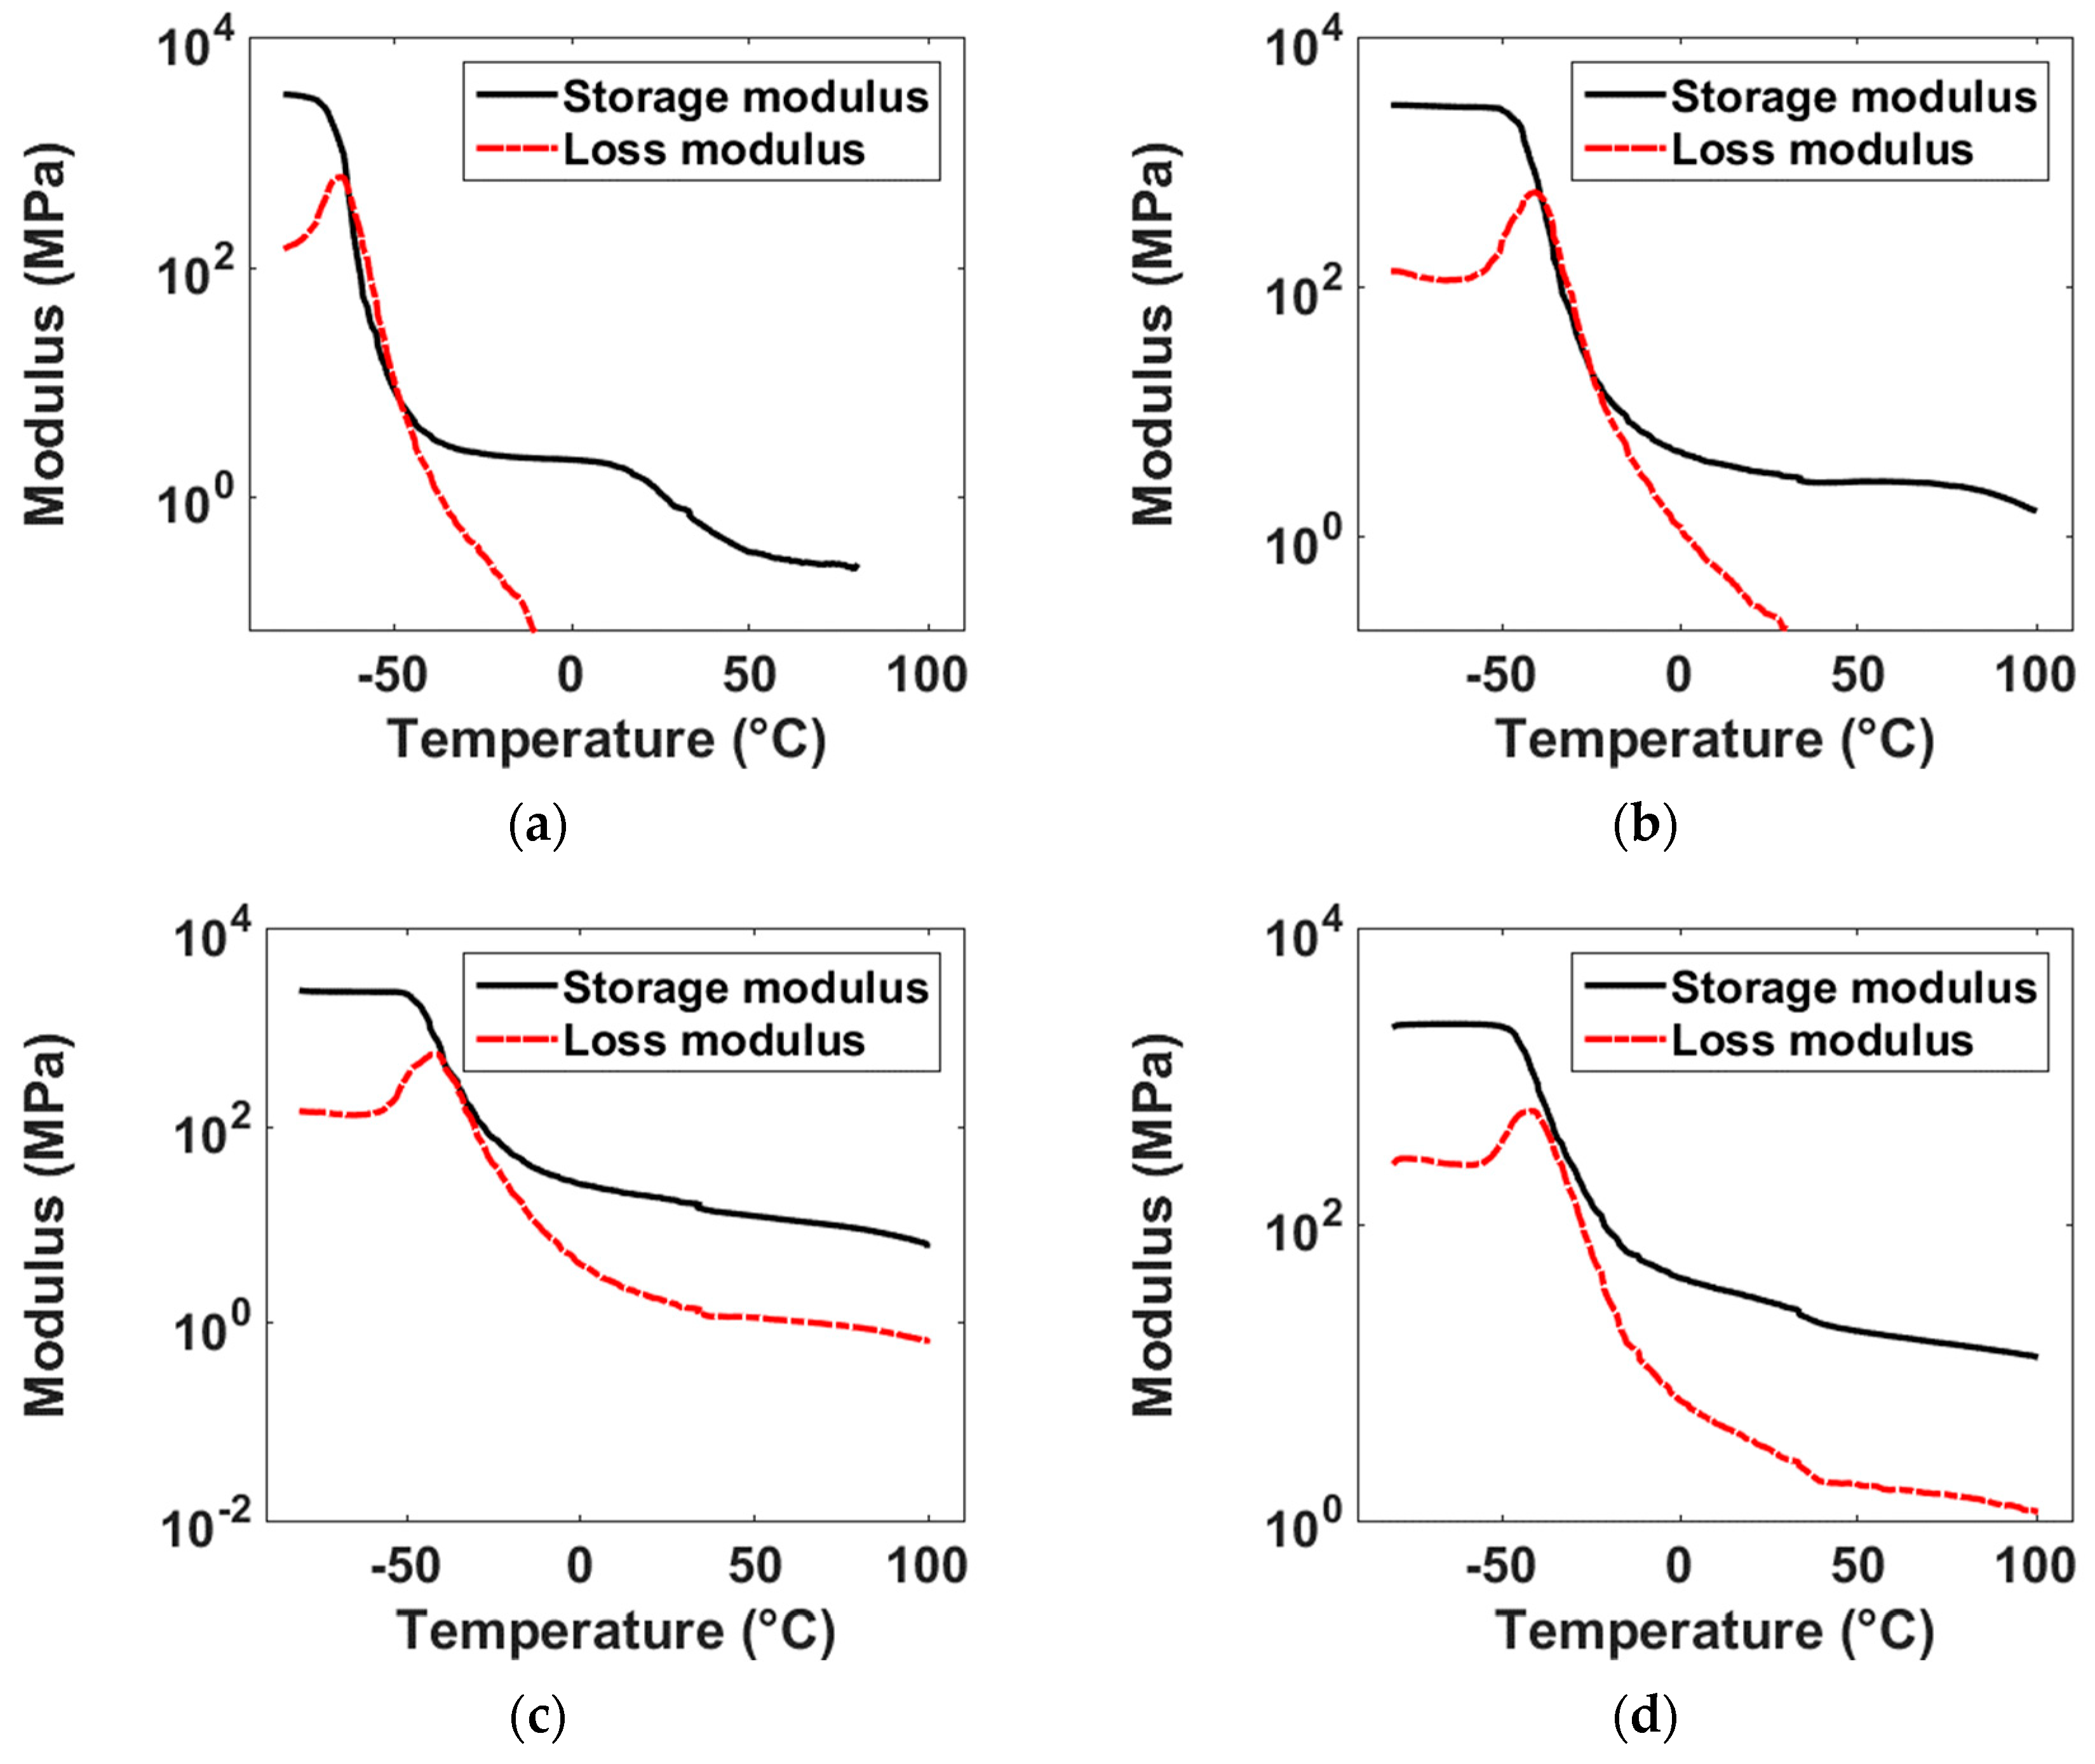
The variation of E’ and E” together with temperature are illustrated in Figure 6. Since the material is in the glass transition stage in the neighbourhood of the E” peak, the rapid decay of E’ assists in increasing tan δ and, therefore, a temporal delay in attaining tan δ peak compared to the peak os E”. As the loss moduli data were unstable for VR00 and VR20 after 0 °C and 40 °C, respectively, they are not included in Figure 6.

4. Conclusions

The effect of HAF N330 grade CB content on the viscoelastic properties of filled NR was studied by analyzing the variation of storage modulus, loss modulus and loss factor as a function of temperature. The vulcanizates are subjected to the temperature sweep experiments in a dynamic mechanical analyzer (DMA). Vulcanized NR sheets with four different proportions of CB, 0, 20, 40 and 60 PHR were considered and subjected to sinusoidal tensile loading at a constant frequency of 1 Hz. The dynamic displacement amplitude of 20 μm, along with a static displacement of 80 μm, was used for the experiments. Following are the key observations of the study.
The glass transition stage for the unfilled NR begins at about −65 °C, whereas in the case of CB-filled materials, the transition is delayed by about 45 °C. The proportion of CB in the filled NR vulcanizates does not affect the glass transition initiation temperature. The delay in shift from crystalline glassy state to amorphous rubbery state for filled NR is attributed to the robustness of the filler–matrix networks.
  • The E’ in glassy state is observed to increase with decreasing CB content. The decreasing E’ with increasing filler proportion is attributed to the dilution of polymers in the glassy state.
  • The rubbery E’ increases with increasing CB content. This is due to the enhanced load transfer efficiency of material in the presence of rigid CB fillers.
  • The coefficient of reinforcement exponentially decreases with increasing CB content. The low C-factor values of filled NRs indicate the effectiveness of reinforcement in enhancing the stiffness of filled rubber.
  • The E” peaks at about 600 MPa for all filled rubber materials.
  • The temperatures associated with E” peaks are referred as the glass transition temperature, which are noted to be about −65 °C and −45 °C for unfilled and filled NRs, respectively.
  • The maximum tan δ value decreases with increasing CB content, which indicates a decrement in the damping characteristics of the vulcanizates upon addition of the rigid CB fillers.
  • Similar to E” case, the tan δ peak shifts to higher temperature in the case of filled rubber. The maximum tan δ is observed at ~−55 °C for unfilled NR and ~−35 °C for the filled NRs. A temporal span of 10 °C is noted between the E” and tan δ peaks.

Author Contributions

Conceptualization, S.B., R.K. and C.S.U.; methodology, S.B.; experiments, S.B.; validation, S.B., R.K. and C.S.U.; formal analysis, S.B.; investigation, S.B.; resources, S.B. and R.K.; data curation, S.B.; writing—original draft preparation, S.B.; writing—review and editing, R.K.; visualization, R.K.; supervision, R.K. and C.S.U.; project administration, R.K. and C.S.U.; funding acquisition, R.K. and C.S.U. All authors have read and agreed to the published version of the manuscript.

Funding

The authors would like to thank Directorate of Extramural Research & Intellectual Property Rights (ER&IPR), India, for supporting this research through the Grant ERIP/ER/2007002/M/01/1778.

Institutional Review Board Statement

Not applicable.

Informed Consent Statement

Not applicable.

Data Availability Statement

The data presented in this study are available on request from the corresponding author. The data are not publicly available due to continuation of work.

Acknowledgments

We also would like to thank R Dharmaraja (Supreme Rubber Industries, Coimbatore) for tailoring the material contents as per our request and providing us the materials during a pandemic.

Conflicts of Interest

The authors declare no conflict of interest.

References

  1. Bhattacharya, M.; Bhowmick, A.K. Synergy in carbon black-filled natural rubber nanocomposites. Part I: Mechanical, dynamic mechanical properties, and morphology. J. Mater. Sci. 2010, 45, 6126–6138. [Google Scholar] [CrossRef]
  2. Mooney, M. A Theory of Large Elastic Deformation. J. Appl. Phys. 1940, 11, 582–592. [Google Scholar] [CrossRef]
  3. Lubliner, J. A model of rubber viscoelasticity. Mech. Res. Commun. 1985, 12, 93–99. [Google Scholar] [CrossRef]
  4. Gent, A.N. Relaxation processes in vulcanized rubber. I. Relation among stress relaxation, creep, recovery, and hysteresis. J. Appl. Polym. Sci. 1962, 6, 433–441. [Google Scholar] [CrossRef]
  5. Varughese, K.T.; Nando, G.B.; De, P.P.; De, S.K. Miscible blends from rigid poly(vinyl chloride) and epoxidized natural rubber. J. Mater. Sci. 1988, 23, 3894–3902. [Google Scholar] [CrossRef]
  6. Rahul, R.; Kitey, R. Effect of cross-linking on dynamic mechanical and fracture behaviour of epoxy variants. Compos. B 2016, 85, 336–342. [Google Scholar] [CrossRef]
  7. Grespacher, M.; O’Farrell, C.P.; Nikiel, L.; Yang, H.H. High frequency viscoelasticity of carbon black filled compounds. Rubber Chem. Tech. 1996, 69, 786–800. [Google Scholar] [CrossRef]
  8. Ikeda, Y.; Kohjiya, S. In situ formed silica particles in rubber vulcanizate by the sol-gel method. Polymer 1997, 38, 4417–4423. [Google Scholar] [CrossRef]
  9. Hu, X.-L.; Luo, W.-B.; Liu, X.; Li, M.; Huang, Y.-J.; Bu, J.-L. Temperature and frequency dependent rheological behaviour of carbon black filled natural rubber. Plast. Rubber Compos. 2013, 42, 416–420. [Google Scholar] [CrossRef]
  10. Warasitthinon, N.; Robertson, C.G. Interpretation of the tanδ peak height for particle-filled rubber and polymer nanocomposites with relevance to tire tread performance balance. Rubber Chem. Technol. 2018, 91, 577–594. [Google Scholar] [CrossRef]
  11. Pothan, L.A.; Oommen, Z.; Thomas, S. Dynamic mechanical analysis of banana fiber reinforced polyester composites. Compos. Sci. Technol. 2003, 63, 283–293. [Google Scholar] [CrossRef]
  12. Pothan, L.A.; George, C.N.; John, M.J.; Thomas, S. Dynamic Mechanical and Dielectric Behavior of Banana-Glass Hybrid Fiber Reinforced Polyester Composites. J. Reinf. Plast. Compos. 2009, 29, 1131–1145. [Google Scholar] [CrossRef] [Green Version]
  13. Karunakaran, K.; Singh, S.S.; Kitey, R. Investigating the role of filler shape on the dynamic mechanical properties of glass-filled epoxy composites. Polym. Compos. 2022. [Google Scholar] [CrossRef]
Figure 1. FESEM image of the cross section of VR60 indicating uniformity in the distribution of CB.
Psf 04 00009 g001
Figure 2. Storage modulus vs. temperature curves for the four vulcanizates (a) ranging from −80 °C to 100 °C, (b) glassy region for all four materials as observed from −80 °C to −70 °C, and (c) rubbery region for all four materials as observed from 20 °C to 30 °C.
Psf 04 00009 g002
Figure 3. Variation of coefficient of reinforcement (C-factor) with the proportion of CB filler.
Psf 04 00009 g003
Figure 4. Loss modulus vs. temperature curves for the four vulcanizates (a) from −80 °C to 100 °C, (b) loss modulus variation from −80 °C to −70 °C, (c) loss modulus variation from 20 °C to 30 °C.
Psf 04 00009 g004
Figure 5. (a) Loss factor (tan δ) vs. temperature curves for the four vulcanizates from −80 °C to 100 °C. (b) Variation of maximum tan δ value with CB content.
Psf 04 00009 g005
Figure 6. Cumulative plots of E’ and E” from −80 °C to 100 °C. (a) VR00, (b) VR20, (c) VR40, (d) VR60.
Psf 04 00009 g006
Table 1. Constituents of the filled and unfilled vulcanized NR.
Chemical/IngredientProportion per Hundred Weights of Rubber (PHR)
Natural Rubber (smoked sheet, RMA)100
Zinc Oxide5
Stearic Acid1
Accelerator CBS0.5
Rubber Grade Sulphur2.5
HAF N330 Carbon Black0, 20, 40, 60
Aromatic Process Oil10
Publisher’s Note: MDPI stays neutral with regard to jurisdictional claims in published maps and institutional affiliations.