Article

Savonius Wind Turbine Numerical Parametric Analysis Using Space-Filling Design and Gaussian Stochastic Process

by
Aristotle T. Ubando
1,2,3,*,
Rathana San
4 and
John Deric P. Cruz
1
1
Department of Mechanical Engineering, De La Salle University, Manila 0922, Philippines
2
Thermomechanical Analysis Laboratory, De La Salle University, Laguna Campus, Biñan 4024, Philippines
3
Center for Engineering and Sustainable Development Research, De La Salle University, Manila 0922, Philippines
4
Industrial and Mechanical Engineering Department, Institute of Technology of Cambodia, Phnom Penh 12150, Cambodia
*
Author to whom correspondence should be addressed.
Wind 2022, 2(1), 113-128; https://doi.org/10.3390/wind2010007
Submission received: 25 January 2022 / Revised: 11 February 2022 / Accepted: 16 February 2022 / Published: 18 February 2022
(This article belongs to the Topic Sustainable Energy Technology)

Abstract

:
Wind energy is an alternative source of clean energy to address the growing energy demand and provide pollution-free electricity. With the rapid development of urban areas, high wind energy resources such as high-rise building rooftops are excellent locations for urban wind turbine installation. One of the practical and simple urban wind turbines is the Savonius design. It has a simple design, easy to maintain, and is very affordable. This work focuses on the design evaluation of a Savonius wind turbine (SWT) by varying the rotor diameter, rotor height, and twist angle for urban applications. A transient computational fluid dynamics (CFD) approach is applied to assess the various design treatments using a space-filling design of experiments. To address the spaces in the hypercube statistical design, a sphere packing design method was adopted which suited the evaluation of computational simulations results such as that of the CFD. The Gaussian stochastic process model was applied to establish the trend of the parametric performance of the optimized SWT design through the model fitting. The results have shown that optimized SWT performs well with its self-starting capability compared to the traditional Savonius design. In addition, the optimized SWT has shown a better peak power coefficient compared with the results of previous works on the design of SWT.

1. Introduction

The power generation industry has been one of the most important industries in the world especially as the demand of world energy consumption continues to increase. The IEA [1] projected the increase of energy demand by the year 2035 as twice that of the 1990s. Thus, the need to construct different power generation plants increases as well to meet the demand. However, most of these conventional power plants consume non-renewable raw materials such as coal, petroleum, and other fossil fuels. Accordingly, Calautit et al. [2] emphasized that the continuous consumption of fossil fuels would lead to more generation of greenhouse gas emissions. These greenhouse gas emissions play a significant role in worsening the global warming and climate change situation. To address these global concerns, the industry continues to seek renewable power generation methods that can sustainably generate the projected energy demand. Renewable energy sources for power generation have provided an alternative means of power generation for the past few decades. These vary between solar, hydroelectric, wind, and biomass, among others. Among these alternative energy sources, wind energy has gained interest from engineers and scientists to potentially generate energy through wind turbine design for the past 20 years. According to the WWEA [3], the total energy generation from wind energy sources skyrocketed as the awareness of the use of the renewable source for energy generation was widely accepted. Traditional wind turbines are large windmill-like structures found in flat-terrain areas which are the main source of wind energy [4]. However, due to the size of each of these wind turbines, the creation of wind farms has become an issue due to the requirement of a large area. Hence, a small-scale wind turbine for the urban areas significantly gained traction. A wind turbine for urban areas requires further evaluation since its performance characteristics are still under development [2]. Škvorc and Kozmar [5] outlined the significance of urban wind turbines to the progress of smart and sustainable cities due to their potential advantages. These advantages range from enhanced energy efficiency, clean energy, and economic advancements [6]. In addition, Naderipour et al. [7] highlighted that urban wind turbines aid in satisfying the power requirement of an area as this remarkably reduces the power transmission losses from the power plants. Moreover, urban wind turbines have the potential to limit greenhouse gas emissions [8]. However, Tasneem et al. [9] have noted that the minimum emission of greenhouse gases from urban wind turbines is attributed to their production process. Although urban wind turbines consist of various advantages, they still pose different disadvantages. Chrysochoidis-Antsos et al. [10] have recognized that urban wind turbines can be disturbing in terms of their visual representation and loud noise. Thus, the development of various urban wind turbines was geared towards the improvement of the turbine performance.
One of the known urban wind turbine designs is the Savonius wind turbine (SWT). Kim and Cheong [11] have revealed that the most appropriate type of small-scale wind turbine is the SWT owing to its multi-directional starting capability and its low noise. Moreover, further research and development suggested other advantages such as its good performance, simple design, and low cost in terms of production and maintenance [9]. Even though the SWT has the potential to address the problems of urban wind turbines, its low efficiency continues to pose a challenge for its use [12,13,14]. Various works were performed to address this problem [15]. Previous studies in the enhancement of the performance of the SWT are discussed as follows. Yahya et al. [16] investigated the effects of multi-bladed SWT on its rotor performance. Their results have shown that the number of blades significantly increased the performance of the SWT [16]. Saad et al. [17] evaluated the performance of the rotor of the SWT where the effect of a multi-stage was assessed. Their results revealed the multi-stage SWT self-starting capability and enhance torque oscillation [17]. Meanwhile, the single-stage SWT generates a higher dynamic moment. Moreover, Irabu and Roy [18] presented an SWT wind tunnel with the evaluation of the effect of a guide-box tunnel to improve its performance. The area ratio of this guide box is 0.43 compared to the SWT. In this study, it was found that the use of the guide-box tunnel increased its efficiency by 150% [18]. However, Dewan et al. [15] argued that the addition of this guide-box tunnel further complicated the SWT system and limited the capability of the turbine to adapt from the wind conditions.
Recent studies have performed parametric design improvements to enhance the performance of the SWT. Aboujaoude et al. [14] proposed to include an axisymmetric deflector to the SWT to elevate its aerodynamic performance. Tjahjana et al. [19] assessed the influence of the slotted blades in an SWT that resulted in a 34% increase in the power coefficient. Xu et al. [20] recently introduced the use of plasma excitation flow control to the SWT that enabled a significant improvement in its output torque and efficiency. Al-Ghriybah et al. [21] investigated the influence of the blade spacing in an SWT that resulted in the improvement of its power coefficient by one third. To further increase the power production of the SWT, Berhanu et al. [22] evaluated its use as an exhaust air energy recovery in a central air-conditioning system. Their result has shown an overall improvement in the system efficiency of about 87% [22]. To further enhance the aerodynamic performance of an SWT, a computational approach was adopted such as the use of the ANSYS software [23]. Using the same method, Marinić-Kragić et al. [13] had multiple arc blades that enabled the SWT to improve the performance by 50%. On the other hand, Marzec et al. [24] further explored the expansion of the computational approach by the development of a fluid–structure interface (FSI) of an SWT. The FSI model was then validated with an experimental result and found to influence the centrifugal forces in the turbine operation. With the use of a computational fluid dynamic (CFD) approach, Marinić-Kragić et al. [25] introduced a scoop-based design of an SWT that enabled a 10% to 39% improvement in its power coefficient.
Various modelling techniques were developed to further enhance the performance of urban wind turbines. An adaptive neuro-fuzzy inference system was developed by Elsisi et al. [26] for the improved blade pitch control of urban wind turbines. A numerical approach coupled with an experimental test was performed by Zalhaf et al. [27] to understand the transient behavior of wind turbine blades that are hit by lightning. Recently, a hybrid numerical approach was developed by Sayed et al. [28] to incorporate dust loaded wire-duct precipitators in the computational domain of urban wind turbines. With the transmission of electricity from the wind turbine, Abouelatta et al. [29] developed a numerical method that integrated a full multigrid method to evaluate the fast corona discharge with varying wind speeds.
These studies are significant in enhancing the performance of the SWT. However, the design enhancement approach using the CFD method coupled with space-filling design with the sphere packing method has not been explored in previous works. CFD is a numerical approach that allows a design of an SWT to be evaluated computationally [30]. On the other hand, space-filling design is a type of statistical design of experiment tool that addresses the non-uniformity of the inside experimental space [31]. The sphere packing method is used in a hypercube which can be well represented by results of computational approaches such as the CFD method [32]. Moreover, a Gaussian stochastic process (GaSP) model was used to fit in a multivariate normal distribution the developed model results from the space-filling design [33]. Based on the available literature, no studies have applied CFD and space-filling design with the GaSP model to design an SWT. Hence, the novelty of this work lies in the methodology to redesign the SWT using a CFD approach with space-filling design of experiment and GaSP model. The designed SWT was evaluated based on the maximum power coefficient and assessed the influences of the considered design parameters.

2. Performance of the Savonius Wind Turbine

The performance of the SWT is best described by its power coefficients where the moment coefficient and the power coefficient are given as Cm and Cp, respectively. These coefficients were obtained from the ratios between the actual parameter over the theoretical parameter. Two of the important parameters are the moment and the power coefficients [34]. The moment coefficient is quantified using Equation (1) while the power coefficient is determined using Equation (2).
C m = M M w = M ( 1 / 2 ) ρ r A V 2
C P = P w ( 1 / 2 ) ρ A V 3 = M ( 1 / 2 ) ρ A V 2 r r ω V
where A provides the swept area of the turbine in m2, M represents the rotor moment in N-mm, P w indicates the extracted power in W, V depicts the air velocity in m/s, r shows the radius of the rotor in m, ρ covers the density of air in kg/m3, and λ denotes the tip-speed ratio. Barlow et al. [35] described the model frontal area of the turbine concerning the cross-sectional area of the air domain as shown in Equation (3).
ϵ = ( M o d e l   f r o n t a l   a r e a C r o s s s e c t i o n a l   a r e a ) = A C
where C indicates the cross-sectional area in m2 and ϵ represents the percent blockage ratio.
To establish a deterministic model validation for the simulation results, the Gaussian Stochastic process (GaSP) model was considered. The GaSP model consists of an n × 1 vector for its output response, y ( x ) ,   which is given as N ( μ 1 n ,   σ 2 R ( X ,   θ ) . The parameter R ( X ,   θ ) in the output response is a n × n correlation matrix and can take different forms depending on the situation [36]. Equation (4) provides the correlation function of the GaSP model while Equation (5) shows the fitted Gaussian prediction function. The GaSP equations shown in both Equations (4) and (5) were adopted from Jones and Johnson [37].
( R i j ( X , θ ) ) = e x p ( k = 1 P θ k   ( x i k x j k ) 2 )
y ^ ( x ) = μ ^ + r   ( x ,   θ ^ )   R 1   ( x , θ ^ )   ( y μ ^ 1 n )
where R(X,θ) is a square correlation matrix wherein it is a function of the design space and points as well as some unknown thetas, μ ^ provides the fitted mean, σ ^ indicates the variance, and r ( x , θ ^ ) represents the n × 1 vector with a condition if ( θ k 0 ).

3. Methodology

Different analytical and simulation software was used to perform the study. The discussion on the methodology is divided into three portions such as the CFD model, the design of experiments through the space-filling design of experiment, and the GaSP model.

3.1. Computational Fluid Dynamics

The CFD approach was performed using the commercial software ANSYS Fluent. The K ε turbulence model was used since this model provides accurate results with the SWT with relatively lesser computational time. These numerical simulations were conducted to obtain the various aerodynamic performance of each design treatment while determining its respective power and moment coefficients.

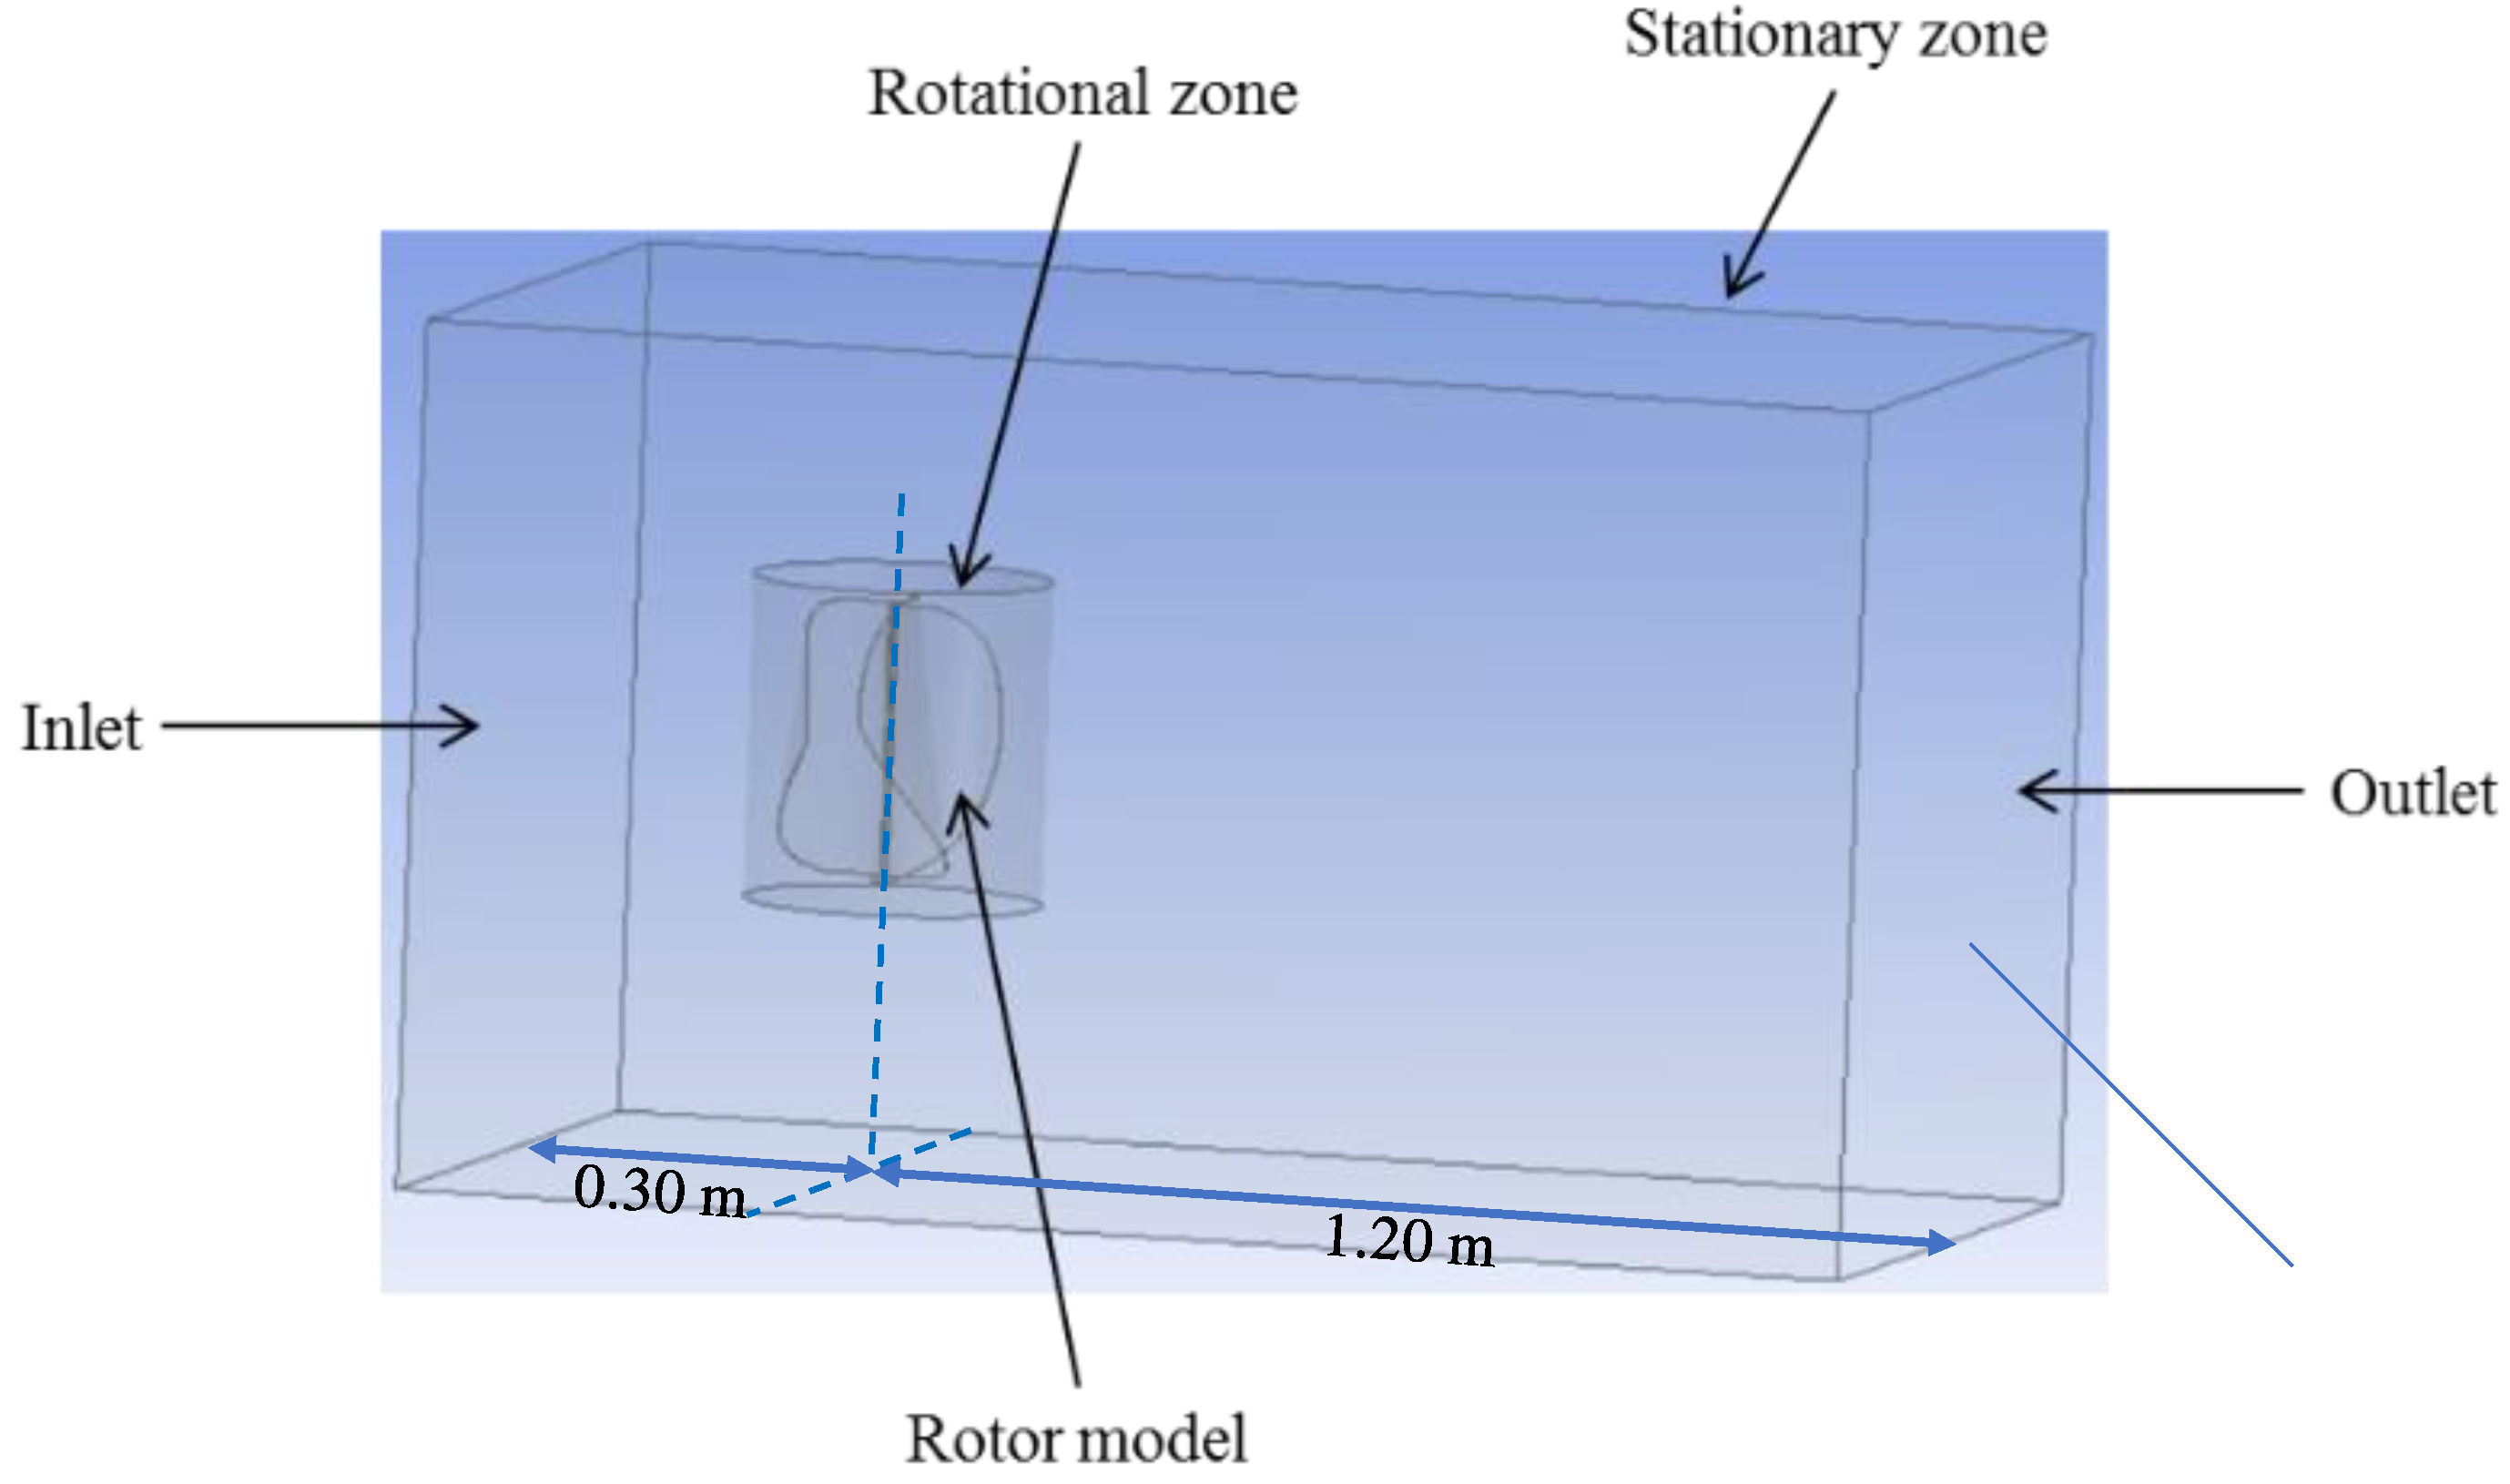
3.1.1. Simulation Set-Up

The geometries of the developed model were constructed using the Design Modeler of ANSYS. The geometry of the SWT rotor is shown in Figure 1 where the rotor diameter (D) was evaluated to change from 0.29 m to 0.40 m, the rotor height (H) was varied from 0.16 m to 0.35 m, and the twist angle was changed from 15° to 65°.
In the development of the geometry, a 21.6% percent blockage ratio ( ϵ ) [38] was considered as shown in Equation (3). Meanwhile, the upwind distance of the rotor used was 0.30 m while a downstream distance of the rotor utilized was 1.20 m. In the development of the geometry of the SWT, two domains were identified, which are the stationary zone and the rotational zone as shown in Figure 2. The stationary zone is the wind tunnel domain which consists of a rectangular-shaped air domain; while the rotational zone is a cylindrical-shaped domain, as shown in the figure, that allows rotation of the SWT shaft axis.
As shown in Figure 2, the inlet and the outlet zone were identified, while all the other sides of the rectangular zone were set to a walled domain. An air inlet velocity of 6.5 m/s was used together with an outlet pressure of 1 bar. A convergence criterion of 1 × 10⁻⁶ was used with a maximum of 1000 iterations per simulation run. Figure 3 shows the separated cell zone of the simulation in a section view.

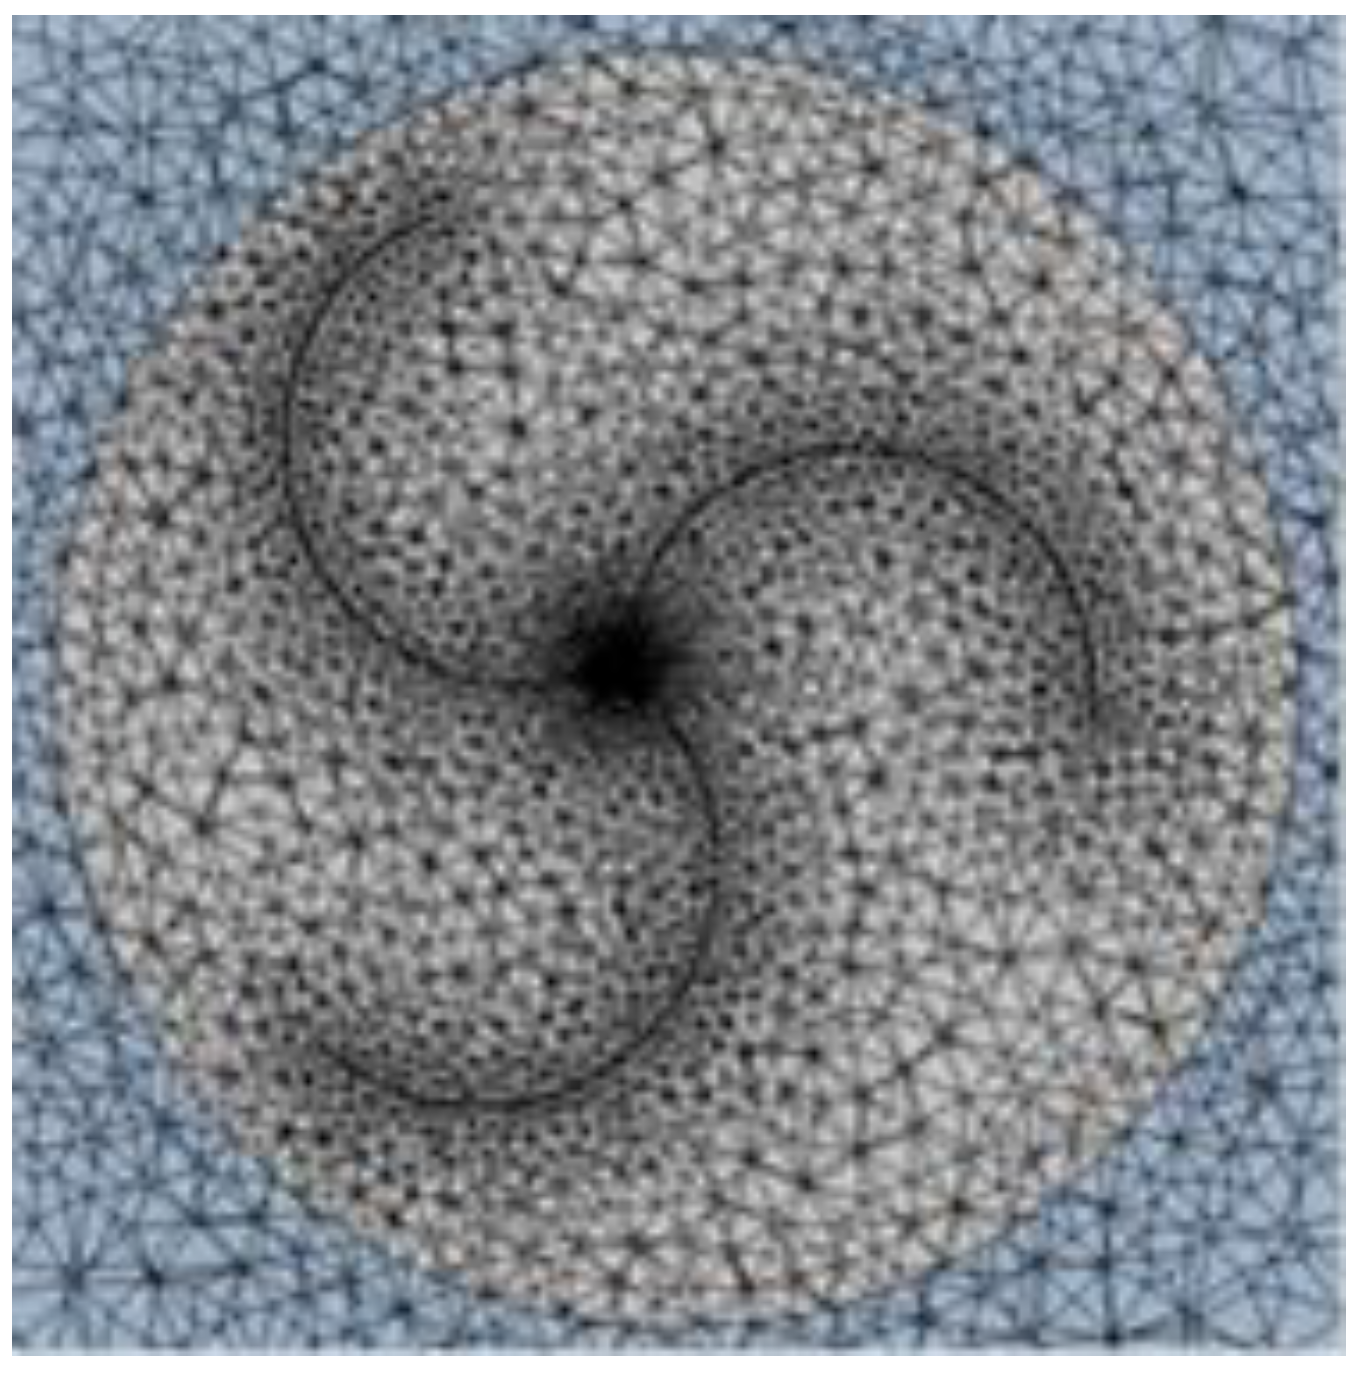
3.1.2. Evaluation of the Simulation Mesh

The quality of the mesh of the geometries for the simulation is an important step to consider to attain an accurate solution with low computational cost. The mesh setup of the developed SWT model is shown in Figure 4. The top view of the rotor that showcase the near wall mesh and the mesh surrounding the rotor is shown in Figure 5.
The mesh of the developed SWT model was performed to evaluate the skewness value, aspect ratio, and orthogonal quality. A tetrahedral grid shape was adopted as the mesh shape as it was able to capture the complex curvature shape of the SWT. With these factors of interest, a mesh independence test was performed by changing the mesh sizes of each geometry from −100 to 100 as shown in Table 1. Figure 6 illustrates the mesh independent test of the simulation setup in terms of skewness value and orthogonal quality.
The design of experiments was performed where each geometry model of the SWT was developed. The developed SWT designs were evaluated into two types of simulations, namely, the static condition and the dynamic condition. The static condition simulation was done using the moving reference frame (MRF) while the dynamic condition simulation was performed using the dynamic sliding mesh motion (SMM).

3.2. Design of Experiments

The JMP statistical analysis software was utilized to determine the simulation treatments for the study. The sphere-packing design method under the space-filling design is used to evaluate each design for the different parameters considered. The parametric factors considered are shown in Table 2 where the values were adopted from Lee et al. [38] which showed indicative promising results for the SWT.
From Table 2, the total number of simulation treatments obtained from the space-filling design of the experiment is 30. Hence, 30 unique SWT geometries were prepared and evaluated based on the moment coefficient and power coefficient performances.

3.3. Gaussian Stochastic Process (GaSP) Model

After the CFD simulation of the 30 treatments, the GaSP model was adopted to assess the effects of the height and the diameter of the rotor as well as its twist angle with regards to the moment coefficient and power coefficient performances. Afterward, model fitting was performed using the GaSP model to derive the model equations of the input and output factors. It was found that there were two responses to be obtained from this model, namely, the model coefficients and power coefficients. For the GaSP model validation, the model also considered the moment and the coefficient of moment as a factor on top of the considered 3 parametric factors defined in Table 2. These 5 parameters were evaluated based on the power coefficient response.

4. Results and Discussion

The results of the study are elaborated in this section along with its discussion.

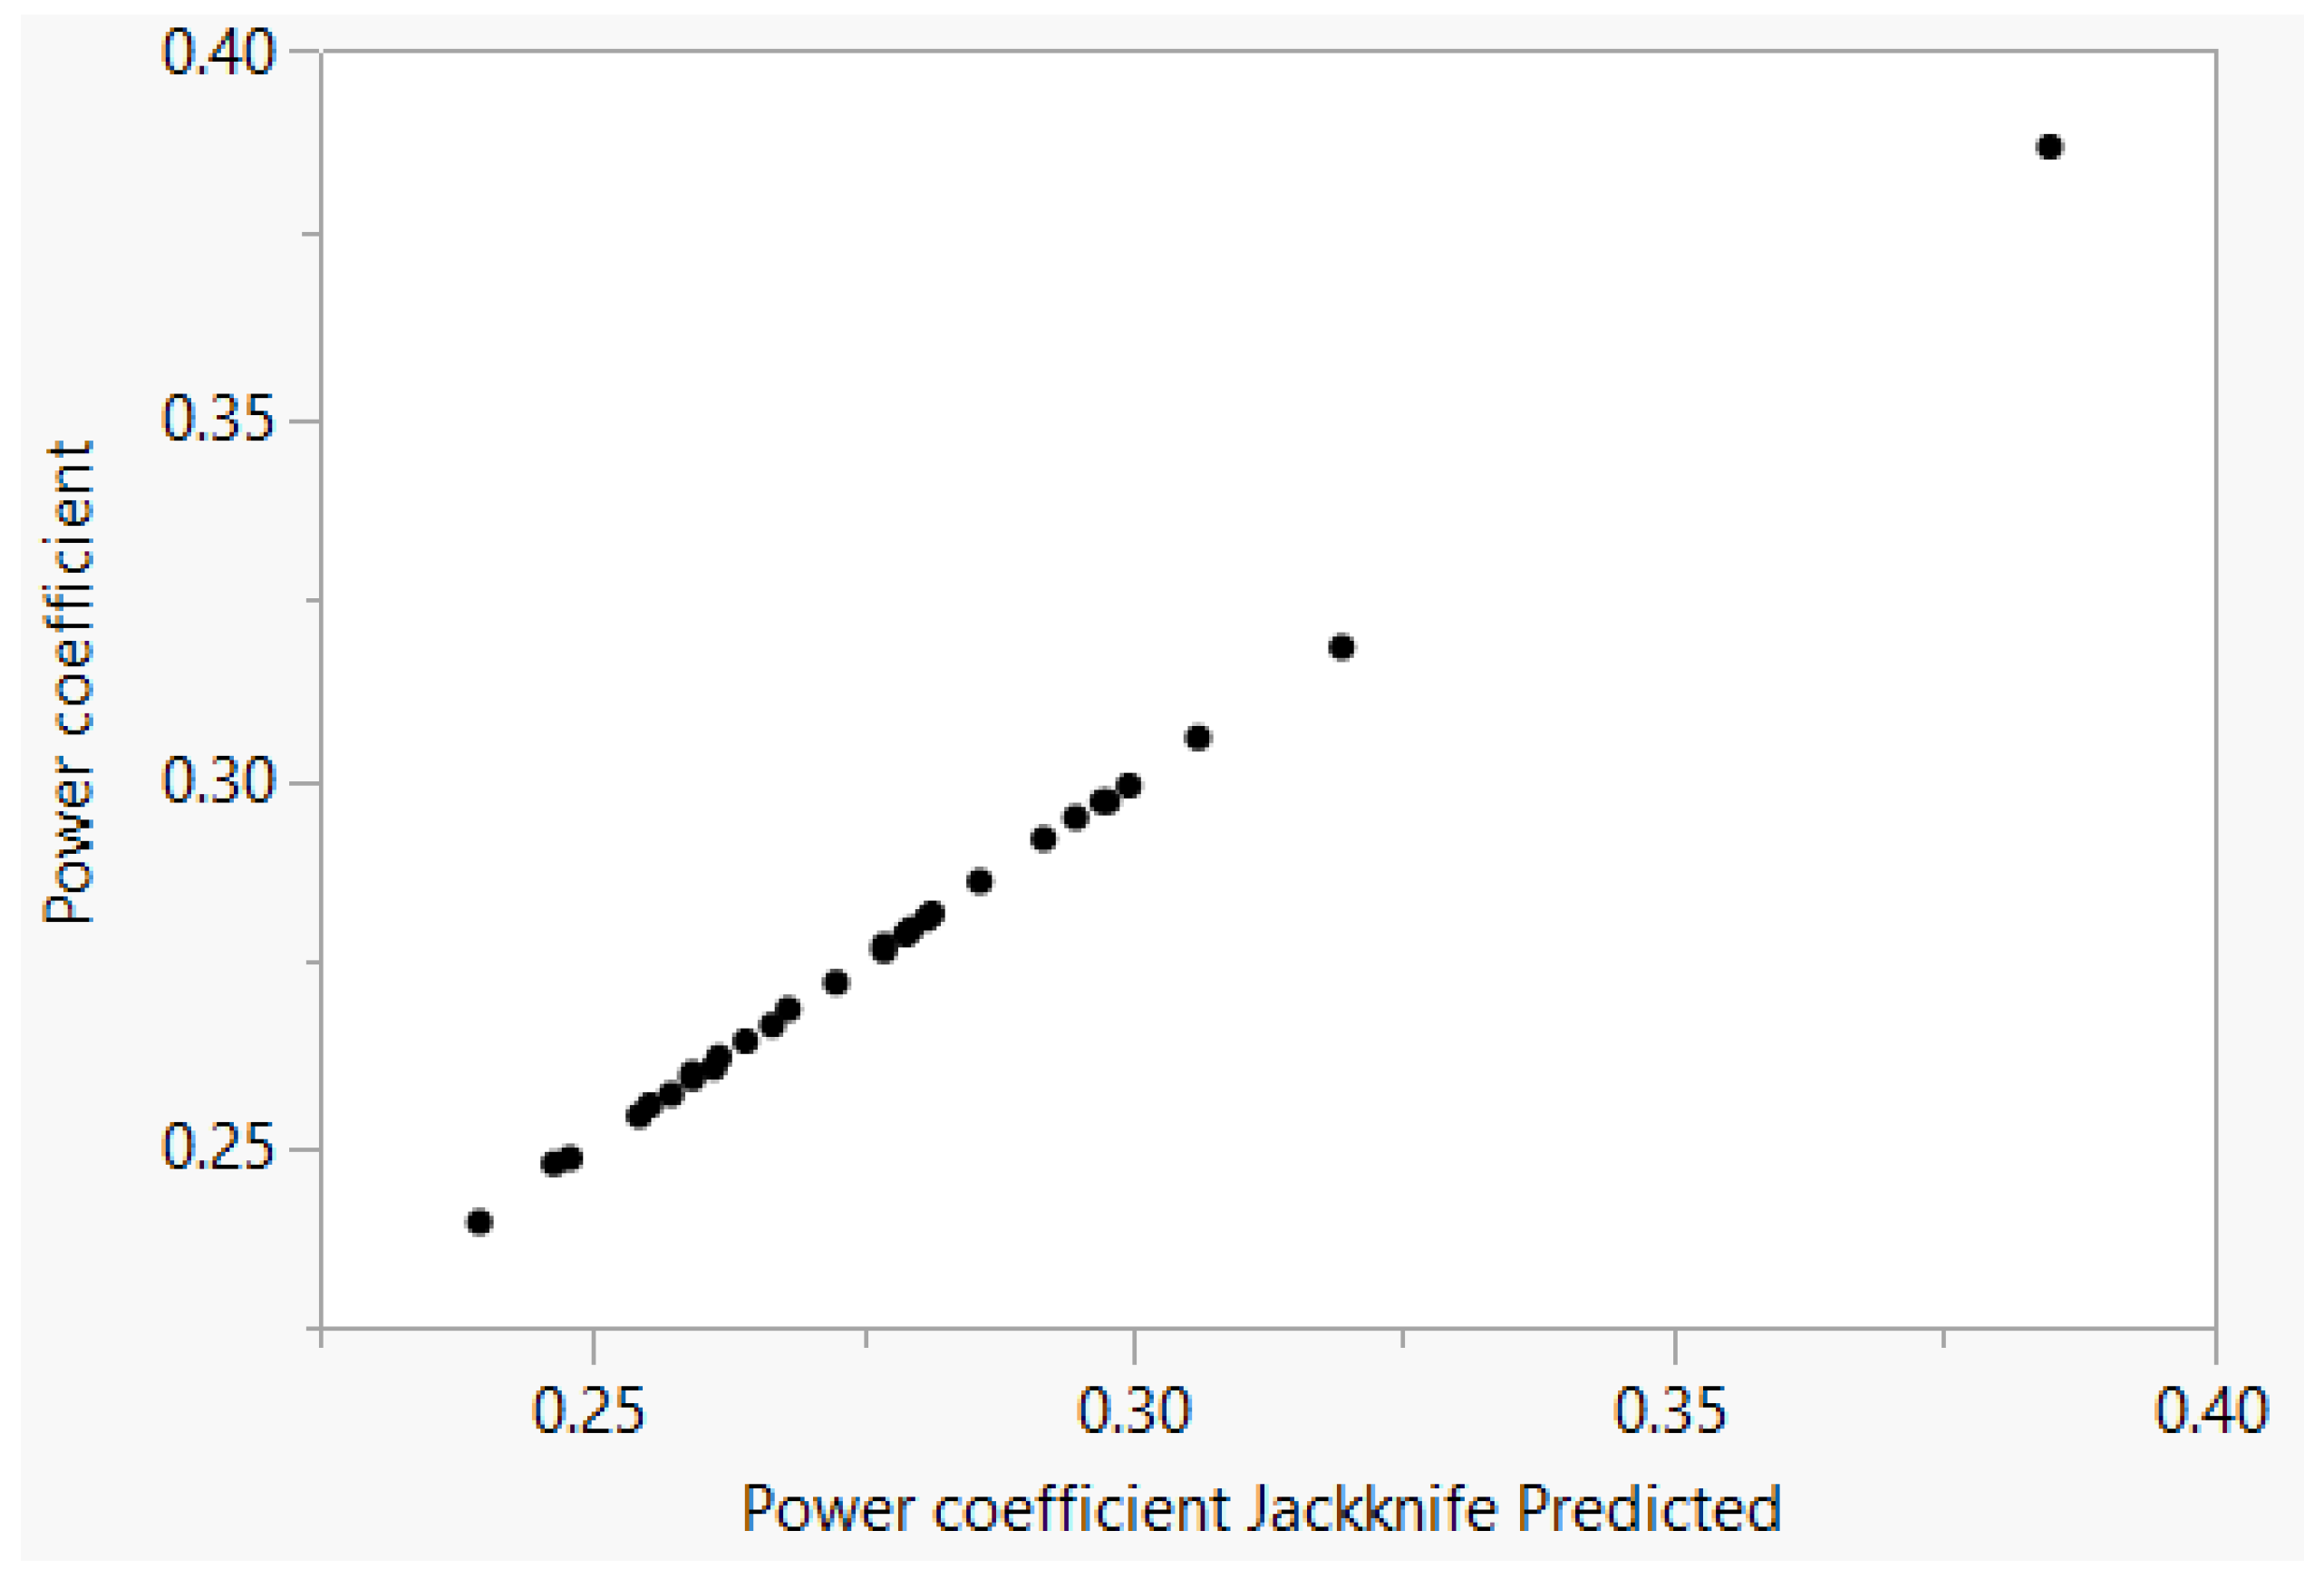
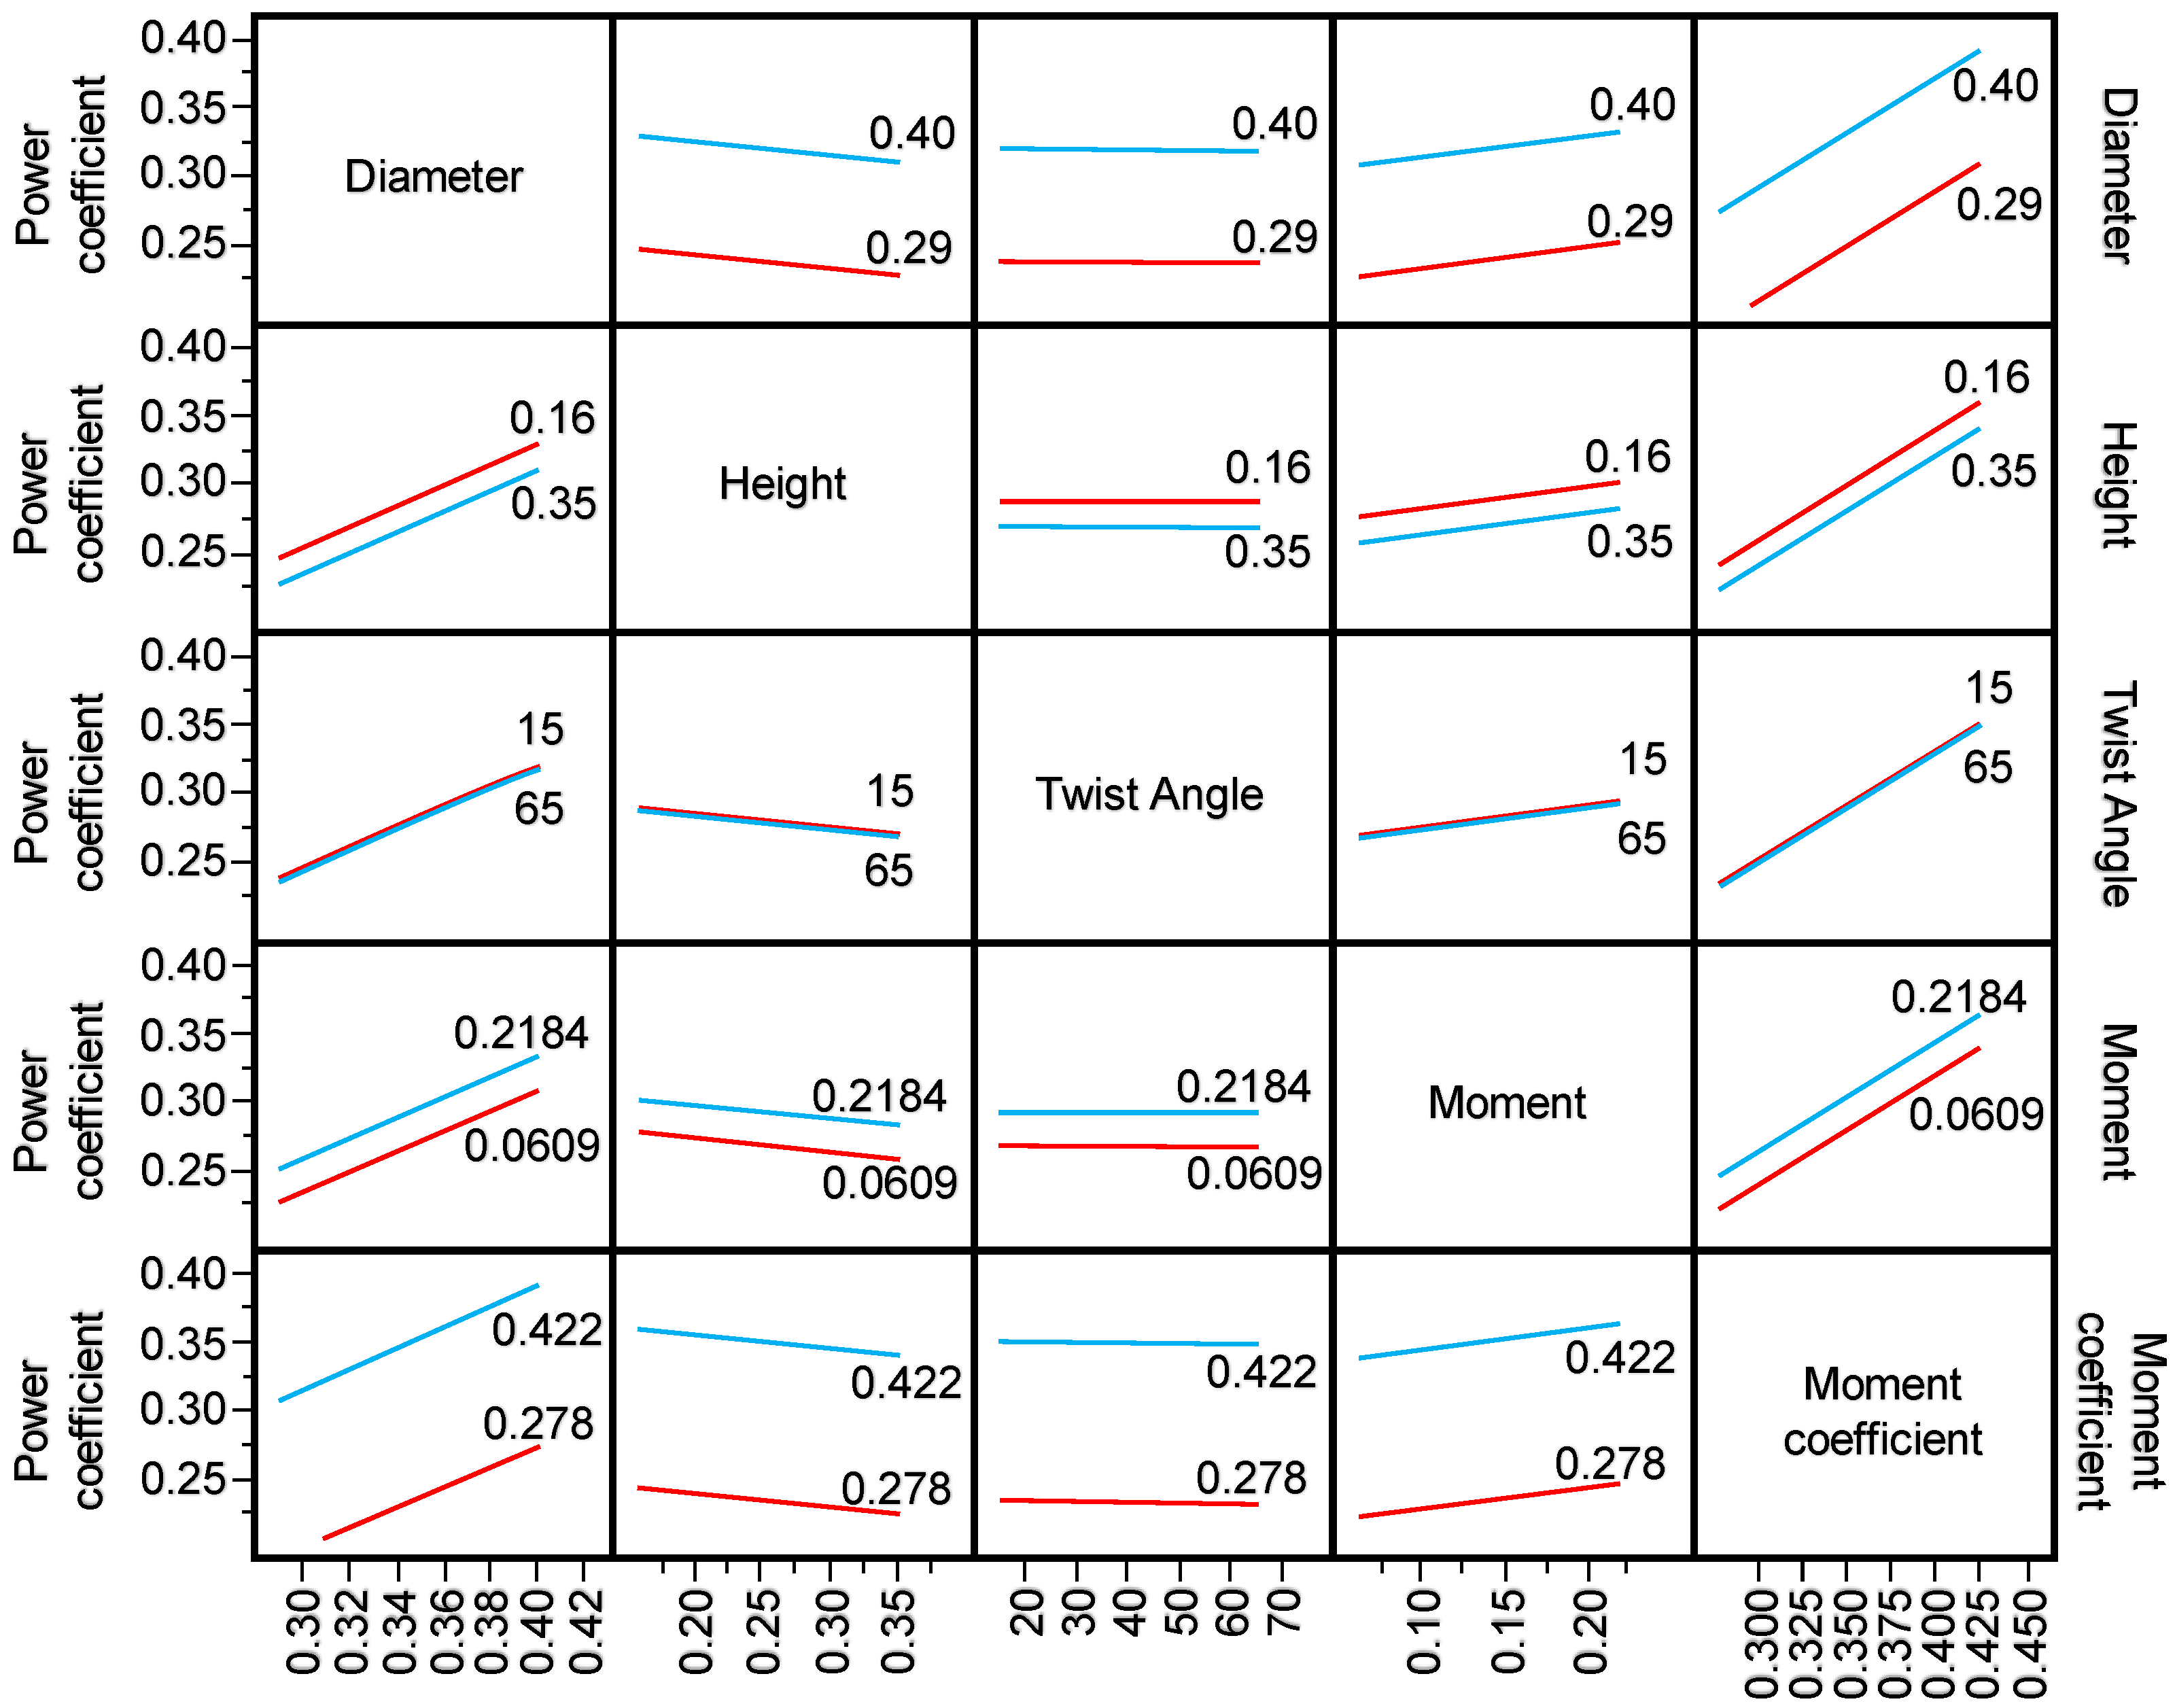
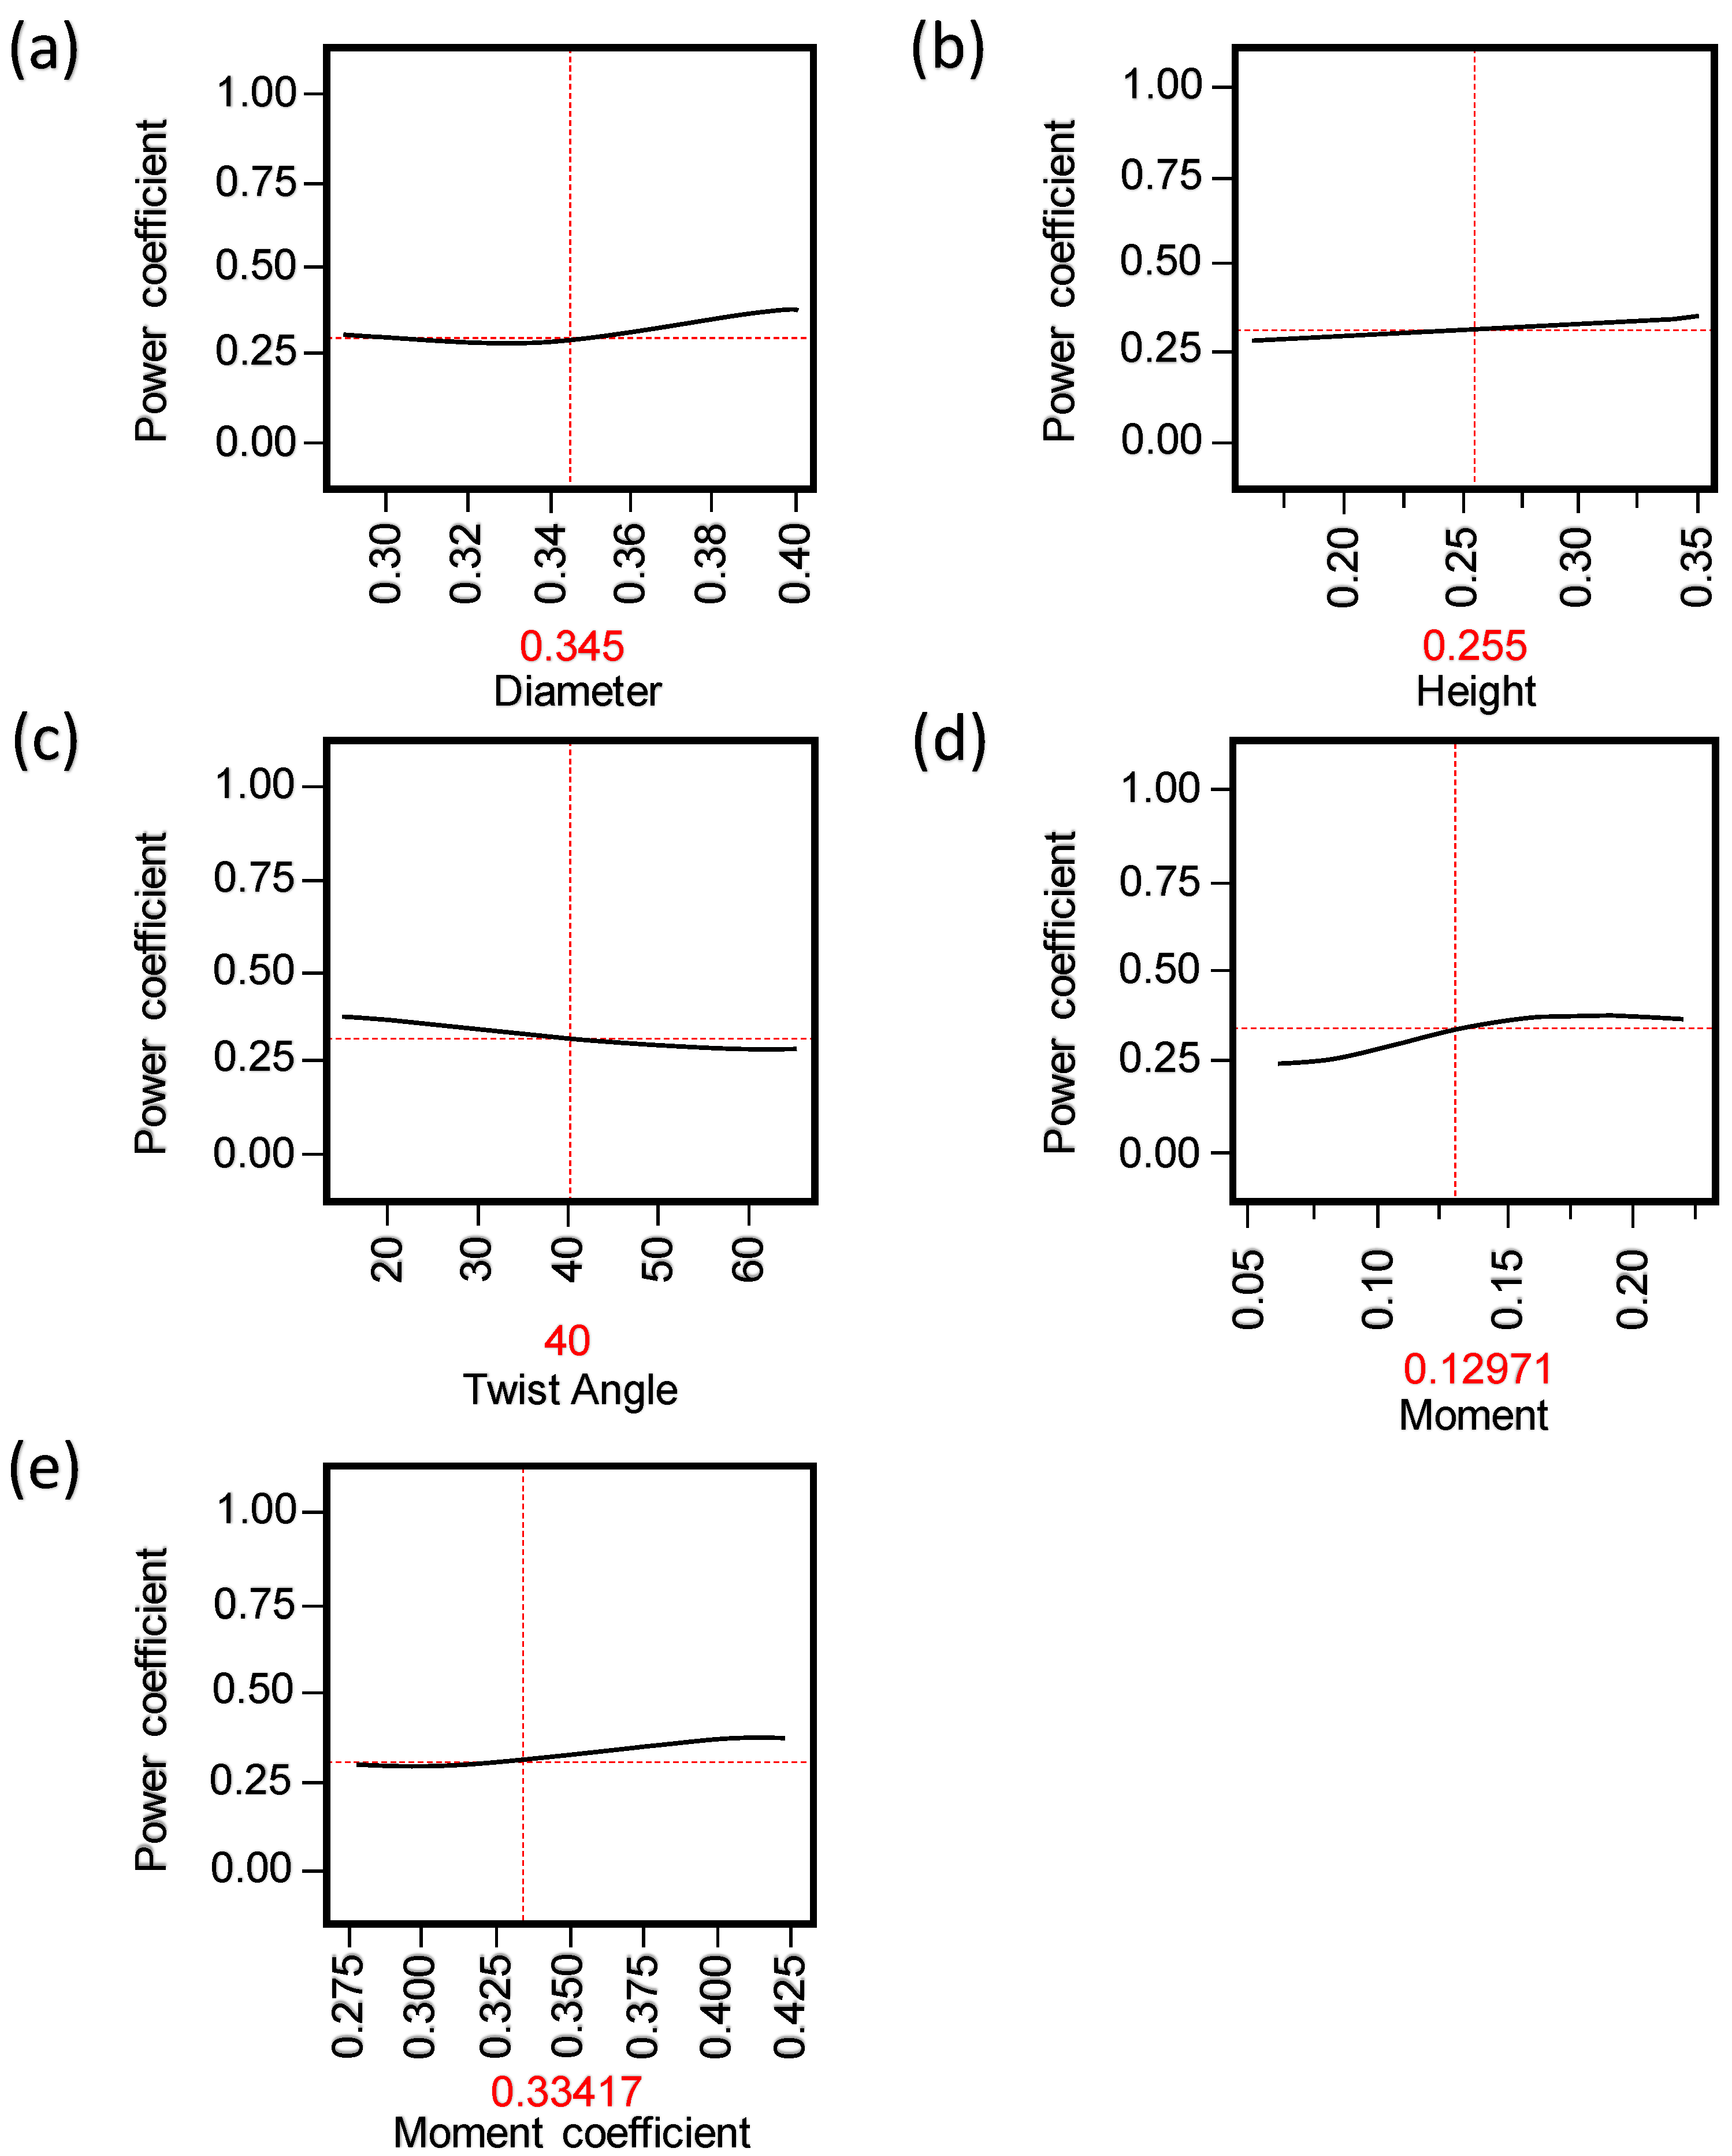
4.1. Gaussian Stochastic Process Results

The results of the model fitting of the 30 simulation treatment results to the GaSP model are shown in Figure 7, which highlights the power coefficient prediction plot for the design treatments.
Based on this graph, the actual power coefficient is directly proportional to the predicted power coefficient. The 45° plot line shown in the figure signifies that the model fitted the predicted model. Aside from this, the θ-value of each performance parameter is presented in Table 3.
The scale of the θ-values ranges from 0 to 1 which indicates the relative correlation of each of the parameters. This means that the rotor height, the twist angle, and the moment have a relatively higher correlation with the respect to the power coefficient, while the rotor diameter and the moment coefficient have a relatively lower correlation to the power coefficient. Moreover, Figure 8 shows the interaction plot of each of the considered parameters concerning the power coefficient. It was found that there is no interaction effect between the response and each performance parameters since the lines in the graphs are all parallel. However, it is interesting to note how the range of values for each of the performance parameters varies in terms of the change in the power coefficient. The gaps between the red line and the blue line represent the difference of the power coefficient at changing parameters. The larger the gap between the red and the blue lines indicates that the power coefficient is sensitive to the changing values of the specific parameter. Hence, no gap between the red and the blue line signifies the insensitivity of the power coefficient on the specified parameter.
Subsequently, the profiler plots of each performance parameter in terms of the power coefficient are shown in Figure 9a–e. It can be seen in these graphs that the height and the diameter of the rotor are directly proportional to the power coefficient. It is to be noted that the power coefficient increases as the vacuum pressure and the moment length of the blade increases. Similarly, the power coefficient was found to be directly proportional to the moment coefficient as well as the moment. This can be attributed to the direct relationship of the moment or torque from the power calculation of the blades of the wind turbine. Among the performance parameters considered, it is only the twist angle that causes the power coefficient to decrease when the parameter increases. This is due to the decrease of suction pressure and moment arm as the twist angle is increased.
The resulting fitted model for the performance parameters with respect to the power coefficient is shown in Equation (6). The establishment of the coefficient is shown in the fitted equation as shown below.
y = 0.296 + i = 1 n r i e ( 0.93   ( x 1 D i ) 2 + 0.78 × 10 6   ( x 2 H i ) 2 + 0.63   ( x 3 C m i ) 2 )
where y is the projected power coefficient, D i indicates the diameter, H i shows the height, C m i denotes the moment coefficient, r′ is the stochastic process in a finite set of i. The values of the fitted mean and the variance for the GaSP model fitting are shown in Table 4 while the factor r’ values are shown in Table 5.

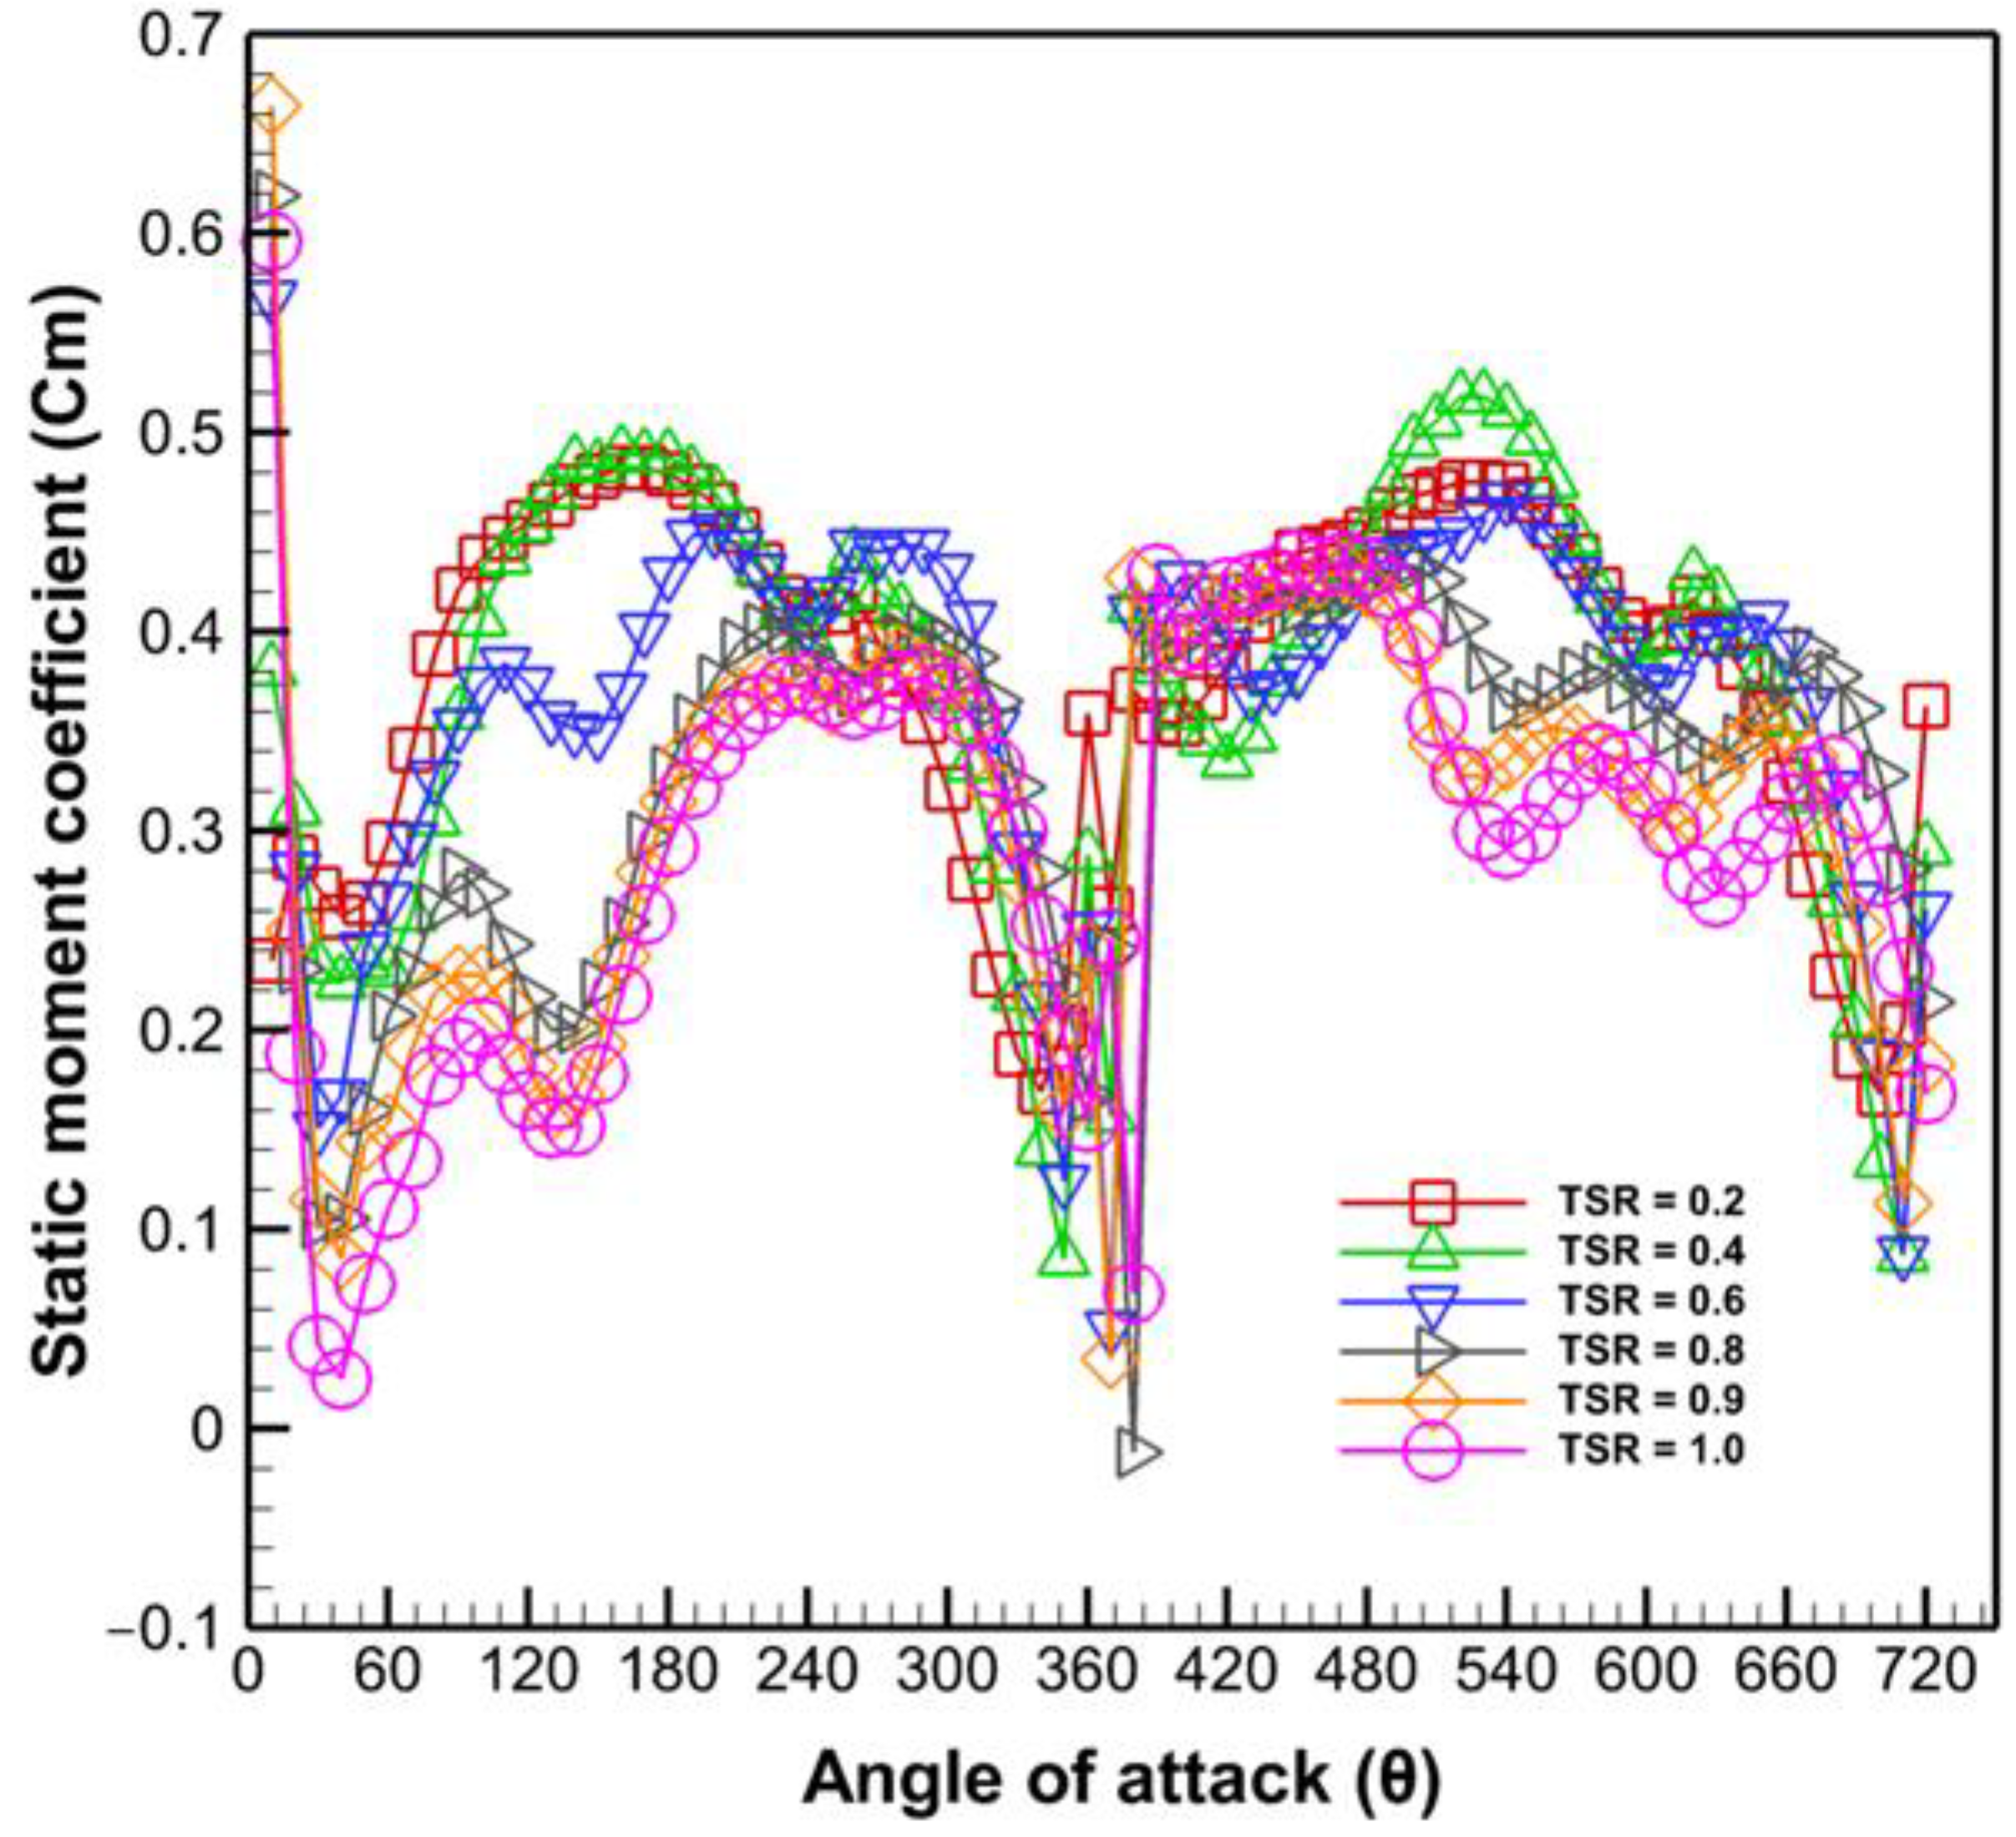
4.2. Static Condition Analysis

The static condition of the simulation represents the starting position of the wind turbine. The moment coefficients of the new SWT were analyzed and compared with the traditional SWT with a semi-cylindrical shape SWT. The moment coefficients in the static condition of both the new and the old are provided in Figure 10 and Figure 11. It can be seen in Figure 10 that the static moment coefficient of the new design remains positive. It is also shown here that the maximum static moment coefficient can be observed at the angle of attack values of 90° to 160° and 450° to 540°. Meanwhile, Figure 11 shows that the static moment coefficient of the traditional design crossed through the negative values. Additionally, it can be recognized that the minimum values of static moment coefficients are from 20° to 80° and 330° to 380°, respectively. With this said, it was found that the optimized design can start by itself since its moment coefficients remain positive while the SWT with a semi-cylindrical shape has negative moment coefficients which hinder its ability to self-start [39]. Therefore, the new SWT has a relatively superior self-starting capability compared to the traditional SWT.

4.3. Dynamic Condition Analysis

The parameters that were tested for the dynamic condition include the power coefficient and the dynamic moment coefficient of the wind turbines. Figure 12 showed the comparative study of the different SWT configurations with respect to the dynamic moment coefficient, while Figure 13 provided the comparative study of the different SWT configurations in terms of their power coefficients. It was recognized that the tip-speed ratio (TSR) also played a role in the performance of the SWT. The dynamic moment coefficient of each wind turbine decreases as the TSR is increased. However, the decrease of the new SWT is not as drastic compared to the other SWT configurations. A possible explanation for this is that the new design consists of smaller curvatures that help in maintaining the solution pressure and limit the wake-flow present at the rear of the rotor of the turbine. On the contrary, the power coefficient of each wind turbine followed a bell-curve relative to the TSR where the values increased then decreased until it reached a certain point that indicated its corresponding maximum power coefficient. The maximum power coefficient of the new design was observed at 0.2525 at a TSR of 0.80.

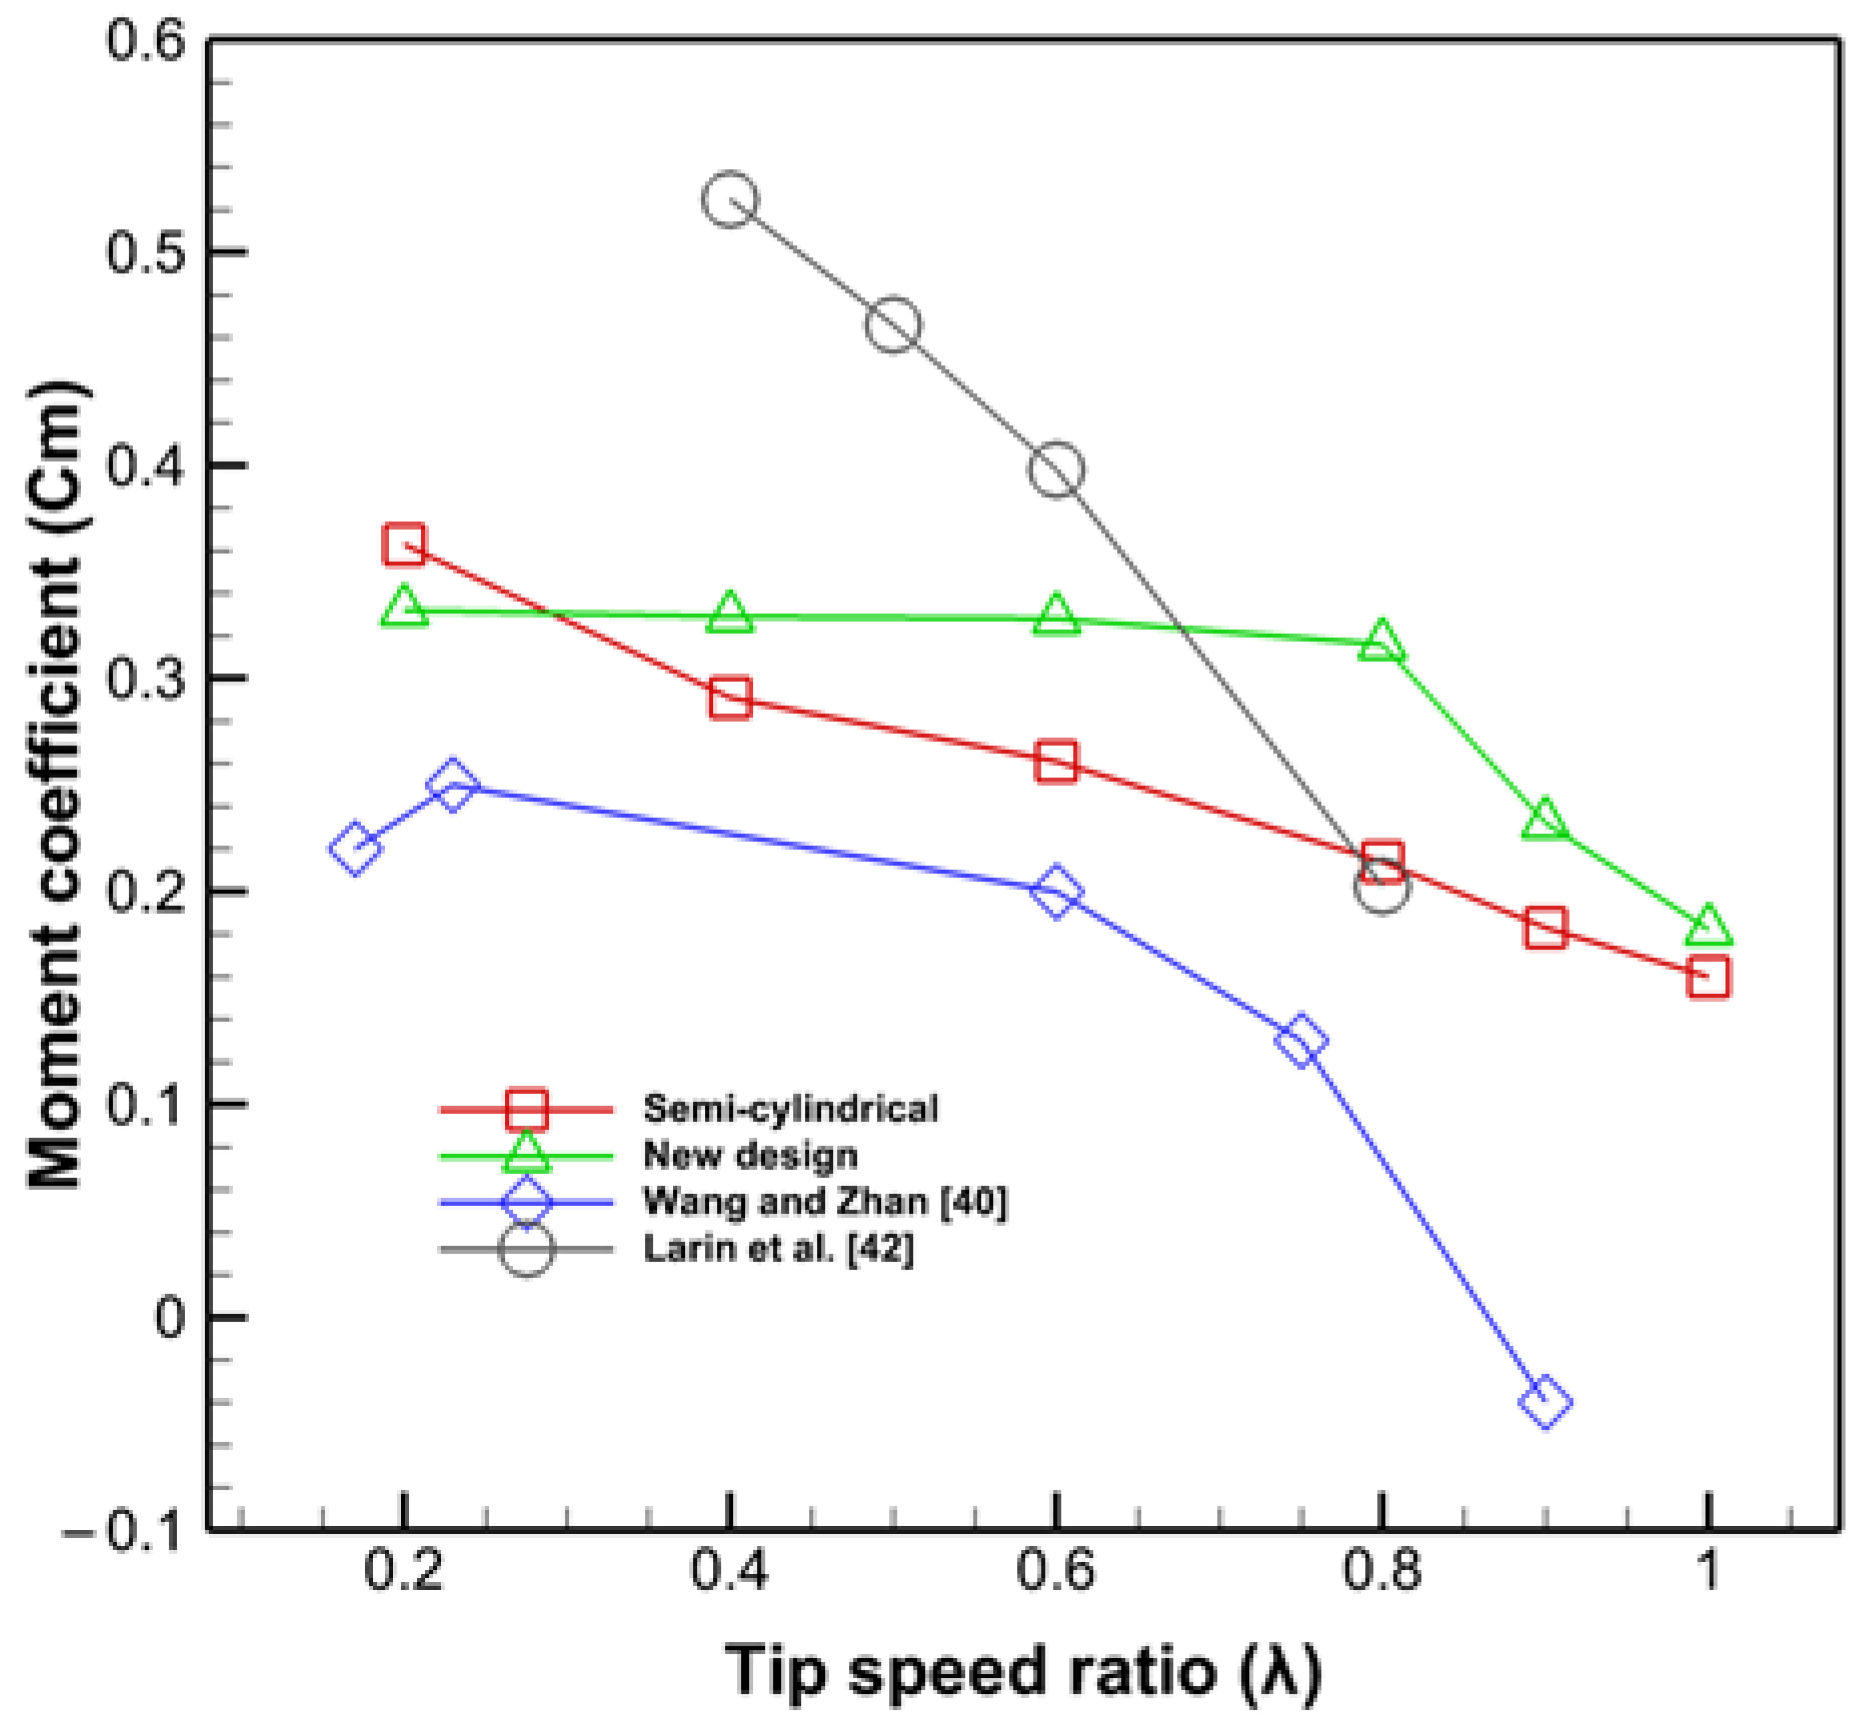
4.4. Discussion on the Comparison of the Results with Other Studies

In the dynamic condition analysis of the new SWT, the performance of the new design to the traditional SWT and other designs from past literature were compared. The maximum power coefficient of this new design is relatively higher than the previous designs presented by Wang and Zhan [40], the traditional semi-cylindrical SWT [40], the model of Wekesa et al. [41], and the prototype of Larin et al. [42] by 13.28%, 8.16%, 2.32%, and 1.38%, respectively. Hence, this work highlights the improvement of the maximum power coefficient compared with other studies.

5. Conclusions

A computational fluid dynamics (CFD) model was developed for a Savonius wind turbine (SWT) that considered various geometric parameters based on a space-filling design of experiments. The space-filling design considered the sphere packing method which worked well with the results of computational simulations such as CFD. A Gaussian stochastic process (GaSP) model was used to model fit the space-filling design results for the dependent variables and the response. With the application of the space-filling design, the study considered 30 distinct designs based on the combination of the parametric factors such as the diameter and height of the rotor as well as its angle of twist. The results have shown that the model fitted the GaSP model. The results revealed that the power coefficient is directly proportional to the performance parameters of the moment, moment coefficient, rotor height, and rotor diameter, while it was found that the power coefficient has shown a slight decrease while the twist angle increases. It was found that the maximum power coefficient of the optimized SWT design is 0.2525 at a tip speed ratio of 0.80. The maximum power coefficient was found to be superior with the SWT design of previous works. In addition, the results revealed that the optimized SWT design is capable of self-starting with relatively better performance compared to the other designs of previous works. Future work involves the simultaneous effects of the overlap ratio of the SWT and the influence of the inlet air velocity.

Author Contributions

Conceptualization, A.T.U. and R.S.; methodology, R.S.; validation, A.T.U., R.S. and J.D.P.C.; formal analysis, R.S.; investigation, R.S.; resources, A.T.U.; data curation, J.D.P.C.; writing—original draft preparation, R.S.; writing—review and editing, A.T.U. and J.D.P.C.; visualization, A.T.U. and J.D.P.C.; supervision, A.T.U.; project administration, A.T.U.; funding acquisition, A.T.U. and R.S. All authors have read and agreed to the published version of the manuscript.

Funding

This research received no external funding.

Institutional Review Board Statement

Not applicable.

Informed Consent Statement

Not applicable.

Data Availability Statement

Data available in a publicly accessible repository. The data presented in this study are openly available in [40,42].

Acknowledgments

The second author gratefully acknowledges the graduate scholarship support of the Government of Cambodia and the AUN/SEED-net.

Conflicts of Interest

The authors declare no conflict of interest.

References

  1. IEA. World Energy Outlook 2021; International Energy Agency: Paris, France, 2021; pp. 1–379. [Google Scholar]
  2. Calautit, K.; Aquino, A.; Calautit, J.K.; Nejat, P.; Jomehzadeh, F.; Hughes, B.R. A Review of Numerical Modelling of Multi-Scale Wind Turbines and Their Environment. Computation 2018, 6, 24. [Google Scholar] [CrossRef] [Green Version]
  3. WWEA. New Study Proves: Community Power Is Increasingly Being Marginalised; The World Wind Energy Association: Bonn, Germany, 2019. [Google Scholar]
  4. Micallef, D.; Van Bussel, G. A Review of Urban Wind Energy Research: Aerodynamics and Other Challenges. Energies 2018, 11, 2204. [Google Scholar] [CrossRef] [Green Version]
  5. Škvorc, P.; Kozmar, H. Wind energy harnessing on tall buildings in urban environments. Renew. Sustain. Energy Rev. 2021, 152, 111662. [Google Scholar] [CrossRef]
  6. Ramsebner, J.; Haas, R.; Auer, H.; Ajanovic, A.; Gawlik, W.; Maier, C.; Nemec-Begluk, S.; Nacht, T.; Puchegger, M. From single to multi-energy and hybrid grids: Historic growth and future vision. Renew. Sustain. Energy Rev. 2021, 151, 111520. [Google Scholar] [CrossRef]
  7. Naderipour, A.; Abdul-Malek, Z.; Mustafa, M.W.B.; Guerrero, J.M. A multi-objective artificial electric field optimization algorithm for allocation of wind turbines in distribution systems. Appl. Soft Comput. 2021, 105, 107278. [Google Scholar] [CrossRef]
  8. Hand, B.; Kelly, G.; Cashman, A. Aerodynamic design and performance parameters of a lift-type vertical axis wind turbine: A comprehensive review. Renew. Sustain. Energy Rev. 2021, 139, 110699. [Google Scholar] [CrossRef]
  9. Tasneem, Z.; Al Noman, A.; Das, S.K.; Saha, D.K.; Islam, M.R.; Ali, M.F.; Badal, R.M.F.; Ahamed, M.H.; Moyeen, S.I.; Alam, F. An analytical review on the evaluation of wind resource and wind turbine for urban application: Prospect and challenges. Dev. Built Environ. 2020, 4, 100033. [Google Scholar] [CrossRef]
  10. Chrysochoidis-Antsos, N.; Amoros, A.V.; van Bussel, G.J.W.; Mertens, S.M.; van Wijk, A.J.M. Wind resource characteristics and energy yield for micro wind turbines integrated on noise barriers—An experimental study. J. Wind. Eng. Ind. Aerodyn. 2020, 203, 104206. [Google Scholar] [CrossRef]
  11. Kim, S.; Cheong, C. Development of low-noise drag-type vertical wind turbines. Renew. Energy 2015, 79, 199–208. [Google Scholar] [CrossRef]
  12. Mohamed, M.H.; Alqurashi, F.; Thévenin, D. Performance enhancement of a Savonius turbine under effect of frontal guiding plates. Energy Rep. 2021, 7, 6069–6076. [Google Scholar] [CrossRef]
  13. Marinić-Kragić, I.; Vučina, D.; Milas, Z. Global optimization of Savonius-type vertical axis wind turbine with multiple circular-arc blades using validated 3D CFD model. Energy 2022, 241, 122841. [Google Scholar] [CrossRef]
  14. Aboujaoude, H.; Beaumont, F.; Murer, S.; Polidori, G.; Bogard, F. Aerodynamic performance enhancement of a Savonius wind turbine using an axisymmetric deflector. J. Wind. Eng. Ind. Aerodyn. 2022, 220, 104882. [Google Scholar] [CrossRef]
  15. Dewan, A.; Gautam, A.; Goyal, R. Savonius wind turbines: A review of recent advances in design and performance enhancements. Mater. Today Proc. 2021, 47, 2976–2983. [Google Scholar] [CrossRef]
  16. Yahya, W.; Ziming, K.; Juan, W.; Qurashi, M.S.; Al-Nehari, M.; Salim, E. Influence of tilt angle and the number of guide vane blades towards the Savonius rotor performance. Energy Rep. 2021, 7, 3317–3327. [Google Scholar] [CrossRef]
  17. Saad, A.S.; Elwardany, A.; El-Sharkawy, I.I.; Ookawara, S.; Ahmed, M. Performance evaluation of a novel vertical axis wind turbine using twisted blades in multi-stage Savonius rotors. Energy Convers. Manag. 2021, 235, 114013. [Google Scholar] [CrossRef]
  18. Irabu, K.; Roy, J.N. Characteristics of wind power on Savonius rotor using a guide-box tunnel. Exp. Therm. Fluid Sci. 2007, 32, 580–586. [Google Scholar] [CrossRef]
  19. Tjahjana, D.D.D.P.; Arifin, Z.; Suyitno, S.; Juwana, W.E.; Prabowo, A.R.; Harsito, C. Experimental study of the effect of slotted blades on the Savonius wind turbine performance. Theor. Appl. Mech. Lett. 2021, 11, 100249. [Google Scholar] [CrossRef]
  20. Xu, W.; Li, C.-C.; Huang, S.-X.; Wang, Y. Aerodynamic performance improvement analysis of Savonius Vertical Axis Wind Turbine utilizing plasma excitation flow control. Energy 2022, 239, 122133. [Google Scholar] [CrossRef]
  21. Al-Ghriybah, M.; Fadhli Zulkafli, M.; Hissein Didane, D.; Mohd, S. The effect of spacing between inner blades on the performance of the Savonius wind turbine. Sustain. Energy Technol. Assess. 2021, 43, 100988. [Google Scholar] [CrossRef]
  22. Berhanu, H.; Gudeta, D.; Haiter Lenin, A.; Karthikeyan, B. Numerical and experimental investigation of an exhaust air energy recovery Savonius wind turbine for power production. Mater. Today: Proc. 2021, 46, 4142–4152. [Google Scholar] [CrossRef]
  23. Pranta, M.H.; Rabbi, M.S.; Roshid, M.M. A computational study on the aerodynamic performance of modified savonius wind turbine. Results Eng. 2021, 10, 100237. [Google Scholar] [CrossRef]
  24. Marzec, Ł.; Buliński, Z.; Krysiński, T. Fluid structure interaction analysis of the operating Savonius wind turbine. Renew. Energy 2021, 164, 272–284. [Google Scholar] [CrossRef]
  25. Marinić-Kragić, I.; Vučina, D.; Milas, Z. Computational analysis of Savonius wind turbine modifications including novel scooplet-based design attained via smart numerical optimization. J. Clean. Prod. 2020, 262, 121310. [Google Scholar] [CrossRef]
  26. Elsisi, M.; Tran, M.Q.; Mahmoud, K.; Lehtonen, M.; Darwish, M.M.F. Robust Design of ANFIS-Based Blade Pitch Controller for Wind Energy Conversion Systems Against Wind Speed Fluctuations. IEEE Access 2021, 9, 37894–37904. [Google Scholar] [CrossRef]
  27. Zalhaf, A.S.; Mansour, D.E.A.; Han, Y.; Yang, P.; Yang, P.; Darwish, M.M.F. Numerical and Experimental Analysis of the Transient Behavior of Wind Turbines when Two Blades are Simultaneously Struck by Lightning. IEEE Trans. Instrum. Meas. 2021, 1. [Google Scholar] [CrossRef]
  28. Sayed, A.M.; Abouelatta, M.A.; Badawi, M.; Mahmoud, K.; Lehtonen, M.; Darwish, M.M.F. Novel accurate modeling of dust loaded wire-duct precipitators using FDM-FMG method on one fine computational domains. Electr. Power Syst. Res. 2022, 203, 107634. [Google Scholar] [CrossRef]
  29. Abouelatta, M.A.; Ward, S.A.; Sayed, A.M.; Mahmoud, K.; Lehtonen, M.; Darwish, M.M.F. Fast Corona Discharge Assessment Using FDM integrated With Full Multigrid Method in HVDC Transmission Lines Considering Wind Impact. IEEE Access 2020, 8, 225872–225883. [Google Scholar] [CrossRef]
  30. Sonawane, C.R.; Sasar, Y.; Shaikh, M.; Kokande, Y.; Mustafa, M.; Pandey, A. Numerical simulation of Savonius rotors used for low wind speed application. Mater. Today Proc. 2022, 49, 1610–1616. [Google Scholar] [CrossRef]
  31. Xiong, Z.; Liu, L.; Ning, J.; Qin, H. Sphere packing design for experiments with mixtures. Stat. Probab. Lett. 2020, 164, 108807. [Google Scholar] [CrossRef]
  32. Azadani, L.N.; Gharouni, N. Multi objective optimization of cylindrical shape roughness parameters in a solar air heater. Renew. Energy 2021, 179, 1156–1168. [Google Scholar] [CrossRef]
  33. Glyn-Davies, A.; Girolami, M. Anomaly detection in streaming data with gaussian process based stochastic differential equations. Pattern Recognit. Lett. 2022, 153, 254–260. [Google Scholar] [CrossRef]
  34. Mathew, S. Wind Energy: Fundamentals, Resource Analysis and Economics; Springer: Berlin/Heidelberg, Germany, 2006. [Google Scholar]
  35. Barlow, J.B.; Rae, W.H.; Pope, A. Low-Speed Wind Tunnel Testing; Wiley: Hoboken, NJ, USA, 1999. [Google Scholar]
  36. Fang, K.-T.; Lin, Y.; Peng, H. A new type of robust designs for chemometrics and computer experiments. Chemom. Intell. Lab. Syst. 2022, 221, 104474. [Google Scholar] [CrossRef]
  37. Jones, B.; Johnson, R.T. Design and analysis for the Gaussian process model. Qual. Reliab. Eng. Int. 2009, 25, 515–524. [Google Scholar] [CrossRef] [Green Version]
  38. Lee, J.-H.; Lee, Y.-T.; Lim, H.-C. Effect of twist angle on the performance of Savonius wind turbine. Renew. Energy 2016, 89, 231–244. [Google Scholar] [CrossRef]
  39. Saad, A.S.; El-Sharkawy, I.I.; Ookawara, S.; Ahmed, M. Performance enhancement of twisted-bladed Savonius vertical axis wind turbines. Energy Convers. Manag. 2020, 209, 112673. [Google Scholar] [CrossRef]
  40. Wang, Y.-F.; Zhan, M.-S. 3-Dimensional CFD simulation and analysis on performance of a micro-wind turbine resembling lotus in shape. Energy Build. 2013, 65, 66–74. [Google Scholar] [CrossRef]
  41. Wekesa, D.; Wang, C.; Wei, Y.-J.; Zhu, W. Experimental and numerical study of turbulence effect on aerodynamic performance of a small-scale vertical axis wind turbine. J. Wind. Eng. Ind. Aerodyn. 2016, 157, 1–14. [Google Scholar] [CrossRef]
  42. Larin, P.; Paraschivoiu, M.; Aygun, C. CFD based synergistic analysis of wind turbines for roof mounted integration. J. Wind. Eng. Ind. Aerodyn. 2016, 156, 1–13. [Google Scholar] [CrossRef]
Figure 1. An example of the geometric model of the SWT.
Wind 02 00007 g001
Figure 2. The geometry simulation setup.
Wind 02 00007 g002
Figure 3. The separated cell zone of the simulation.
Wind 02 00007 g003
Figure 4. Mesh of the simulation setup.
Wind 02 00007 g004
Figure 5. Top view of the rotor showing the mesh near the walls of the rotor.
Wind 02 00007 g005
Figure 6. Mesh independence test in terms of orthogonal quality and skewness value.
Wind 02 00007 g006
Figure 7. Model fitting of the power coefficient using the GaSP model.
Wind 02 00007 g007
Figure 8. The interaction plot of the power coefficient versus the performance parameters.
Wind 02 00007 g008
Figure 9. The profiler plot regarding the power coefficient versus the (a) diameter, (b) height, (c) twist angle, (d) moment, and (e) moment coefficient.
Wind 02 00007 g009
Figure 10. The relationship between the static moment coefficient of the new SWT versus its angle of attack.
Wind 02 00007 g010
Figure 11. The relationship between the static moment coefficient of the traditional SWT wind turbine with semi-cylindrical shape versus its angle of attack.
Wind 02 00007 g011
Figure 12. The behavior of the dynamic moment coefficient versus the TSR of the different SWT.
Wind 02 00007 g012
Figure 13. The behavior of the power coefficient versus the TSR of the various SWT.
Wind 02 00007 g013
Table 1. Summary table of the values of the mesh independent testing.
Mesh Sizing (Relevance Center, Relevance)Number of NodesAspect
Ratio
Skewness ValueOrthogonal Quality
Coarse (−100)29,6361.9420.2540.844
Coarse (0)68,7091.8980.2450.85
Medium (0)77,0401.8950.2430.851
Fine (0)107,6901.880.240.853
Fine (100)313,8221.8360.2210.862
Table 2. Summary of the parameters used in the sphere-packing design method adopted from Lee et al. [38].
FactorsRoleValues
Rotor Diameter (m)Continuous0.29 to 0.40
Rotor Height (m)Continuous0.16 to 0.35
Twist Angle (degree)Continuous15 to 65
Table 3. Summary table of the θ-values of each parameter.
Parametersθ-Values
Rotor Diameter0.93
Rotor Height7.80 × 10−7
Twist Angle
Moment
0
0
Moment Coefficient (Cm)0.63
Table 4. The results of the GaSP model fit.
Fitted   Mean   ( μ ) Variance   ( σ 2 ) Nugget
0.2960.5648.11 × 10−8
Table 5. The r′ values.
No.R
11866.17
2−2635.16
3−2803.35
41206.91
54019.12
6−2056.81
73222.55
886.46
92043.26
101946.31
112394.82
12−4339.64
13−1982.76
142257.21
152195.78
16183.21
17945.57
181150.75
19−1056.43
20−1425.85
213564.55
22−1442.13
23−420.78
24−2082.96
25−64.14
26−5626.42
27−826.45
281014.12
29−540.61
30−793.3
Publisher’s Note: MDPI stays neutral with regard to jurisdictional claims in published maps and institutional affiliations.

