
Responses of a Modular Floating Wind TLP of MarsVAWT Supporting a 10 MW Vertical Axis Wind Turbine

 and
and
Abstract
:1. Introduction
2. Floating Wind TLP for 10 MW VAWT
2.1. Modular Foundation for Floating Offshore Wind Turbines
2.2. MarsVAWT TLP Design for 10 MW VAWT
2.2.1. Design of MarsVAWT
2.2.2. 10 MW VAWT
3. Materials and Methods
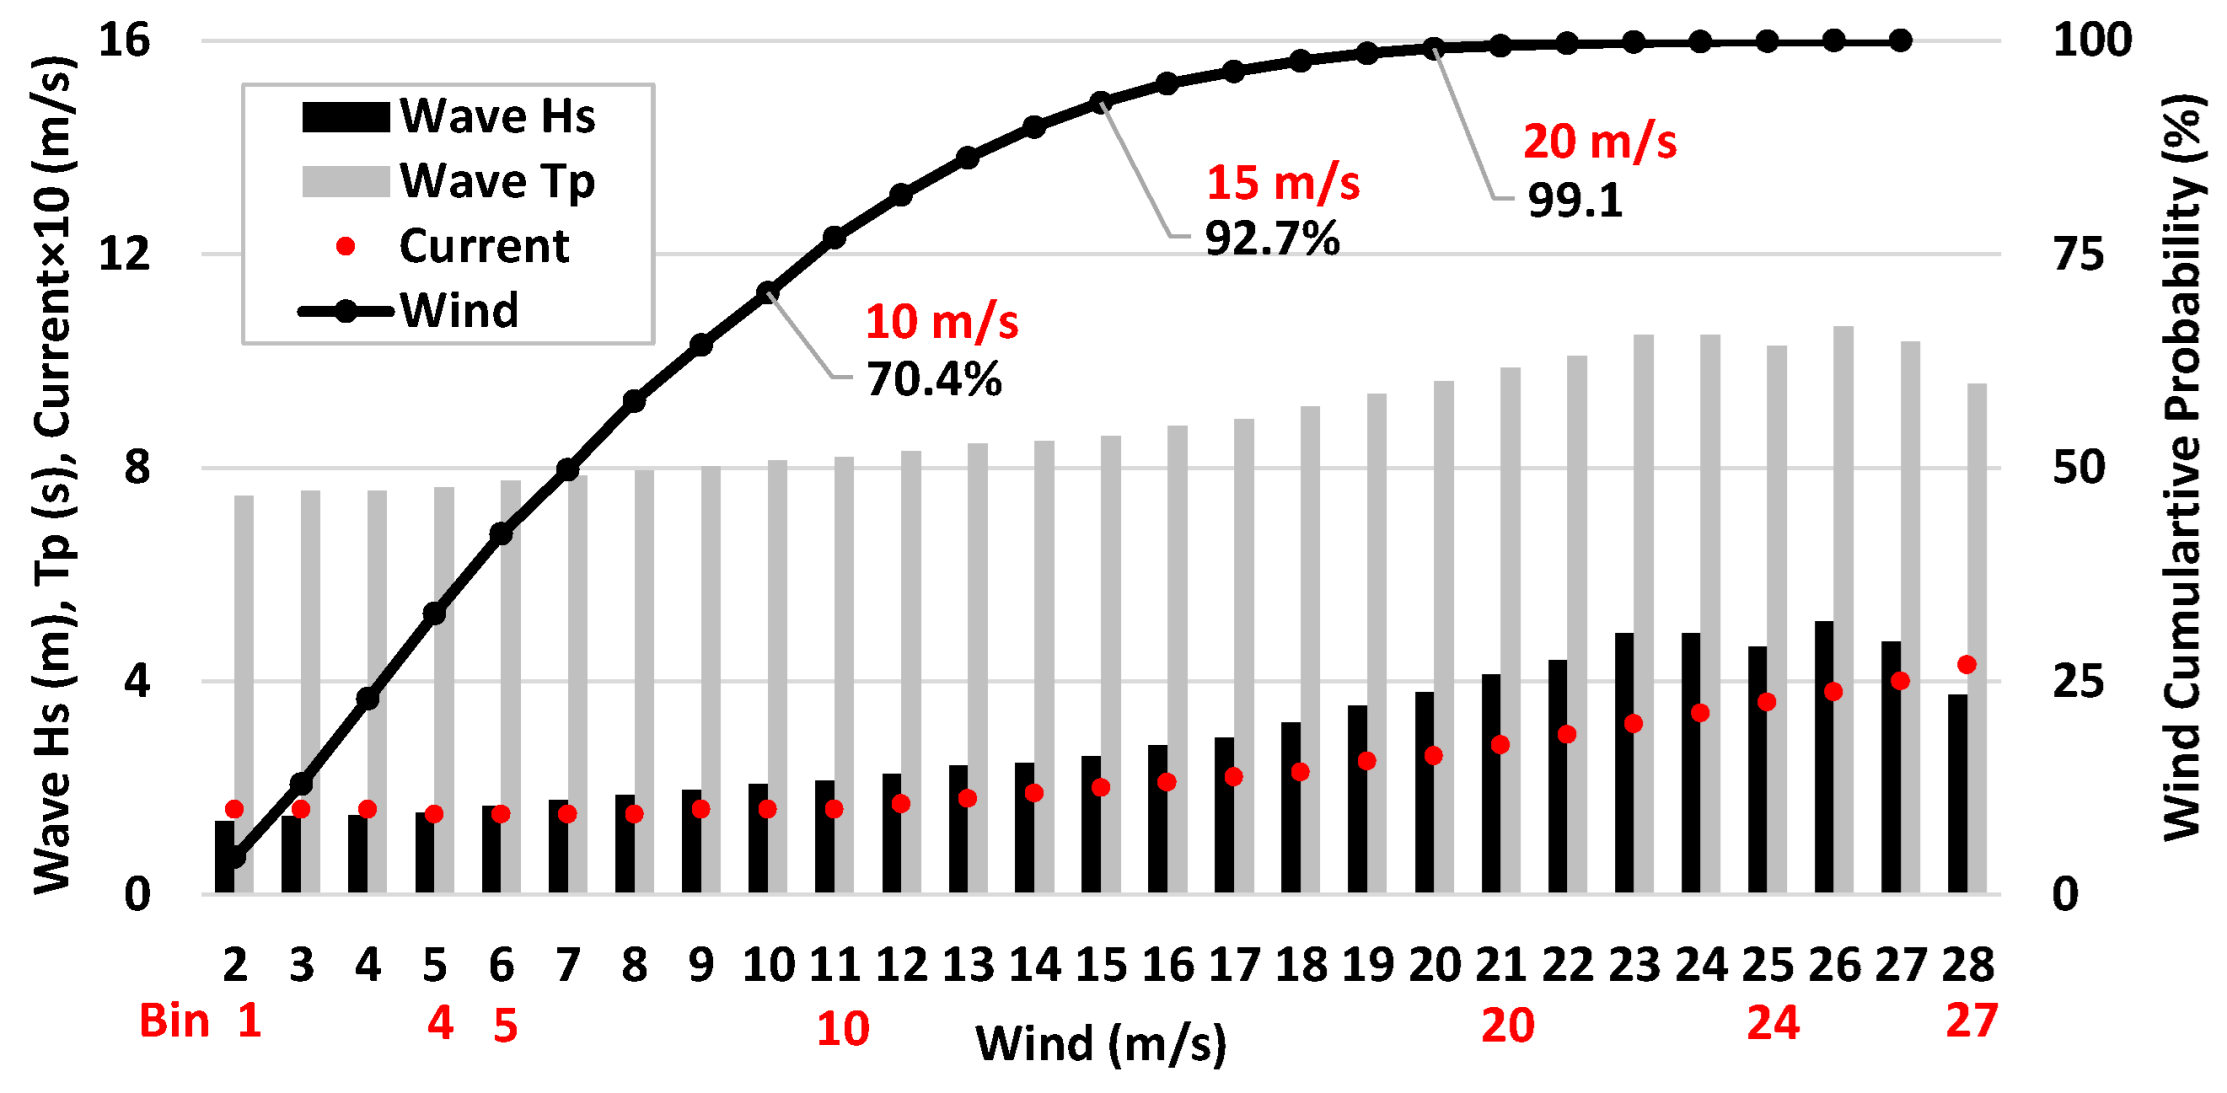
3.1. Site and Design Load Cases
3.2. Wind and Current Drag Forces
3.3. Platform Viscous Damping
3.4. Time-Domain Semi-Coupled Analysis
3.5. Flexible Tower Modeling of VAWT System
3.6. Mooring System Stiffness
3.7. Platform System Identification
3.7.1. Offset, Setdown, and Restoring Force
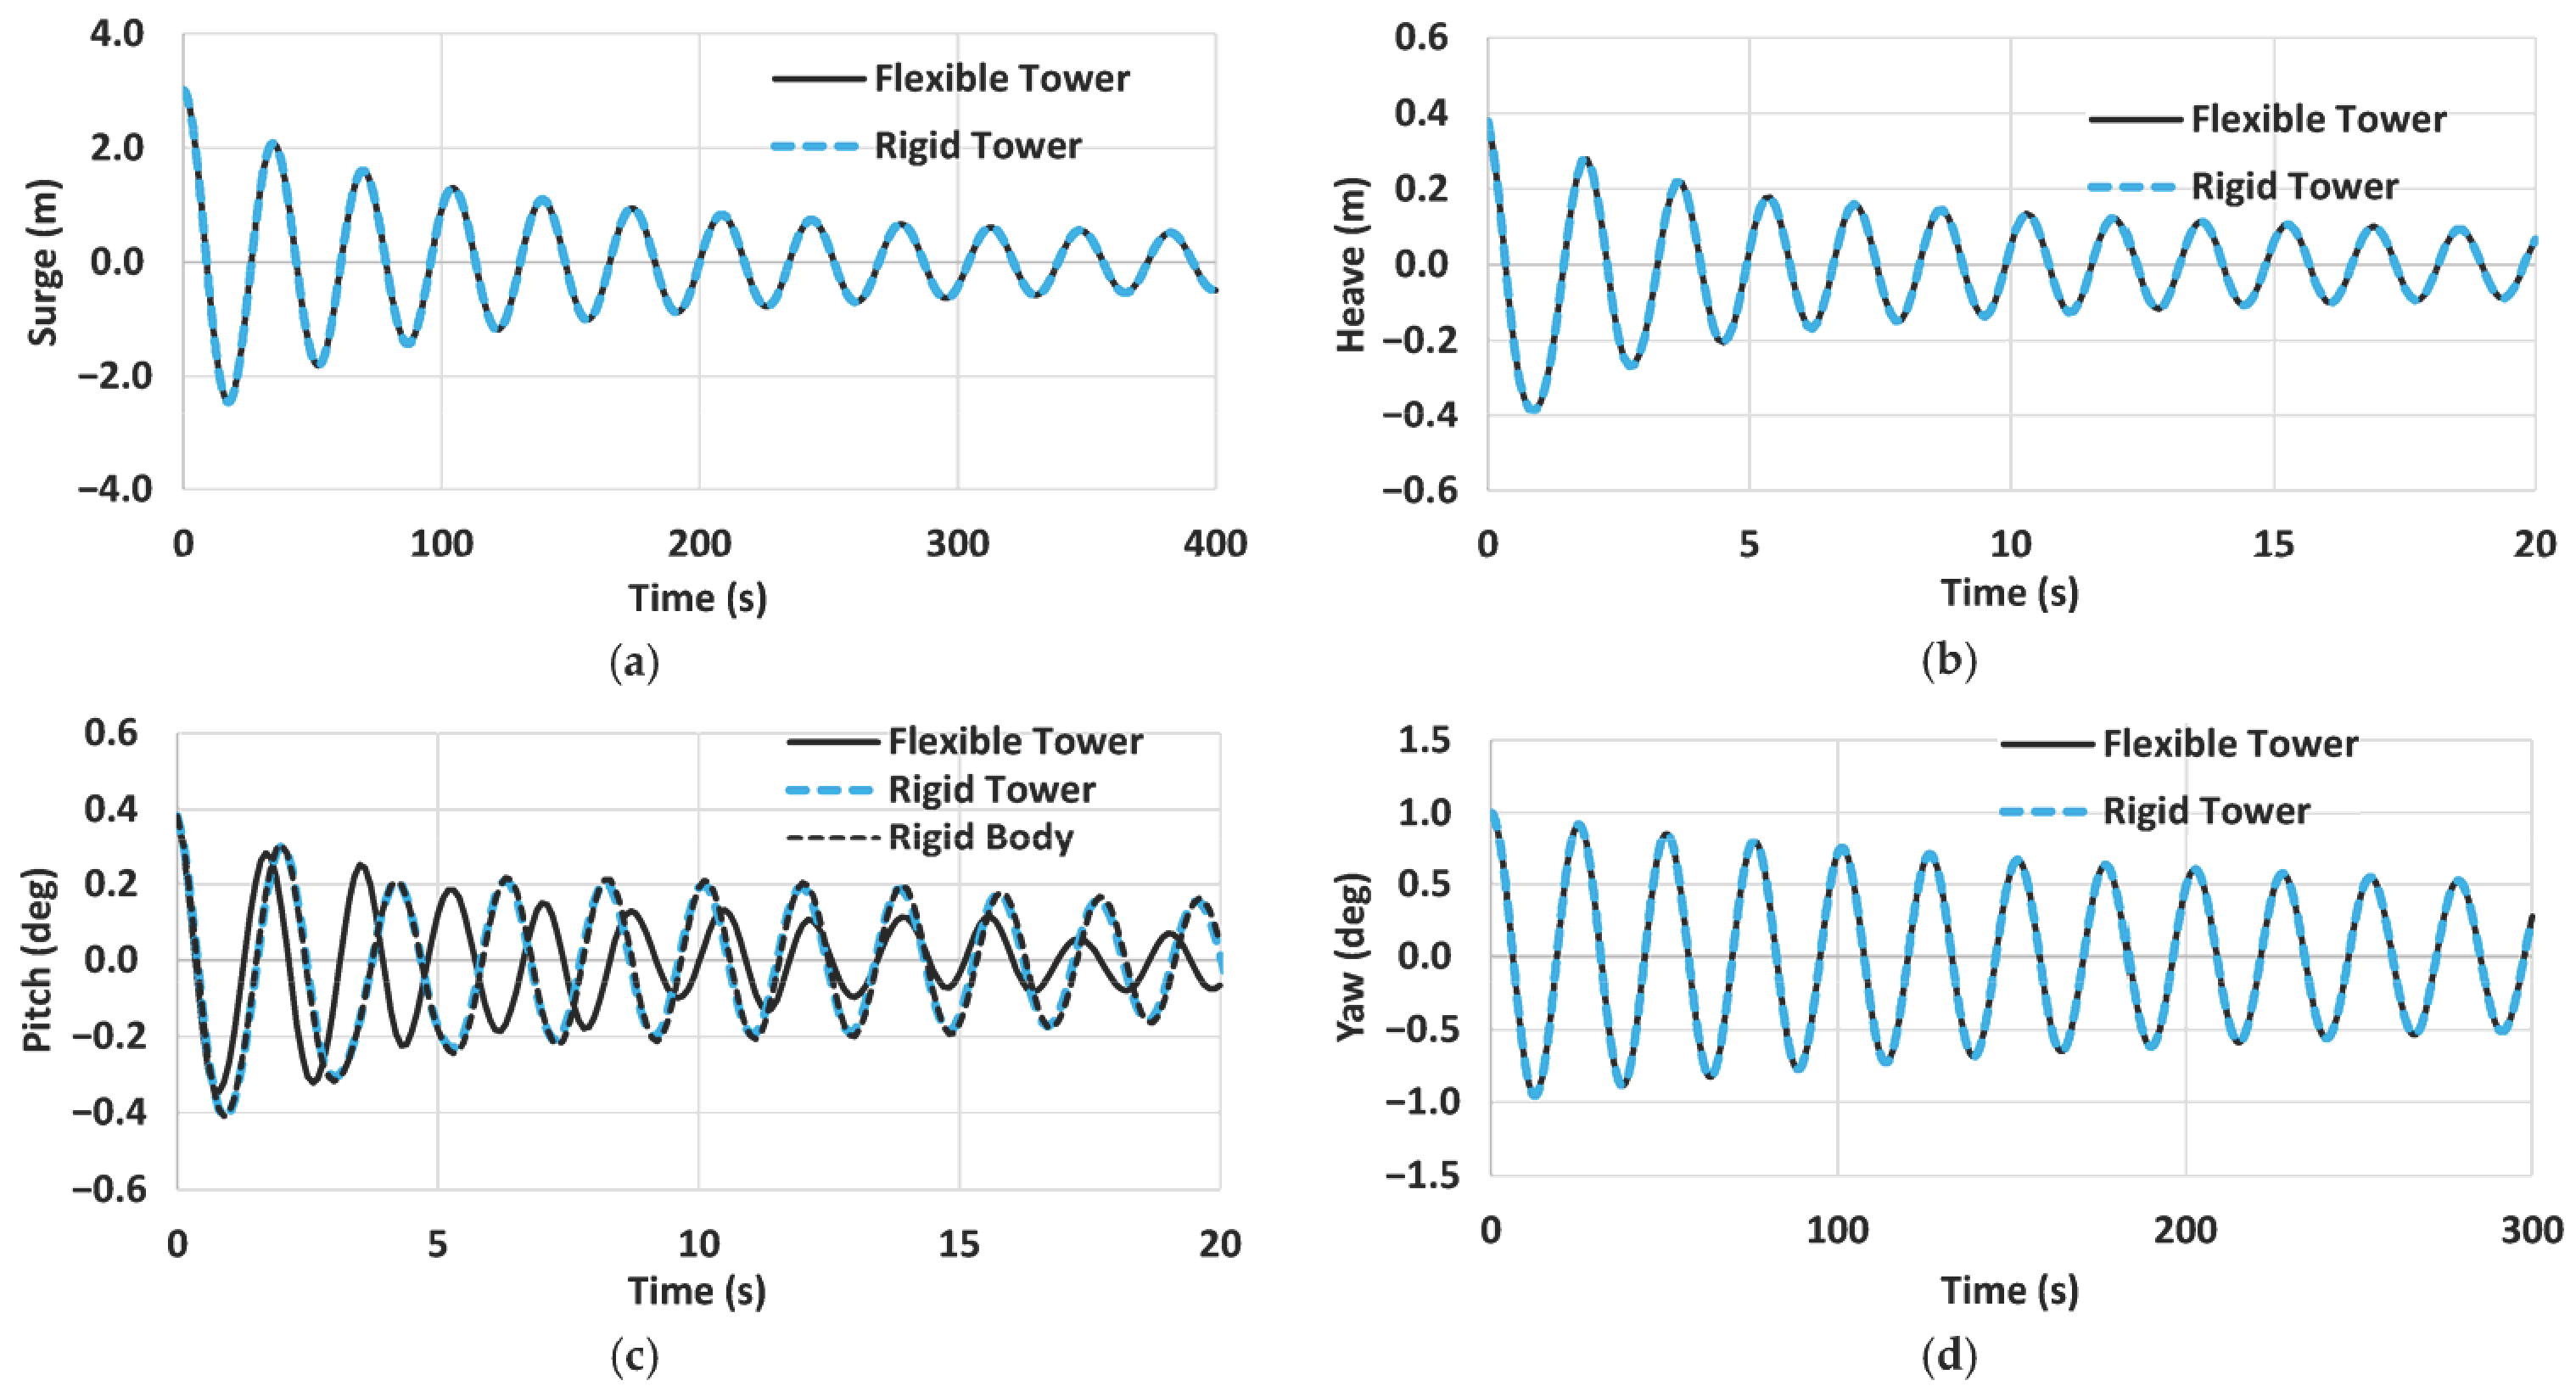
3.7.2. Platform Decay Tests and Natural Periods
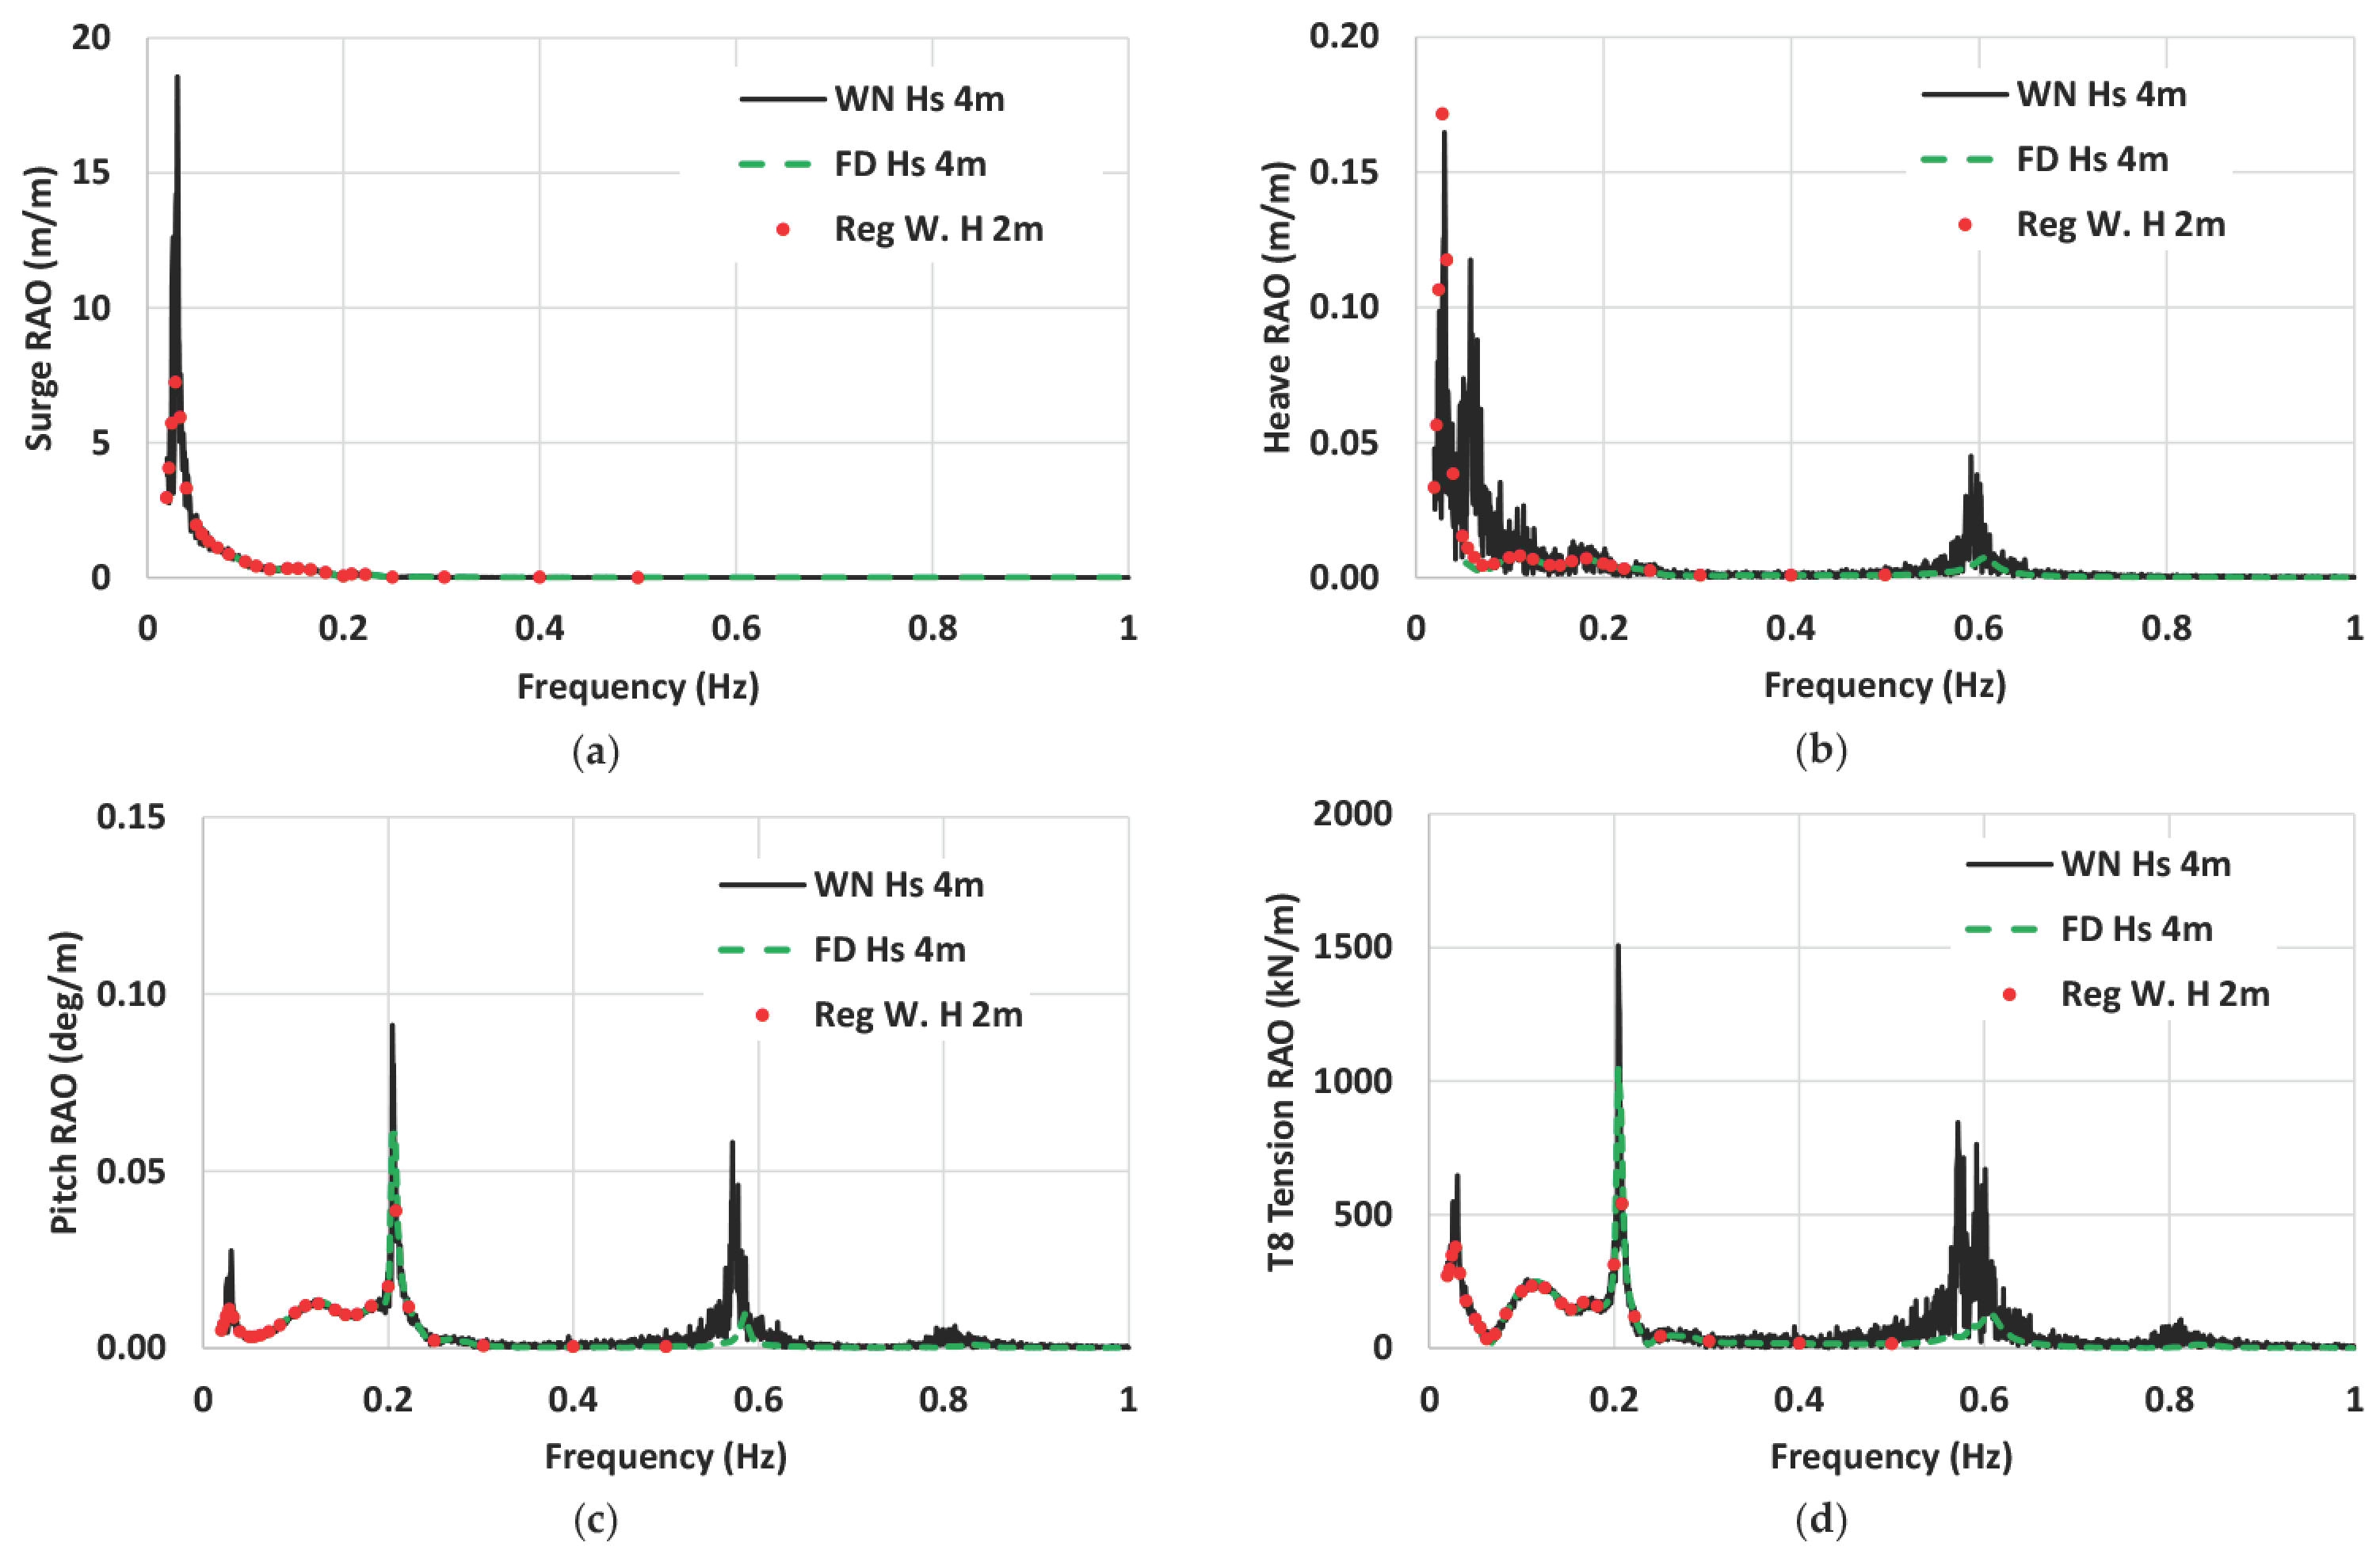
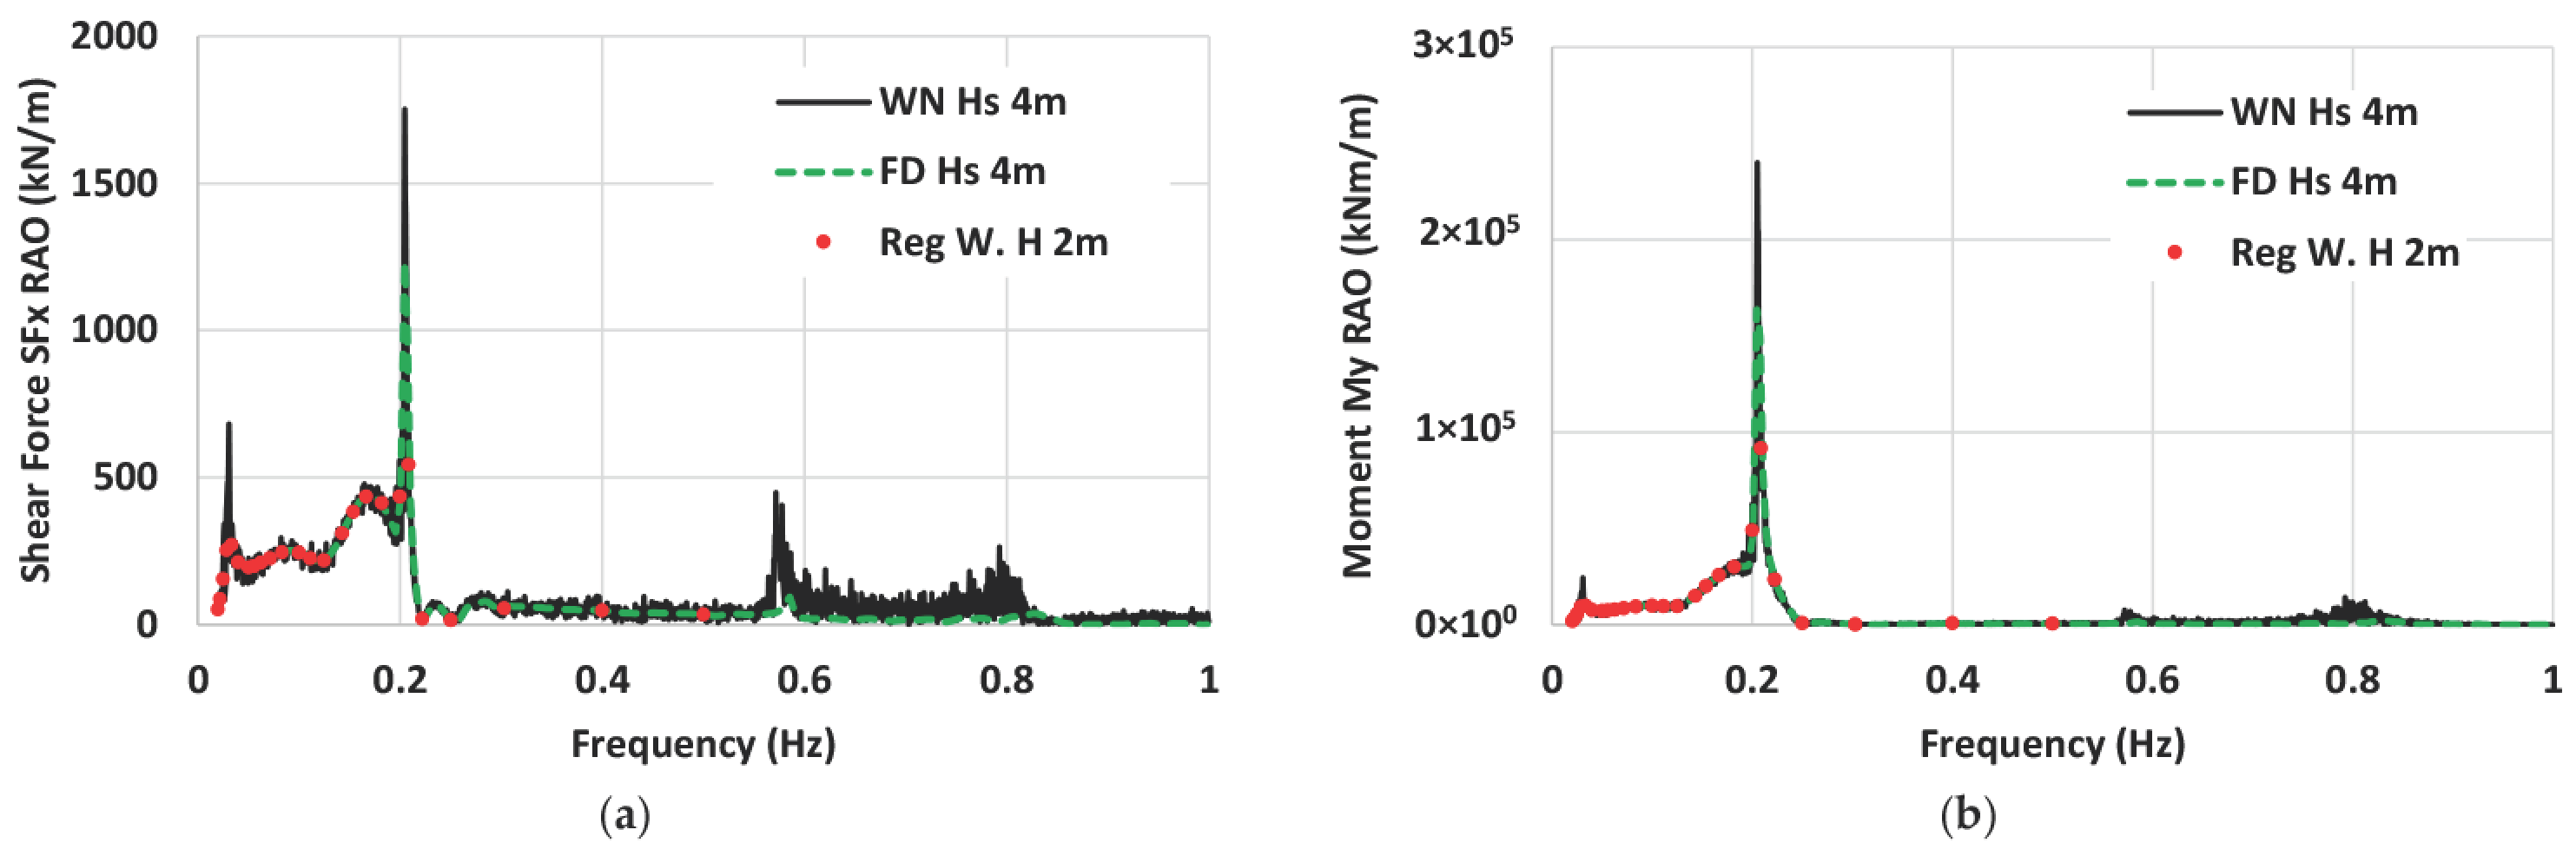
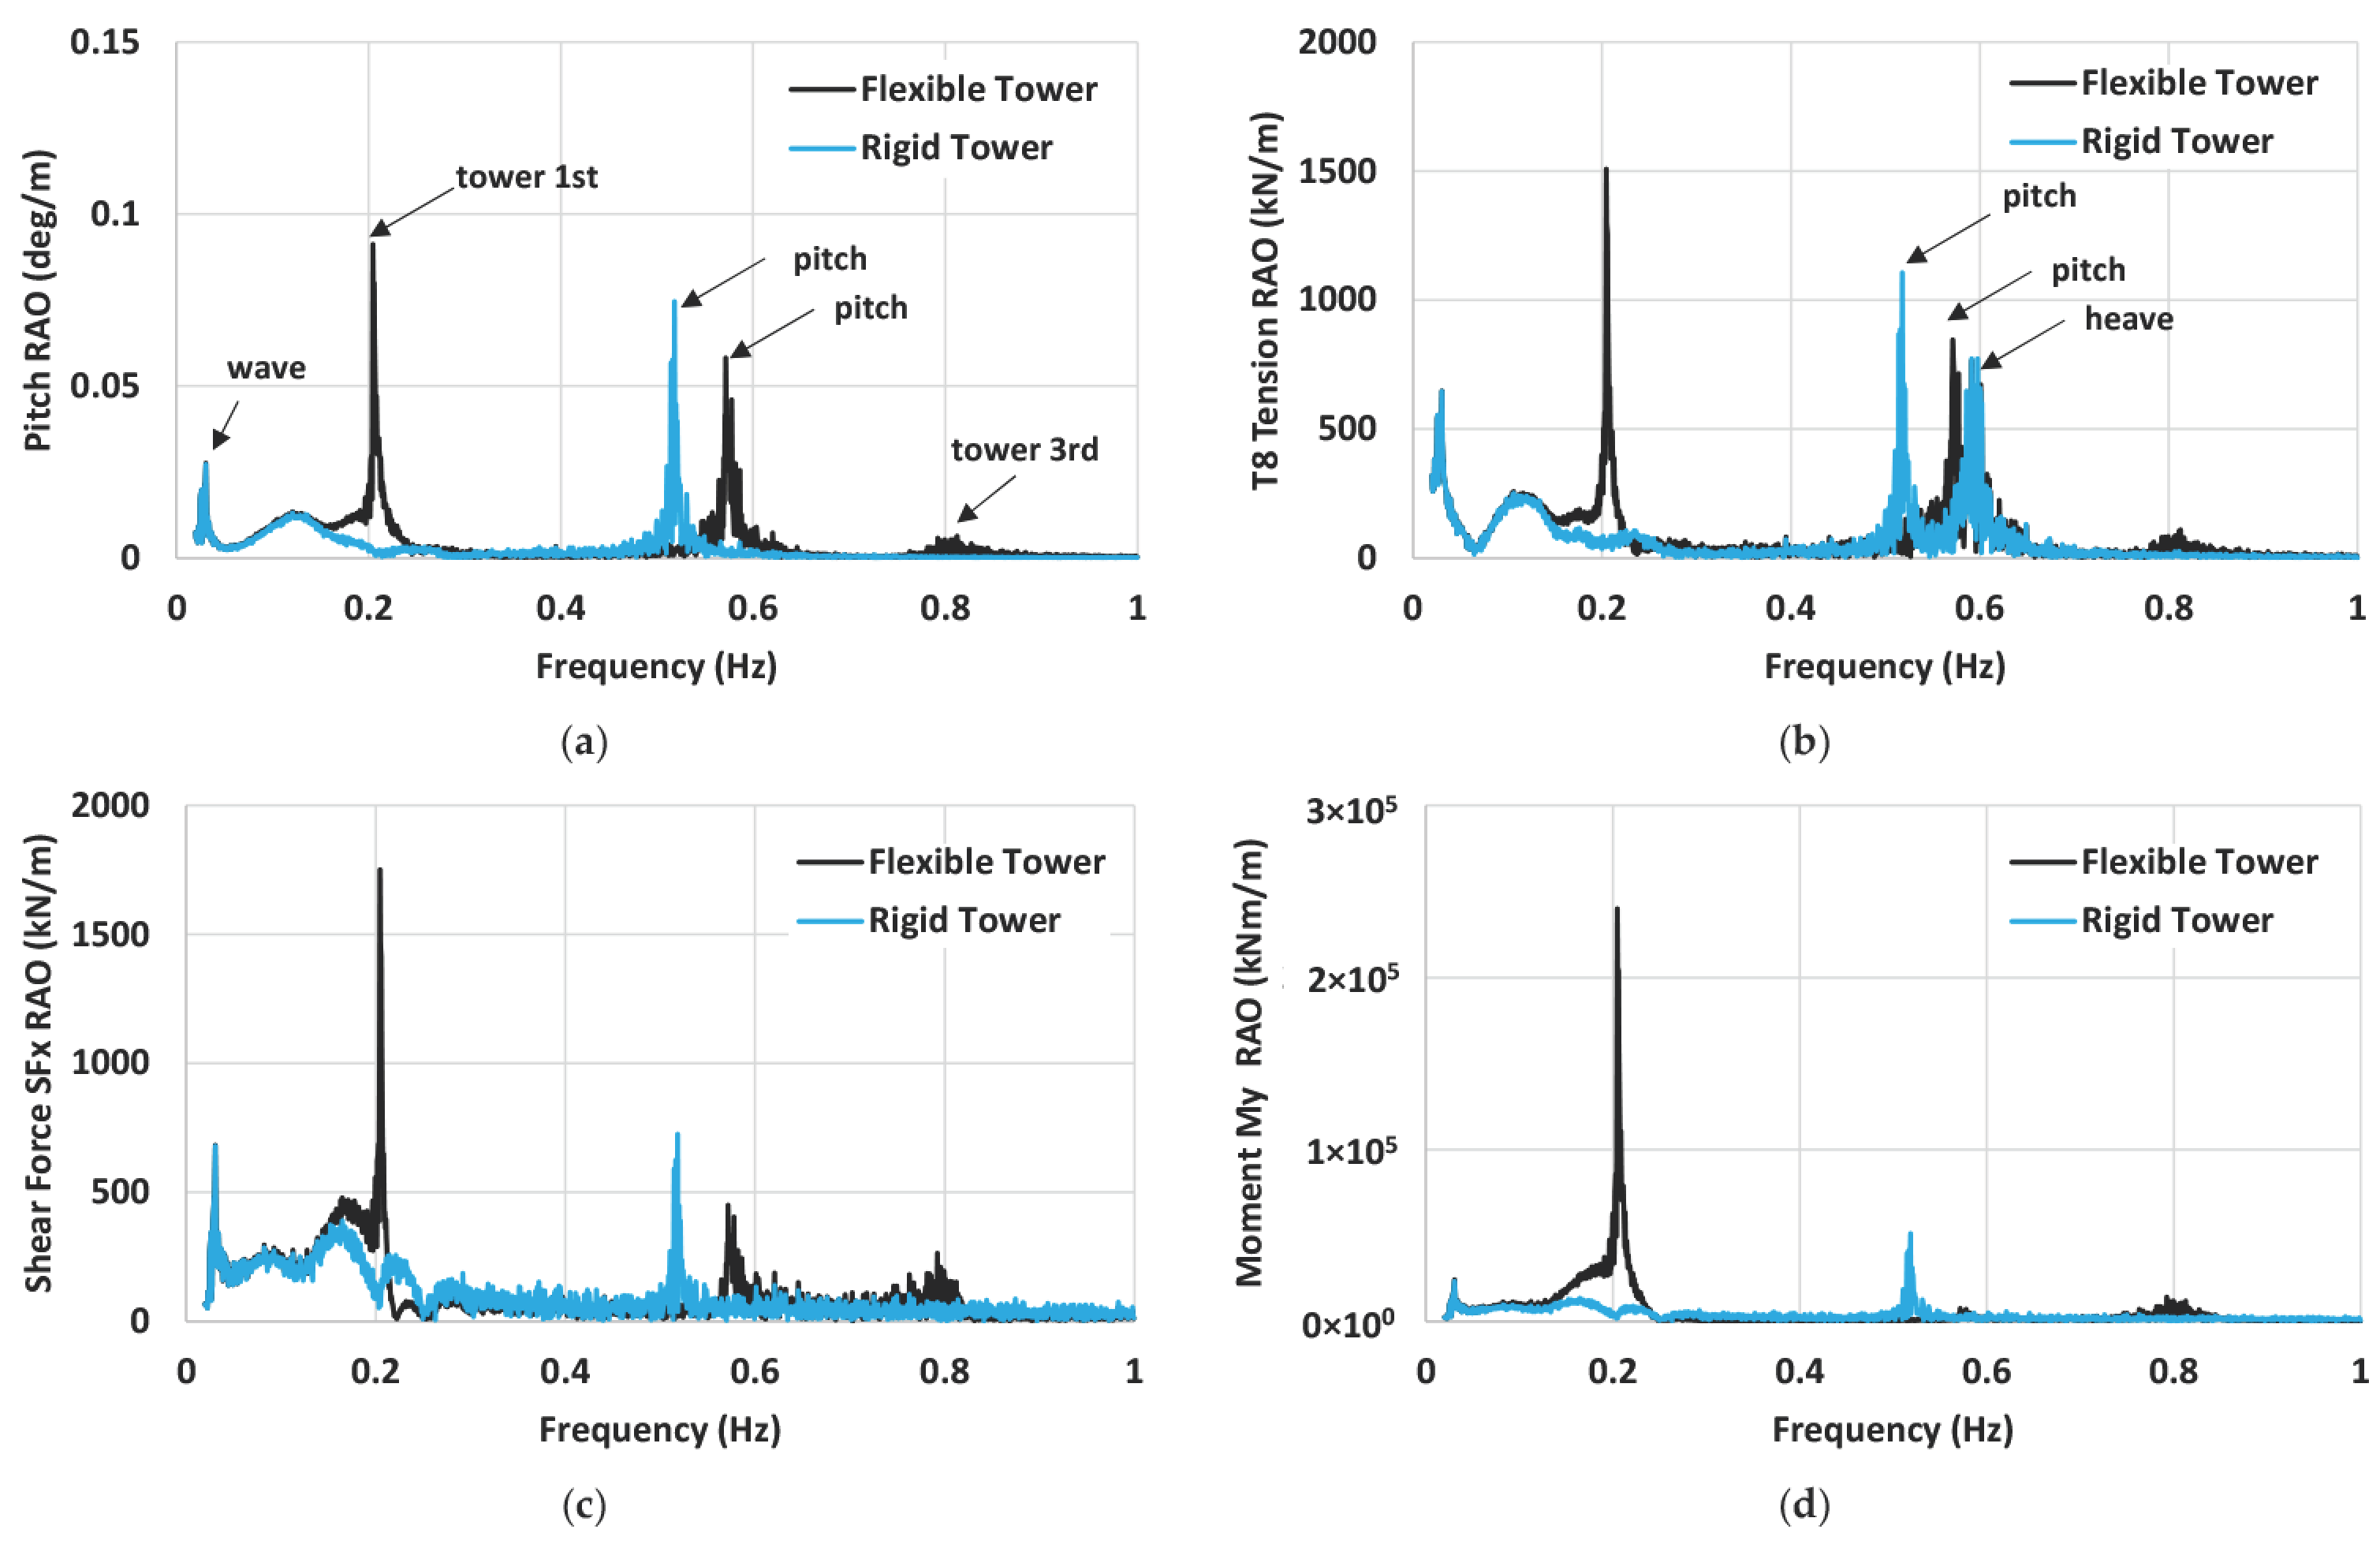
3.7.3. Platform and Tower Base Load RAOs
4. Results and Discussion
4.1. Turbine Responses with Flexible Tower (DLC 1.6)
4.2. Platform Motion Responses (DLC 1.6)
4.3. Tendon Tension Responses (DLC 1.6)
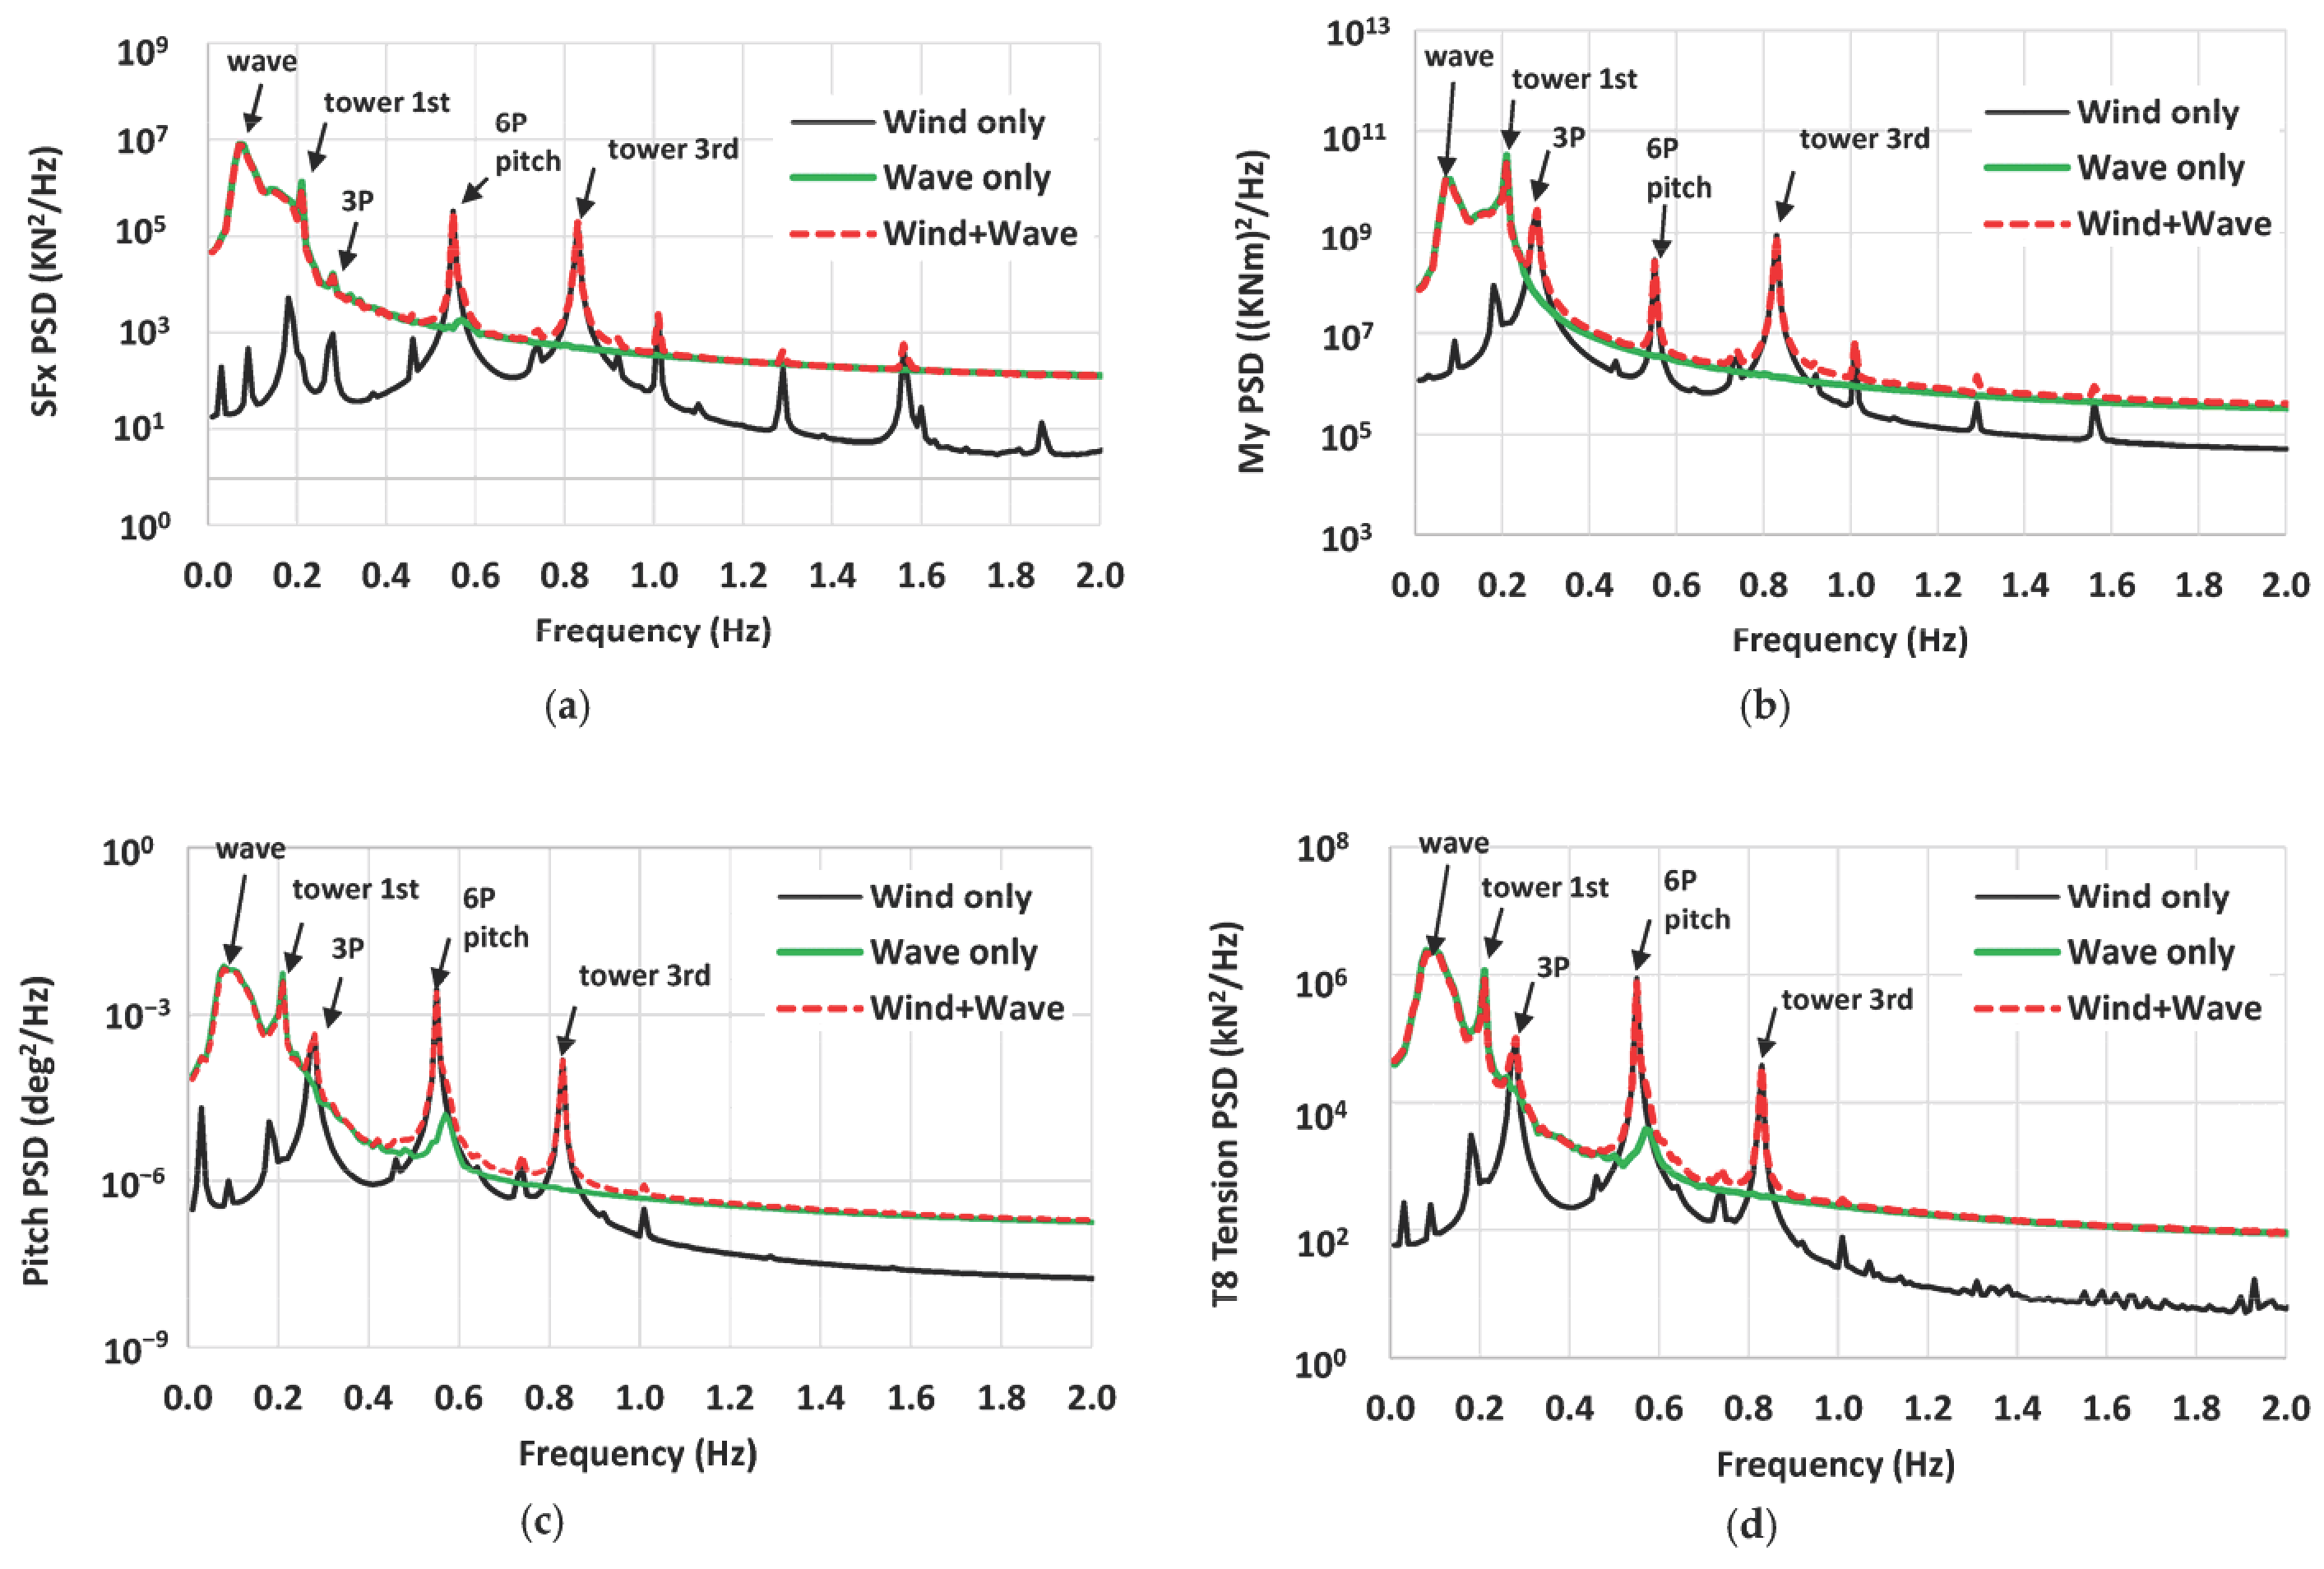
4.4. Power Spetral Densities (DLC 1.6)
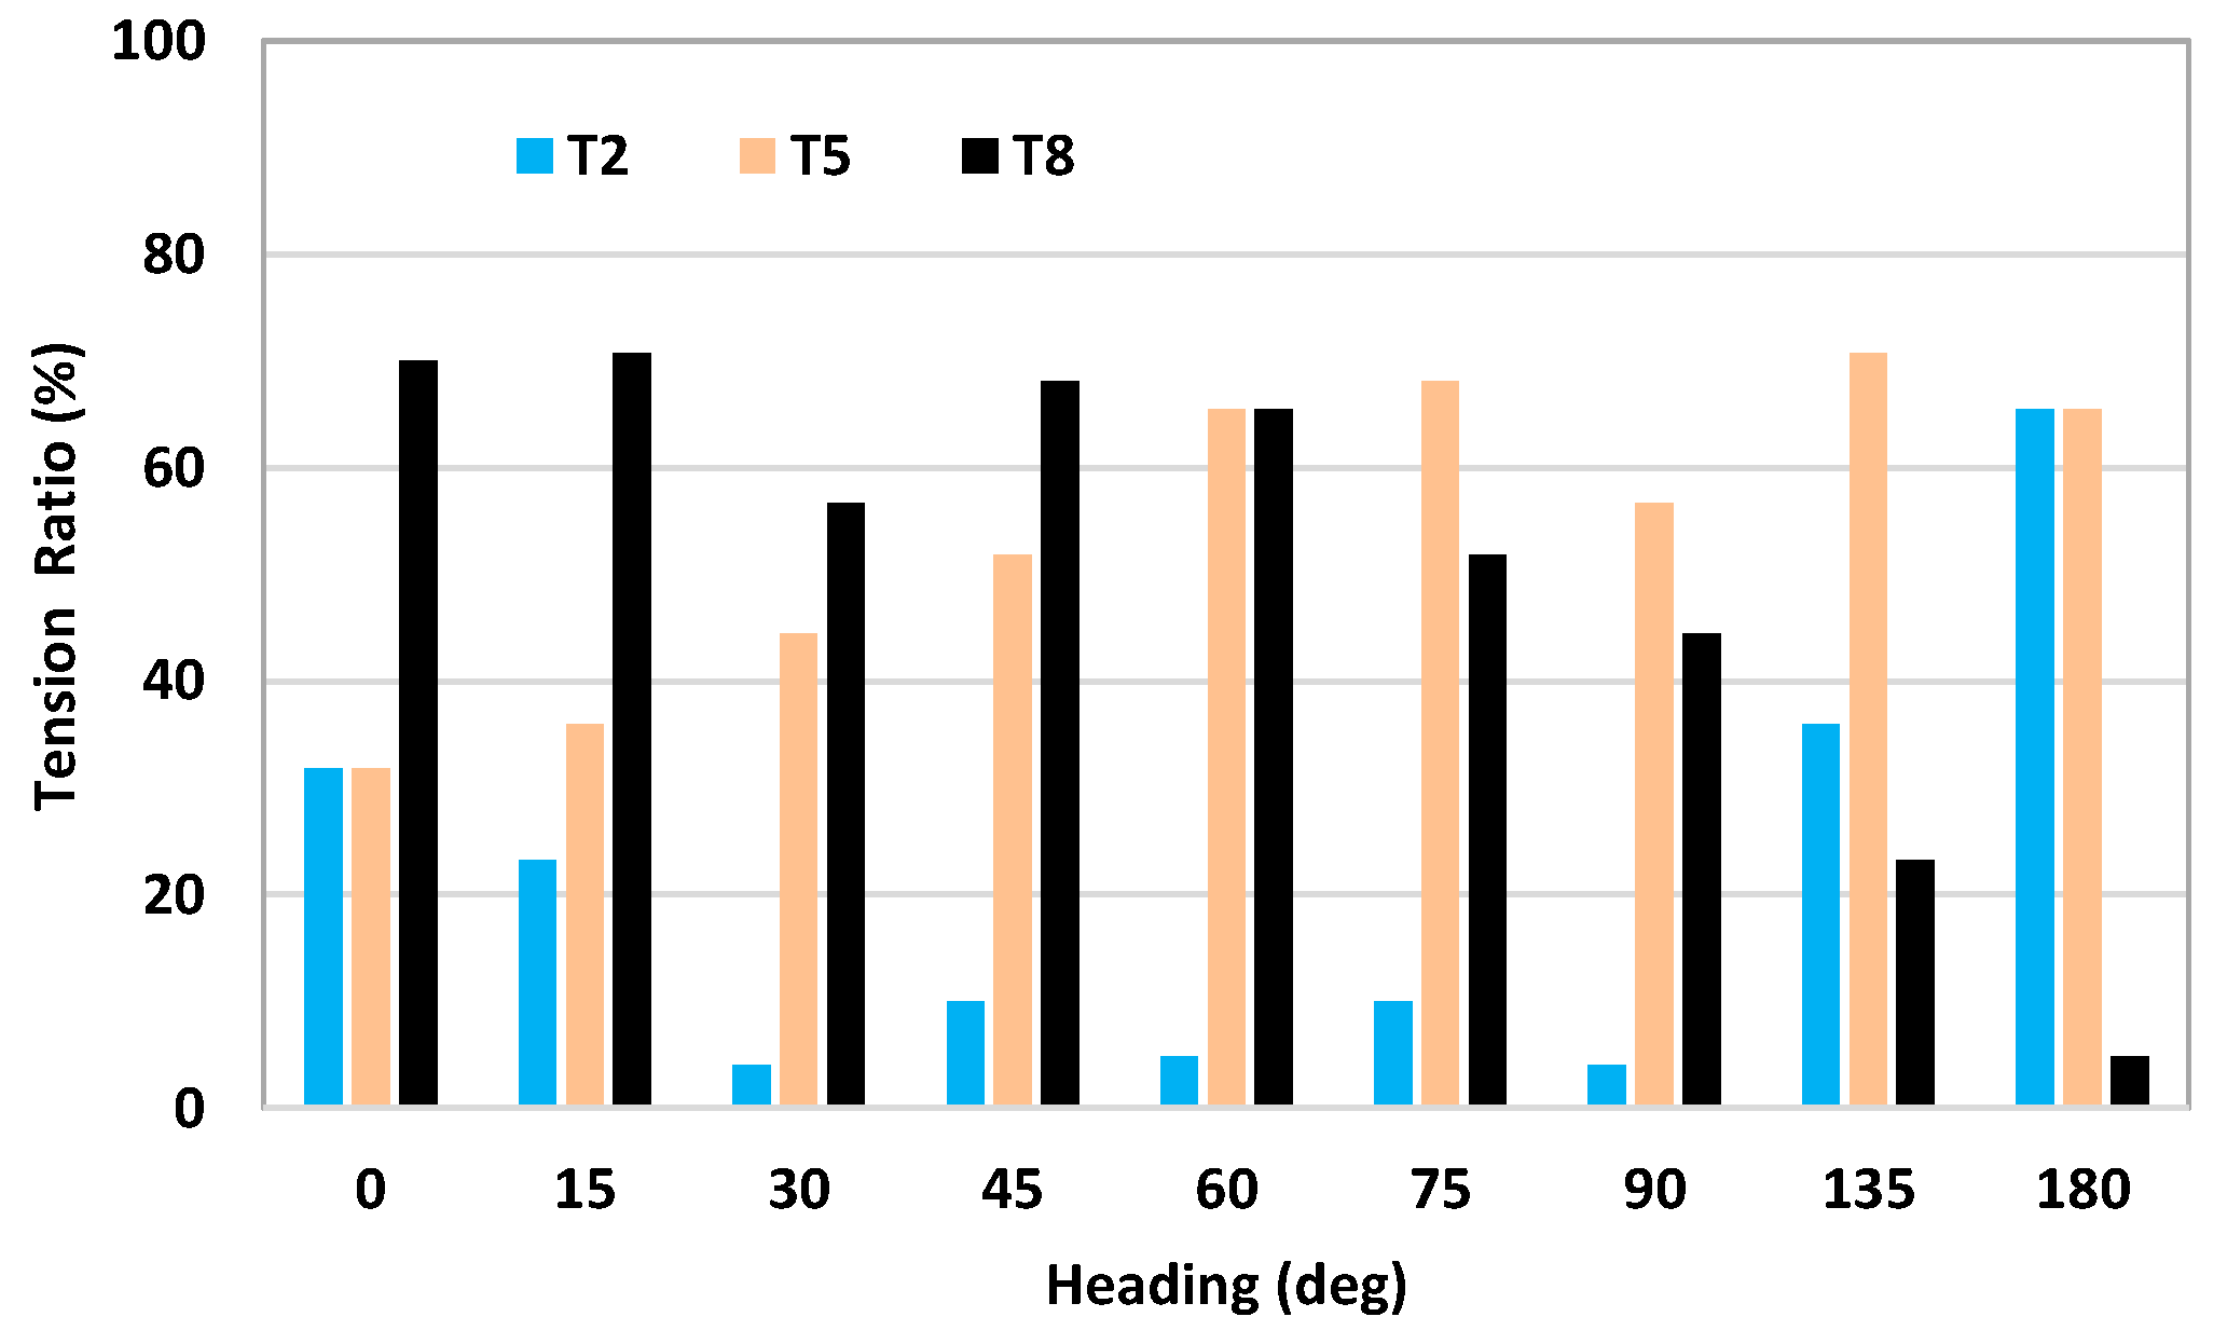
4.5. Tendon Tensions for DLC 6.1
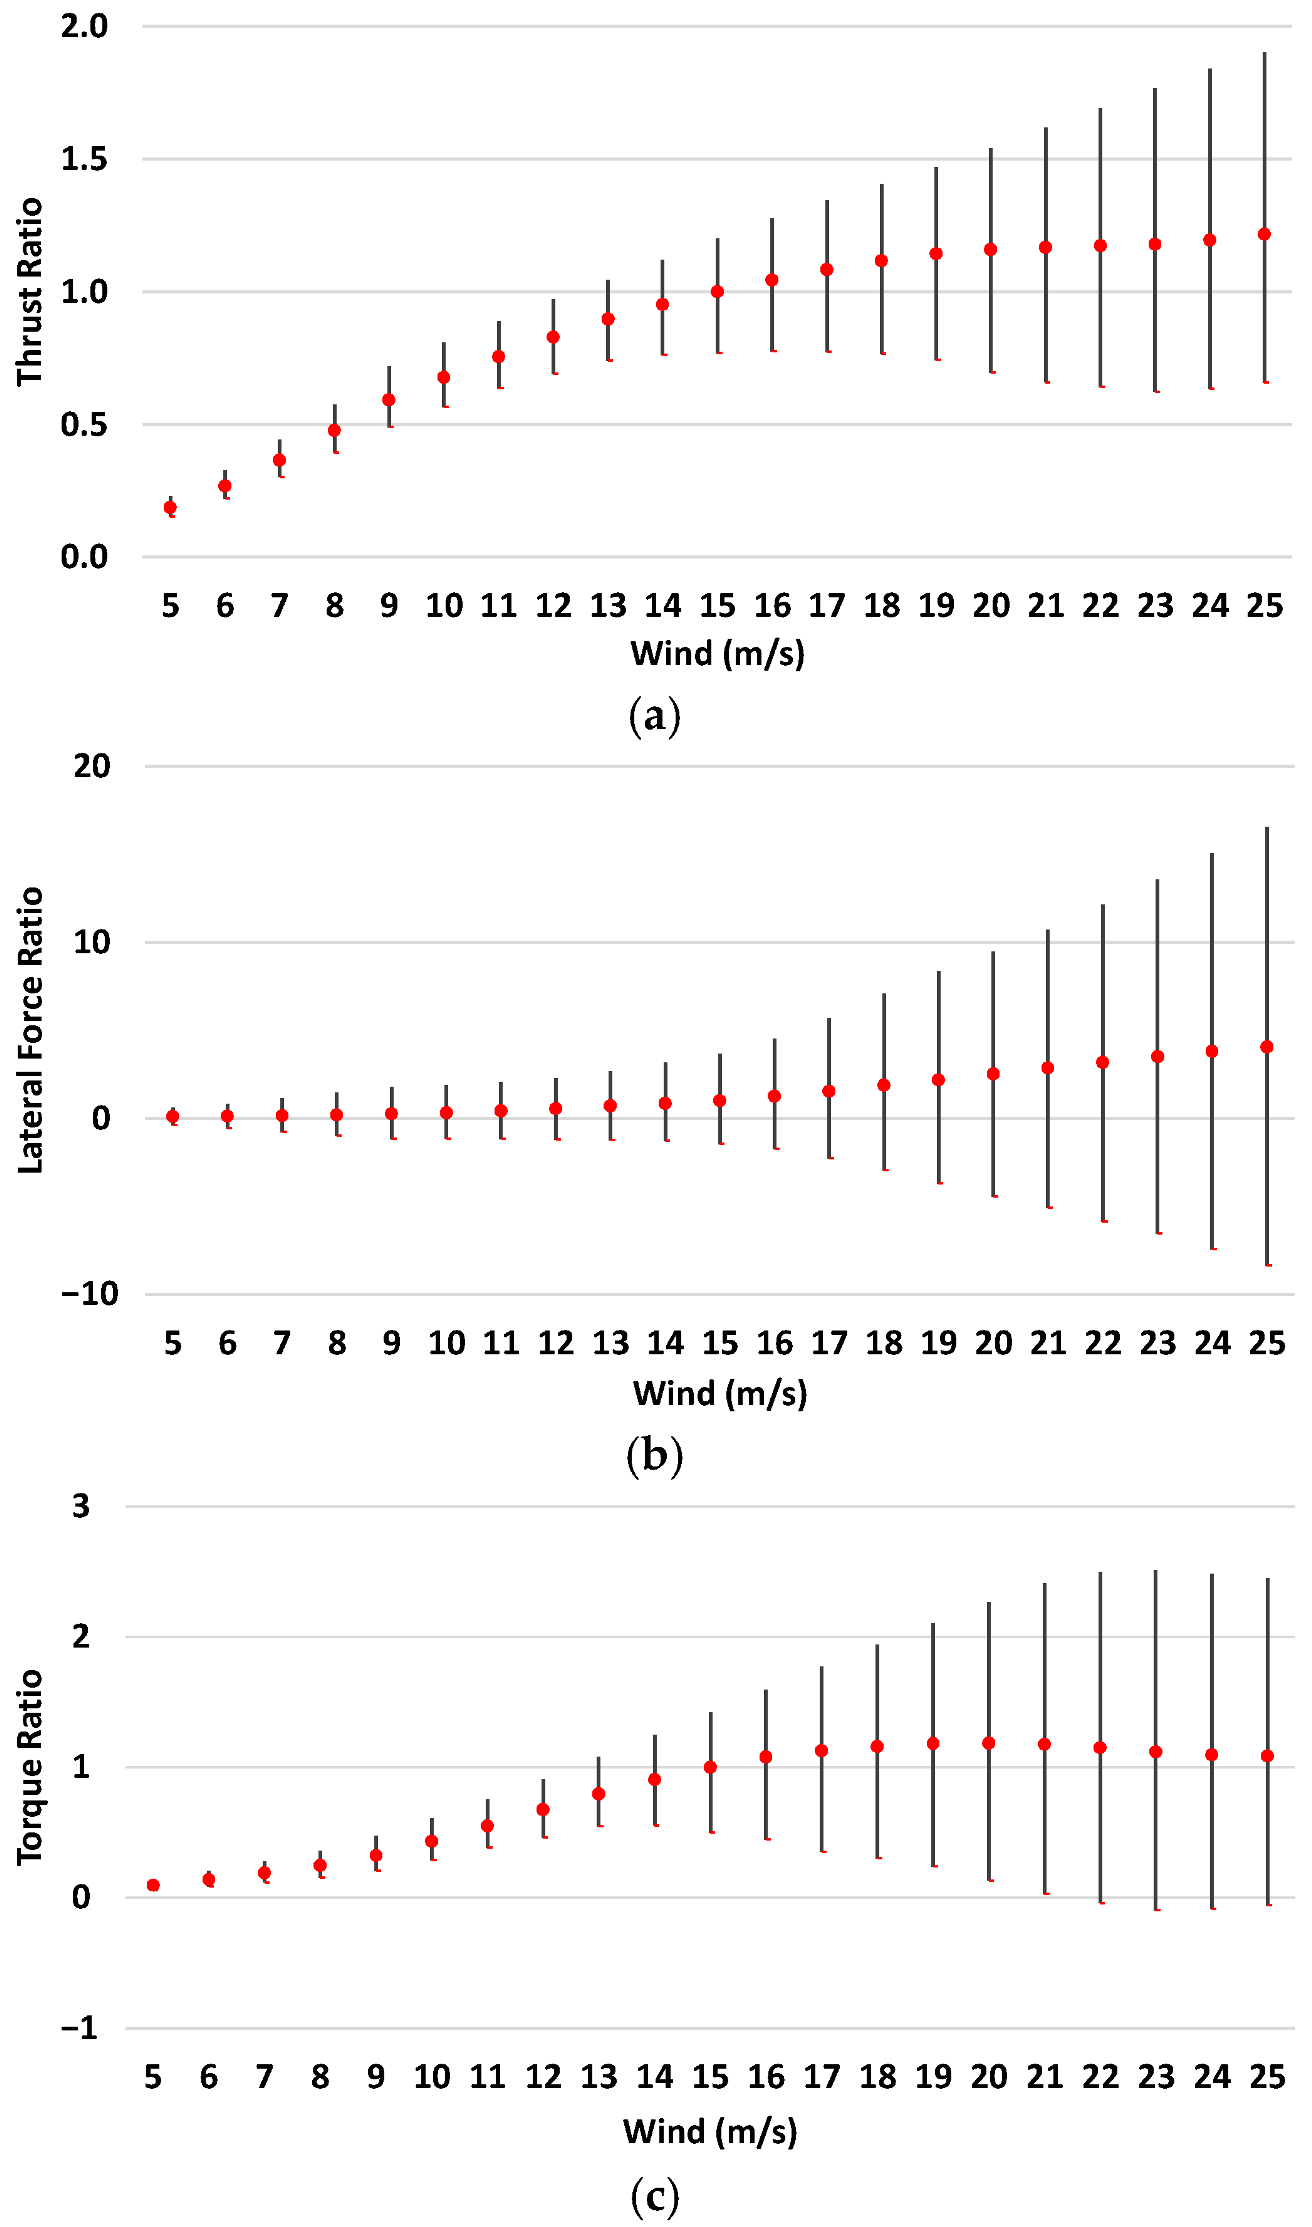
4.6. Extreme Motion and Tension Ratio Relative to DLC 1.6
4.7. Tendon Tension Correlation
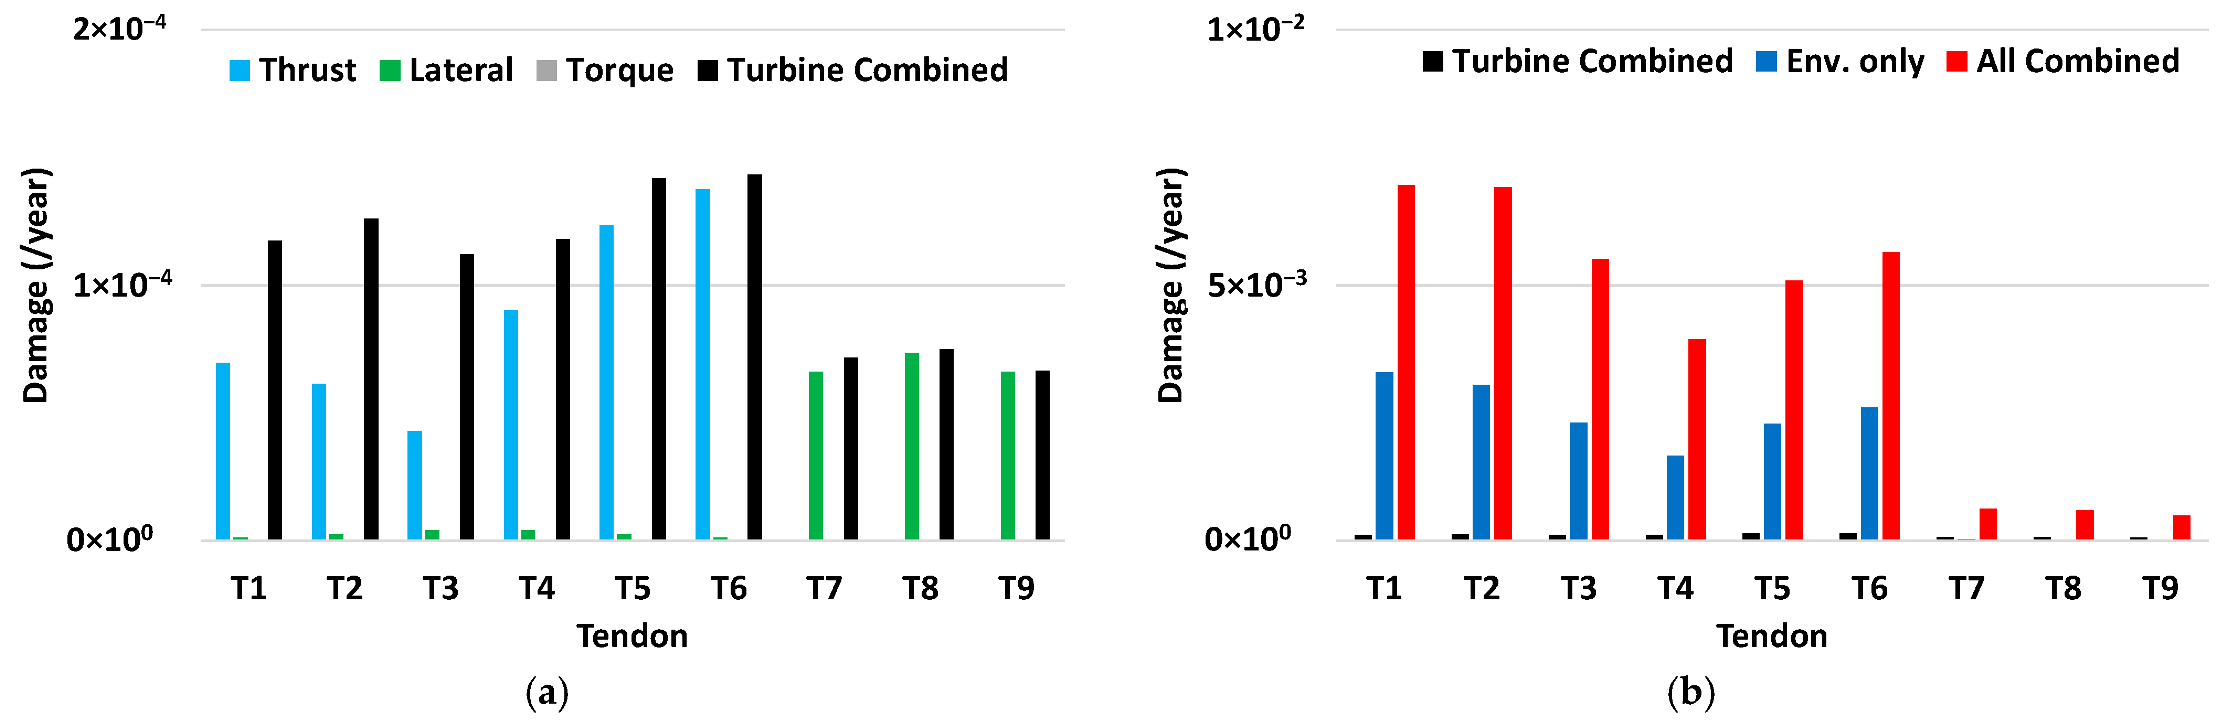
4.8. Tendon Fatigue Life Assessment
5. Conclusions
- The tower base maximum shear forces and bending moments are considerably increased under the conditions of the combination of the wind–waves from the wind only, which may suggest the tower’s design should consider the effects of the platform’s motion in waves.
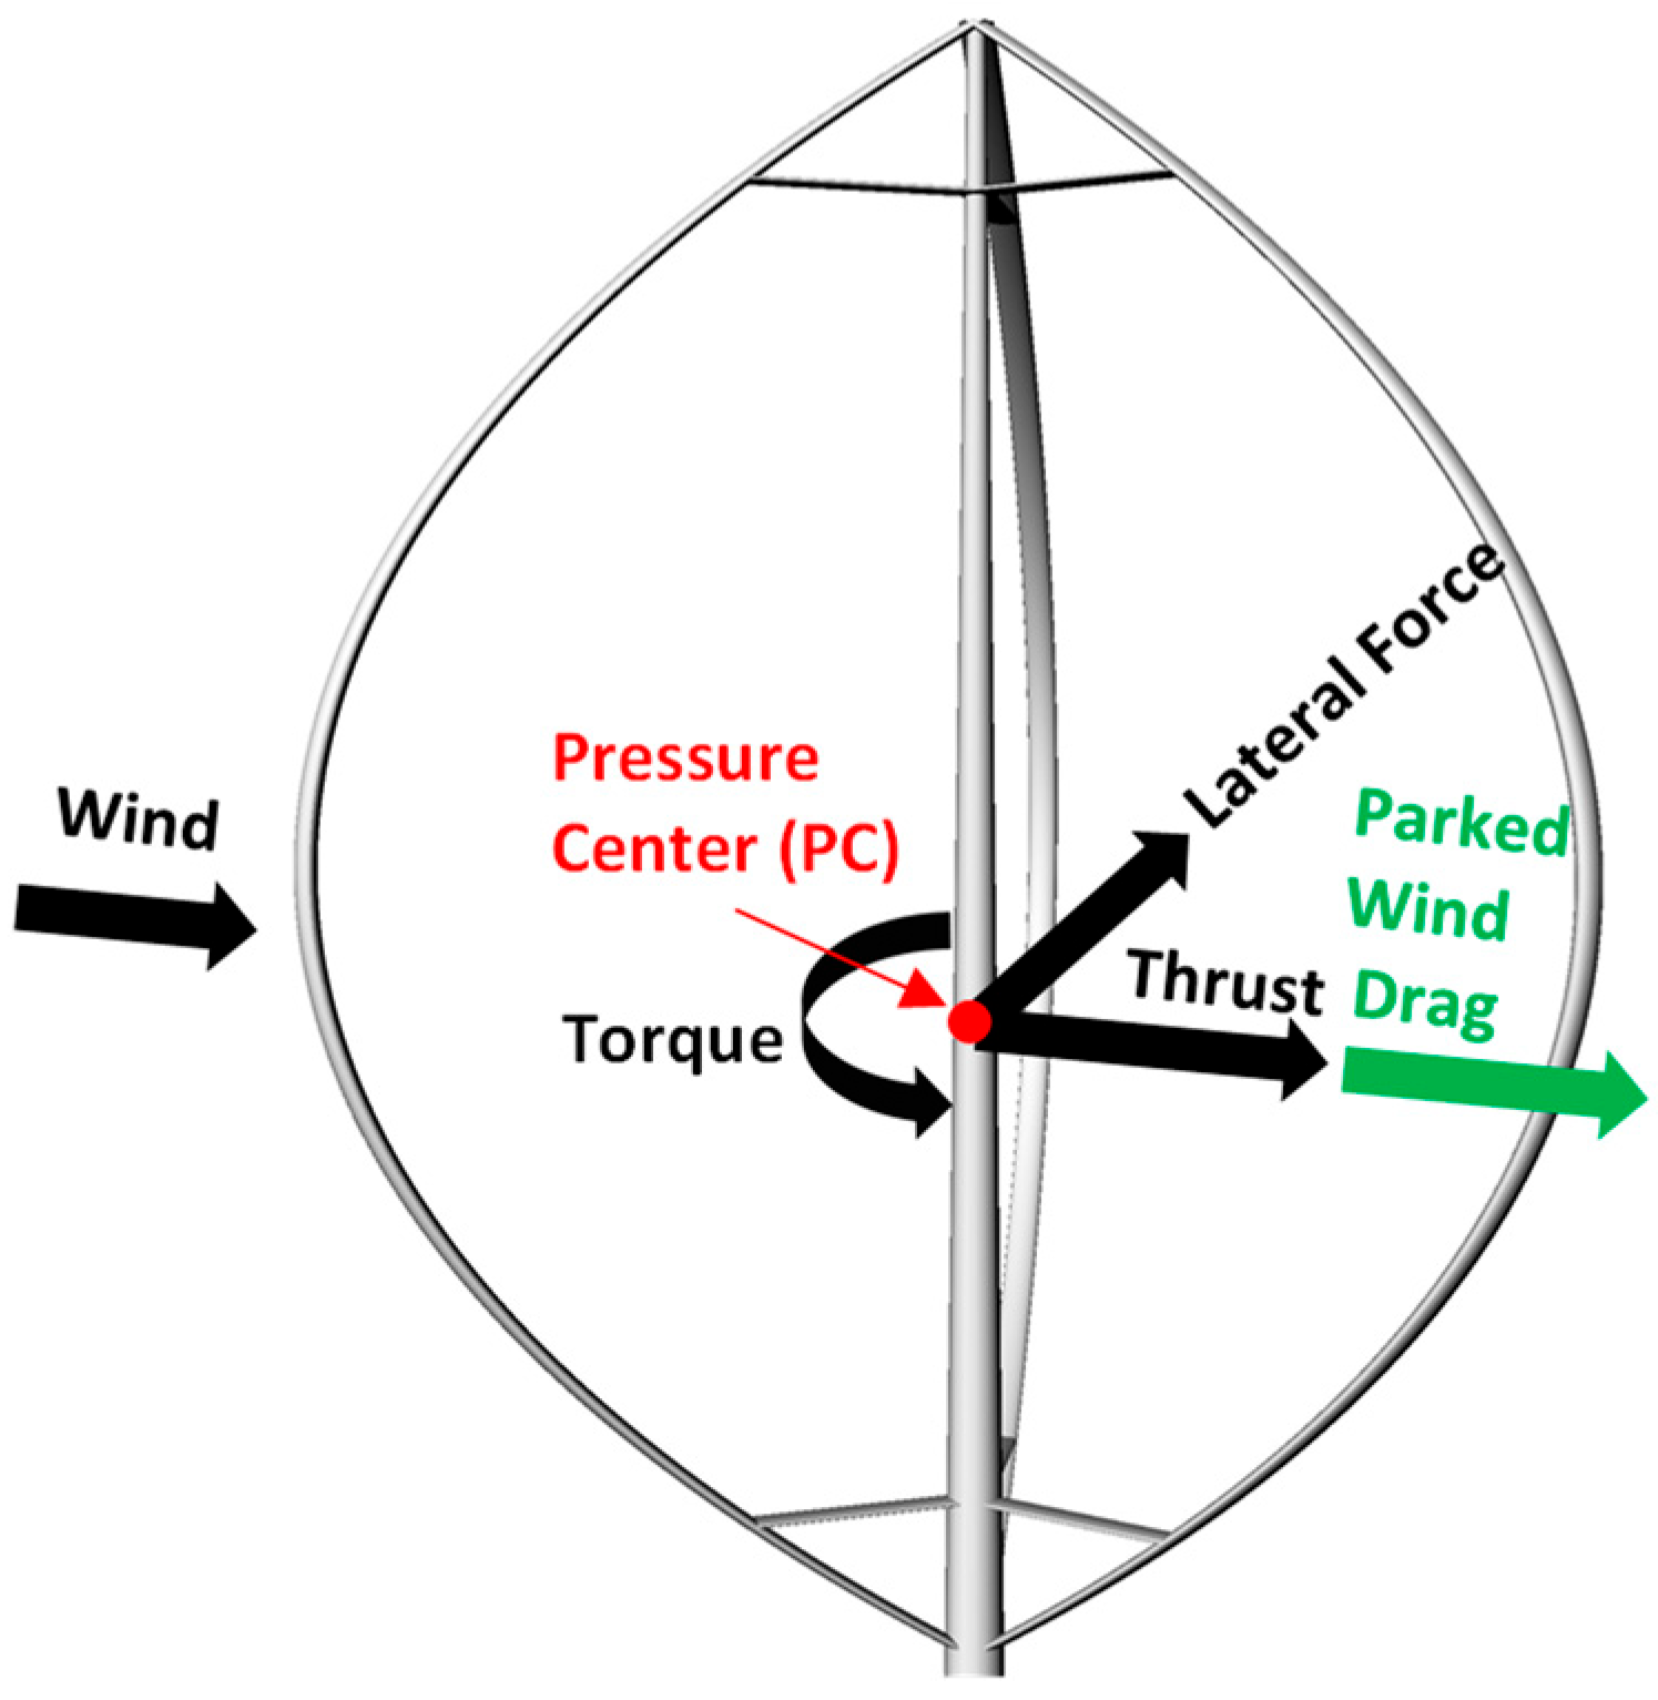
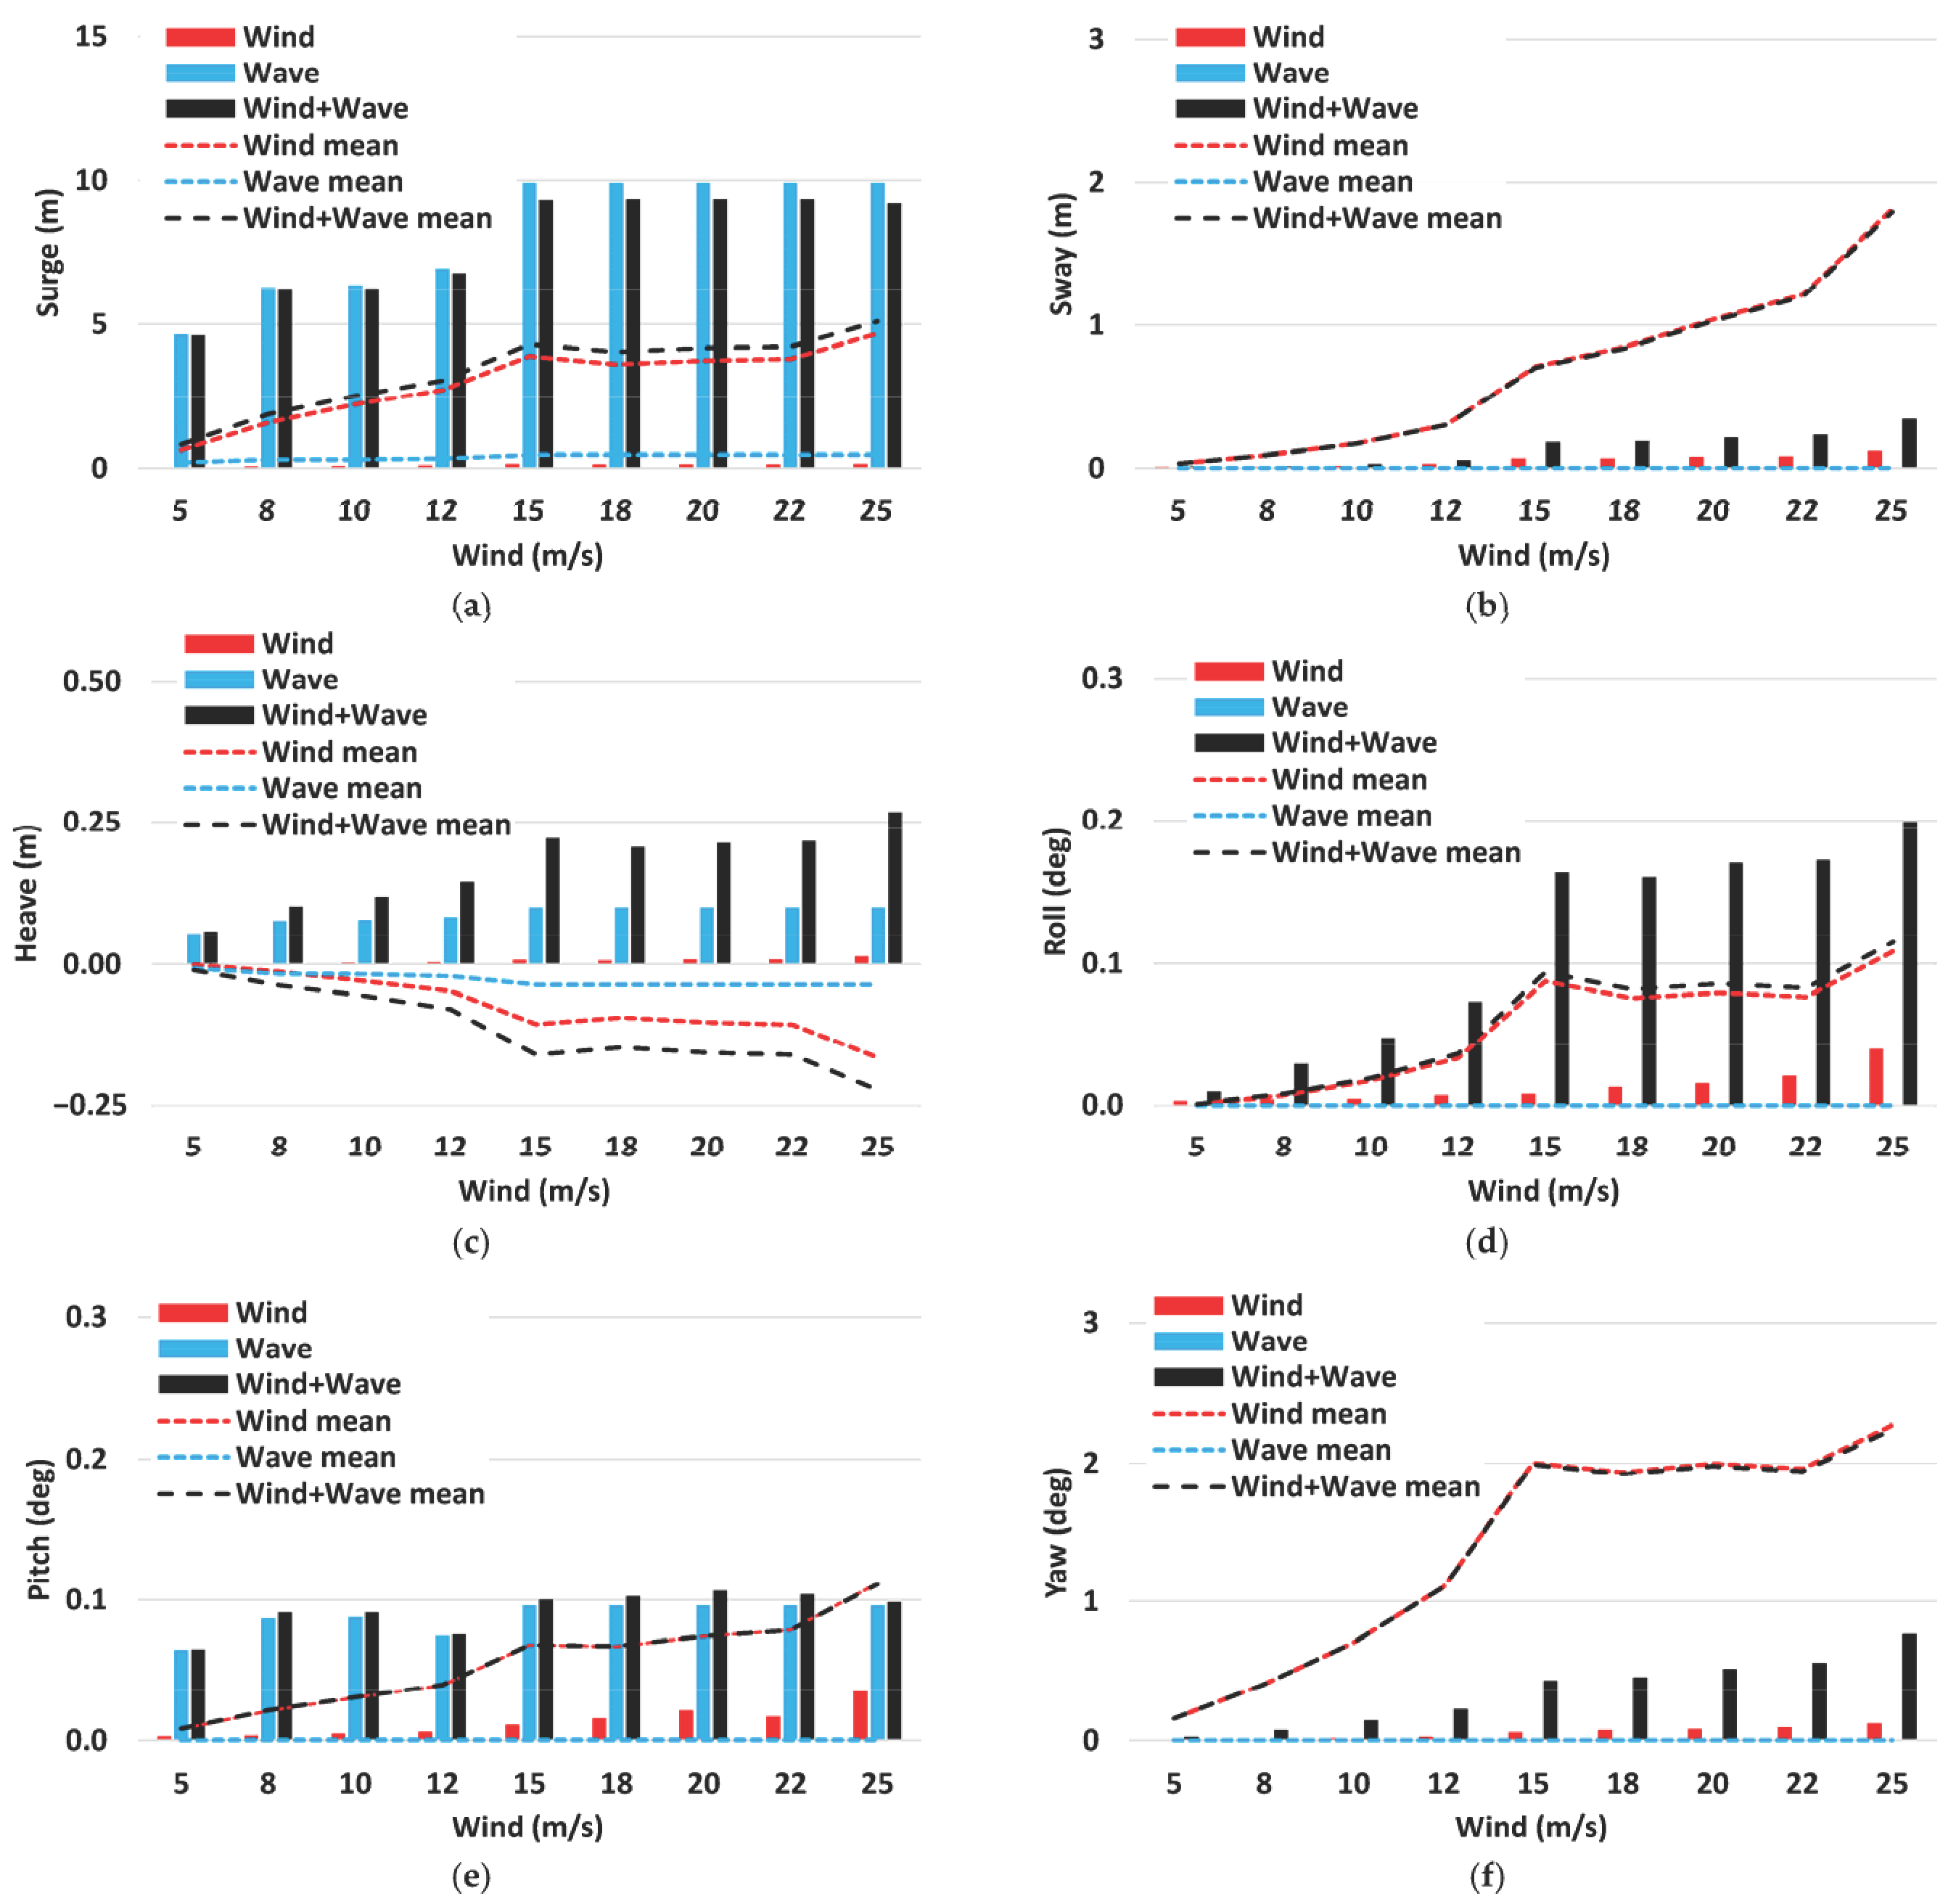
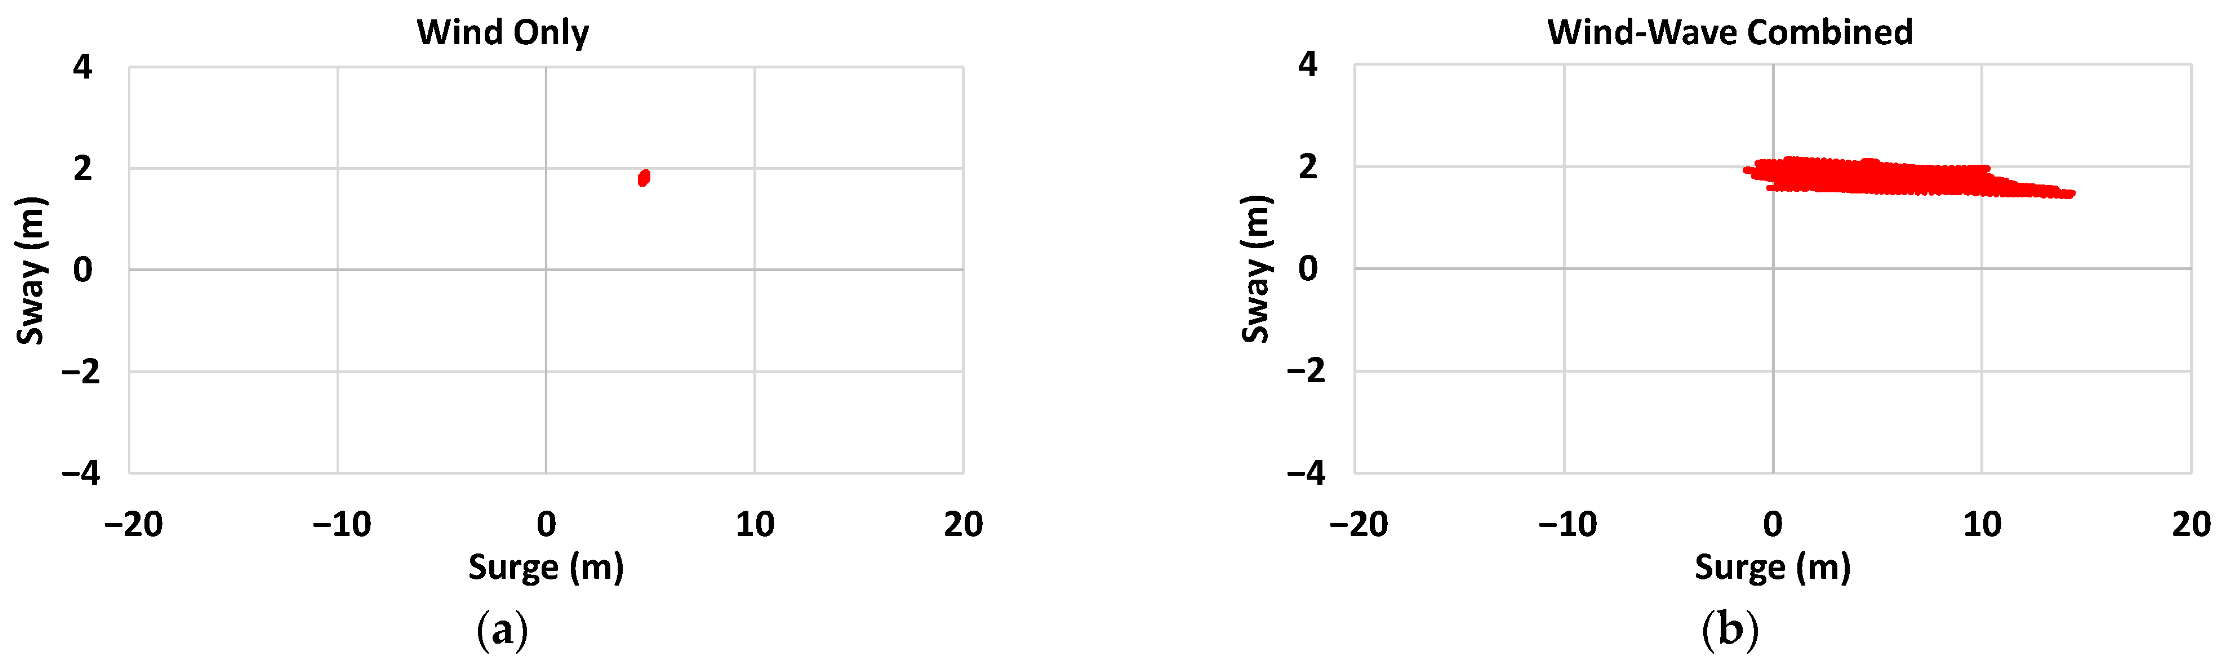
- Due to the inherent VAWT characteristics of high cyclic lateral force and torque values, non-zero mean motions for the sway, roll, and yaw occur over the operating wind ranges.
- The turbine-induced (wind only) dynamic motions of the platform are much smaller than those induced by the waves only.
- The condition for the cut-out wind among the operating winds creates the largest tower base loads, platform motions, and tendon tension, indicating the platform and tendon design need to consider the turbine’s operating conditions near the cut-out.
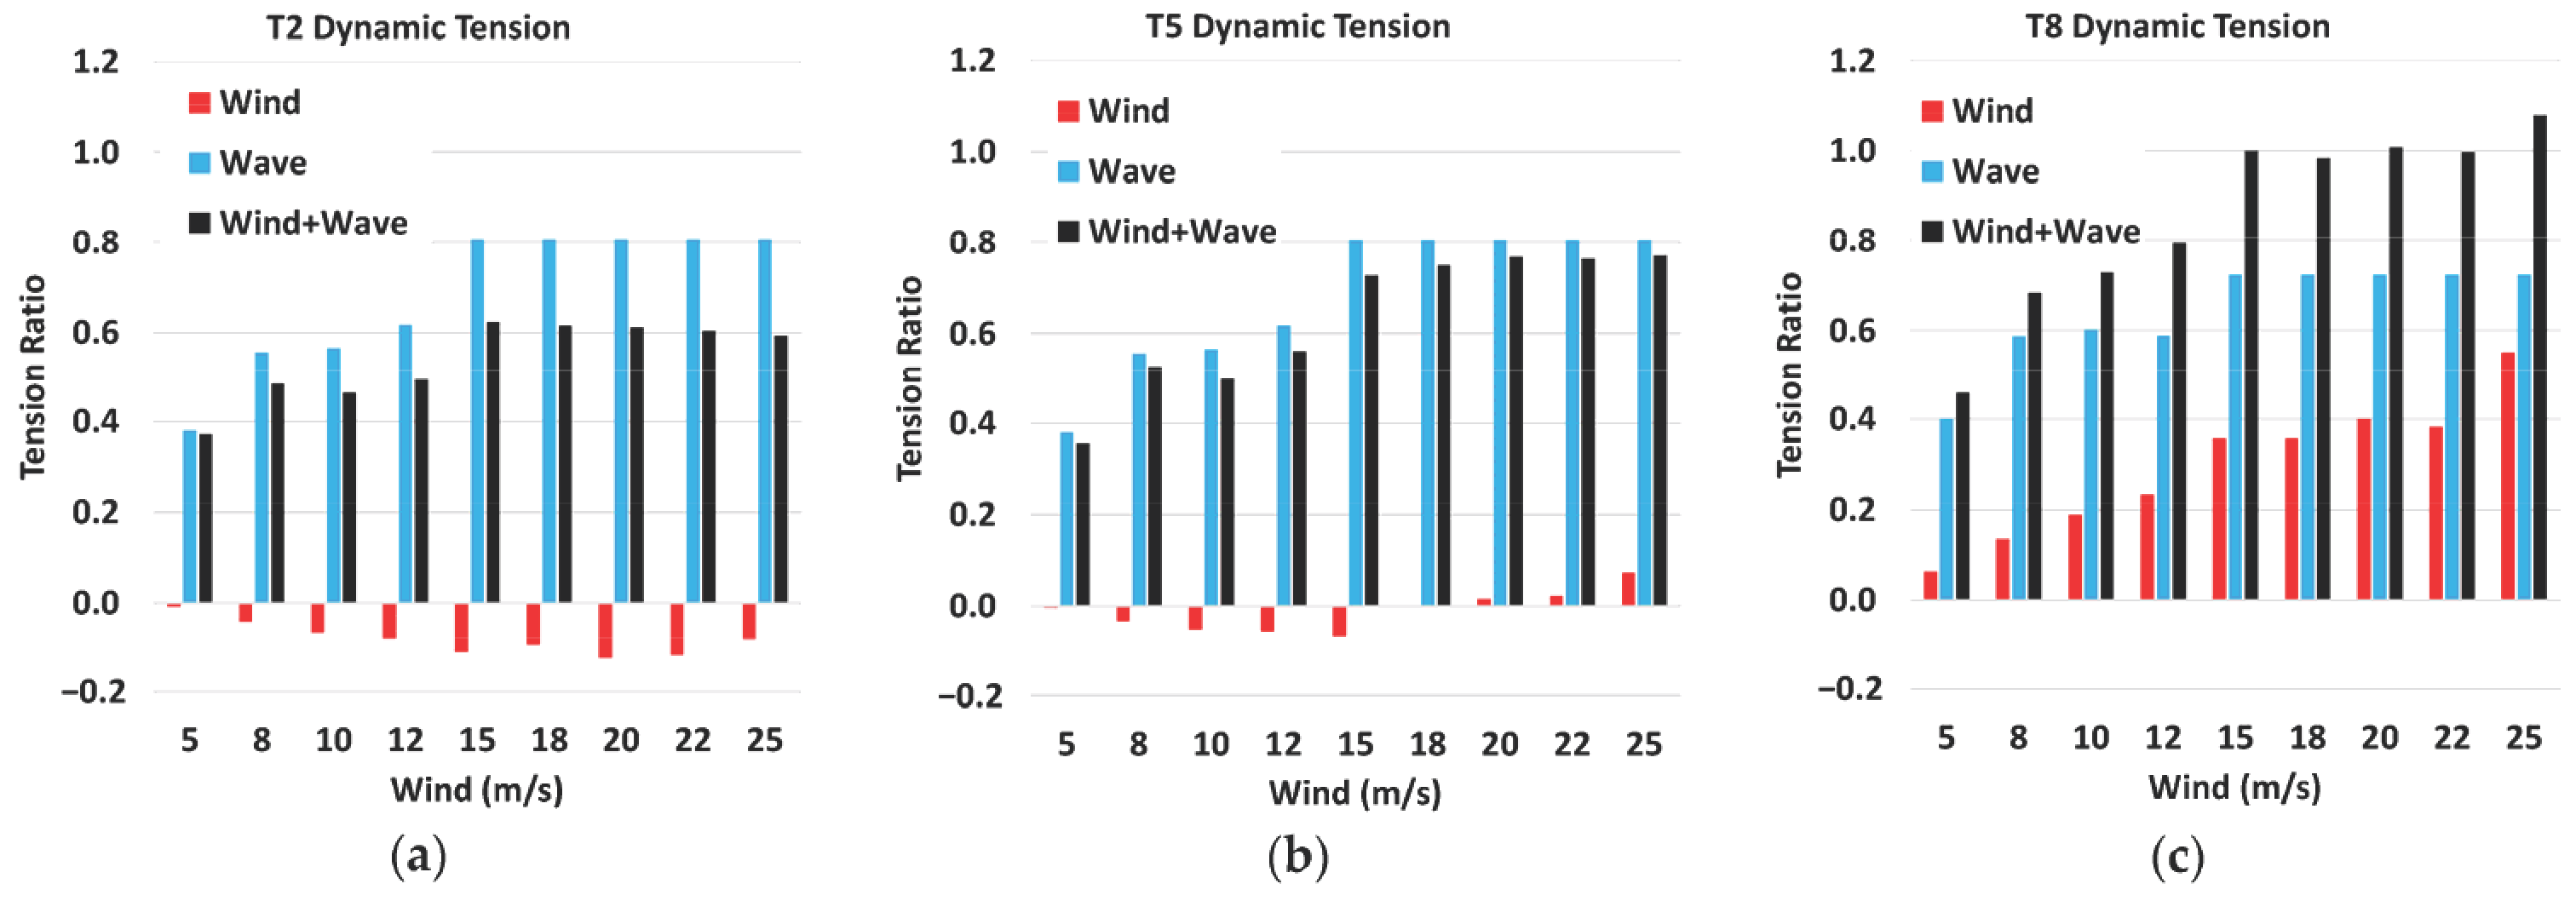
- The tendon tension increases are highly correlated to the platform pitch, as well as the horizontal and vertical velocities and vertical acceleration at the tendon porch.
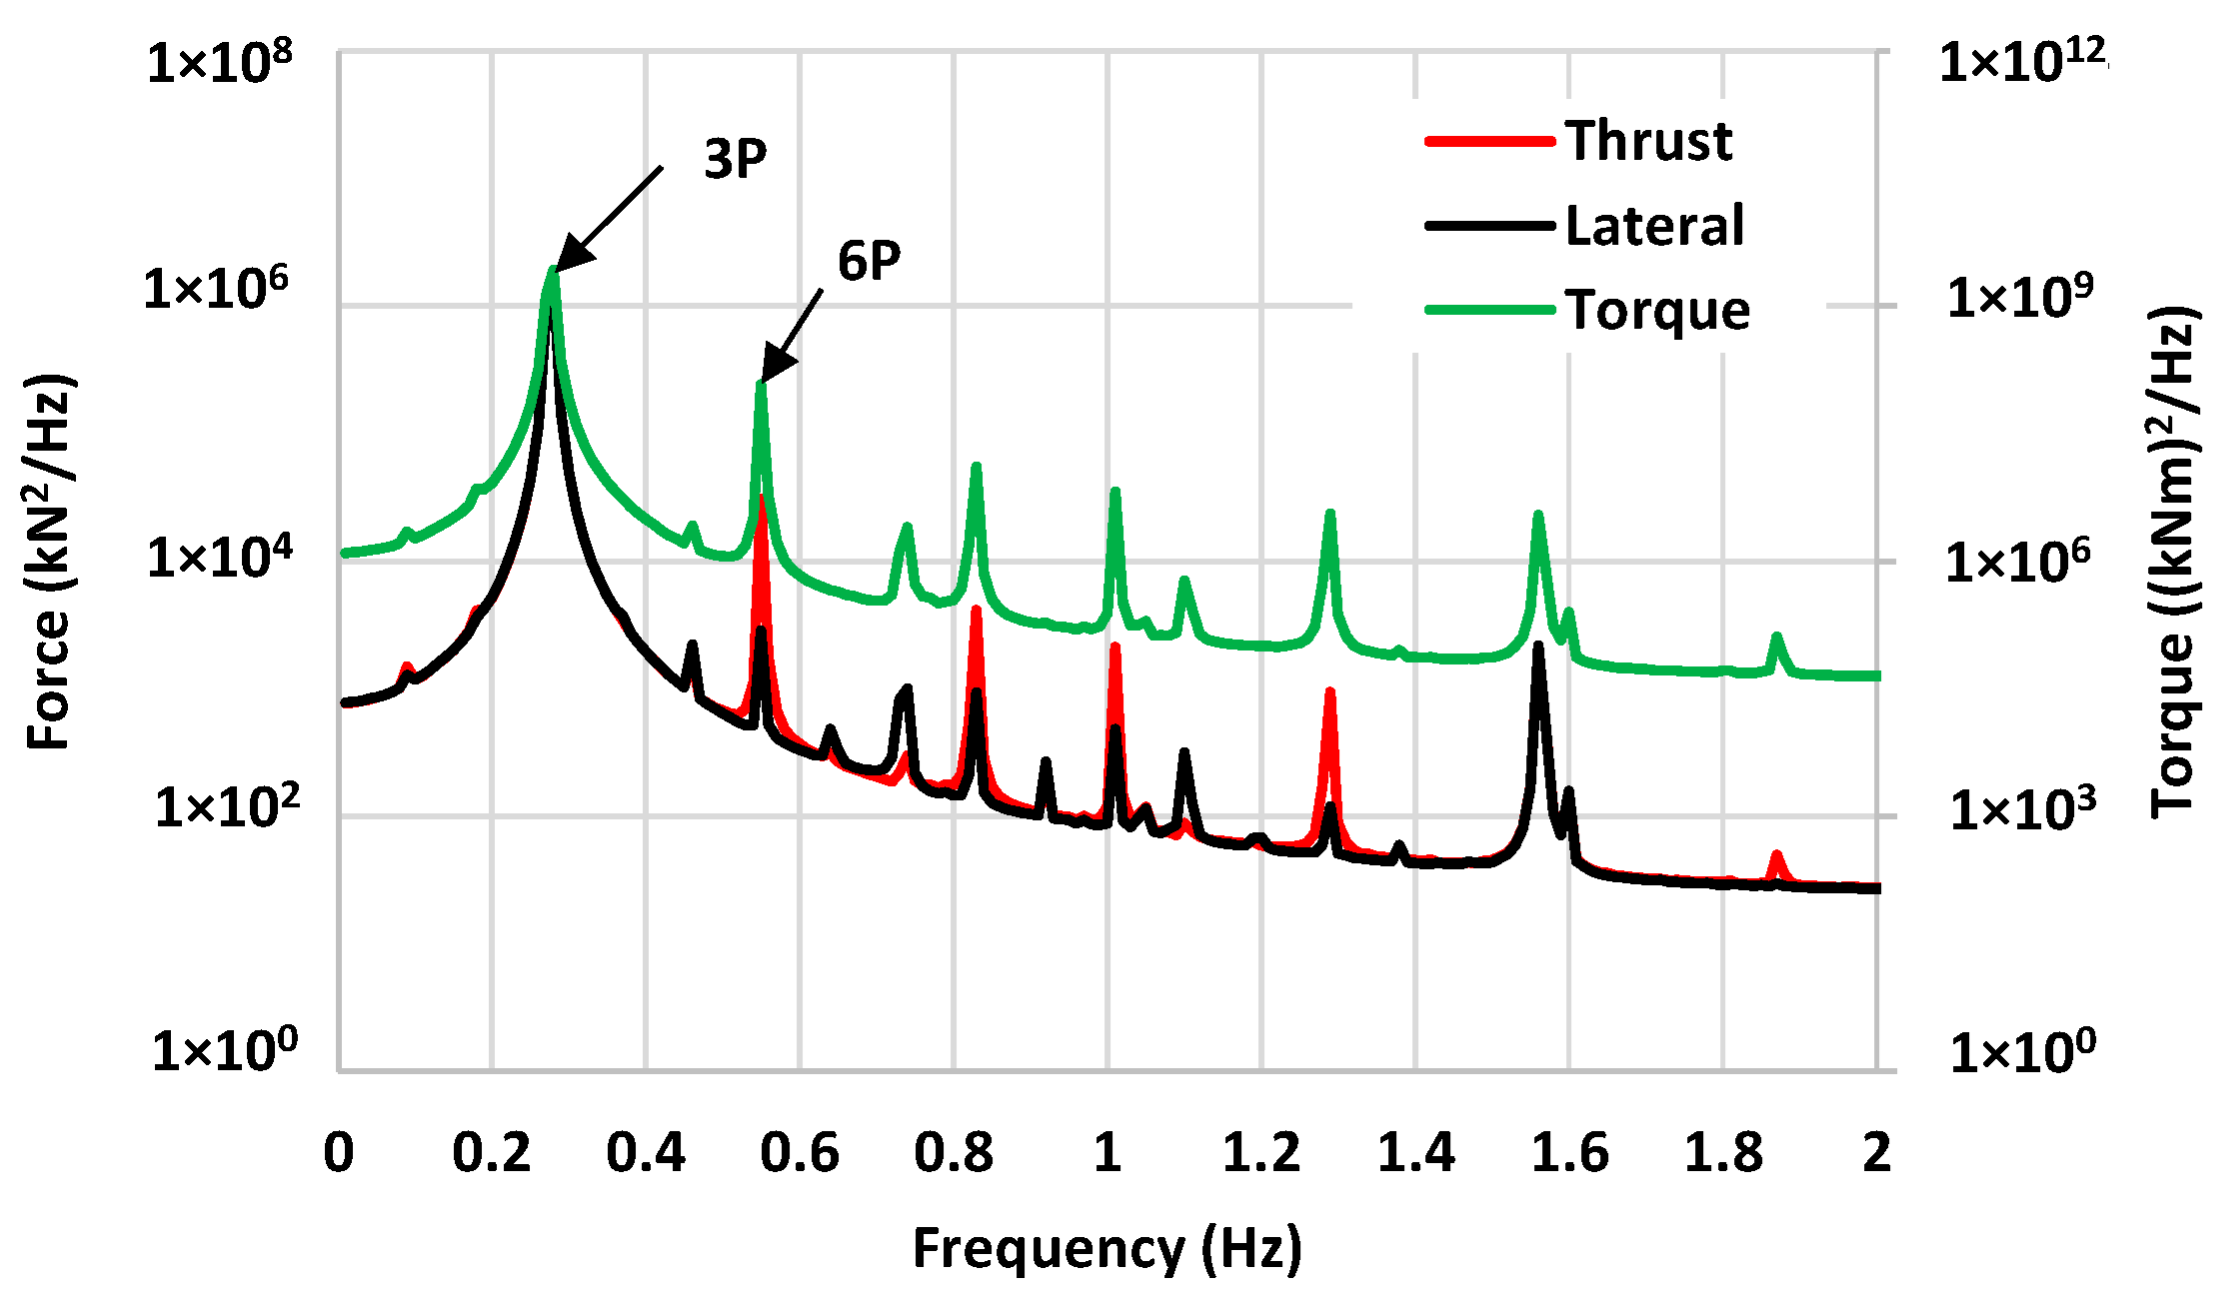
- Among the turbine load components, the turbine thrust is the most dominant component affecting the tendon tension increase. The torque’s contribution to the dynamic tension is very small.
- Tendon tensions on the weatherside at high wind speeds in the range of the rated to the cut-out speeds are comparable to the values under the 50-year extreme (parked). This suggests that the tendon analysis should be conducted to identify the most influential design load cases with more emphasis on both the turbine’s operating and extreme parked conditions.
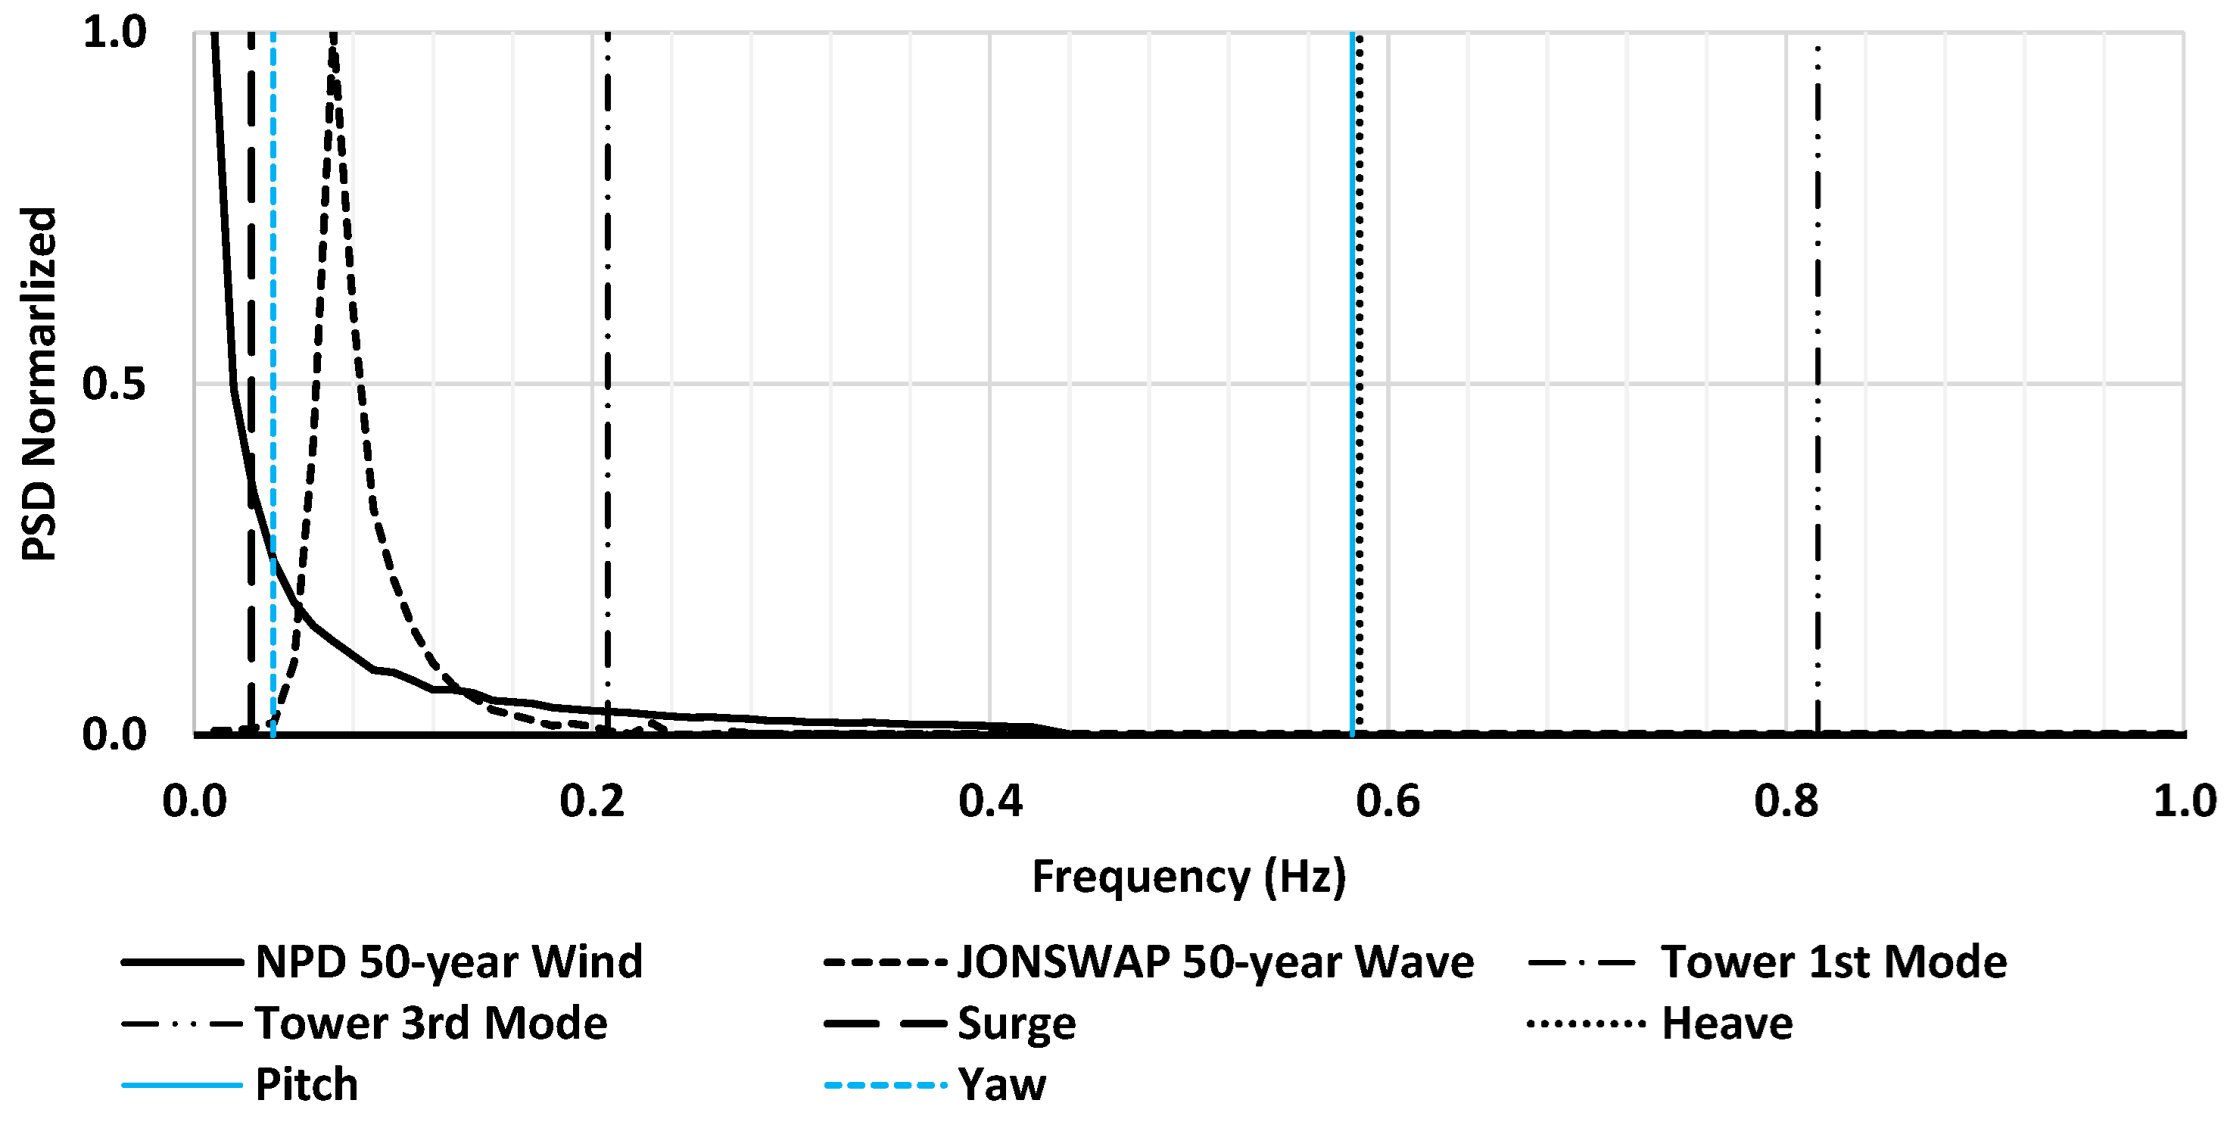
- The platform motion natural frequencies are far off from the turbine excitation and tower mode frequencies, except for the pitch (and roll) which are close to the turbine 6P.
- The turbine excitations of 3P and 6P as well as the tower mode frequency effects are strongly present in the associated response PSDs of the tower base loads (shear force, bending moment), platform pitch, and tendon tension.
- As for DLC 6.1, the maximum tendon tension is observed in an environment heading of 90 deg, which shows the heading’s dependency on the tension. The extreme tension is roughly 1.5 to 2 times more than the pretension, depending on the environment heading.
- The minimum tendon tension simulated is a small positive value. Although the result passes the design requirements for a positive tension, additional analyses are suggested to confirm this further.
- The combined tendon fatigue damage from the turbine and the environment is significantly higher than that from the environment only or the turbine only, showing a high coupling effect to the tendon damage when coupled.
- Among the turbine load components, the thrust contributes more to the tendon fatigue damage.
- The assessment results of the tendon strength and fatigue designs confirm the tendon design complies with the design requirements of industry standards.
Author Contributions
Funding
Institutional Review Board Statement
Informed Consent Statement
Data Availability Statement
Conflicts of Interest
Abbreviations
| ARPA-E | Advanced Research Projects Agency–Energy |
| ATLANTIS | Aerodynamic Turbines Lighter and Afloat with Nautical Technologies and Integrated Servo-control |
| CACTUS | Code for Axial and Cross-flow TUrbine Simulation |
| CoG | Center of Gravity |
| DAF | Dynamic Amplification Factor |
| DLC | Design Load Case |
| DoE | Department of Energy |
| FDF | Fatigue Design Factor |
| FoS | Factor of Safety |
| HAWT | Horizontal Axis Wind Turbine |
| JONSWAP | Joint North Sea Wave Observation Project |
| MARS | Modular Assembly and Reconfigurable System |
| MW | Megawatt |
| MBL | Minimum Breaking Load |
| NREL | National Renewable Energy Laboratory |
| NPD | Norwegian Petroleum Directorate |
| OWENS | Offshore Wind ENergy Simulation toolkit |
| PC | Pressure Center |
| PSD | Power Spectral Density |
| RAO | Response Amplitude Operator |
| SWL | Still Water Line |
| T-N | Tension-Cycle |
| TLP | Tension Leg Platform |
| VAWT | Vertical-Axis Wind Turbine |
References
- Jonkman, J.M.; Butterfield, S.; Musial, W.; Scott, G. Definition of a 5-MW Reference Wind Turbine for Offshore System Development; Technical Report NREL/TP-500-38060; National Renewable Energy Laboratory: Golden, CO, USA, 2009.
- Jonkman, J.M. Dynamics of Offshore Floating Wind Turbines—Model development and Verification. Wind Energy 2009, 12, 459–492. [Google Scholar] [CrossRef]
- Gaertner, E.; Rinker, J.; Sethuraman, L.; Zahle, F.; Anderson, B.; Barter, G.; Abbas, N.; Meng, F.; Bortolotti, P.; Skrzypinski, W.; et al. IEA Wind TCP Task 37: Definition of the IEA Wind 15-Megawatt Offshore Reference Wind Turbine; National Renewable Energy Laboratory: Golden, CO, USA, 2020; NREL/TP-5000-75698. Available online: https://www.nrel.gov/docs/fy20osti/75698.pdf (accessed on 12 August 2023).
- Allen, C.; Viselli, A.; Dagher, H.; Goupee, A.; Gaertner, E.; Abbas, N.; Hall, M.; Barter, G. Definition of the UMaine VolturnUS-S Reference Platform Developed for the IEA Wind 15-Megawatt Offshore Reference Wind Turbine; Technical Report; National Renewable Energy Laboratory: Golden, CO, USA, 2020.
- Liu, Y.; Hu, C.; Sueyoshi, M. Motion Response Characteristics of a Kyushu-University Semi-Submersible Floating Wind Turbine with Trussed Slender Structures: Experiment vs. Numerical Simulation. Ocean Eng. 2021, 232, 109078. [Google Scholar] [CrossRef]
- TwindWind. Available online: https://hexiconpower.com/twinwind/ (accessed on 12 August 2023).
- American Bureau of Shipping (ABS). ABS ClaYoshida, Shigeosses World’s Biggest Floating Wind Turbine. Available online: https://ww2.eagle.org/en/news/press-room/abs-classes-worlds-biggest-floating-wind-turbine.html (accessed on 12 August 2023).
- Equinor, Hywind Scotland. Available online: https://www.equinor.com/energy/hywind-scotland. (accessed on 12 August 2023).
- Arredondo-Galeana, A.; Brennan, F. Floating Offshore Vertical Axis Wind Turbines: Opportunities, Challenges and Way Forward. Energies 2021, 14, 8000. [Google Scholar] [CrossRef]
- Tjiu, W.; Marnoto, T.; Mat, S.; Ruslan, M.H.; Sopian, K. Darrieus vertical axis wind turbine for power generation I: Assessment of Darrieus VAWT configurations. Renew. Energy 2015, 75, 50–67. [Google Scholar] [CrossRef]
- Kumar, P.M.; Sivalingam, K.; Teik-Cheng Lim, T.-C.; Ramakrishna, S.; Wei, H. Review on the Evolution of Darrieus Vertical Axis Wind Turbine: Large Wind Turbines. Clean Technol. 2019, 1, 205–223. [Google Scholar] [CrossRef]
- Griffith, D.T.; Barone, M.; Paquette, J.; Owens, B.; Bull, D.; Simao-Ferriera, C.; Goupee, A.J.; Fowler, M.J. Design Studies for Deep-Water Floating Offshore Vertical Axis Wind Turbines; Technical Report, SAND2018-7002; Sandia National Laboratories: Albuquerque, NM, USA, 2018.
- Gharaati, M.; Xiao, S.; Wei, N.J.; Martínez-Tossas, L.A.; Dabiri, J.O.; Yang, D. Large Eddy Simulation of Helical- and Straight-Bladed Vertical Axis Wind Turbines in Boundary Layer Turbulence. J. Renew. Sustain. Energy 2022, 14, 053301. [Google Scholar] [CrossRef]
- Whittlesey, R.W.; Liska, S.; Dabiri, J.O. Fish schooling as a basis for vertical axis wind turbine farm design. Bioinspir. Biomim. 2010, 5, 3. [Google Scholar] [CrossRef]
- Sakib, M.S.; Griffith, D.T. Parked and operating load analysis in the aerodynamic design of multi-megawatt-scale floating vertical-axis wind turbines. Wind Energy Sci. 2022, 7, 677–696. [Google Scholar] [CrossRef]
- Gao, J.; Griffith, T.D.; Sakib, M.S.; Boo, S.Y. A semi-coupled aero-servo-hydro numerical model for floating vertical axis wind turbines operating on TLPs. Renew. Energy 2022, 181, 692–713. [Google Scholar] [CrossRef]
- Galinos, C.; Larsen, T.J.; Madsen, H.A.; Paulsen, U.S. Vertical axis wind turbine design load cases investigation and comparison with horizontal axis wind turbine. In Proceedings of the 13th Deep Sea Offshore Wind R&D Conference, Trondheim, Norway, 20–22 January 2016. [Google Scholar]
- Huijs, F.; Vlasveld, E.; Gormand, M.; Savenije, F.; Caboni, M.; LeBlanc, B.; Ferreira, C.S.; Lindenburg, K.; Gueydon, S.; Otto, W.; et al. Integrated design of a semi-submersible floating vertical axis wind turbine (VAWT) with active blade pitch control. In Proceedings of the EERA DeepWind’2018, 15th Deep Sea Offshore Wind R&D Conference, Trondheim, Norway, 17–19 January 2018. [Google Scholar]
- Wen, T.R.; Wang, K.; Cheng, Z.; Ong, M.C. Spar-Type Vertical-Axis Wind Turbines in Moderate Water Depth: A Feasibility Study. Energies 2018, 11, 555. [Google Scholar] [CrossRef]
- Berthelsen, P.A.; Fylling, I.; Vita, L.; Paulsen, U.S. Conceptual Design of a Floating Support Structure and Mooring System for a Vertical Axis Wind Turbine. In Proceedings of the ASME 2012 31st International Conference on Ocean, Offshore and Arctic Engineering OMAE2012, Rio de Janeiro, Brazil, 1–6 July 2012. [Google Scholar]
- SeaTwirl. 1-MW Floating Vertical Axis Wind Turbine to Be Deployed off Norway. Available online: https://newatlas.com/energy/seatwirl-vawt-norway/ (accessed on 12 August 2023).
- Ishie, J.; Wang, K.; Ong, M.C. Structural Dynamic Analysis of Semi-Submersible Floating Vertical Axis Wind Turbines. Energies 2016, 9, 1047. [Google Scholar] [CrossRef]
- Wang, K.; Moan, T. A Method of Floating Vertical Axis Wind Turbine. In Proceedings of the ASME 2013 32nd International Conference on Ocean, Offshore and Arctic Engineering OMAE2013, Nantes, France, 9–14 June 2013. [Google Scholar]
- Robertson, A.; Jonkman, J.; Masciola, M.; Song, H.; Goupee, A.; Coulling, A.; Luan, C. Definition of the Semisubmersible Floating System for Phase II of OC4; National Renewable Energy Laboratory: Golden, CO, USA, 2012.
- VERTIWIND. Offshore Floating Vertical Axis Wind Turbine. Available online: https://www.epsilon-composite.com/en/case-study/vertiwind-vertical-axis-wind-turbine (accessed on 12 August 2023).
- Withee, J. Fully Coupled Dynamic Analysis of a Floating Wind Turbine System. Ph.D. Thesis, Department of Ocean Engineering, Massachusetts Institute of Technology, Cambridge, MA, USA, 2004. [Google Scholar]
- Robertson, A.N.; Jonkman, J.M. Loads Analysis of Several Offshore Floating Wind Turbine Concepts. In Proceedings of the Twenty-First International Offshore and Polar Engineering Conference, Maui, HI, USA, 19–24 June 2011. [Google Scholar]
- Erin, E.; Bachynski, E.E.; Moan, M. Design considerations for tension leg platform wind turbines. Mar. Struct. 2012, 29, 89–114. [Google Scholar]
- Boo, S.Y.; Shelley, A.S.; Kim, D. A TLP Floating Foundation Design with Novel Tendon Mooring Technology for Hawaii Offshore Wind. In Proceedings of the Twenty-Ninth International Ocean and Polar Engineering Conference, Honolulu, HI, USA, 16–21 June 2019. [Google Scholar]
- Adam, F.; Myland, T.; Dahlhaus, F.; Großmann, J. GICON-TLP for wind turbines—The path of development. In Proceedings of the 1st International Conference on Renewable Energies Offshore (RENEW), Lisbon, Portugal, 24–26 November 2014. [Google Scholar]
- Li, Y.; Le, C.; Ding, H.; Zhang, P.; Zhang, J. Dynamic Response for a Submerged Floating offshore Wind Turbine with Different Mooring Configurations. J. Mar. Sci. Eng. 2019, 7, 115. [Google Scholar] [CrossRef]
- Borg, M.; Collu, M. Offshore floating vertical axis wind turbines, dynamics modelling state of the art. Part III: Hydrodynamics and coupled modelling approaches. Renew. Sustain. Energy Rev. 2015, 46, 296–310. [Google Scholar] [CrossRef]
- American Bureau of Shipping (ABS). ABS Guide for Building and Classing Floating Offshore Wind Turbines; American Bureau of Shipping: Houston, TX, USA, 2020.
- American Petroleum Institute (API). API RP 2T Planning, Designing, and Constructing Tension Leg Platform; American Petroleum Institute: Washington, DC, USA, 2010. [Google Scholar]
- OrcaFlex—Dynamic Analysis Software for Offshore Marine Systems. Available online: https://www.orcina.com/orcaflex/ (accessed on 12 August 2023).
- ARPA-E. Advanced Research Projects Agency–Energy. Available online: https://arpa-e.energy.gov/technologies/projects/low-cost-floating-offshore-vertical-axis-wind-system (accessed on 12 August 2023).
- Hsu, W.-T.; Litton, R.; Vasala, H.; Anderson, D.; Sheppard, R. Beneficial Wave Motion Response for Wind Turbine Support TLPs with Synthetic Rope Tendons. In Proceedings of the Offshore Technology Conference, Houston, TX, USA, 6–9 May 2019. [Google Scholar]
- Murray, J.C.; Barone, M. The development of CACTUS, a wind and marine turbine performance simulation code. In Proceedings of the 49th AIAA Aerospace Sciences Meeting Including the New Horizons Forum and Aerospace Exposition, Orlando, FL, USA, 4–7 January 2011. [Google Scholar]
- Viselli, A.; Forristall, G.; Dagher, H. Estimation of extreme wave and wind design parameters for offshore wind turbines in the Gulf of Maine using a POT method. Ocean Eng. 2015, 104, 649–658. [Google Scholar] [CrossRef]
- American Bureau of Shipping (ABS). ABS Rules for Building and Classing Floating Production Installations; American Bureau of Shipping: Houston, TX, USA, 2014.
- Owens, B.C. Theoretical Developments and Practical Aspects of Dynamic Systems in Wind Energy Application. Ph.D. Dissertation, Department of Aerospace Engineering, Texas A&M University, College Station, TX, USA, 2013. [Google Scholar]
- Wehmeyer, C.; Ferri, F.; Andersen, M.T.; Pedersen, R.R. Hybrid Model Representation of a TLP Including Flexible Topsides in Non-Linear Regular Waves. Energies 2014, 7, 5047–5064. [Google Scholar] [CrossRef]
- Gueydon, S.; Jonkman, J. Update on the Comparison of Second-Order Loads on a Tension Leg Platform for Wind Turbines. In Proceedings of the Twenty-Sixth International Ocean and Polar Engineering Conference (ISOPE), Rhodes, Greece, 26 June–1 July 2016. [Google Scholar]
- Det Norske Veritas (DNV). DNVGL-OTG-13, Offshore Technical Guidance; Det Norske Veritas (DNV): Høvik, Norway, 2019. [Google Scholar]
- American Petroleum Institute (API). API RP 2SK Design and Analysis of Stationkeeping Systems for Floating Structures; American Petroleum Institute: Washington, DC, USA, 2005. [Google Scholar]


| Items | Parameter | Unit | Value |
|---|---|---|---|
| displacement and dimensions | displacement | ton | 7539 |
| operating draft | m | 16.5 | |
| length overall | m | 70.7 | |
| outer column diameter (each) | m | 5.2 | |
| tower interface node diameter | m | 10 | |
| tower interface height above SWL | m | 14 | |
| mass | turbine | ton | 1858 |
| hull steel and water ballast | ton | 2779 | |
| vertical CoG above SWL | m | 17.4 |
| Parameter | Unit | Value |
|---|---|---|
| number of tendons | - | 9 |
| tendon length each | m | 83.5 |
| tendon size | mm | 133 |
| axial stiffness | kN | 1.6 × 10⁶ |
| MBL | kN | 17,171 |
| material type | - | spiral strand wire |
| Items | Sub-Items | Unit | Value |
|---|---|---|---|
| dimensions | rotor diameter | m | 151 |
| swept area | m2 | 18,596 | |
| number of blades | - | 3 | |
| tower height | m | 187.7 | |
| tower base diameter | m | 8.5 | |
| mass | total | ton | 1858 |
| CoG above tower base | m | 42.1 | |
| operation data | cut-in/cut-out | m/s | 5/25 |
| Rated | m/s | 15 | |
| PC above tower base | m | 95.4 |
| DLCs | Wind at PC | Hs | Tp | γ | Current |
|---|---|---|---|---|---|
| m/s | m | s | - | m/s | |
| DLC 1.6 power production | 5 | 6.39 | 11.58 | 2.75 | 0.16 |
| 8 | 8.02 | 12.74 | 2.75 | 0.16 | |
| 10 | 8.1 | 12.79 | 2.75 | 0.16 | |
| 12 | 8.5 | 13.07 | 2.75 | 0.17 | |
| 15 | 9.8 | 13.94 | 2.75 | 0.20 | |
| 18 | 9.8 | 13.94 | 2.75 | 0.24 | |
| 20 | 9.8 | 13.94 | 2.75 | 0.27 | |
| 22 | 9.8 | 13.94 | 2.75 | 0.30 | |
| 25 | 9.8 | 13.94 | 2.75 | 0.37 | |
| DLC 6.1, parked | 33.38 | 9.8 | 14.2 | 2.75 | 1.05 |
| Tower Model | 1st Mode (Hz) | 3rd Mode (Hz) | Analysis Tool |
|---|---|---|---|
| tower + blade lumped mass | 0.209 | 0.816 | Orcaflex |
| tower only | 0.244 | 0.958 | Orcaflex |
| tower only | 0.249 | 0.953 | ANSYS |
| Method | K11 | K15 | K24 | K33 | K44 | K55 | K66 |
|---|---|---|---|---|---|---|---|
| kN/m | kN/rad | kN/rad | kN/m | kNm/rad | kNm/rad | kNm/rad | |
| Simulation | 333 | −5495 | 5495 | 172,347 | 1.87 × 10⁸ | 1.87 × 10⁸ | 7.24 × 10⁵ |
| Theory | 341 | −5625 | 5625 | 172,347 | 1.87 × 10⁸ | 1.87 × 10⁸ | 7.41 × 10⁵ |
| Difference (%) | −2.32 | −2.32 | −2.32 | 0.00 | −0.04 | −0.04 | −2.32 |
| Tower Model | Surge | Sway | Heave | Roll | Pitch | Yaw |
|---|---|---|---|---|---|---|
| flexible tower, s (Hz) | 34.76 (0.03) | 34.76 (0.03) | 1.71 (0.59) | 1.72 (0.58) | 1.73 (0.58) | 25.17 (0.04) |
| rigid tower, s (Hz) | 34.76 (0.03) | 34.76 (0.03) | 1.71 (0.59) | 1.92 (0.53) | 1.93 (0.52) | 25.17 (0.04) |
Disclaimer/Publisher’s Note: The statements, opinions and data contained in all publications are solely those of the individual author(s) and contributor(s) and not of MDPI and/or the editor(s). MDPI and/or the editor(s) disclaim responsibility for any injury to people or property resulting from any ideas, methods, instructions or products referred to in the content. |
© 2023 by the authors. Licensee MDPI, Basel, Switzerland. This article is an open access article distributed under the terms and conditions of the Creative Commons Attribution (CC BY) license (https://creativecommons.org/licenses/by/4.0/).
Share and Cite
Boo, S.Y.; Shelley, S.A.; Griffith, D.T.; Escalera Mendoza, A.S. Responses of a Modular Floating Wind TLP of MarsVAWT Supporting a 10 MW Vertical Axis Wind Turbine. Wind 2023, 3, 513-544. https://doi.org/10.3390/wind3040029
Boo SY, Shelley SA, Griffith DT, Escalera Mendoza AS. Responses of a Modular Floating Wind TLP of MarsVAWT Supporting a 10 MW Vertical Axis Wind Turbine. Wind. 2023; 3(4):513-544. https://doi.org/10.3390/wind3040029
Chicago/Turabian StyleBoo, Sung Youn, Steffen Allan Shelley, D. Todd Griffith, and Alejandra S. Escalera Mendoza. 2023. "Responses of a Modular Floating Wind TLP of MarsVAWT Supporting a 10 MW Vertical Axis Wind Turbine" Wind 3, no. 4: 513-544. https://doi.org/10.3390/wind3040029
APA StyleBoo, S. Y., Shelley, S. A., Griffith, D. T., & Escalera Mendoza, A. S. (2023). Responses of a Modular Floating Wind TLP of MarsVAWT Supporting a 10 MW Vertical Axis Wind Turbine. Wind, 3(4), 513-544. https://doi.org/10.3390/wind3040029