Brief Report

Constraining the Inner Galactic DM Density Profile with H.E.S.S.

by
Jaume Zuriaga-Puig
1,2
1
Instituto de Física Teórica, IFT UAM-CSIC, Calle Nicolás Cabrera 13-15, Campus de Cantoblanco, E-28049 Madrid, Spain
2
Departamento de Física Teórica, Mod. 15, Universidad Autónoma de Madrid, E-28049 Madrid, Spain
Astronomy 2024, 3(2), 114-121; https://doi.org/10.3390/astronomy3020008
Submission received: 31 January 2024 / Revised: 25 March 2024 / Accepted: 29 March 2024 / Published: 11 April 2024
(This article belongs to the Special Issue Current Trends in Cosmology)

Abstract

:
In this short review, corresponding to a talk given at the conference “Cosmology 2023 in Miramare”, we combine an analysis of five regions observed by H.E.S.S. in the Galactic Center, intending to constrain the Dark Matter (DM) density profile in a WIMP annihilation scenario. For the analysis, we include the state-of-the-art Galactic diffuse emission Gamma-optimized model computed with DRAGON and a wide range of DM density profiles from cored to cuspy profiles, including different kinds of DM spikes. Our results are able to constrain generalized NFW profiles with an inner slope γ 1.3 . When considering DM spikes, the adiabatic spike is completely ruled out. However, smoother spikes given by the interactions with the bulge stars are compatible if γ 0.8 , with an internal slope of γ sp-stars = 1.5 .

1. Introduction

In terms of the matter composition of the Universe, about 84 % of its matter content is in the form of a non-baryonic matter, known as Dark Matter (DM). Independent observations such as the Cosmic Microwave Background [1], galaxy rotation curves [2], and gravitational lensing studies [3], among others, have led to the same conclusion. The DM theory that can explain more successfully those pieces of evidence is known as cold DM, characterized usually by a mass of the order of ∼GeV-TeV and fast decoupling from the plasma in the primitive Universe. Within this scenario, Weakly Interacting Massive Particles (WIMPs) are some of the most studied candidates in the community in a variety of multidisciplinary approaches: in collider searches, direct detection experiments, and indirect searches [4,5]. This work focuses on the indirect detection approach, based on the annihilation of WIMP particles into SM particles, which are expected to create secondary fluxes of cosmic-rays (CRs) and gamma-rays. These fluxes can then be detected by ground-based and space telescopes, such as the Major Atmospheric Gamma-Ray Imaging Cherenkov (MAGIC), the High Energy Stereoscopic System (H.E.S.S.), the High-Altitude Water Cherenkov Observatory (HAWC) or Fermi, among others.
Such observations aim at DM-dominated targets, where the DM print should be higher than in others. Because of this, close targets with a low astrophysical gamma-ray emission are preferred. Amongst the possible candidates, dwarf galaxies [6] are one of the most studied, with a DM mass of 10 7 10 10 M . Other common candidates are, for example, investigating the possible DM print on the Isotropic Gamma-Ray Background [7] and Galaxy Clusters. The latter, with higher DM masses, are typically further and have an important astrophysical gamma-ray background flux that must be modeled. Finally, the target on which we will focus this short review, based on [8], is the Galactic Center (GC). The GC has the advantage that is the closest target with a high DM content. The counterpart is that this target contains a high astrophysical background emission, in the form of a Galactic diffuse emission and sources.

2. The Galactic Center

Our work is based on the possible TeV DM explanation for the observed flux in the inner GC region [9,10], but with the difference of setting constraints on the DM density profile assuming the thermal relic cross-section σ v = 2 3 × 10 26 cm3s−1 instead of setting upper limits on the annihilation cross-section. The reason for this is that there are many uncertainties, in both numerical simulations and observations, regarding the characterization of the DM density profile in the inner parsecs of the GC. Therefore, instead of assuming a DM density profile and obtaining upper limits on the annihilation cross-section, we will set the annihilation cross-section to the thermal relic and compare the results on a wide variety of DM density profiles: cuspy, cored, and spiky DM density profiles. Assuming a thermal relic cross-section and a Power-Law Galactic diffuse emission, an enhancement of 1000 over the benchmark Navarro–Frenk–White (NFW) density profile is needed to explain the gamma-ray flux detected by H.E.S.S. in the inner parsecs of the GC, with a fitted DM mass m DM 50 TeV annihilating into the Z channel [9,10]. This region, extending up to 15 pc around Sgr A*, is coincident with the VIR defined below. We will base our work on these conclusions, but with two main novelties: including more regions extending up to ∼450 pc and modeling the Galactic diffuse emission with the gamma-optimized model computed with DRAGON [11], instead of a simple Power-Law.
In order to do that, we will analyze published data from different observations of the GC by H.E.S.S., defining our five regions of interest (Figure 1): Very Inner Region (VIR) [12], Ridge [13], Diffuse Region [12], Halo [14,15], and the Inner Galactic Survey (IGS) [16]. Note in the figure that only one region observes the very inner GC, the VIR, while the rest of the regions mask the inner 15 pc. With this preamble, we will try to have an in-depth study of the different possibilities that can explain this enhancement of ∼1000, considering cuspy DM density profiles and DM spikes. Our most important region is, therefore, the VIR since it is the region where the DM enhancement is needed and, also, coincides with the peak of the DM density profile. As for the rest of the regions, given that they do not observe this peak, only constraints on its size and the outer shape of the density profile can be set.

3. Spectral Modeling
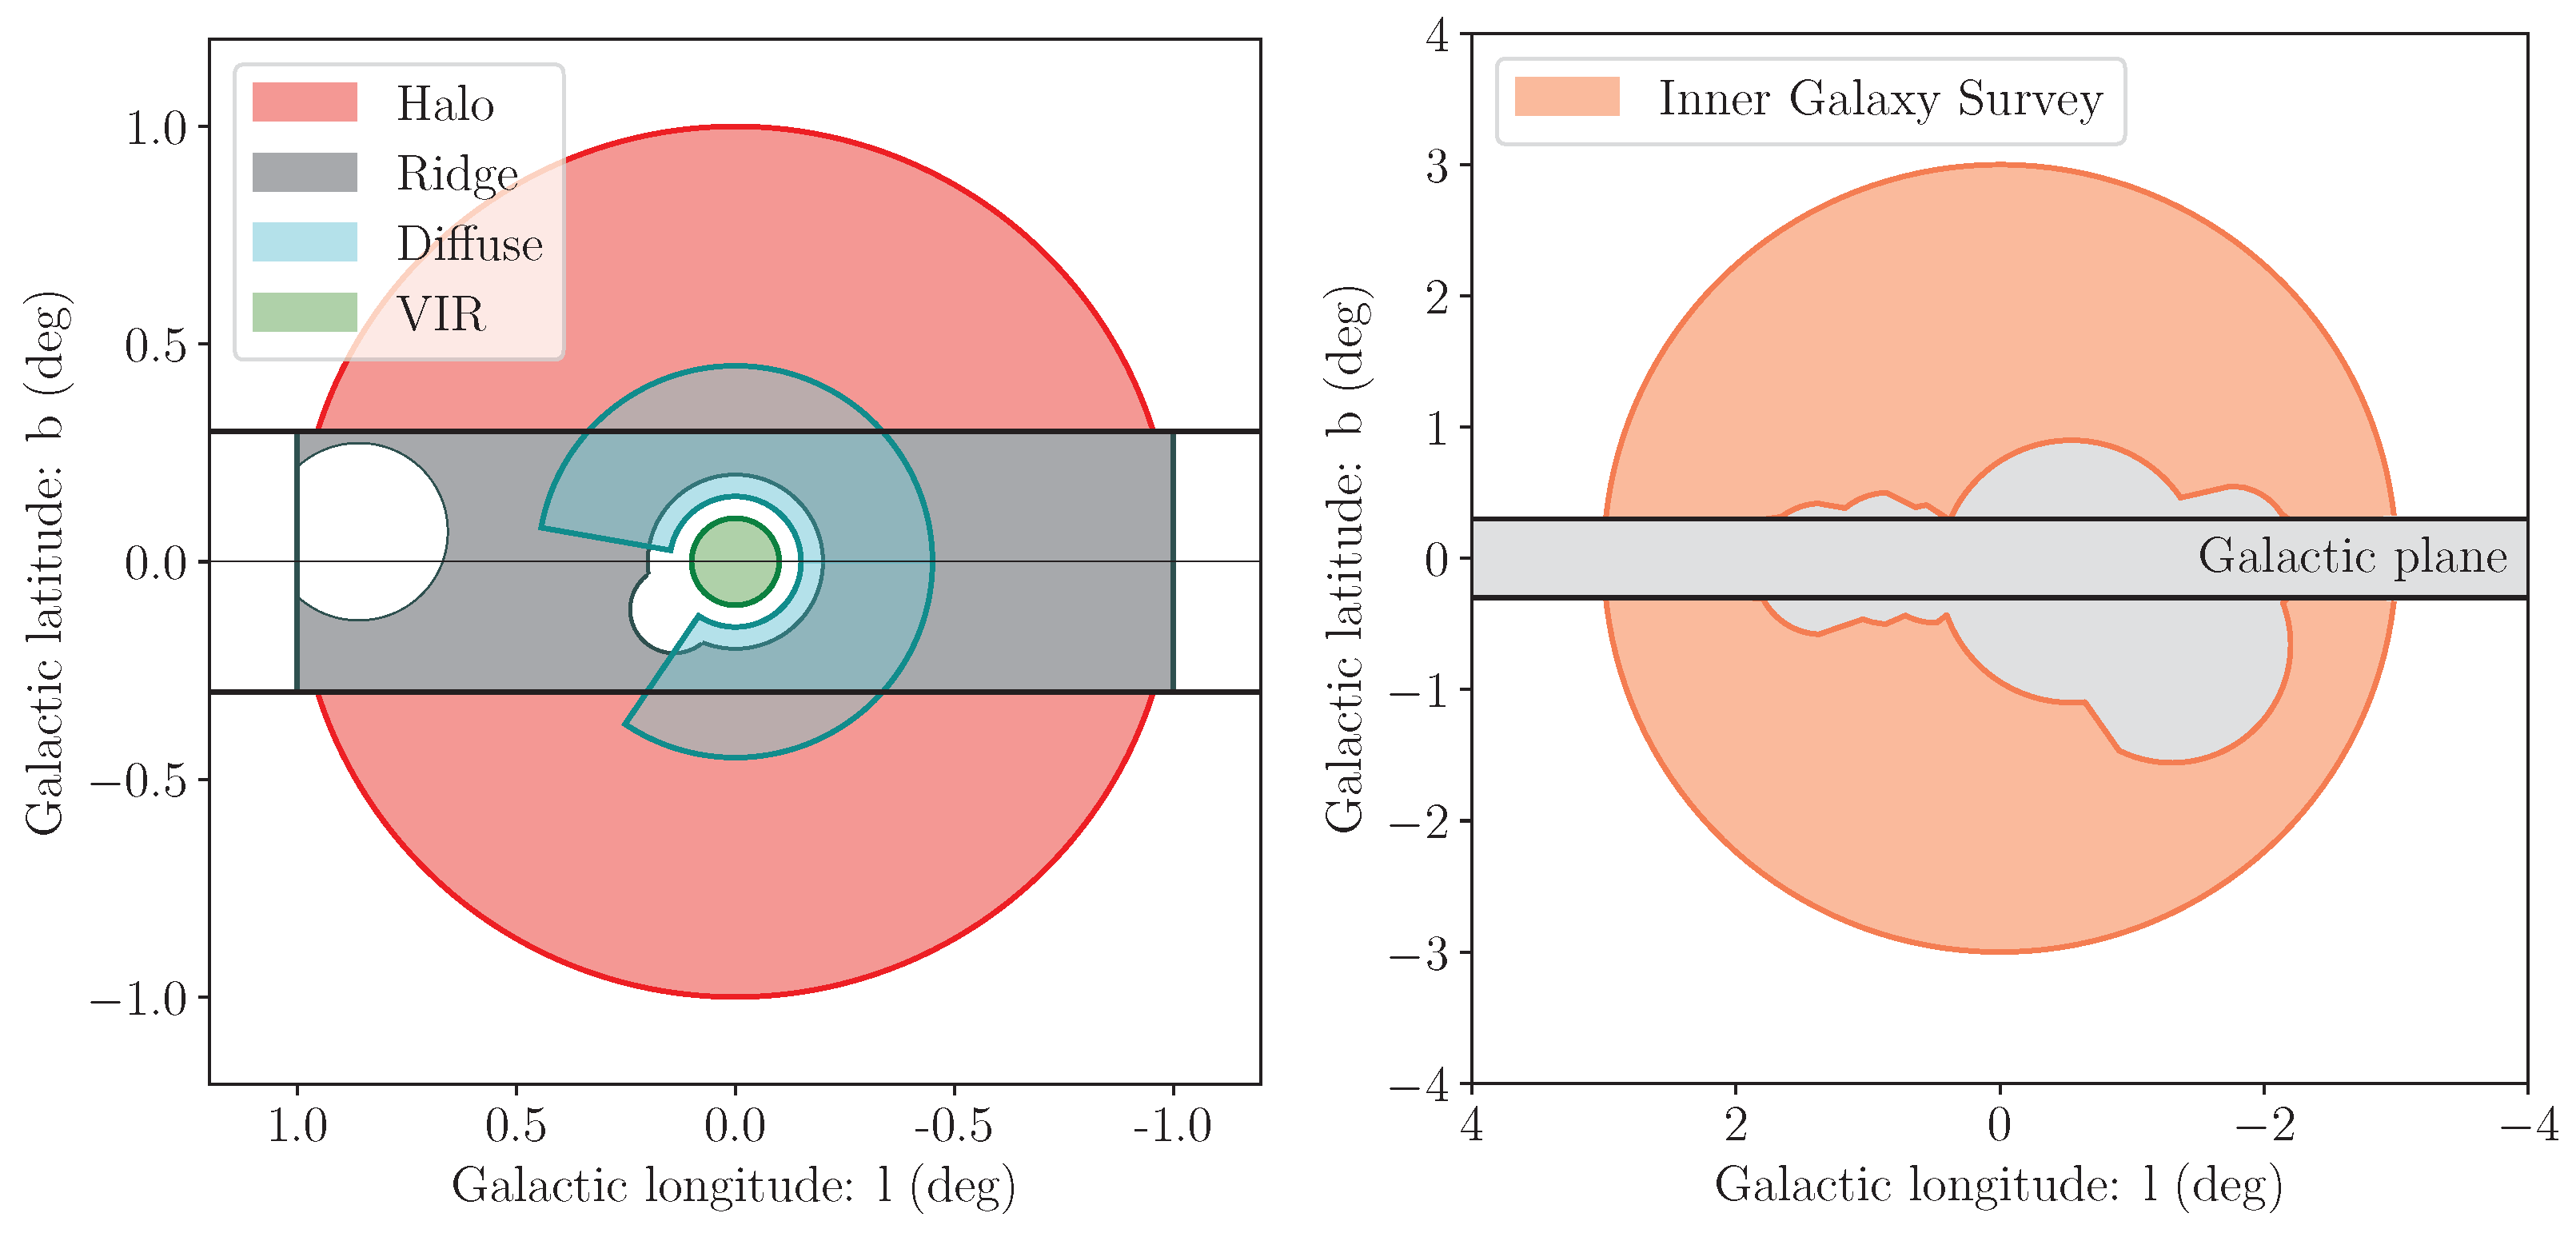
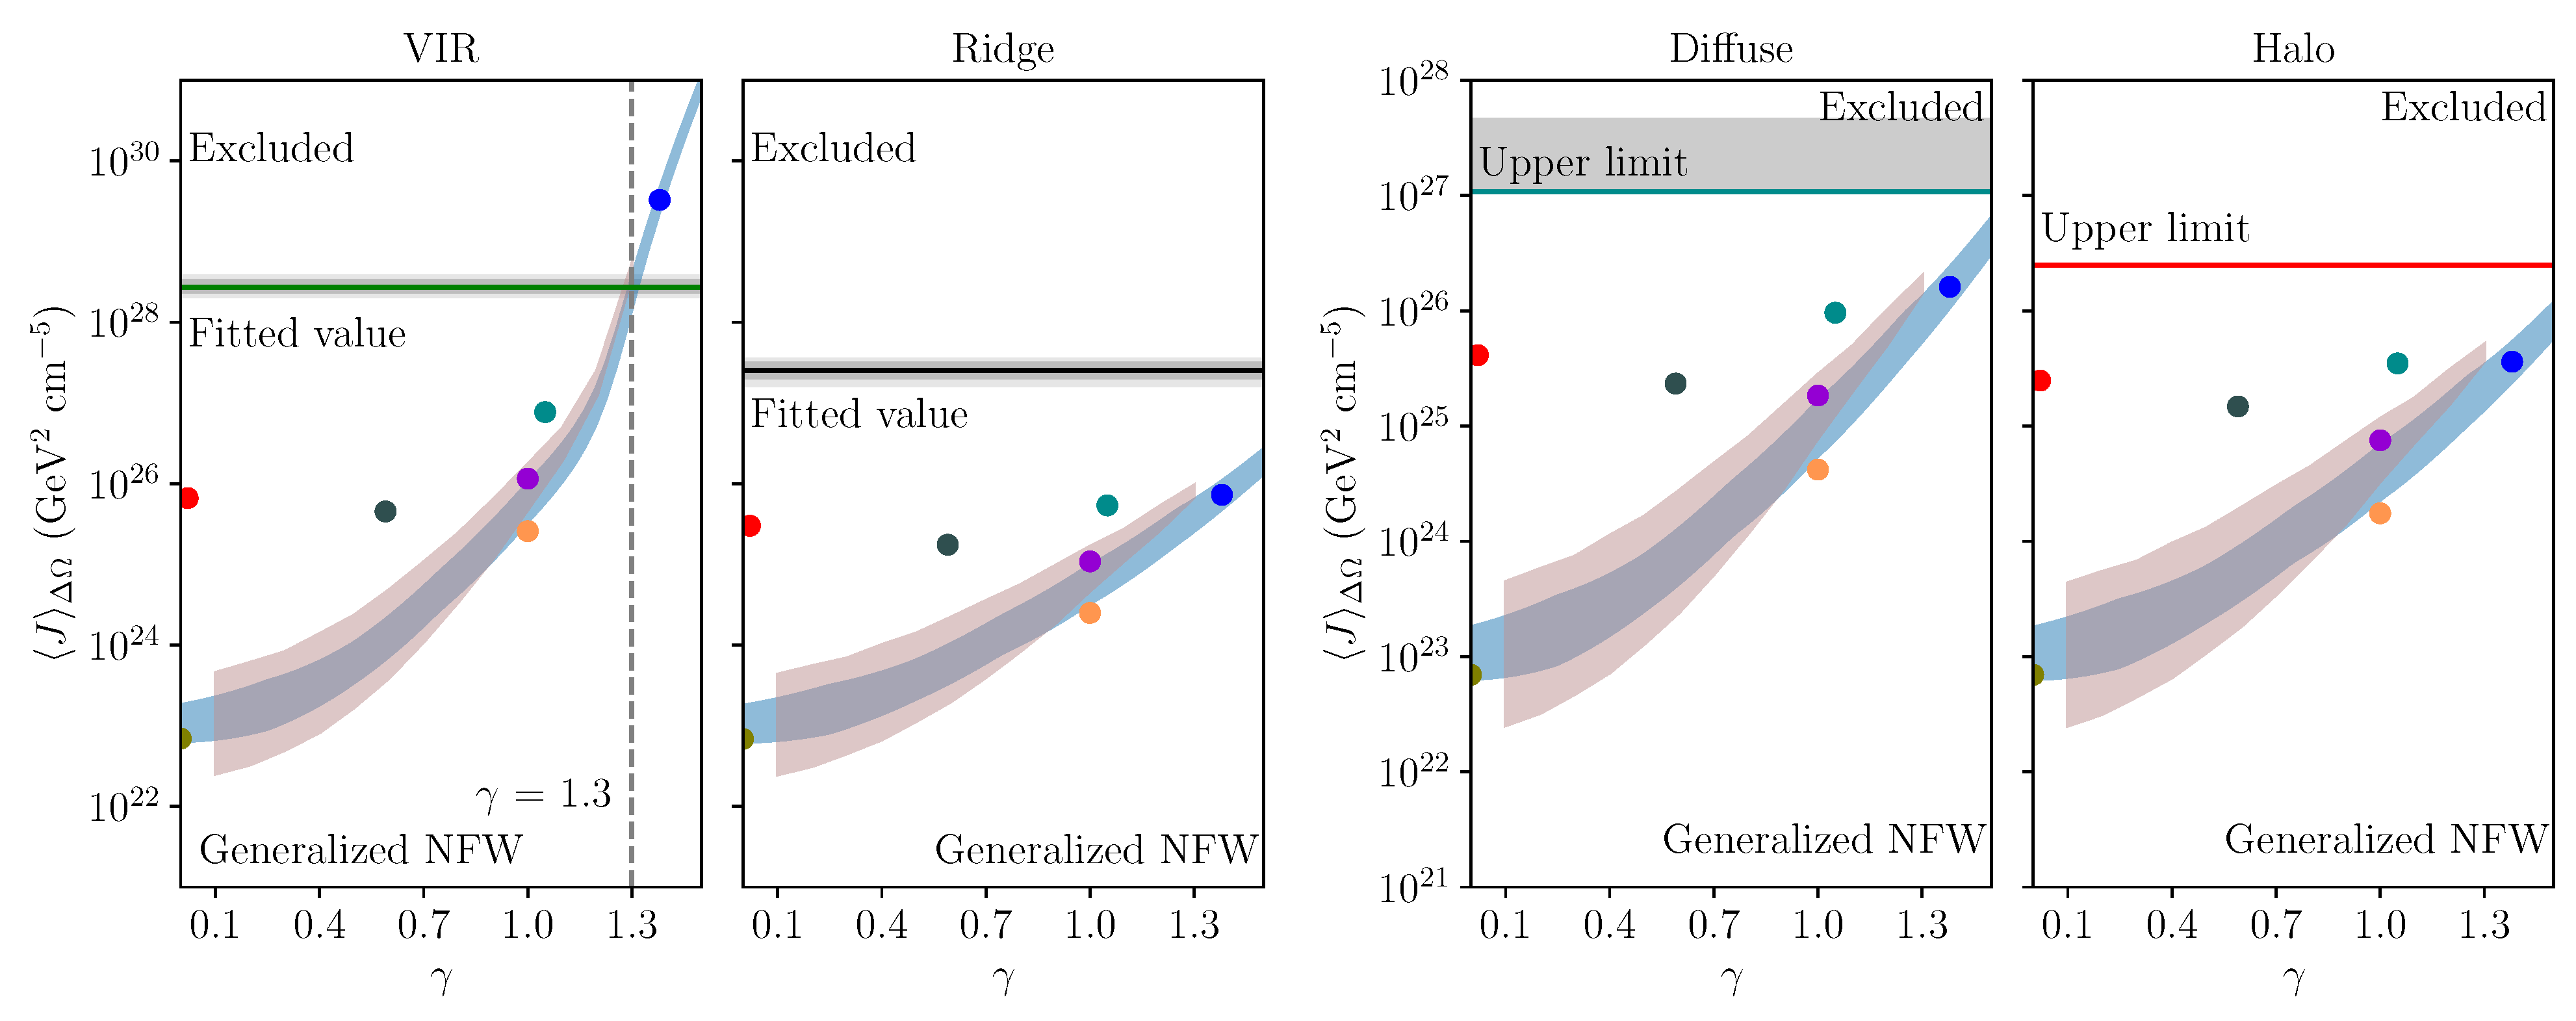
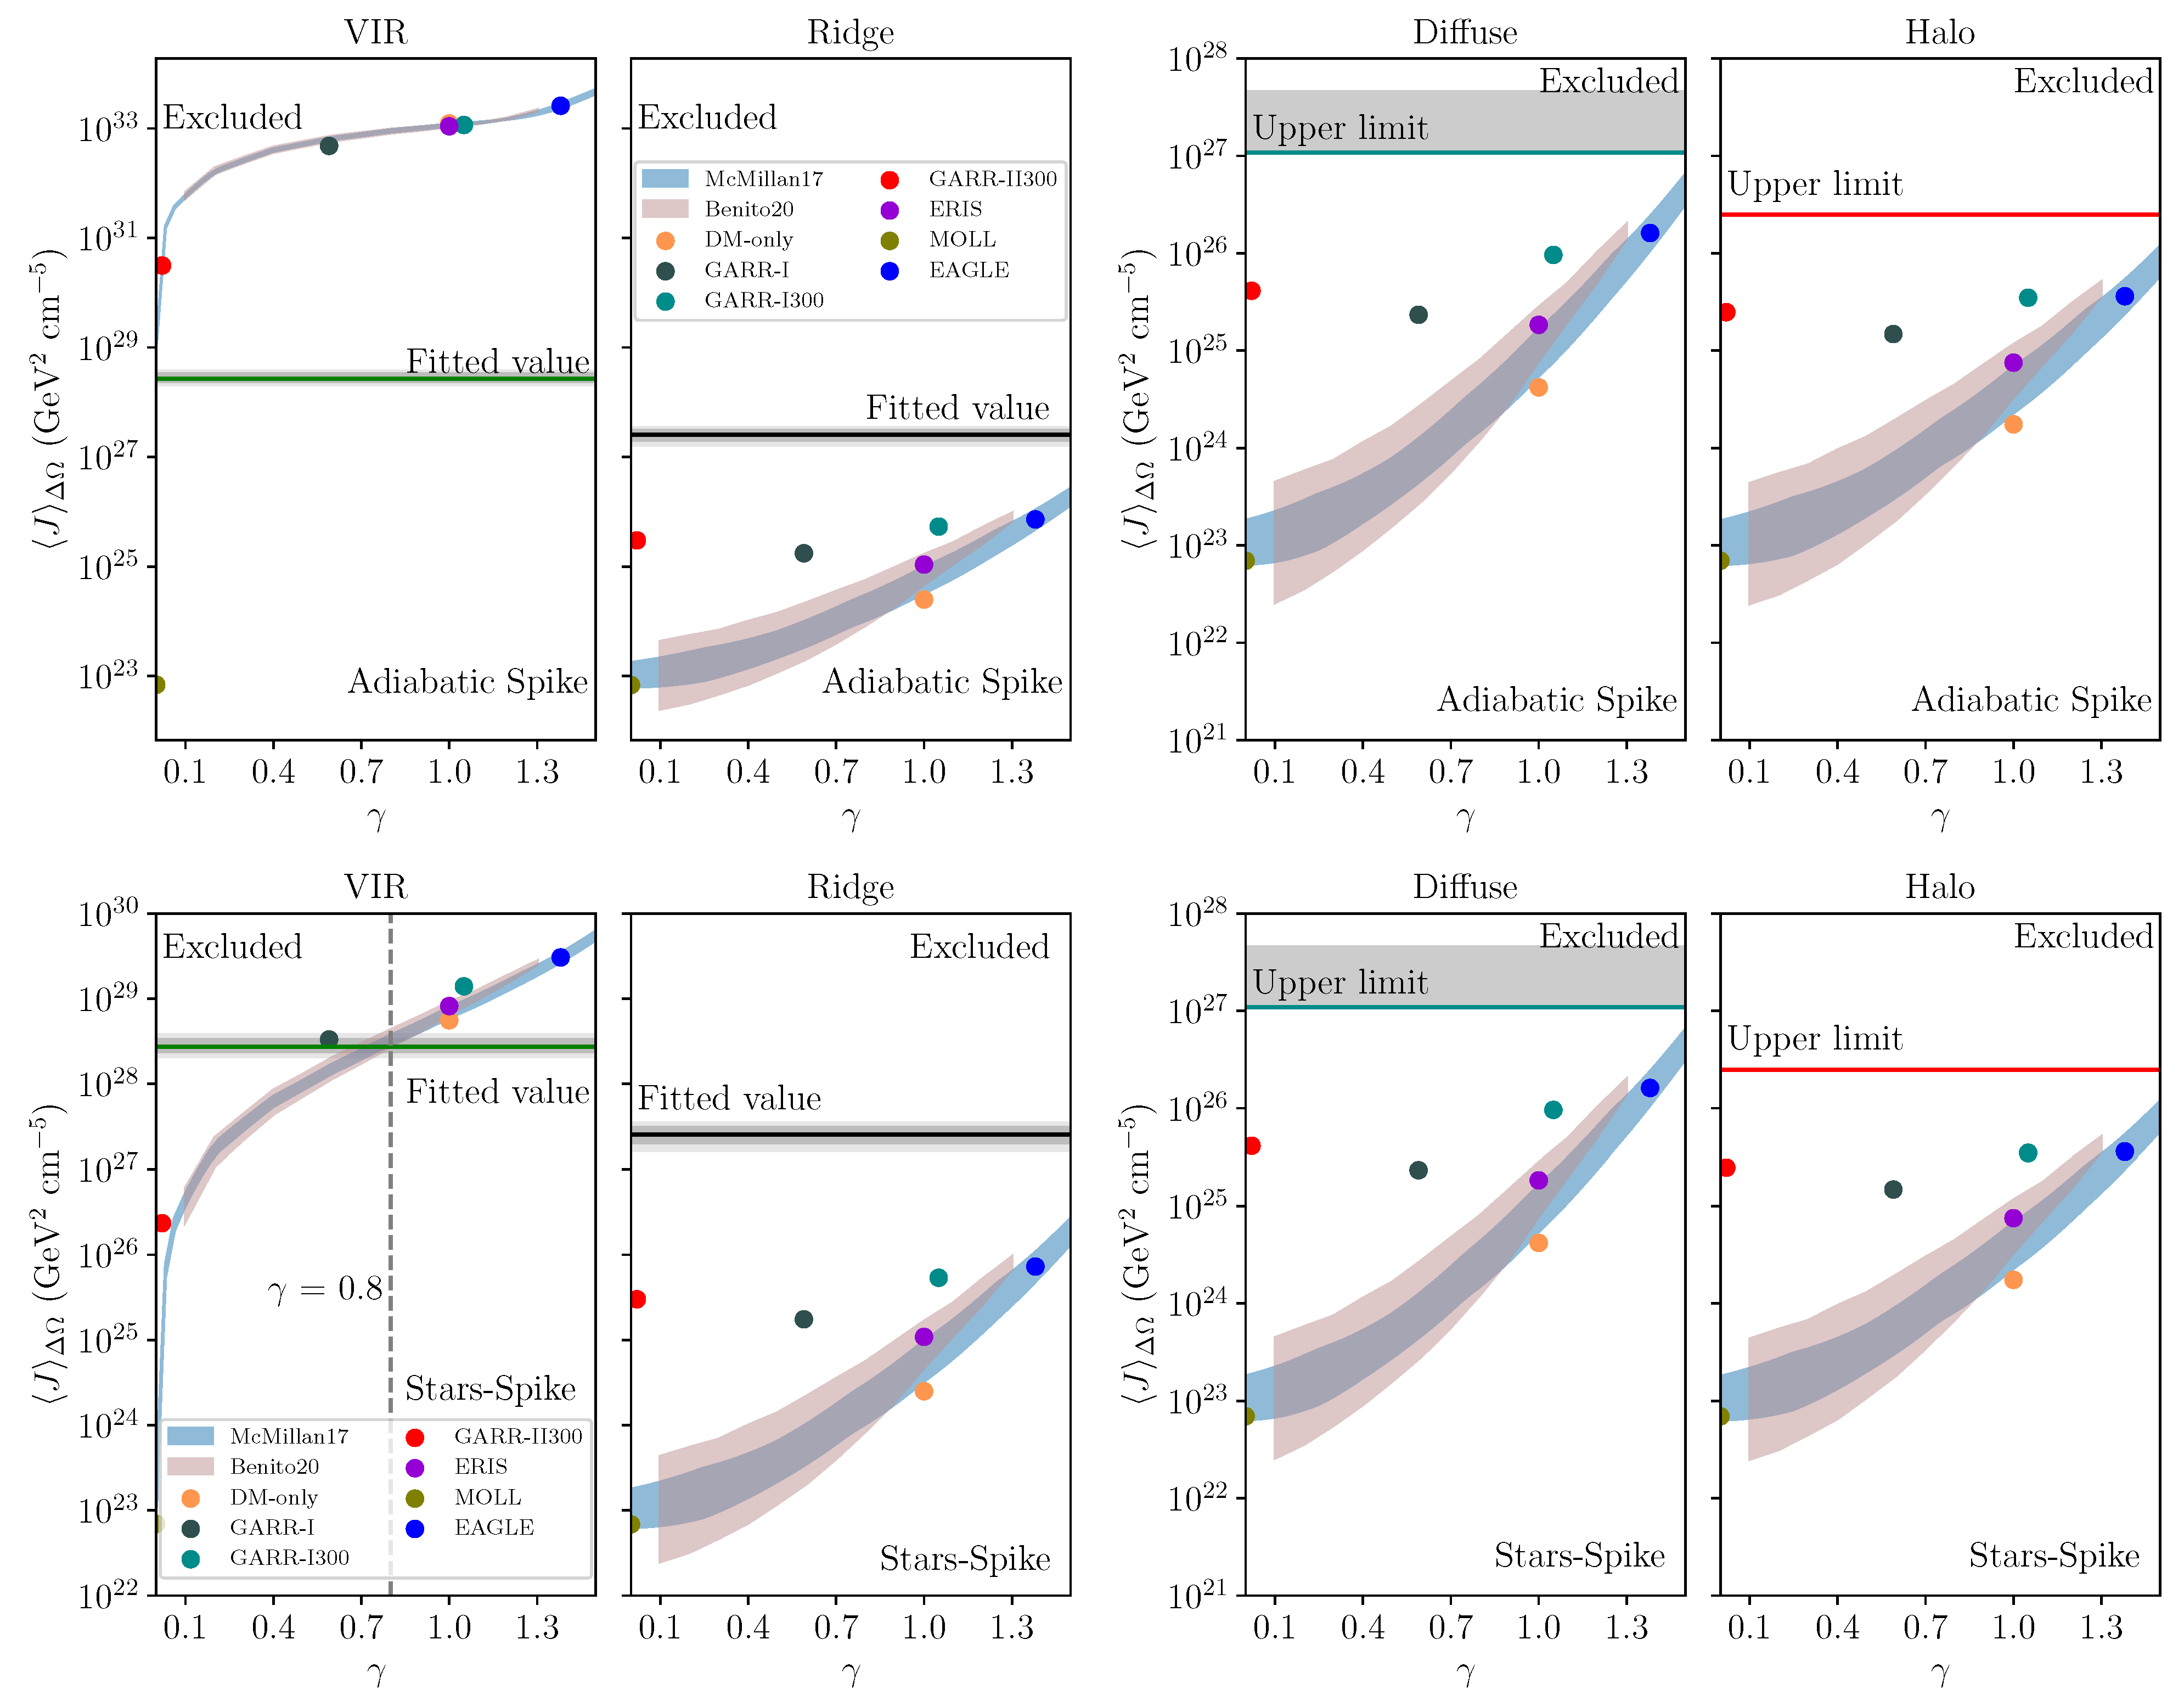
We will assume that the gamma-ray flux detected can be explained by the combination of two fluxes, the Galactic diffuse emission and the DM annihilation flux.
The gamma-ray flux produced by annihilating Majorana-type DM particles has the following form [17]:
d Φ DM d E = i channels σ v i 2 d N i d E Δ Ω J Δ Ω 4 π m DM 2 ,
where σ v i is the thermally averaged annihilation cross-section, Δ Ω is the solid angle of the region observed, m DM is the DM mass of the candidate particle, and the index i refers to the Standard Model channel, which is created in the DM annihilation, i.e., the Standard Model particle created after the annihilation. d N d E is the gamma-ray spectra produced by the subsequent interactions of the different primary products created in the DM annihilation, given by [18,19]. Finally, the J-factor J Δ Ω is where the DM spatial distribution is encoded, since it is the integral of the DM density profile squared ρ DM 2 along the line of sight l ( θ ^ ) [17]:
J Δ Ω = 1 Δ Ω Δ Ω d Ω l ( θ ^ ) min l ( θ ^ ) max ρ DM 2 [ r ( l ) ] d l ( θ ^ ) .
On the other hand, the Galactic diffuse emission is created by a sea of CRs confined in the Galaxy by the turbulent magnetic field. These charged CRs interact with the interstellar medium, emitting a bright diffuse radiation, which can be in the form of gamma-rays (and other wavelengths). Because of this, it needs to be modeled since the contribution to the flux can be dominant in most regions of the GC. In order to take into account this diffuse emission, we will use the Max gamma-optimized model computed with the Diffusion Reacceleration and Advection of Galactic cosmic-rays: an Open New code (DRAGON) [11,20,21], a model that is shown to be consistent with the H.E.S.S. observations in the Galactic Ridge region [22]. This diffuse model is tuned to follow observational data such as local charged CRs, gamma-rays, and other multi-wavelength fluxes in the Galactic plane. For more information about the gamma-optimized model, see [11]. In addition to the DRAGON model, we will leave as a free parameter the renormalization of the total flux B as an O ( 1 ) parameter that we allow to vary in each region:
d Φ Bg d E = B 2 d Φ DRAGON d E .
In order to compute our analysis, following [9,10], we will assume a modelization of the observed flux as a combination of the Galactic diffuse emission and the DM annihilation flux, coming from a thermal WIMP particle annihilating into the Z channel with the benchmark thermal relic cross-section σ v 2.2 × 10 26   cm 3 s 1 , which yields the observed DM relic abundance in the Universe for a TeV candidate [23]. The choice of this channel is because the best fit is obtained for the VIR when compared to other channels [8,9,10]. This approach is very conservative, but since our final aim is to set constraints on the DM density profile in the inner Galaxy ( r < 100 pc), the fit values, obtained with a χ 2 analysis, will serve us as upper limits on the J-factors. This follows the idea that, if a DM density profile gives higher J-factors than the fit ones, the theoretical gamma-ray flux would be greater than that observed, and therefore, it is excluded.

4. Spatial Modeling

As introduced in Equation (2), the DM density profile plays a big role in DM indirect searches, as the flux is proportional to the DM density profile squared. For the purpose of studying constraints on the DM density profile, we focus on comparing the fit J-factors obtained in each region with different models coming form N-body simulations (DM-only, GARR, GARR-I, GARR-I300, GARR-II300, ERIS, MOLL, and EAGLE) and dynamical studies of the Milky Way (McMillan17 [24] and Benito20 [2]). To model it, we used the generalized NFW profile (Equation (4) [25]), which contains different key parameters, allowing us to obtain a wide range of profiles, from cuspy profiles to cored profiles (see Table 1 for the characterization of all the DM density profiles used in this work).
ρ halo ( r ) = ρ s ( r r s ) γ ( 1 + ( r r s ) α ) β γ α ,
with r s being the scale radius of the profile and ρ s the normalization factor, given by the value of the local DM density ρ ; α and β define the external slope of the profile and γ the internal slope. The characterization of external/internal is mainly determined by the scale radius r s , meaning that, when r r s , the profile is proportional to ρ halo 1 / r γ . As can be seen in Table 1, the values of the scale radius are of the order of kpc, greater than the size of the regions we are considering, so the most important parameters for our analysis are the internal slope γ and the renormalization ρ s . However, the latter parameter can be related to the local DM density ρ directly (see Table 1), so we will focus our analysis on the γ parameter.
We also consider different kinds of DM spikes coming from the growth of the Super Massive Black Hole Sgr A*. For this case, we follow the adiabatic spike formalism described in [28,29], where the DM density profile is highly enhanced inside R sp , changing the slope of the profile up to γ sp = ( 9 2 γ ) / ( 4 γ ) (for the outer part of the density profile, it behaves as Equation (4) without any modification). This kind of spike is created assuming that Sgr A* has grown adiabatically, i.e., slowly compared to the typical timescales of the system, in the center of the Galaxy and without suffering big mergers during the last 10 Gyr [30]. For a more realistic scenario, we have considered the dynamical interactions of the DM particles with the stars of the bulge [31,32]. In this case, which we call star spike, we have the same profile as in the adiabatic spike, but with the difference in the internal slope to γ star = 1.5 inside the radius of influence of Sgr A* ( r b = 2 pc). For this work, we present all the J-factors in the regions defined in Figure 1 computed with all the profiles in Table 1, and also considering the two types of DM spikes.

5. Results

Following the different models considered, here, we present the fit values from the gamma-ray analysis (Table 2), obtained with a χ 2 analysis, and upper limits on the J-factors for the three approaches presented (Figure 2): generalized NFW (upper row), adiabatic spike (second row) and star spike (last row). Following our approach, the fit value for the DM mass is m DM = 36 6 + 4 TeV (1 σ uncertainty), obtained in the VIR since it is where the DM signal should be more prominent as it is where the DM density profile peaks. However, it has been tested that leaving it as a free parameter in the Ridge region, the same results are obtained, but with greater error bars. For the Diffuse Region, Halo, and IGS, the background diffuse emission is dominant since these regions are defined such that the inner part of the GC, the VIR, is masked. This translates into the fact that, in the Diffuse Region, the 2 σ region for the fit J-factor is compatible with 0; hence, in the figures, it is labeled as an upper limit. For the Halo and IGS, similar upper limits are obtained for the J-factor, so we only show the results for the Halo in the figures.
As we can see, in Figure 2, we can exclude the computed J-factors above the fit ones. This reason is because a greater J-factor would yield a greater gamma-ray flux than that observed, ruling out, then, the underlying DM density profile. Studying the VIR, for the generalized NFW approach, the crossing point is at γ 1.3 , so cuspier profiles are ruled out. For the adiabatic spike, all slopes are ruled out (except with γ 1 ). Finally, for the star spike, we can rule out profiles with slopes γ 0.8 . However, in the rest of the regions, since they do not contain the peak of the DM density profile, no profiles can be excluded. Thanks to this, we can set constraints for the size of the spike at θ s p θ D i f f = ( 0.15 0.45 ° ) . This constraint is independent of the spike model used and also serves as a consistency check between our assumptions, the observed gamma-ray flux, and the size and slope of the cusp of the inner DM density profile: a DM cuspy profile in the inner pc of the GC dominating the gamma-ray flux and, for the outer part, a domination of the Galactic diffuse emission.

Funding

This work has been supported by the grants PID2021-125331NB-I00, PID2022-139841NB-I00, and CEX2020-001007-S, funded by MCIN/AEI/10.13039/501100011033, by “ERDF A way of making Europe”, and the MULTIDARK Project RED2022-134411-T. The author’s contribution to this work has been supported by the FPI Severo Ochoa PRE2021-099137 grant.

Data Availability Statement

The original contributions presented in the study are included in the article, further inquiries can be directed to the corresponding author/s.

Acknowledgments

This manuscript is based on the published paper of Jaume Zuriaga-Puig et al. [8], made in collaboration with Viviana Gammaldi, Daniele Gaggero, Thomas Lacroix, and Miguel Ángel Sánchez-Conde. I would like to thank Rafael Alves Batista and the DAMASCO group for useful and fruitful discussions.

Conflicts of Interest

The author declares no conflicts of interest. The funders had no role in the design of the study; in the collection, analyses, or interpretation of the data; in the writing of the manuscript; nor in the decision to publish the results.

Abbreviations

The following abbreviations are used in this manuscript:
DMDark Matter
CRcosmic-ray
H.E.S.S.High Energy Stereoscopic System
GCGalactic Center
DRAGONDiffusion Reacceleration and Advection of Galactic cosmic-rays
NFWNavarro–Frenk–White

References

  1. Aghanim, N.; Akrami, Y.; Ashdown, M.; Aumont, J.; Baccigalupi, C.; Ballardini, M.; Banday, A.J.; Barreiro, R.B.; Bartolo, N.; Basak, S.; et al. Planck 2018 results. VI. Cosmological parameters. Astron. Astrophys. 2020, 641, A6, Erratum in Astron. Astrophys. 2021, 652, C4. [Google Scholar] [CrossRef]
  2. Benito, M.; Iocco, F.; Cuoco, A. Uncertainties in the Galactic Dark Matter distribution: An update. Phys. Dark Univ. 2021, 32, 100826. [Google Scholar] [CrossRef]
  3. Clowe, D.; Bradač, M.; Gonzalez, A.H.; Markevitch, M.; Randall, S.W.; Jones, C.; Zaritsky, D. A Direct Empirical Proof of the Existence of Dark Matter. Astrophys. J. 2006, 648, L109–L113. [Google Scholar] [CrossRef]
  4. Gaskins, J.M. A review of indirect searches for particle dark matter. Contemp. Phys. 2016, 57, 496–525. [Google Scholar] [CrossRef]
  5. Gammaldi, V. Multimessenger Multi-TeV Dark Matter. Front. Astron. Space Sci. 2019, 6, 19. [Google Scholar] [CrossRef]
  6. Charles, E.; Sanchez-Conde, M.; Anderson, B.; Caputo, R.; Cuoco, A.; Di Mauro, M.; Drlica-Wagner, A.; Gomez-Vargas, G.A.; Meyer, M.; Tibaldo, L.; et al. Sensitivity Projections for Dark Matter Searches with the Fermi Large Area Telescope. Phys. Rep. 2016, 636, 1–46. [Google Scholar] [CrossRef]
  7. Delos, M.S.; Korsmeier, M.; Widmark, A.; Blanco, C.; Linden, T.; White, S.D.M. Limits on dark matter annihilation in prompt cusps from the isotropic gamma-ray background. arXiv 2023, arXiv:2307.13023. [Google Scholar]
  8. Zuriaga-Puig, J.; Gammaldi, V.; Gaggero, D.; Lacroix, T.; Sánchez-Conde, M.A. Multi-TeV dark matter density in the inner Milky Way halo: Spectral and dynamical constraints. J. Cosmol. Astropart. Phys. 2023, 11, 63. [Google Scholar] [CrossRef]
  9. Cembranos, J.A.R.; Gammaldi, V.; Maroto, A.L. Possible dark matter origin of the gamma ray emission from the Galactic Center observed by HESS. Phys. Rev. D Part. Fields Gravit. Cosmol. 2012, 86, 103506. [Google Scholar] [CrossRef]
  10. Cembranos, J.A.R.; Gammaldi, V.; Maroto, A.L. Spectral Study of the HESS J1745-290 Gamma-Ray Source as Dark Matter Signal. J. Cosmol. Astropart. Phys. 2013, 4, 51. [Google Scholar] [CrossRef]
  11. De La Torre Luque, P.; Gaggero, D.; Grasso, D.; Fornieri, O.; Egberts, K.; Steppa, C.; Evoli, C. Galactic diffuse gamma rays meet the PeV frontier. Astron. Astrophys. 2023, 672, A58. [Google Scholar] [CrossRef]
  12. Abramowski, A.; Aharonian, F.; Benkhali, F.A.; Akhperjanian, A.G.; Angüner, E.O.; Backes, M.; Balzer, A.; Becherini, Y.; Tjus, J.B.; Berge, D.; et al. Acceleration of petaelectronvolt protons in the Galactic Centre. Nature 2016, 531, 476. [Google Scholar] [CrossRef]
  13. Abdalla, H.; Abramowski, A.; Aharonian, F.; Benkhali, F.A.; Akhperjanian, A.G.; Andersson, T.; Angüner, E.O.; Arakawa, M.; Arrieta, M.; Aubert, P.; et al. Characterising the VHE diffuse emission in the central 200 parsecs of our Galaxy with H.E.S.S. Astron. Astrophys. 2018, 612, A9. [Google Scholar] [CrossRef]
  14. Abdallah, H.; Abramowski, A.; Aharonian, F.; Benkhali, F.A.; Akhperjanian, A.G.; Angüner, E.; Arrieta, M.; Aubert, P.; Backes, M.; Balzer, A.; et al. Search for dark matter annihilations towards the inner Galactic halo from 10 years of observations with H.E.S.S. Phys. Rev. Lett. 2016, 117, 111301. [Google Scholar] [CrossRef]
  15. Abramowski, A.; Acero, F.; Aharonian, F.; Akhperjanian, A.G.; Anton, G.; Barnacka, A.; De Almeida, U.B.; Bazer-Bachi, A.R.; Becherini, Y.; Becker, J.; et al. Search for a Dark Matter annihilation signal from the Galactic Center halo with H.E.S.S. Phys. Rev. Lett. 2011, 106, 161301. [Google Scholar] [CrossRef]
  16. Abdalla, H.; Aharonian, F.; Benkhali, F.A.; Angüner, E.O.; Armand, C.; Ashkar, H.; Backes, M.; Baghmanyan, V.; Martins, V.B.; Batzofin, R.; et al. Search for Dark Matter Annihilation Signals in the H.E.S.S. Inner Galaxy Survey. Phys. Rev. Lett. 2022, 129, 111101. [Google Scholar] [CrossRef] [PubMed]
  17. Evans, N.W.; Ferrer, F.; Sarkar, S. A travel guide to the dark matter annihilation signal. Phys. Rev. D 2004, 69, 123501. [Google Scholar] [CrossRef]
  18. Cirelli, M.; Corcella, G.; Hektor, A.; Hütsi, G.; Kadastik, M.; Panci, P.; Raidal, M.; Sala, F.; Strumia, A. PPPC 4 DM ID: A poor particle physicist cookbook for dark matter indirect detection. J. Cosmol. Astropart. Phys. 2011, 3, 51. [Google Scholar] [CrossRef]
  19. Ciafaloni, P.; Comelli, D.; Riotto, A.; Sala, F.; Strumia, A.; Urbano, A. Weak Corrections are Relevant for Dark Matter Indirect Detection. J. Cosmol. Astropart. Phys. 2011, 3, 19. [Google Scholar] [CrossRef]
  20. Evoli, C.; Gaggero, D.; Grasso, D.; MacCione, L. Cosmic ray nuclei, antiprotons and gamma rays in the galaxy: A new diffusion model. J. Cosmol. Astropart. Phys. 2008, 10, 018. [Google Scholar] [CrossRef]
  21. Evoli, C.; Gaggero, D.; Vittino, A.; Bernardo, G.D.; Mauro, M.D.; Ligorini, A.; Ullio, P.; Grasso, D. Cosmic-ray propagation with DRAGON2: I. numerical solver and astrophysical ingredients. J. Cosmol. Astropart. Phys. 2017, 2, 15. [Google Scholar] [CrossRef]
  22. Gaggero, D.; Grasso, D.; Marinelli, A.; Taoso, M.; Urbano, A. Diffuse cosmic rays shining in the Galactic center: A novel interpretation of H.E.S.S. and Fermi-LAT γ-ray data. Phys. Rev. Lett. 2017, 119, 031101. [Google Scholar] [CrossRef] [PubMed]
  23. Steigman, G.; Dasgupta, B.; Beacom, J.F. Precise Relic WIMP Abundance and its Impact on Searches for Dark Matter Annihilation. Phys. Rev. D 2012, 86, 023506. [Google Scholar] [CrossRef]
  24. McMillan, P.J. The mass distribution and gravitational potential of the Milky Way. Mon. Not. R. Astron. Soc. 2017, 465, 76–94. [Google Scholar] [CrossRef]
  25. Zhao, H. Analytical models for galactic nuclei. Mon. Not. Roy. Astron. Soc. 1996, 278, 488–496. [Google Scholar] [CrossRef]
  26. Gammaldi, V.; Avila-Reese, V.; Valenzuela, O.; Gonzalez-Morales, A.X. Analysis of the very inner Milky Way dark matter distribution and gamma-ray signals. Phys. Rev. D 2016, 94, 121301. [Google Scholar] [CrossRef]
  27. Abuter, R.; Aimar, N.; Amorim, A.; Ball, J.; Bauböck, M.; Berger, J.P.; Bonnet, H.; Bourdarot, G.; Brander, W.; Cardoso, V.; et al. Mass distribution in the Galactic Center based on interferometric astrometry of multiple stellar orbits. Astron. Astrophys. 2022, 657, L12. [Google Scholar] [CrossRef]
  28. Gondolo, P.; Silk, J. Dark matter annihilation at the galactic center. Phys. Rev. Lett. 1999, 83, 1719–1722. [Google Scholar] [CrossRef]
  29. Sadeghian, L.; Ferrer, F.; Will, C.M. Dark matter distributions around massive black holes: A general relativistic analysis. Phys. Rev. D 2013, 88, 063522. [Google Scholar] [CrossRef]
  30. Ciucă, I.; Kawata, D.; Ting, Y.S.; Grand, R.J.J.; Miglio, A.; Hayden, M.; Baba, J.; Fragkoudi, F.; Monty, S.; Buder, S.; et al. Chasing the impact of the Gaia-Sausage-Enceladus merger on the formation of the Milky Way thick disc. Mon. Not. R. Astron. Soc. Lett. 2023, 528, L122–L126. [Google Scholar] [CrossRef]
  31. Vasiliev, E.; Zelnikov, M. Dark matter dynamics in the galactic center. Phys. Rev. D 2008, 78, 083506. [Google Scholar] [CrossRef]
  32. Bertone, G.; Merritt, D. Dark matter dynamics and indirect detection. Mod. Phys. Lett. A 2005, 20, 1021–1036. [Google Scholar] [CrossRef]
Figure 1. Five regions of interest considered. Left panel: VIR (in green), θ < 0.1 ° (r ≲ 15 pc); Ridge (in gray), | b | < 0.3 ° (43 pc) and | l | < 1.0 ° (145 pc), with some masks applied; Diffuse Region (blue), 0.15 ° < θ < 0.45 ° (22 pc ≲ r ≲ 65 pc); Halo (red), 0.3 ° < θ < 1.0 ° (43 pc ≲ r ≲ 145 pc), excluding the latitudes | b | < 0.3 ° (the Galactic plane). Right panel: IGS (orange), 0.5 ° < θ < 3.0 ° (72 pc ≲ r ≲ 434 pc), excluding the Galactic plane and several sources (light grey).
Astronomy 03 00008 g001
Figure 2. Comparison of the J-factor J Δ Ω between the different DM models (first row for generalized NFW, second for adiabatic spike, and star spike in the third one). The fit values and upper limits come from the gamma-ray spectra observed by H.E.S.S. in the regions defined in Figure 1, assuming the thermal relic cross-section σ v 2.2 × 10 26 cm 3 s 1 . We show in grey the uncertainties of the fit values (1 σ and 2 σ for VIR and Ridge, 2 σ for Diffuse, and 2 σ upper limits for Halo). See the text for more details.
Astronomy 03 00008 g002aAstronomy 03 00008 g002b
Table 1. Parameters of the different DM density profiles considered in this work, defined in Equation (4). We base our models on simulations and dynamical observations of the Milky Way. As for the simulations, we consider DM-only and hydrodynamical simulations (GARR, GARR-I, GARR-I300, GARR-II300, ERIS, MOLL, and EAGLE) (see [26] and the references within). For the phenomenological models, we follow McMillan17 [24] and Benito20 [2]. Also, the local DM density ρ of each simulation is shown, evaluated at R = 8.277 kpc [27].
Profile γ α β ρ s M kpc 3 r s kpc ρ ( GeV cm 3 )
DM-only113 5.38 × 10 6 21.5 0.28
GARR-I 0.59 1 2.70 4.97 × 10 8 2.3 0.35
GARR-I300 1.05 1 2.79 1.01 × 10 8 4.6 0.35
GARR-II300 0.02 0.42 3.39 2.40 × 10 10 2.5 0.35
ERIS113 2.25 × 10 7 10.9 0.36
MOLL 8 × 10 9 2.89 2.54 4.57 × 10 7 4.4 0.31
EAGLE 1.38 13 2.18 × 10 6 31.2 0.35
McMillan170– 1.5 13 1.2 × 10 8 5.3 × 10 5 6.8 59.9 0.33 0.43
Benito20 0.1 1.3 13 1.8 × 10 8 2.5 × 10 6 7.0 40.0 0.41 0.71
Table 2. Fit values of the gamma-ray flux analysis for the 5 regions of interest. Note that the DM mass value m DM has been left fixed with the fit value obtained in the VIR, 36 10 + 7 TeV. For the case of the Halo and IGS, we present the 2 σ UL. As for the rest of the regions, the fit values and 2 σ errors are presented. See the text for more details.
ParametersVIRRidgeDiffuseHaloIGS
B 2 9.2 0.9 + 0.8 0.3 0.1 + 0.2 0.8 0.6 + 0.2 0.13 0.02
J Δ Ω ( GeV 2 cm 5 ) 2.7 0.9 + 1.0 × 10 28 2.5 0.9 1.0 × 10 27 1.1 1.1 + 3.4 × 10 27 2.5 × 10 26 1.7 × 10 25
Disclaimer/Publisher’s Note: The statements, opinions and data contained in all publications are solely those of the individual author(s) and contributor(s) and not of MDPI and/or the editor(s). MDPI and/or the editor(s) disclaim responsibility for any injury to people or property resulting from any ideas, methods, instructions or products referred to in the content.

