Article

On Efficient Powder Manufacturing Using Process Control Methods and Cybernetics: A Background, Results and Policy Case Study

Nsugbe Research Labs, Swindon SN1 3LG, UK
Powders 2022, 1(4), 273-301; https://doi.org/10.3390/powders1040019
Submission received: 23 September 2022 / Revised: 19 November 2022 / Accepted: 2 December 2022 / Published: 16 December 2022
(This article belongs to the Special Issue Feature Papers in Powders)

Abstract

:
Powder manufacturing processes involve a systematic processing of particulate material towards forming a final product which needs to meet specific quality standards. A means towards ensuring that standards are met in a manufacturing plant is to apply self-regulating intelligent machinery that can take mitigatory actions in the presence of a process deviation or unsatisfactory process behavior. Given a case study of an open-loop batch powder agglomeration process, this work synthesizes the process of how a feedback element can be applied towards the powder manufacturing plant in order to allow for self-regulation and process optimization which, in turn, would increase process efficiency, minimize waste and ensure that the overall product quality meets production targets. Focusing on a proposed cybernetic loop with a feedback element, a vital component is the ability to measure key quality attributes of the powder mixture, which is crucial towards ensuring the control algorithm is able to implement the most reflective and appropriate control strategy on the powder process; thus, this work discusses heavily the sensing and associated signal processing component of the cybernetic loop. The results from the reviewed signal processing scenarios which comprised the in-process material spanned estimation accuracies of 3–10%, depending on the scenario that was considered. This paper also addresses the feared dystopian view of mass redundancy and job losses in the age of the introduction of enhanced automation technology within a manufacturing process, where it is distilled what kinds of knock-on effects can be expected as a result of the technology, in addition to means by which policy makers can contribute towards ensuring that the adaptation and transition process is as smooth as possible.

1. Introduction

Manufacturing tends to refer to a controlled process where certain goods and products are created with the aim of some form of sale and commercialization as the end goal, and as a result have defined limits which operating parameters need to perform within in order to achieve the desired end product [1,2]. Industrialization has grown steadily over the years through automation, and manufacturing processes have seamlessly adopted and introduced these technologies into their production lines in order to reach greater heights of efficiency, product quality evolution, leaner manufacturing and a more sustainable development with the overall process waste minimized [3,4,5,6,7,8,9].
A key component of this is the adoption of self-regulating algorithms as part of the process control measures that can seamlessly automate the production of goods within a manufacturing process with minimal supervision, while closely abiding and adhering to defined algorithmic setpoints which ensure that the product is manufactured within the defined constraints [5,10]. This art of an automated steering of the state of the system towards a designed endpoint belongs to the area of cybernetics which, at its technical base, involves the use of principles on control theory towards the implementation of a system that is capable of self-regulating while adopting the principles of feedback per control theory [11,12,13,14,15,16,17].
The implementation of a control system in a manufacturing plant as part of a process control strategy is a non-trivial problem due to the sub-components which must be designed and interface together in order to emanate a fully functioning control loop [18,19,20,21,22]. A canonical configuration for a process control loop typically includes a sensing platform that records and interprets sensed information as a function of states of the process and subsequently feeds this information into the controller, which is the core of the system and which pulls the necessary levers in the form of control variables towards the control of the process in order to keep it as near as possible to a desired and optimal process [23].
In manufacturing processes involving powder batch mixing, the implementation of process control strategies has been seen to be somewhat challenging due to the nature of the process itself, as powder-mixing processes have been typically viewed as stochastic, non-linear and highly variable. This has made the real-time measurements of the physical state of the mixing process—typically the particle size distribution (PSD) which has been said to influence the bulk and flow properties of the powders—rather challenging due to a combination of the sizes of the particles (i.e., micron scale) and the stochasticity of mixing processes [24,25,26,27]. Thus, it can be said that a stride towards effective process control for powder mixing processes involves the solving of the estimation problem related to the mixing process.
Prior work on particle sizing has been investigated by the author in regards specifically to a heterogenous-batch-powder-mixing process with a broad particle size range of 53–1500 microns, where given the nature of the process alongside the stakeholder requirements, a down-selection of the sensing instrumentation options was considered, and the problem of PSD estimation was investigated as part of a series of benchtop experiments involving both homogenous and heterogenous powder mixtures in a broad range of sizes [27,28,29]. Despite the results obtained from those series of experimental case studies and experiments, the string of related research can be said to have capably investigated the particle sizing problem without further notes and interfacing of the design PSD estimation approach on the wider system at large, i.e., control strategy and system implementation. Thus, using the related heterogenous-powder-mixing process as the process control case study of interest, this paper investigates the consideration of a self-regulating cybernetic system for control of a powder-mixing process with emphasis on the sensing and signal processing as it relates to PSD estimation, as well as avenues for dealing with estimation uncertainties due to the stochastic and non-linear behavior of the particles, associated control strategy and an overview of the benefits and implications of the framework on the sample process plants and beyond. The practical significance of the study is a roadmap that will allow for the required knowledge and tools towards the application of a self-optimizing system, which is also capable of inferring the quality of the in-process material that produces a highly stochastic signal.
Specifically speaking, the contributions of this paper are as follows:
  • An analysis of the candidate process and a dissemination of the choice of instrumentations and periphery architectures used as part of the proposed process control system, alongside an analysis and synthesis of benchtop case studies carried out independently to support the proposed control configuration;
  • The application of hierarchical cybernetics of technical and philosophical dissemination towards the proposed system framework alongside implications of the potentially enhanced self-regulating machinery processes on workers within the manufacturing process;
  • Insights and review on the designed signal processing approach for particle size differentiation and its extensions towards powder mixture size estimation;
  • A dissemination on the potential effects of the implementation of automation on society and how this can be managed, as well as the role of policy makers within this setting.
From this, it is hypothesized that a more efficient and sustainable means towards operating the candidate process would be conceived and made feasible using the technical principles of cybernetic feedback, while also fleshing out the societal implications of this form of advanced mechanization, and how the sociological policy makers can ensure mass worker lay-offs do not result from this.

2. Methods

The notion of a particle size is a dimension used to characterize the scale of particles and applies to both manufacturing-based particles/granules and particles found environmentally in nature; it typically ranges from the nanometer to millimeters scale [27,30,31]. In practical settings, where a multitude of particles exist, it is rare to have just a single particle size; instead, a polydispersity exists and therein requires the characterization of the PSD of the group [29,32,33].
In powder mixing processes, the physical checks of product quality are highly reliant on an efficient PSD measure from which secondary bulk process variables can be inferred, such as the mass flow rate and bulk density, to name a few [34,35]. Furthermore, this information serves as a key input which can subsequently be used to inform process control and optimization steps and as a result has understandably led to strong research and innovation around PSD estimation methods, sometimes referred to as Process Analytical Technology [31,36,37,38,39]. A select shortlist of some of the frequently used methods for measuring PSD includes the classical sieving and weighing, where particles are sorted into various size bins based on the aperture size and a mechanical impulse force which causes the sieve to shake and cue in the particle sorting; in the case of layer sieves, a series of apertures with varied sizes are stacked and used as part of the sorting process from which a PSD estimate is formed [40]. In terms of mechanical-based sensing, electrostatic, acoustic emissions and vibration sensing exist, where the electrostatic sensors measure the resulting electrostatic forces between particles as they interact with each other within a mixture, while acoustic emissions and vibrations involve the acquisition of mechanical displacements produced from the mixture process in a range of frequencies [41,42,43]. Imaging and optical methods for measuring particle sizes (and therein PSD) include near-infrared, focused-beam-reflectance measurements and standard imaging monitors with a closed-circuit camera [44,45,46].
A summary of the various types of mentioned PSD monitoring sensors alongside their ranges, as informed by the related literature, can be seen in Table 1, as adopted from Nsugbe et al. [27].
It can be noted that real-time instrumentation for measuring the chemical properties of powder processes also exists but is out of the scope of what is being proposed and discussed in this manuscript. Interested readers are advised to consult the work done by Soori et al. [53], around real-time chemical analysis of powder mixtures using computer vision and multispectral imaging in particular.

3. Cybernetic Analysis

As mentioned, the concept of cybernetics involves the ability to methodically steer the states of a system towards a desired end-point, primarily with the use of the principles of feedback. The utilization of hierarchical cybernetics (mostly the first and second order) allows for levels and perspectives for the synthesis of a candidate cybernetic framework, where the first order primarily focuses on the technical aspects of the framework and its components, as well as elements of the system which facilitate self-regulation and control [53,54,55,56]. The second order is based around the philosophical dissemination of the performance of the cybernetic system under the influence of feedback, including factors such as the end-to-end operation, newly acquired strengths of the system and wider influence of the concept of self-regulation on the wider process. Note that due to the lens of the second order cybernetic framework, it is often referred to as the “Cybernetics of Cybernetics”[56,57].

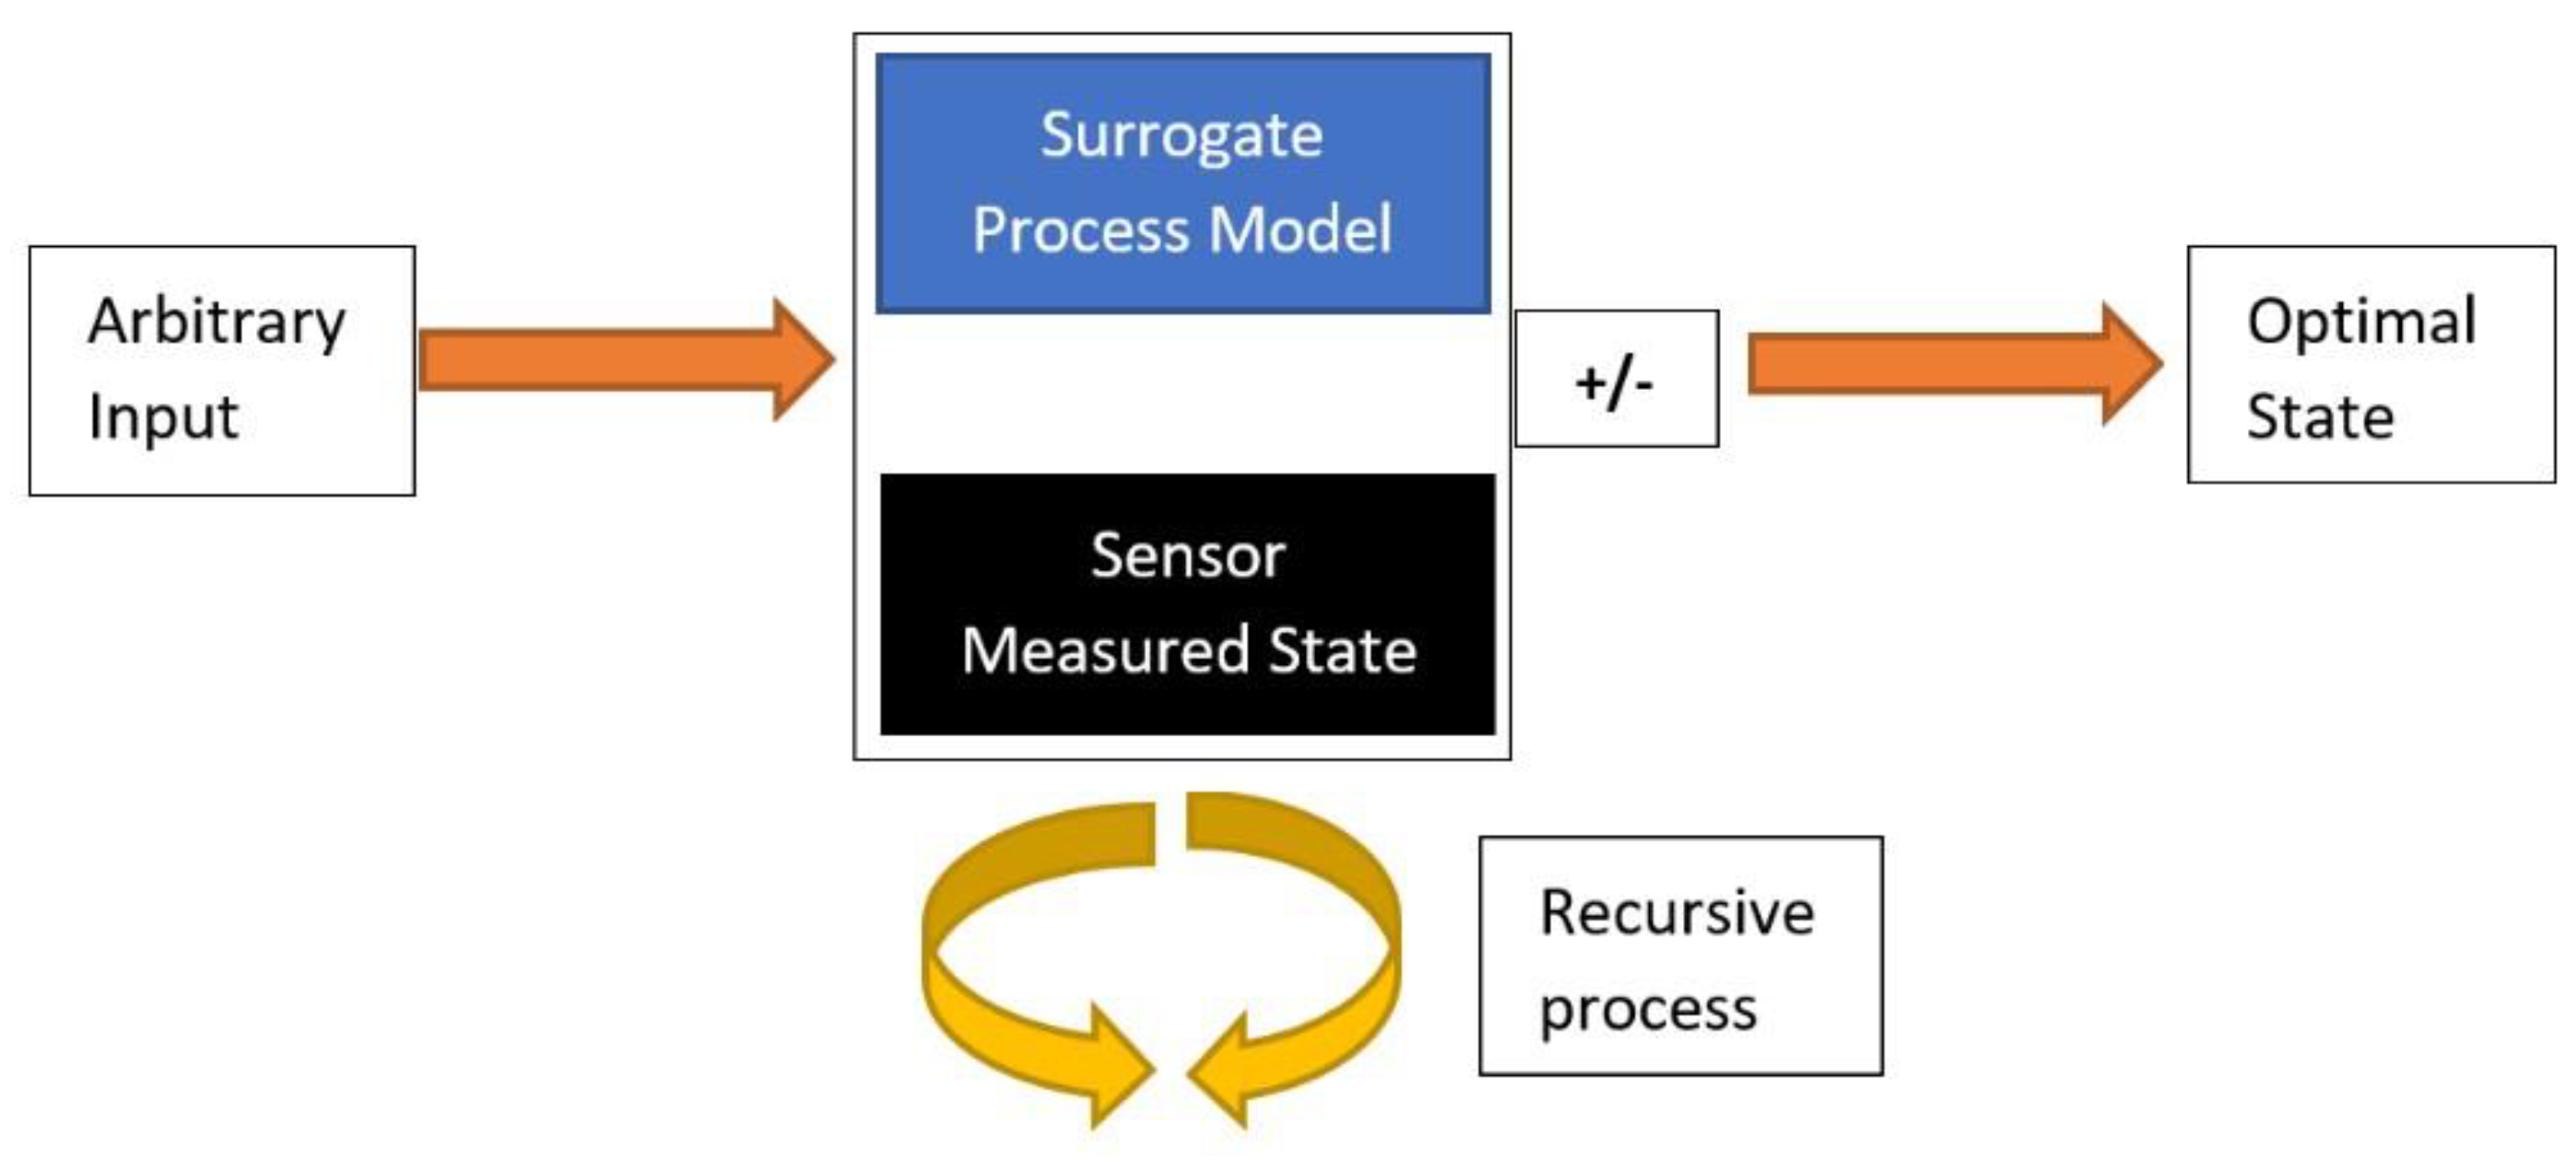
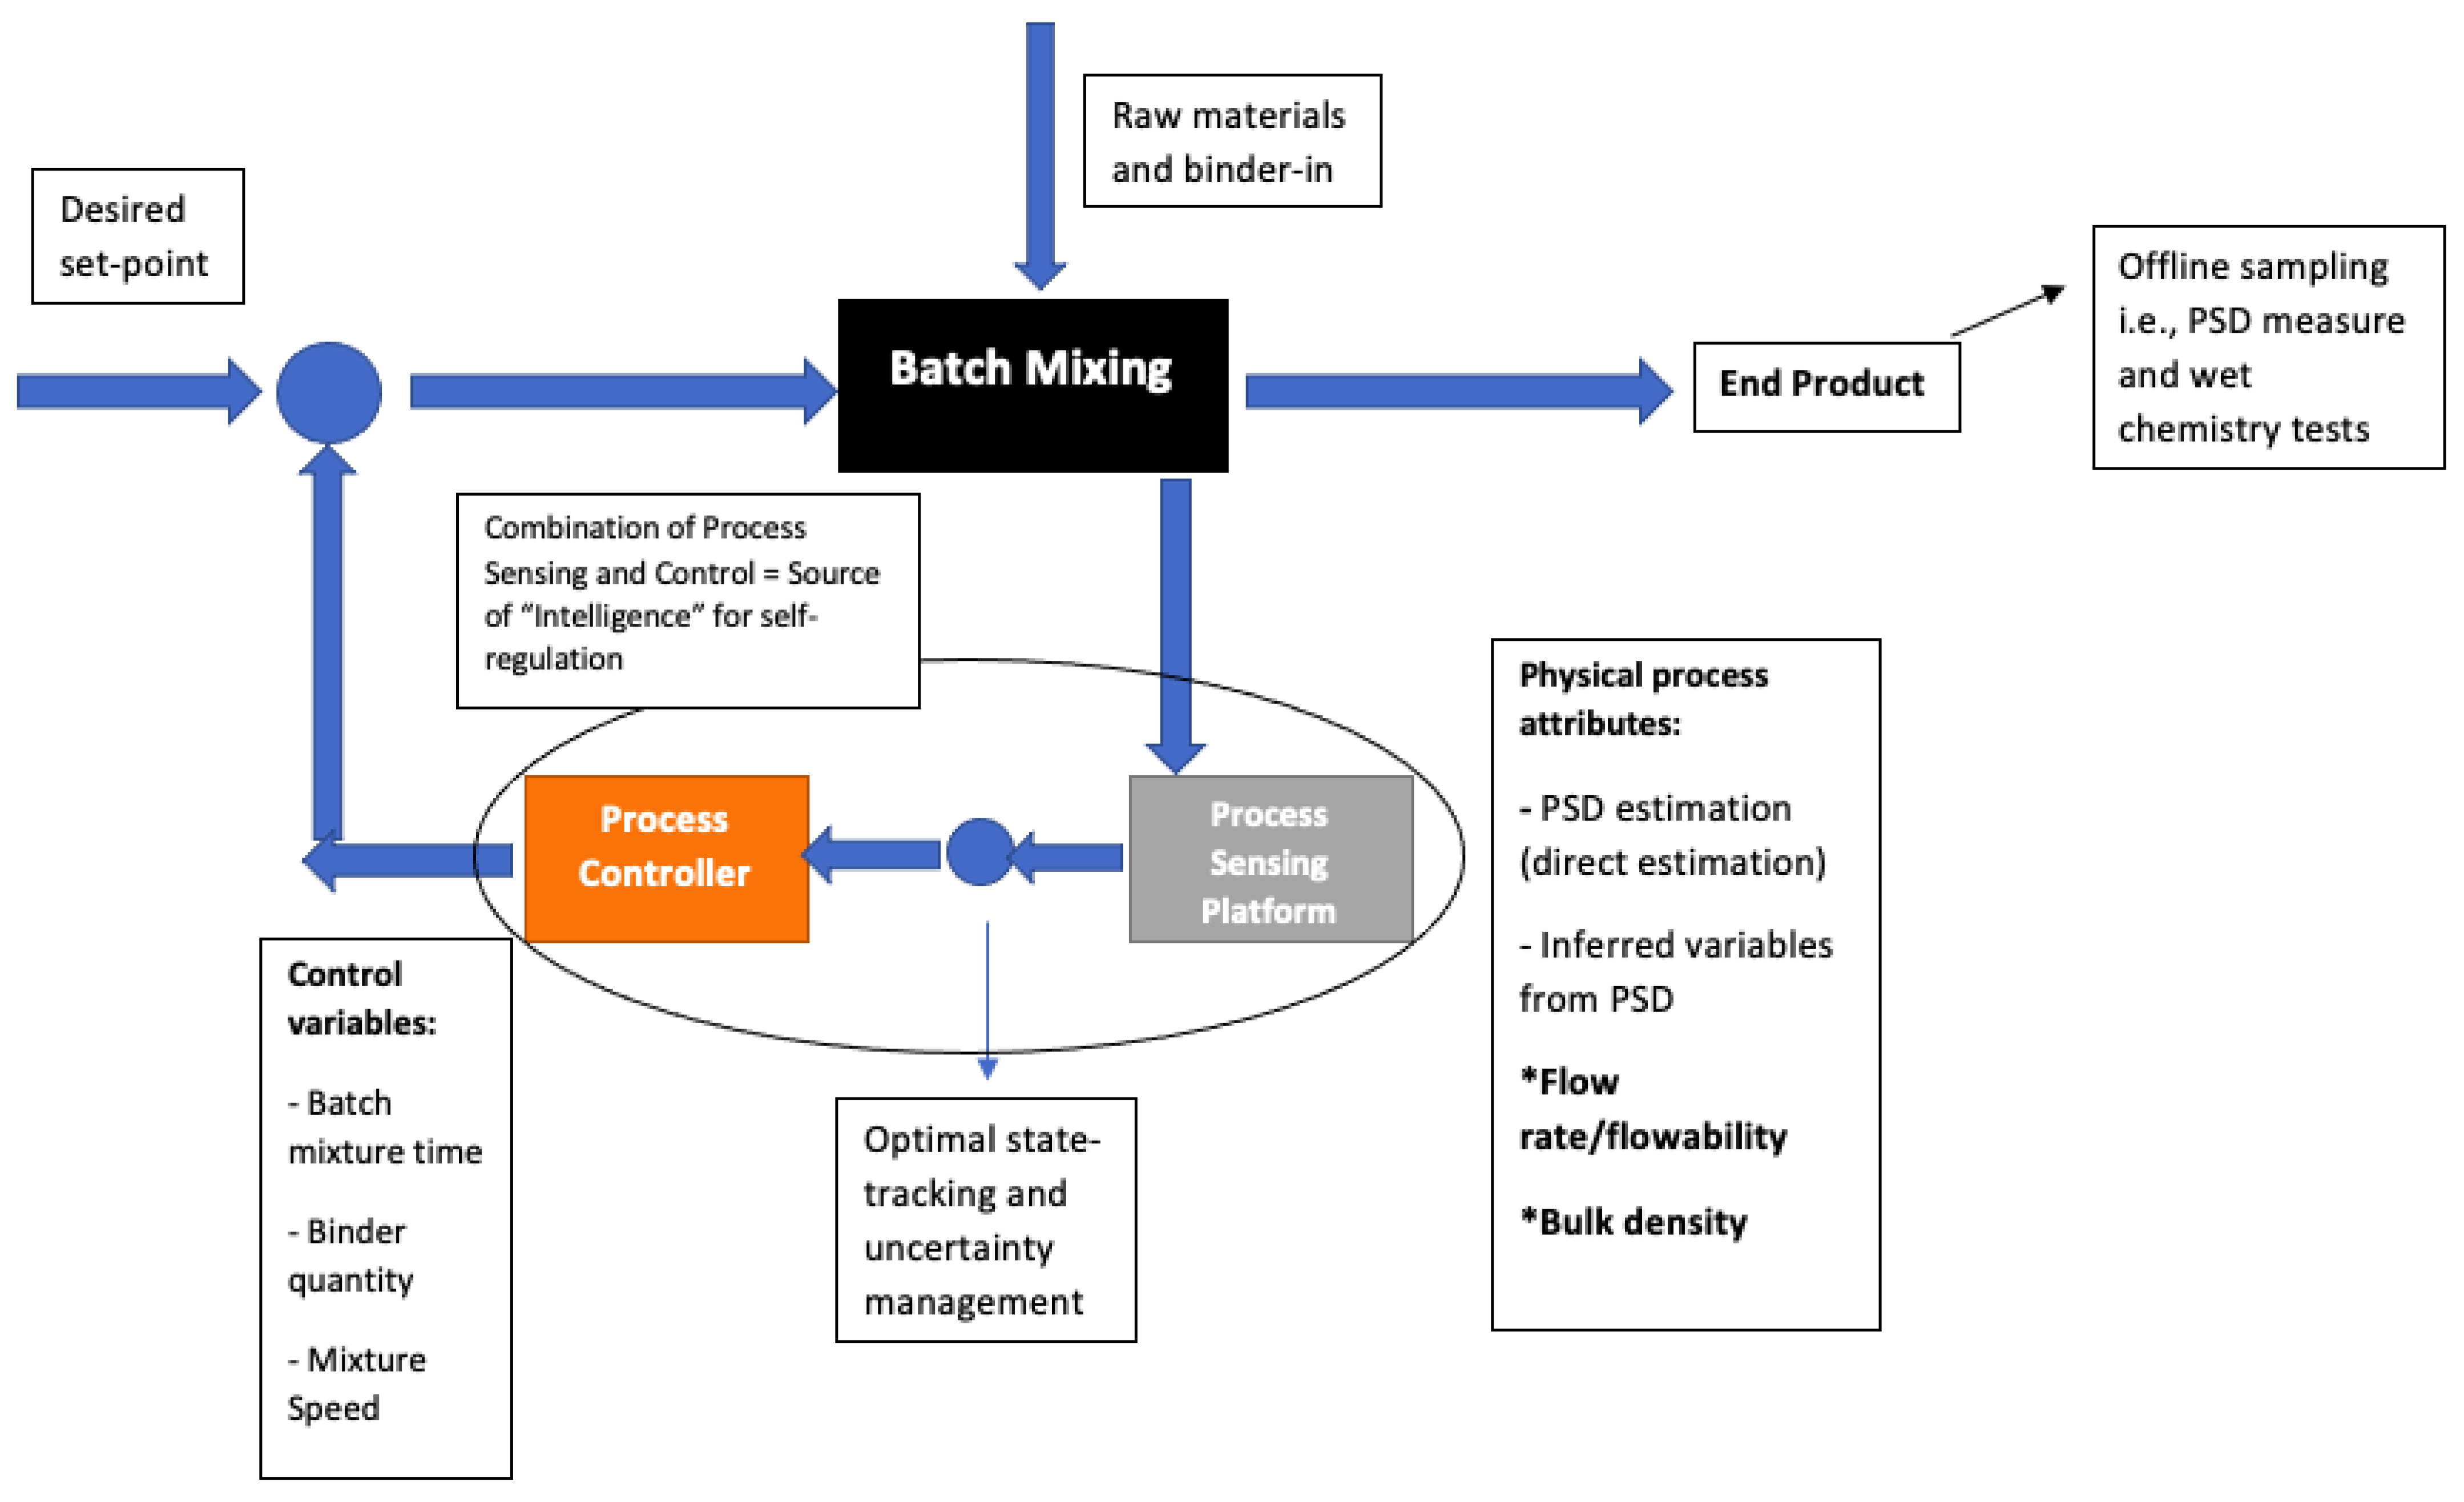
3.1. First Order Cybernetics

3.1.1. Batch Mixing

The candidate process of interest is a soap powder mixing process, where pre-processed raw materials are mixed and agglomerated together for a fixed resident time shortly before packaging commences [27]. The powder mixture is of a highly heterogenous nature and comprises of builders, fillers, bleaches, surfactants and perfumes, to name a few of the ingredients, in which the range of particle sizes is thought to span 63–1500 microns. During the mixing process, the bulk products are initially dispensed to the drum mixer where an initial mixing takes place for the first 10 min, and then it is subsequently followed by the dispensation of a non-aqueous binder and perfume, which is then followed by a more intense mixing at a higher amplitude shortly before packaging commences [27]. The window during the final mixing after the binder has been added to the mixture to serve as a form of an agglomerative binder serves as a constrained span for further process optimization towards enhancing the product quality prior to packaging, thus stressing the need for computationally efficient process-control algorithms due to the fixed window offered by the batch-process manufacturing scheme.

3.1.2. Process Sensing Platform

The platform involves the sensor-based observation, detection and inference of identified process quality factors which drive the overall product quality [58]. As mentioned, in this circumstance, there exists the physical and chemical features which drive product quality and require real-time monitoring; thus this platform could potentially be anticipated to include sensing for both the physical and chemical properties of the powder mixture, although the chemical side of things can be deemed out of scope for this paper. The physical attributes for the process sensing platform are expected to include the PSD (estimated variable), flow rate (inferred variable) and bulk density. It is also worth noting that in the area of chemical engineering processes, the concept of automated process measurement falls under the area of process analytical technology (PAT).

3.1.3. Optimal State Tracker

As electronic sensor instrumentation is intended for use for the process sensing, it can be said that the estimates are prone to uncertainties and measurement errors which could not only lead to false estimates but also to an inefficient control action due to misinformed state estimates [59]. Thus, estimation filters and optimal state trackers are useful in this case in order to minimize estimation uncertainties [60].
The Kalman filter (KF) is a commonly used optimal-state-tracking algorithm incepted by Rudolph Kalman and comprises of different formats depending on the nature of the problem [60]. In this scenario, the preference would be the adoption of the linear Kalman filter due to the constraint on computational time as described above [60,61,62]. The KF chiefly involves two steps where the first step can involve the model-based estimation for the state of the system at that point in time; typically for a mechanical system, a mathematical representation is used to form the model-based replica of the system in question, and model-based estimates are subsequently obtained from this. Due to the complexity of the mixing process in question, alongside the bespoke nature of the process, there is an absence of comprehensive mathematical models for this; thus a data-driven database would need to serve as a surrogate in this case, from which states can be inferred at various points of the mixing process. The design and assembly of this surrogate database would involve a considerable amount of input due to the chaotic nature of the in-process materials, as not only would a broad range of samples need to be acquired spanning batch variations, but also seasonal variations would need to be incorporated and considered due to the powders themselves being hydroscopic. This would be required at the very minimum to form a robust database that can serve as a reliable surrogate model for the state prediction aspect of the KF.
The second step in the KF model involves the information from sensor data, which is expected to have been processed by a signal-processing model (discussed subsequently) as part of the process-sensing platform as part of a “measured state”, which is expected to contain uncertainties, as mentioned. As the KF configuration requires variance measures in order to form a sense of the uncertainties within a measured state, a measured state would need to be sampled for n-different iterations to produce a form of epoch which would allow for the computation of the variance of the measured state and subsequent KF smoothening. A visual illustration of the KF model given an input x can be seen in Figure 1.

3.1.4. Process Controller

The job of the controller in this case is to apply the relevant control input to the process to cue an optimization action given an input of an estimate of the state of the process [63]. This controller would be responsible for setting in an action motion of the control variables of the process, as shown in Figure 2. Due to the varying nature of the process, fixed gain controllers such as the proportional-integral-derivative (PID) controller and the optimal control scheme would be unsatisfactory in this case [64,65]. Viable alternative control schemes include the esteemed model predictive control (MPC), robust control (RC) and adaptive control scheme (ACS) [66,67,68]. The MPC is a control scheme that has steadily grown in the manufacturing and process environment over the years in tandem with the rise of automation and self-regulating machinery. Its architecture forecasts likely deviations from the desired reference trajectory and applies a mitigatory control action based on the projected error in the process, and it is deemed a proactive control approach [69].
The proactive control architecture of the MPC implies that there are multiple aspects and sub-dependencies that need to be computed as part of its control scheme, and thus it carries a high computational cost and hardware demand, which makes it largely infeasible for this case study. The RC scheme works nicely for processes where a high degree of uncertainties is anticipated and allows the definition of tolerance bounds as part of the control scheme, which may be infeasible to accurately define for this process given the stochastic and chaotic nature of the behavior of the in-process material. In addition to this, there already exists an uncertainty management scheme as part of the process loop as detailed with the KF [67]. The ACS is one which allows for the modification of the control law with varying process dynamics and as a result does not operate with a fixed-gain scheme. The standard ACS architecture has a control portion used for the control law side of things and a System Identification portion which is tasked with the learning and identification of the dynamics of a sample varying process [70]. As the System Identification aspect, with respect to the ACS, has already been catered to in the form of the process sensing platform, this by default deals with a portion of the ACS architecture and lends itself well to the problem at hand. The presence of the process-sensing platform allows for an estimation of the process behavior in real-time and is subject to optimal state tracking, thereby rendering its estimations to be more reflective than a theoretical model of the process. Thus, the indirect model reference adaptive control (iMRAC) would be the preferred ACS version for use in this case study with constraints due to the nature of the process, where the control law of the adaptive process can be expressed as follows [71]:
Powders 01 00019 i001
For this control structure, the error term is computed as the difference between the desired and estimated states, which are also used for the real-time tuning and gain adaptation of K x and K r .

3.2. Second Order Cybernetics

Under the influence of feedback, it can be hypothesized that the production loop has gained a greater degree of autonomy and therein efficiency. The feedback element in the loop involves a process sensing platform with an optimal state tracker alongside a candidate control strategy, whose input actions are expected to cue in an optimization action of the process in real-time and therein idealistically null out the need for subsequent manual offline product quality analysis. The self-regulating capabilities of the process subsequently allow for enhanced product quality with more products fulfilling the criteria for acceptability and sale, therein maximizing the revenue from the production process itself. The optimization of the production process in real-time implies that product quality is expected to improve by some capacity, thus paving way for a leaner manufacturing process with less waste and by-products, which sits well with the United Nations’ developmental goals for a greener environment and a more sustainable manufacturing capability [72].
In the presence of self-regulation, this opens avenues for the process plant to be evolved from a batch scale towards a more continuous line of production, which would lead to a greater amount of throughput and would undoubtedly scale up the revenue and income from the products. However, it needs to be noted that modifications and upgrades would need to be carried out on the feedback element of the process loop prior to the production format being changed [73].

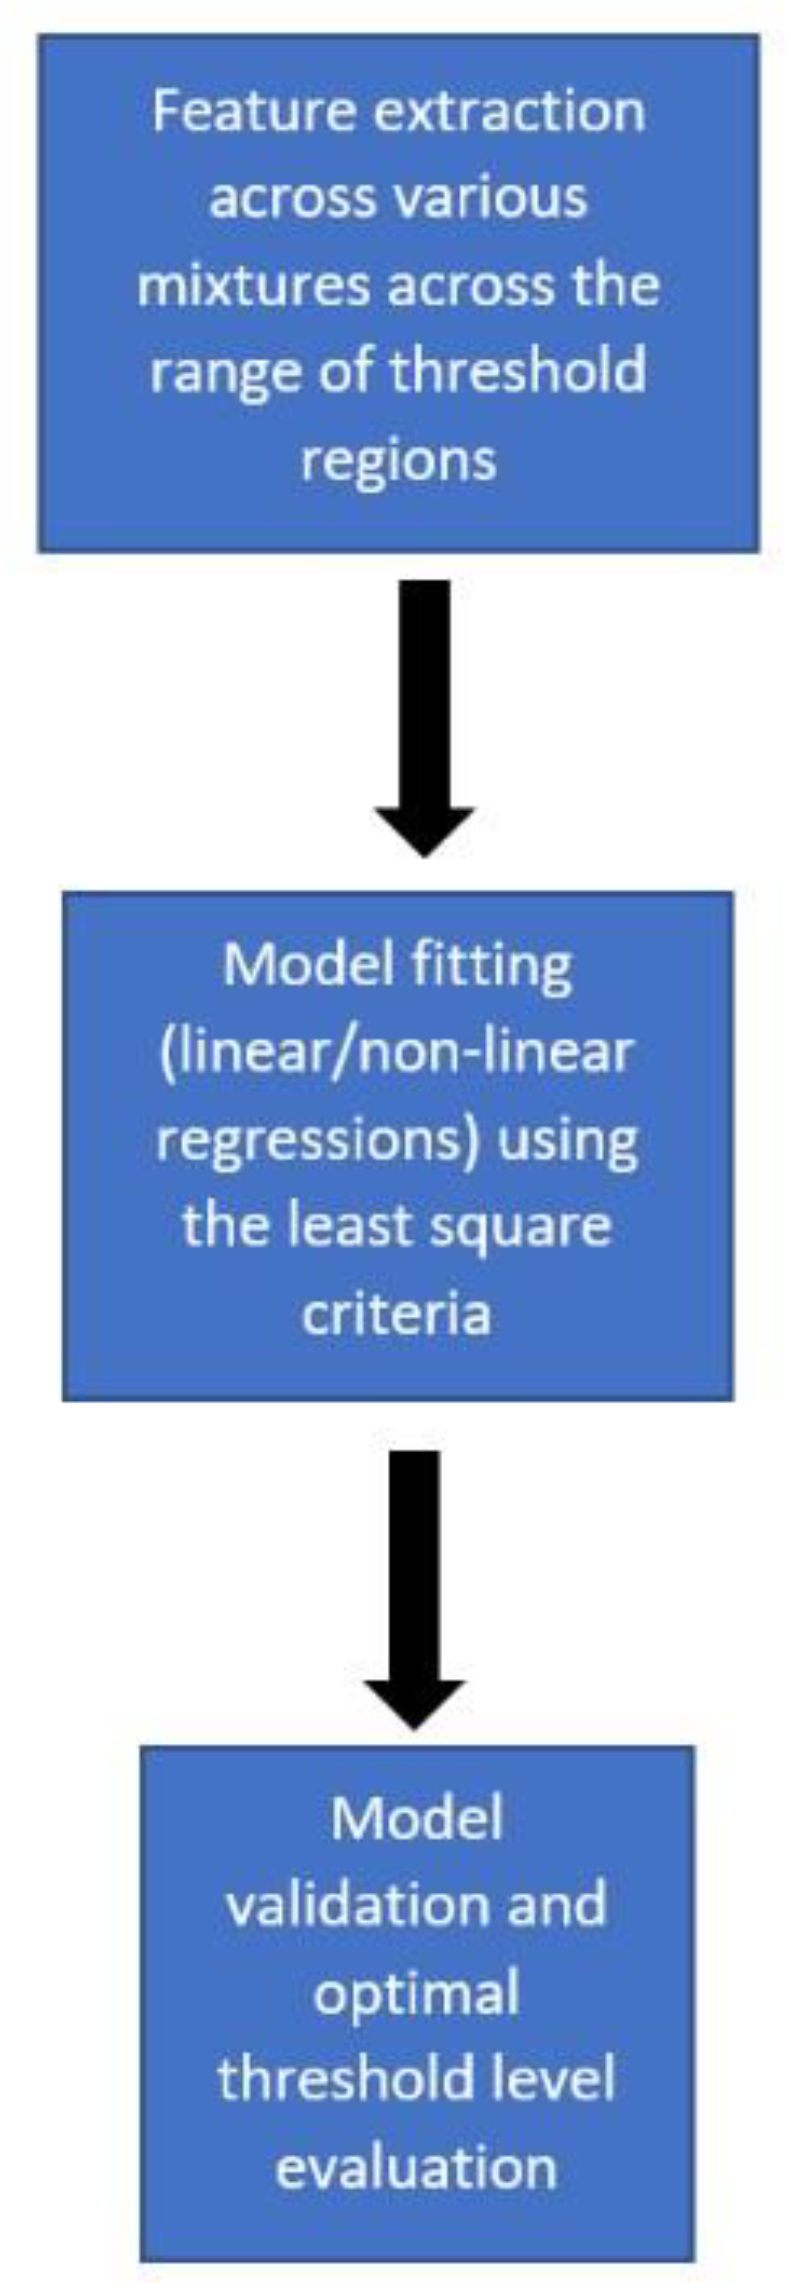
3.3. Chosen PSD Sensing, Signal Processing Model and Benchtop Results
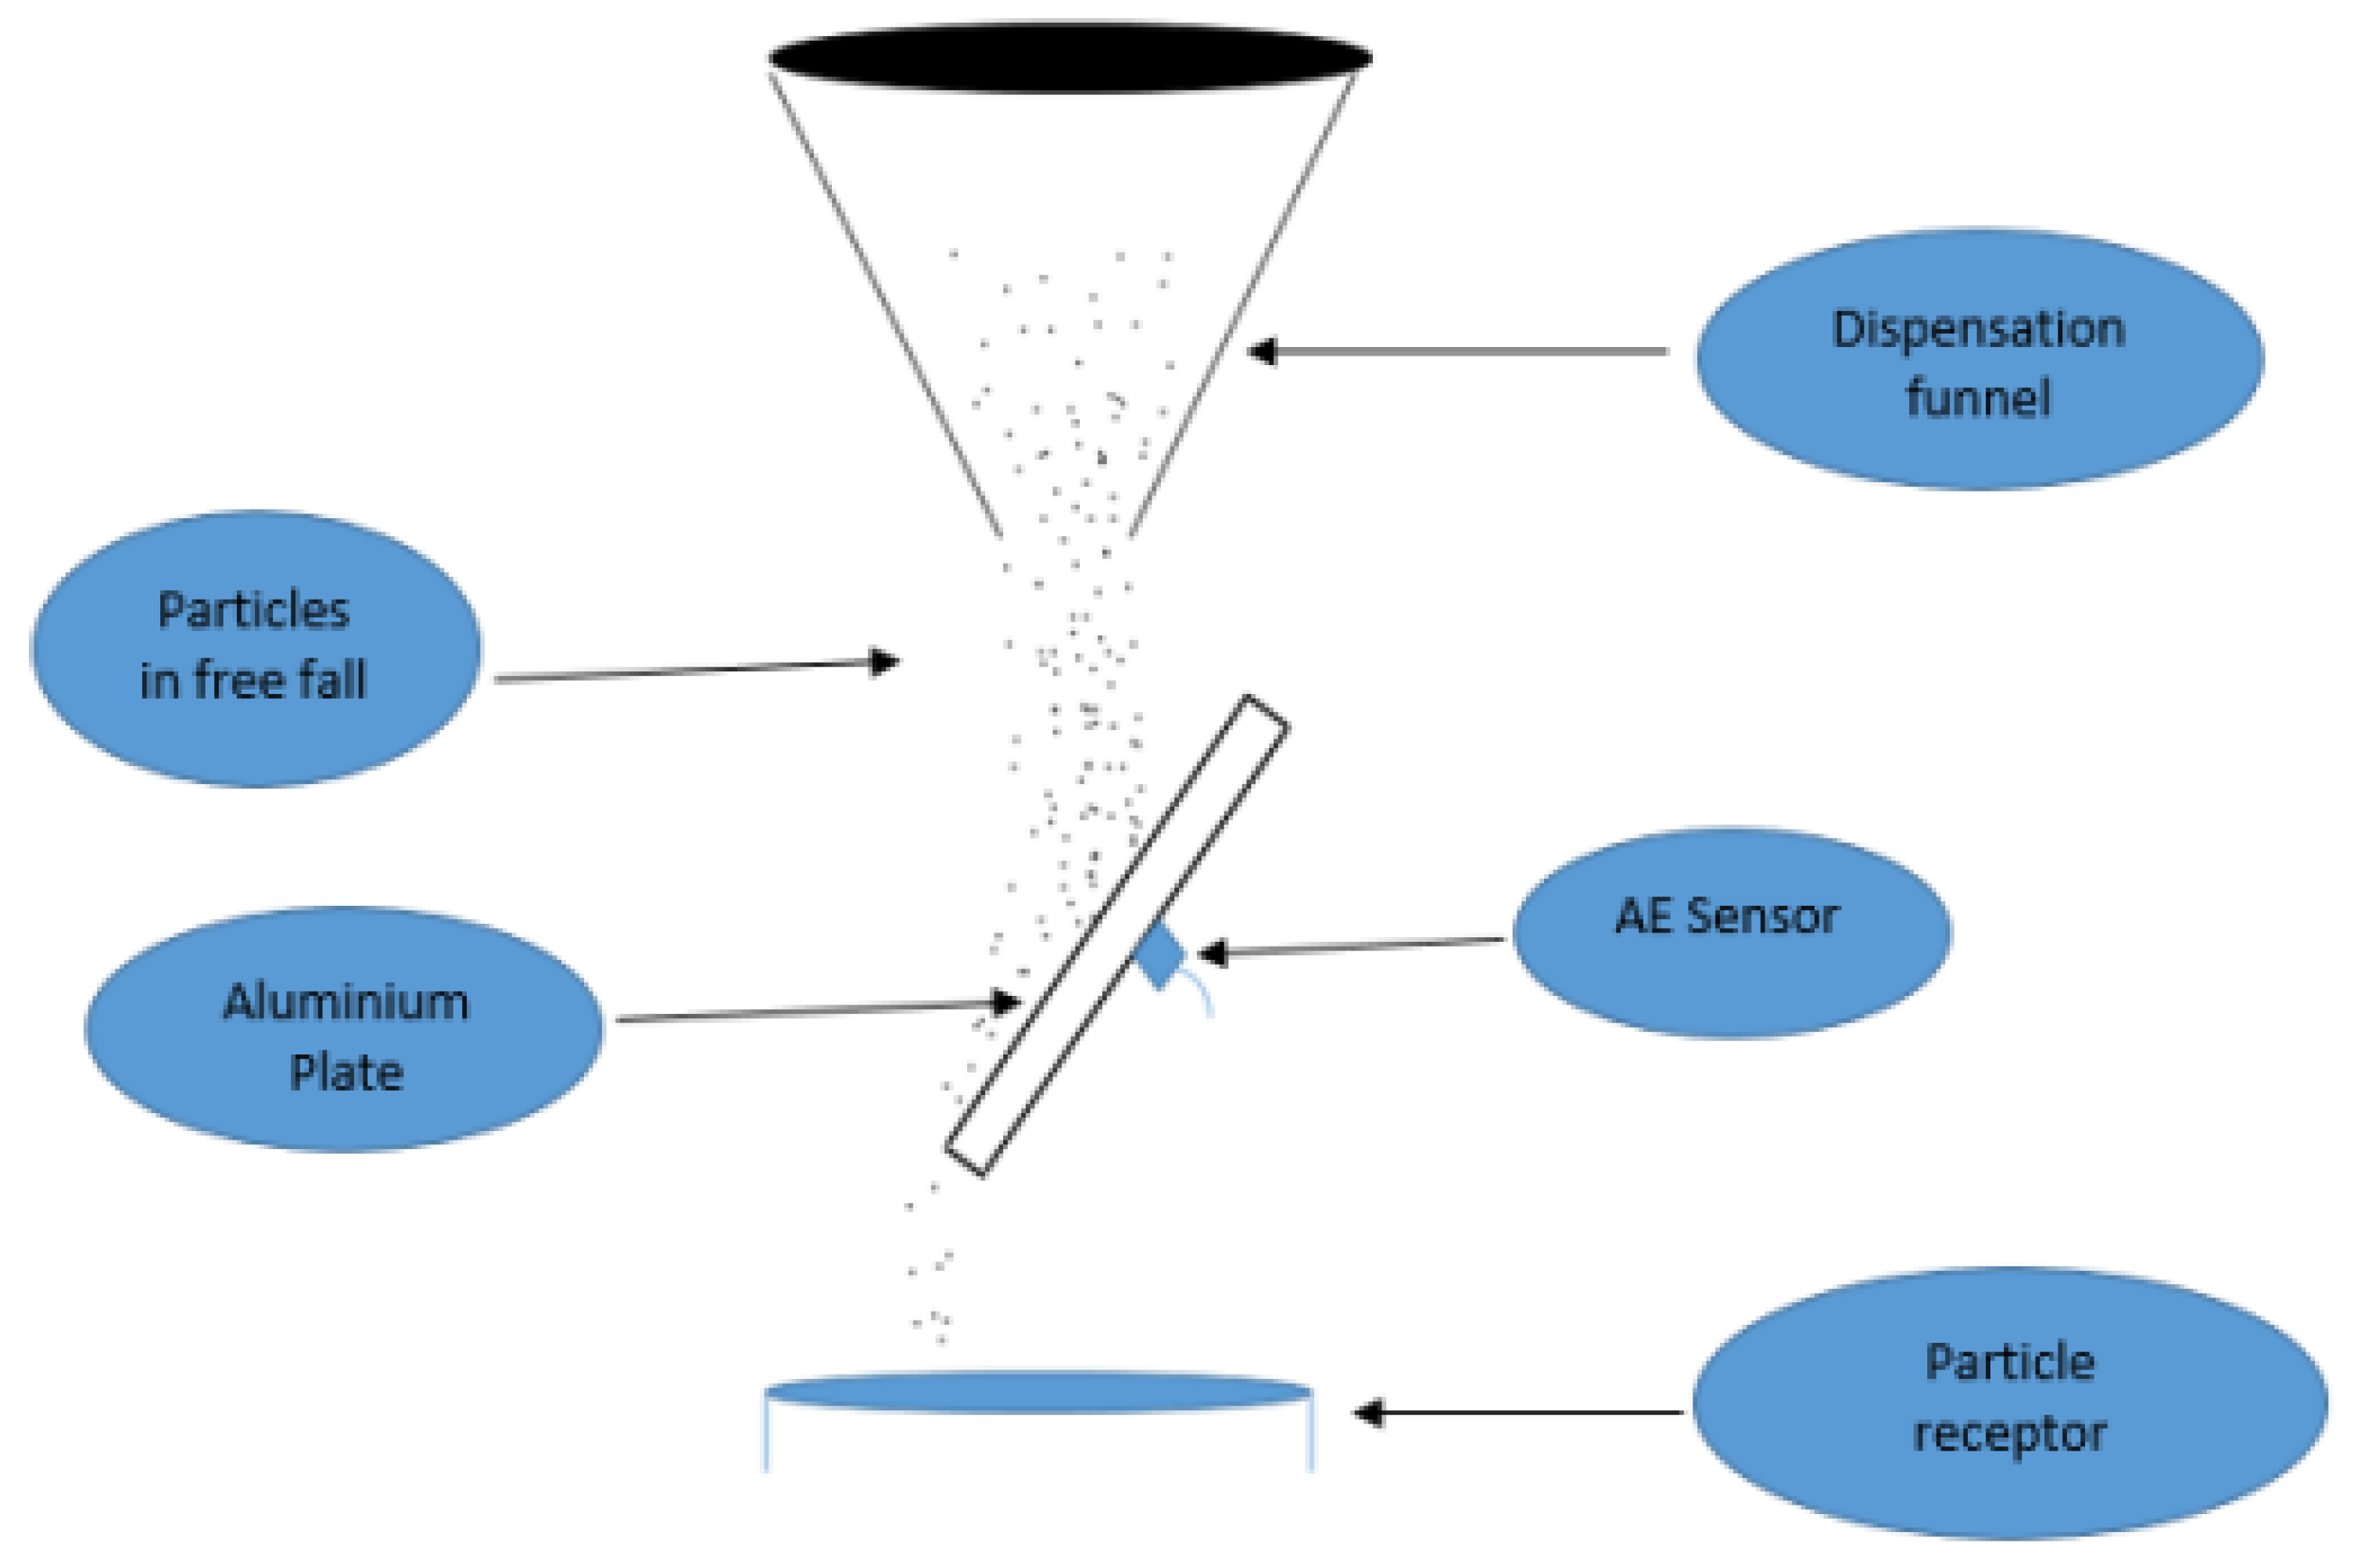
For the process in question, there was a requirement by the project partners to ensure that the chosen instrumentation was of a non-invasive nature and passive, in the sense that no further process modification would be required in order to host the chosen instrumentation due to the cost of a potential process modification for all the mixers that the project partners own. Moreover, passive measurements ensure that there would not be any form of modifications to the cycle of production due to the presence of process instrumentation of any sort, which avoids the need to expend resources in the re-design of the mixing production strategy while offering the capability to work in real-time in order to facilitate process control [27]. These requirements led to a down-selection process of the instrumentation listed in Table 1, where the imaging and laser-based technologies were eliminated due to their invasive properties and their requirement for a clear line of sight to the process, thus requiring process modifications. Hence, a choice remained between acoustic emissions (AE) and vibrations. Vibrations are best suited to damage detections and low-frequency-event manifestations, whereas structural borne AE are known for being optimal for the monitoring of events in the high frequency and sonic regions. The high frequencies are best suited for this application due to the nature of the in-process material, which are micro particulates colliding with the surface of a mix drum in a noisy production area contaminated by low frequency background noise [27]. Thus, the selection of high frequency structural borne acoustic emissions serves as a filtering mechanism by default and is honed into the frequencies where there lies rich in-process information [74,75].

3.3.1. AE

AE refers to mechanical displacement waves which mostly travel in a parallel or perpendicular direction. For the process being considered in this case study, sources of AE events are expected to emanate from the powders striking the walls of the mix drum during mixing and therein particle-structure contact, where the internal structure of the mix drum serves as a form of waveguide [28,76,77]. As part of impact generation for structural borne AEs, elastic waves are generated which travel in a mixture of directions [27]. For infinite media such as waveguides made from aluminum, a unique and additional wave exists, which is referred to as Lamb waves, where the magnitude of the AE events produced from events from these media depend upon the modes of the waveguide themselves [77,78]. From Figure 3, it can be seen that there are bands within the AE spectrum where audible sound tends to be between 20 Hz–20 KHz, and the ultrasound region spans everything thereafter [79]. The ultrasound region would be the region of use and emphasis for the proposed cybernetic system due to its being in the frequency region from which particle events are thought to emanate from.

3.3.2. Signal Processing Model

AE events are measured using electronic instrumentations, where the amplitude of an AE event is firstly represented as a voltage of a defined magnitude. It is commonly stated that this output voltage signal is a function of a convolution process with a number of sub-dependent blocks which are convolved together to yield an output, as expressed as follows [51,80]:
V t = S t G t R t
where S t is the source function relating to the entity being measured, G t is the wave propagation function relating to the properties of the waveguide used as part of the process and R t corresponds to the instrument response function of the recording instrumentation.

3.3.3. Source Function S t

The Hertzian theory of impact accounts for and governs the dynamics of solid body contact mechanics under a given set of assumptions and helps to account numerically for a source force hitting a target medium, as formulated by Hunter et al. using the “half-sine” wave pulse projection. It is mathematically expressed as [81,82,83,84,85]:
f t = f m a x   sin 3 2 π t t c ,   0 t t c
f t = 0   o t h e r w i s e
where t c is the contact time and can be mathematically expressed as
t c = 4.53 4 ρ π δ 1 + δ 2 3 2 5 R 1 v 0 1 5
where δ i = 1 v i 2 π E i , E and v represent the Young’s modulus and Poisson’s ratio, respectively, subscript 1 refers to the source particle, while subscript 2 is indicative of the presence of the target plate. f m a x , which is dependent on the radius of the particle and the approach velocity, is mathematically expressed as f m a x   = 1.917 ρ 1 3 5 δ 1 + δ 2 2 5 R 1 2 v 0 6 5 , where R is the radius of the particle and v is the approach velocity of the particle. These equations have been used for theoretical estimates of a resulting energy contained in a dissipated stress wave from a particle impact.

3.3.4. Wave Propagation G t

The wave propagation function accounts for the dynamics of the spread of the impact waves upon impingement by a solid body particle, where waves resulting from particle impact can be said to be elastic and can be modelled using the elastodynamic equations of motion, the solutions to which can be obtained by solving the Green’s function [85,86,87]. Here, the Green’s function is an important theorem used to account for the resulting force or charge dissipation as a result of a source activity and is a useful tool to compute and analyze wave dissipation in a medium due to an external event [88]. A key property of Green’s function and its theorem is its ability to lend itself to the description of a solution of differential equations in the presence of boundary conditions [88].
In the context of a target plate and wave propagation medium, the solution to Green’s function would need to be computed whilst taking into account the following sub-dependencies as part of its function G x , t ;   ζ 0 ,   τ , which is subject to a displacement at a point x for time t as a result of an impulsive force at location ζ 0 in a given direction at time τ , where potential means towards solving this Green’s function equation involves the use of the Taylor series expansion while taking the fixed point to be the point where the impulsive force acts [88].

3.3.5. Instrument Response Function R t

This function accounts for the nature of the recording instrumentation used, which typically tend to be transducers that can be expected to have a flat response between two distinct frequencies. In the case of transducers which record structural borne displacements, the response is a function of the impedance matching (subject to a coupling) between the transducer itself and the wave propagation medium [27,89]. Mathematically, the instrument response function is a convolution between the surface displacement (u(t)) and the transfer function of the transducer’s natural response (i(t)), expressed as u t i t , where the transfer function of the transducer can be obtained via the inversion of the Fourier transform approach [89].
If a theoretical approach is to be taken towards quantitative particle sizing in the absence of signal processing electronics, with knowledge of the Green’s function of the wave propagation medium and instrument response function, their overall effects can be taken into account and serve to support a de-convolution process used to estimate particle sizes [90,91].
From a signal-processing approach and perspective which lend themselves to a real-time applicability, under the conditions that the wave propagation medium is static and undergoes minimal and negligible degradation over time, the recording instrumentation is calibrated and the electronic circuitry is subjected to minimal drifts over time, then the contributions of G t and R t can be modelled as neglible towards the final magnitude of V t , therein implying a linear relationship between V t and S t , which can be expressed via the trivial relationship as [42,91,92]:
V t   α   S t
Note that this is expected to hold for a set of homogenous particles where, due to this relationship, the value of V t is expected to be bigger for particles of larger sizes.

3.3.6. Particle Sizing of Unmixed Homogenous Powders Signal-Processing Approach

An impulse event in the time domain can often be mathematically described using a unit impulse manifestation which is accompanied by a transient decay, where said impulse can be characterized with a number of characteristics which include the amplitude and decay envelope [93]. For simultaneous events, as often manifested with successive AE burst events, the signal’s impulses are typically seen to overlap each other and also superimpose amongst themselves, which makes it challenging to effectively characterize and model signals of this nature in their apparent form [93].
The means towards dealing with this in the AE signal processing literature has been the use of a tuned amplitude threshold, with the hypothesis that an optimal amplitude threshold region would minimize the degree of uncertainty and would allow for more accurate signal modelling [27,93,94]. This threshold approach was adopted in tandem with a peak detection algorithm to eliminate redundancy from false peaks relating to the transient decay of the AE event, where a signal ‘peak’ is mathematically defined as S n . p e a k s x = x p e a k . n ,     x n x n 1   a n d   x n + 1   0 . Mathematically, the threshold approach on a candidate signal can be formulated as follows:
T H n = γ n | S n . m a x |
where T H n is the value of the signal threshold obtained by scaling the maximum amplitude of a given signal by a designated scaling value. Note that only identified peaks above the defined threshold are considered. γ n denotes a list of scale factors in a user-defined set arbitrarily spanning 0.1 , 0.2 , 0.3 .. n , and S n . m a x is the maximum amplitude of the signal being considered
An optimal threshold selection exercise is subsequently conducted for the selection of the threshold region which maximizes prediction accuracy (see Section 3.3.7. for more details) from the set { T H 1 , T H 2 ,   T H 3   , . T H n } where the threshold parameters from the optimal threshold region are retained and used for any other signal processing exercise from the source.

3.3.7. Particle Sizing of Mixed Powders Signal-Processing Approach

For the scenario where a powder mixture is involved, the mixture is now heterogenous and can be expected to produce a non-linear AE, where AE events from different powders are superimposed intermittently across the whole event itself based on the mix ratio of the powders. The task evolves from the differentiation of particle sizes into what is regarded as a source separation exercise, from which a signal is mixed and requires estimation of the various constituents within the mixture [29].
The signal approach taken towards solving the source separation exercise is the metaheuristics computational method where a set of heuristics is used to form a constrained optimization problem with supporting heuristics. A search and decomposition act is performed on the signal in the presence of a “default threshold” towards the identification of a rich region within the signal which maximizes prediction and estimation prowess and can be used towards monitoring the variation of a constituent mixture [27,29,93].
The list of heuristics utilized for the solving of the mixture source separation problem can be seen in Nsugbe [27] and Nsugbe et al. [29], where the method has, to a degree, been mathematically formalized and is now referred to as the Linear Series Decomposition Learner (LSDL). The LSDL has subsequently seen application and implicit life-saving and care-enhancing uses in various areas of clinical medicine [93,95,96]. The LSDL for the approach towards particle mixture estimation has been formulated using a two-constituent mixture problem (Big and Small), as inspired by Newton’s two-body problem [97].
The implementation of the LSDL follows the methodology formalized as part of Nsugbe et al. [93], but with the following subtleties: the default threshold separating the high and low amplitudes is tuned to be the maximum amplitude of the “Small” powders within the mixture; the threshold scaling and variations were done arbitrarily depending on the case study at hand; the optimal threshold was chosen using the maximum prediction error for the constrained linear/sigmoidal regression fit using the least square sense, denoted as i = 1 n y i y ¯ 2 .
Figure 4 shows a visual illustration of the LSDL method as implemented for mixture estimations for a mixture signal transformed to its absolute form.
Following the tuning of the thresholds, the subsequent steps involved in the selection of the optimal threshold region of the signal include feature extraction of the signal under various mixture ratios, followed by the fitting of regression curves (linear/non-linear) and, finally, model validation using unseen data which is separate from that which was used in the training of the model. A flow diagram of this can be seen in Figure 4.
For powder mixtures with more than two-constituent particles, the designed two-constituent approach is to be applied iteratively in order to estimate the full-size distribution of the powder mixture being considered as can be seen in Nsugbe [98].

3.3.8. Benchtop Experiment on Powder Flow and PSD Estimation

The experimental rig used for the investigation of the estimation performance of the candidate AE sensing, as well as the designed signal processing method, is based on a powder flow rig dispensed from a fixed height on a target medium with a fixed flowrate [27]. The Design of Experiment (DoE) approach [99] was adopted for the identification of the key process parameters and the deduction of a scaled-down equivalent, details of which can be seen in Nsugbe [27]. The key aspect of the original drum mixer that was retained in the benchtop experimental rig was the flow regime, while Figure 5 shows a diagram of the various flow regimes which manifest themselves during the mixing process.
The cataracting flow regime is the chosen regime which was selected to be replicated as part of the benchtop experimental rig as it is the phase where the particles can attain maximum terminal velocity prior to being adhered to the wall of the mixer. During this stage it can be said that the Froude number, which is a ratio of the inertia to gravity force, is less that 1 at this point [101,102,103]. A picture of the benchtop experimental rig can be seen in Figure 6.
As described in Nsugbe [27], the benchtop experimental rig was inspired by related work in the literature where particle sizing has been estimated during some form of powder flow involving the powders striking a target medium from which the AE events are recorded. As seen in Figure 6, the target medium is made of aluminum material which has been seen in the literature to promote the propagation of elastic waves associated with powder impacts, and the medium spans dimensions 11 × 18 cm with a uniform thickness of 0.7 mm, density of 2.7 g/cm3, Poisson’s ratio of 0.35 and Young’s modulus of 69 GPa, where the AE sensor was attached to the back of the plate using beeswax adhesive. A funnel was selected as a means for a repeatable source of powder dispensation which would not provide an external form of interference to the AE signal. As part of the selection process of the final height of the funnel from the target plate, various experiments were carried out before a final height was converged upon of 12 cm, which ensured that the dispensed particles attained terminal velocity prior to impacting the target medium. Note that for all experiments carried out, a fixed mass of powder was dispensed as it was seen that varied quantities of powders influenced the acquired AE signals. The AE sensors used as part of the data collection were the PCI-2 Physical Acoustic sensors by Mistras which have a bandwidth spanned 100 K–1 MHz and a sample rate of 1 MHz [104].

4. Experimental Materials and Pathway

The in-process washing powder material comprises of a heterogenous mixture of powders of size range 63–1500 microns, which is chaotic in nature and produces a highly variable signal, as can be seen in Figure 7, which shows an electron microscope image of the powders themselves, where a range of sizes and geometries can be seen.
Using a DoE approach, surrogate materials were chosen to represent the particles with regular and irregular geometries, glass beads and polyethylene particles, respectively, which were sieved into various sizes to form desired mixtures. Images of the glass beads and polyethylene particles can be seen in Figure 8 and Figure 9.
From Figure 8, it can be seen that the glass beads are of spherical geometry and are crystalline in nature, and they were chosen to serve as a surrogate for the spherical particles within the washing powder mixture. Their resulting AE event produces a time series with a relatively minimal variability. In contrast, the polyethylene particles are of a considerably higher irregularity in terms of geometry, are more brittle and also have cohesive forces which exist between them.
A diagram showing the experimental pathway taken towards the investigation and solving of the heterogenous washing powder problem using the DoE approach, where experiments are of increasing complexities, can be seen in Figure 10.
It is worth mentioning that the proposed signal processing model was used for all experiments as appropriate (i.e., size differentiation or mixture estimation), with the AE amplitude mean of identified peaks within a threshold utilized as the extracted feature. The choice to use a single feature was made due to model parsimony and real-time computational efficiency.

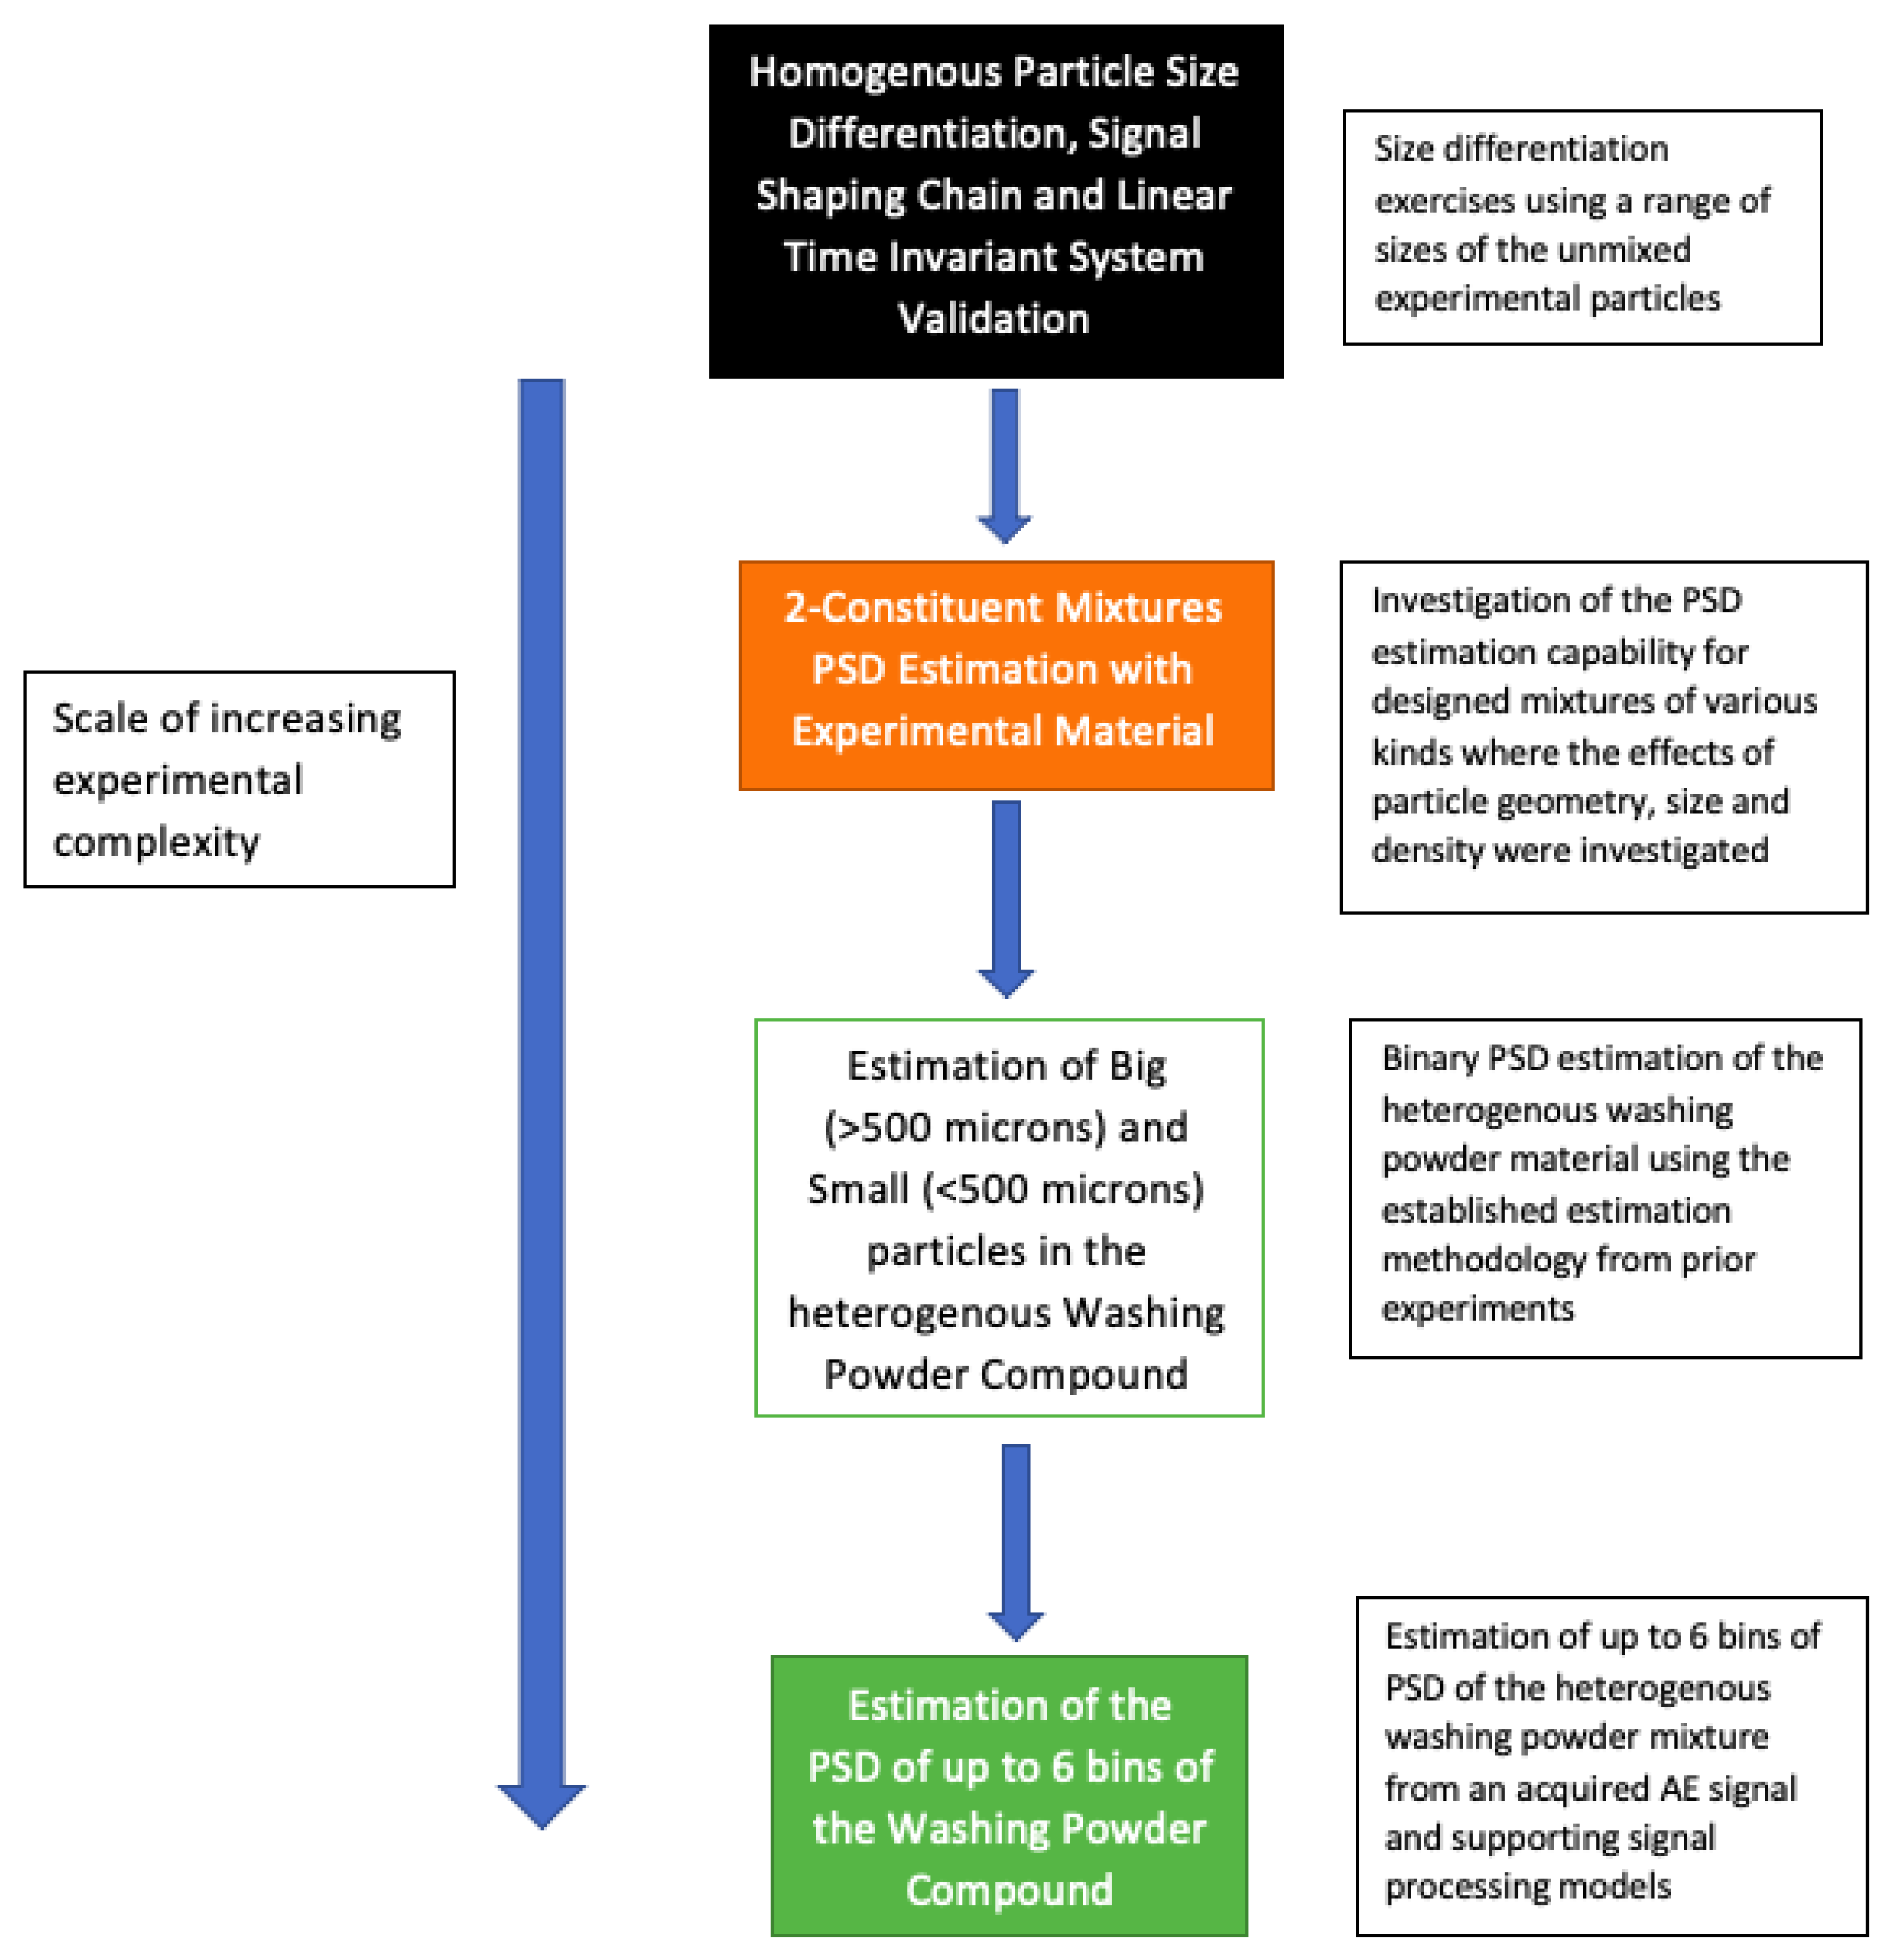
5. Experimental Results

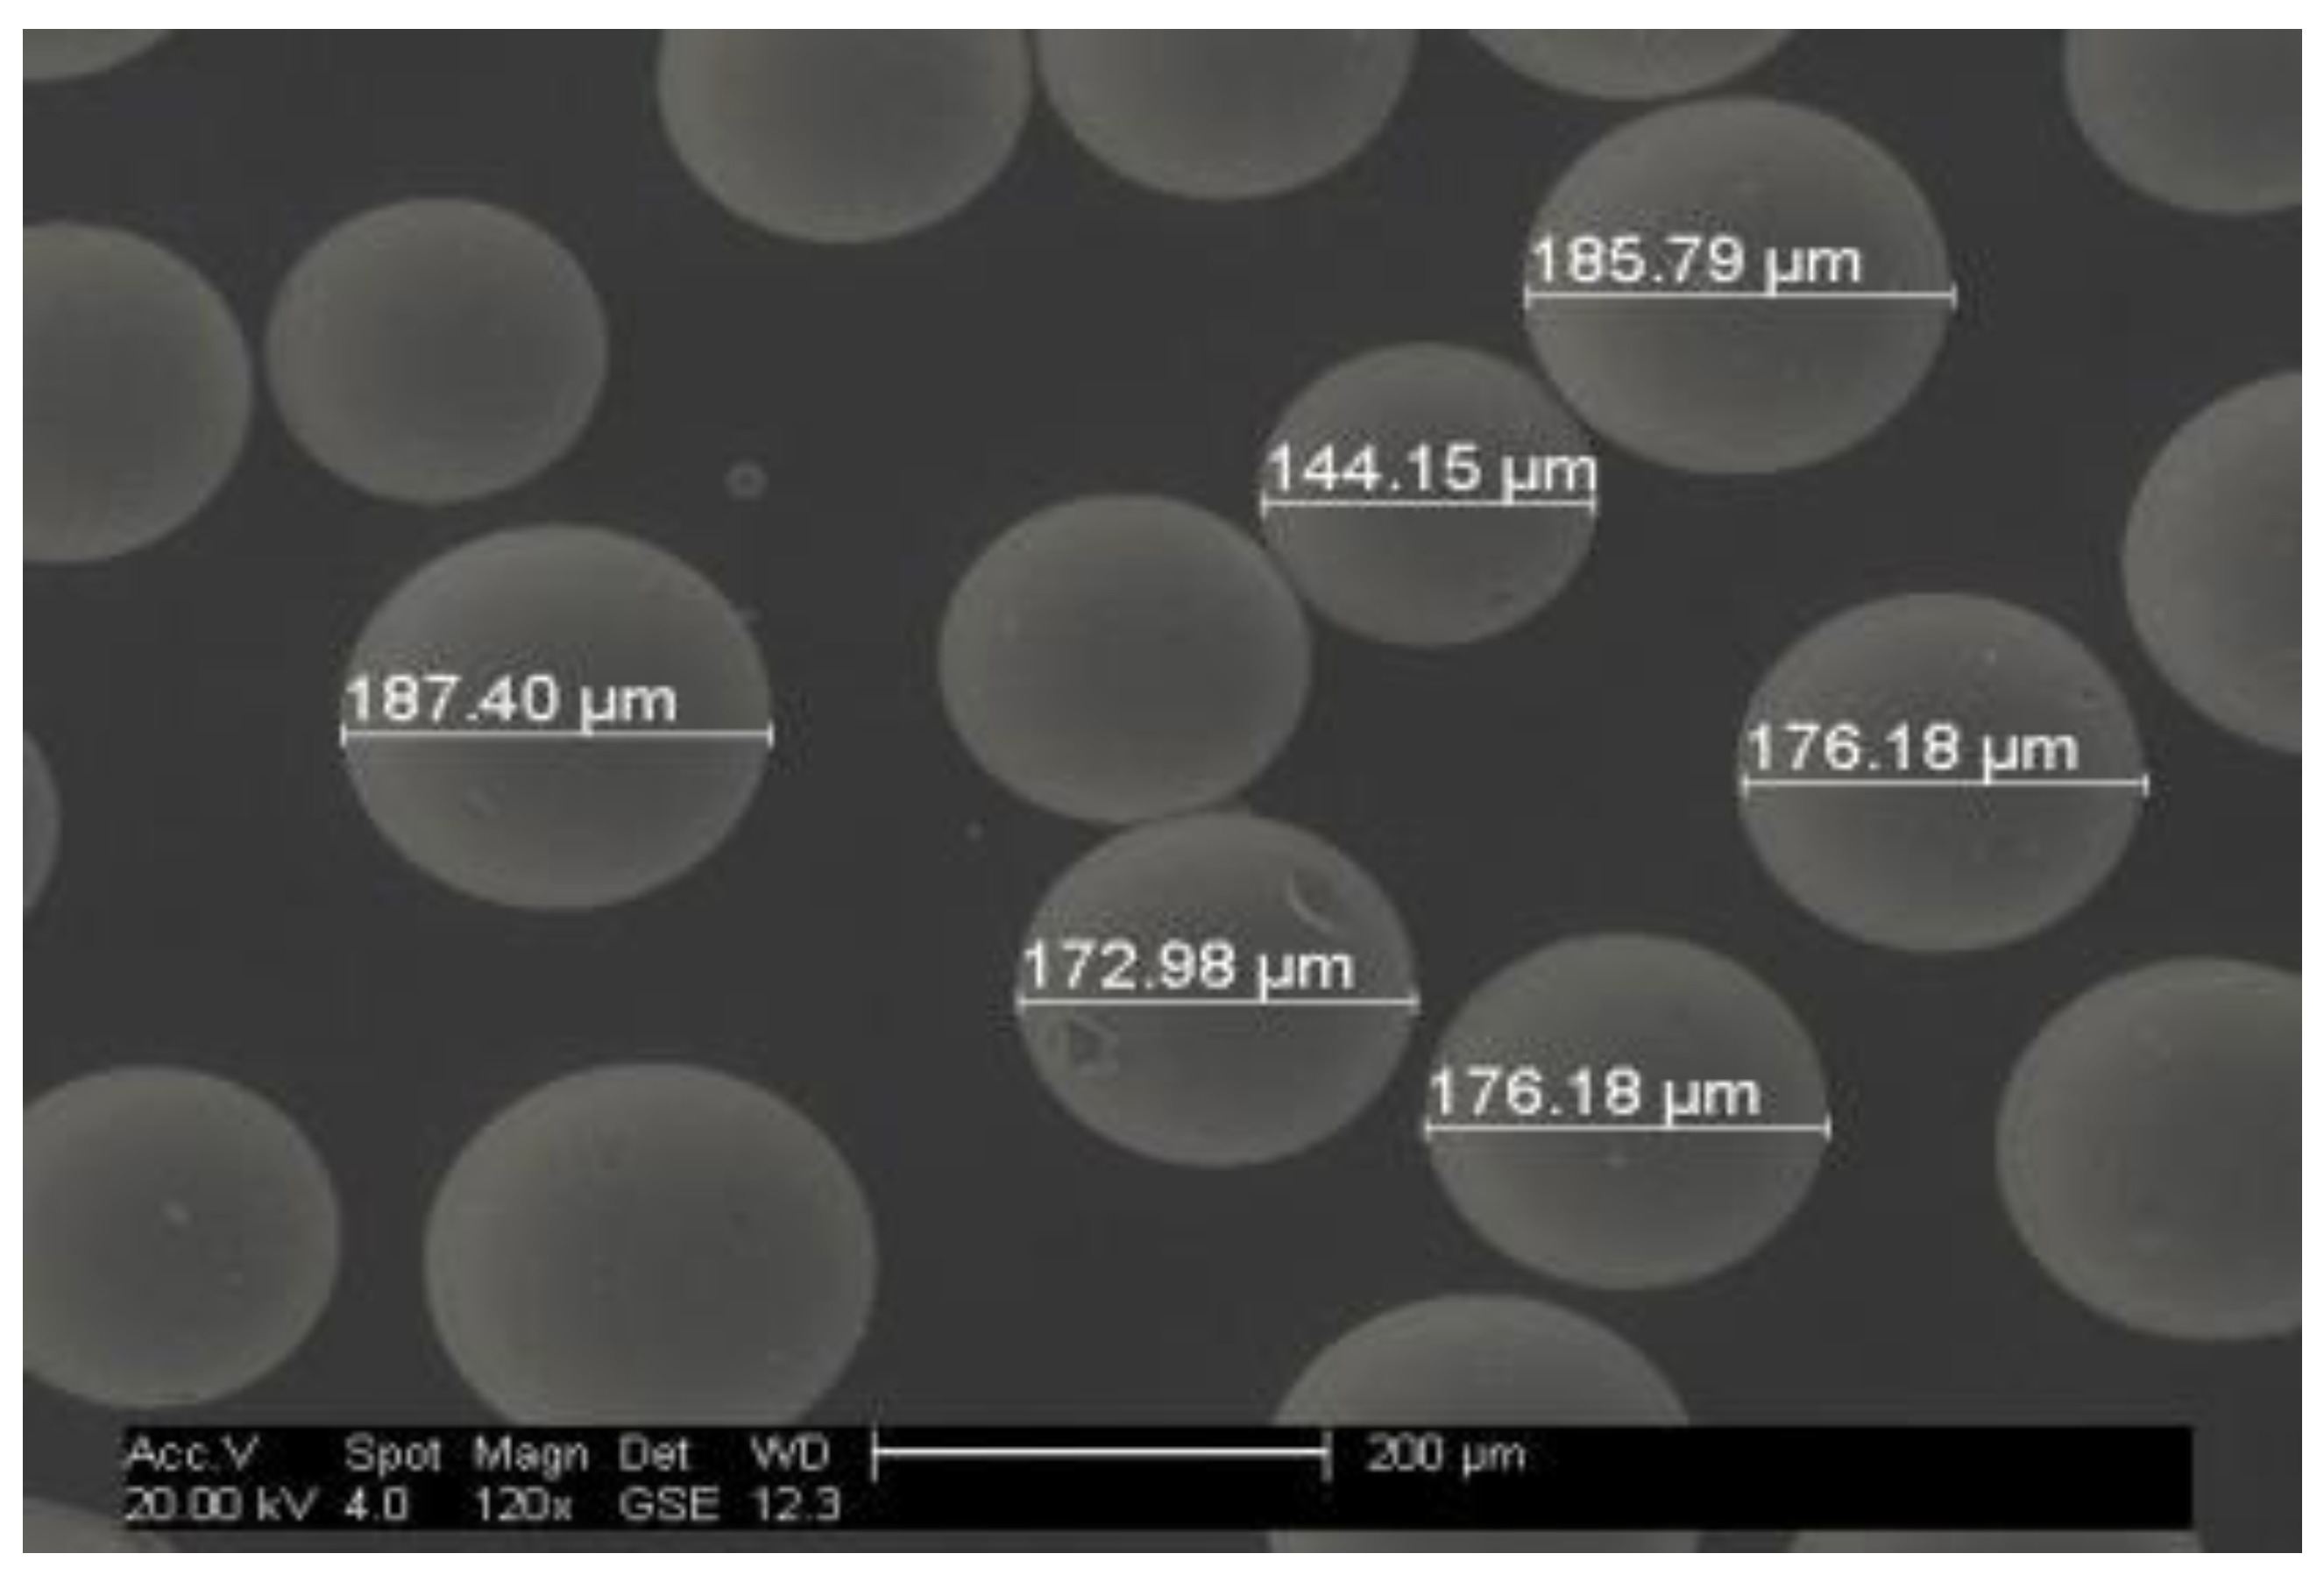
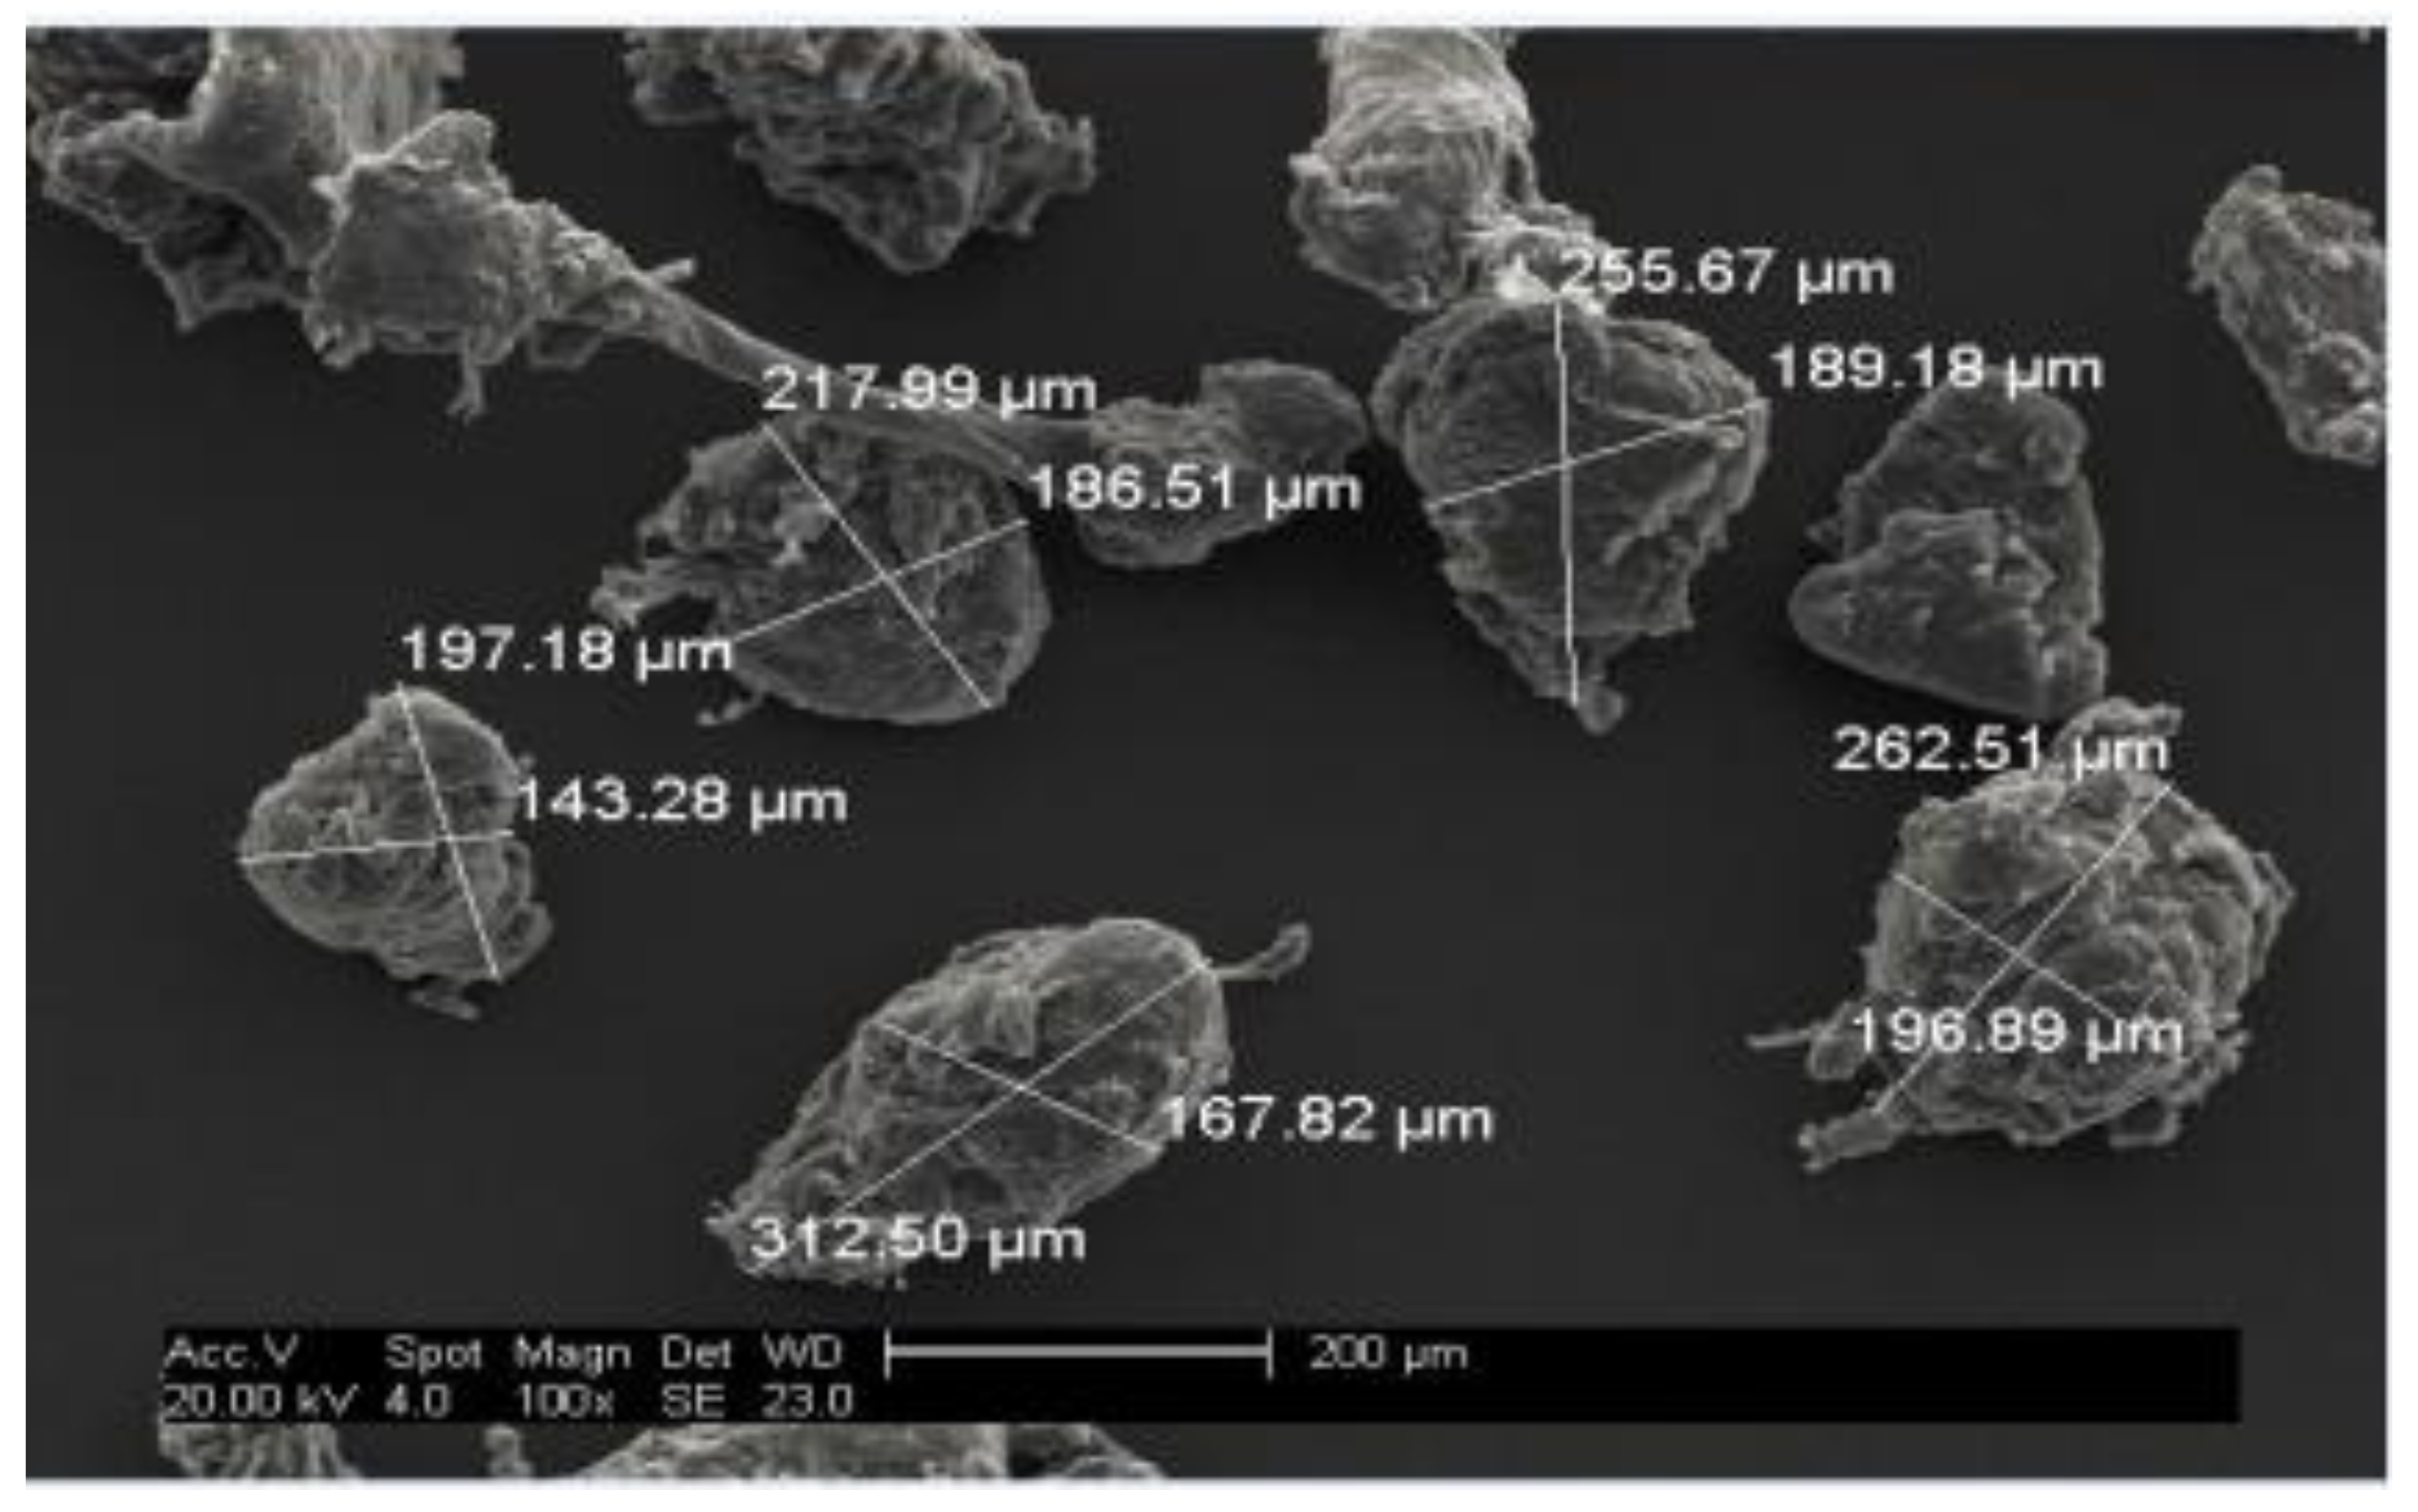
5.1. Homogenous Particle Size Differentiation and Signal-Shaping Chain Validation

Using the proposed signal processing approach for unmixed homogenous particles, a linear relationship was seen to exist for the different sized particles and their accompanying AE signal within their optimal threshold regions for both the polethylene and glass bead particles, where separate differentiation exercises were done [94]. An image of the results for the size differentiation of the polyethylene particles can be seen in Figure 11.
From Figure 11, it can be seen that a linear relationship exists between the various homogenous particle sizes and their accompanying AE signals for the optimal threshold region. From the plot, the level of variability of each size group is reflected in the AE signal where, for the bigger particles, there exists a greater level of variability amongst them, as indicated by the separation between the plotted error bars relative to the smaller sized particles. The results and the existence of the linear relationship for unmixed particles also validates the hypothesized linear relationship proposed as part of Equation (4) for the signal shaping chain [94]. Furthermore, it can be hypothesized from the results that under certain conditions, the assembled experimental setup can be classed as a linear time invariant (LTI) system. It is linear in the sense of the data-driven results obtained, and it is time invariant under the assumptions that the wave propagation medium and instrument response function remain unchanged. Thus, the mathematical property holds that for an input x t and subsequent output y t , the anticipated result for an experiment carried out at a later time T , the input can be represented as x t T for a subsequent output of y t T [105]. Thus, for such a system, it can be described as time invariant due to the output not hinging upon the time frame by which the input is applied.

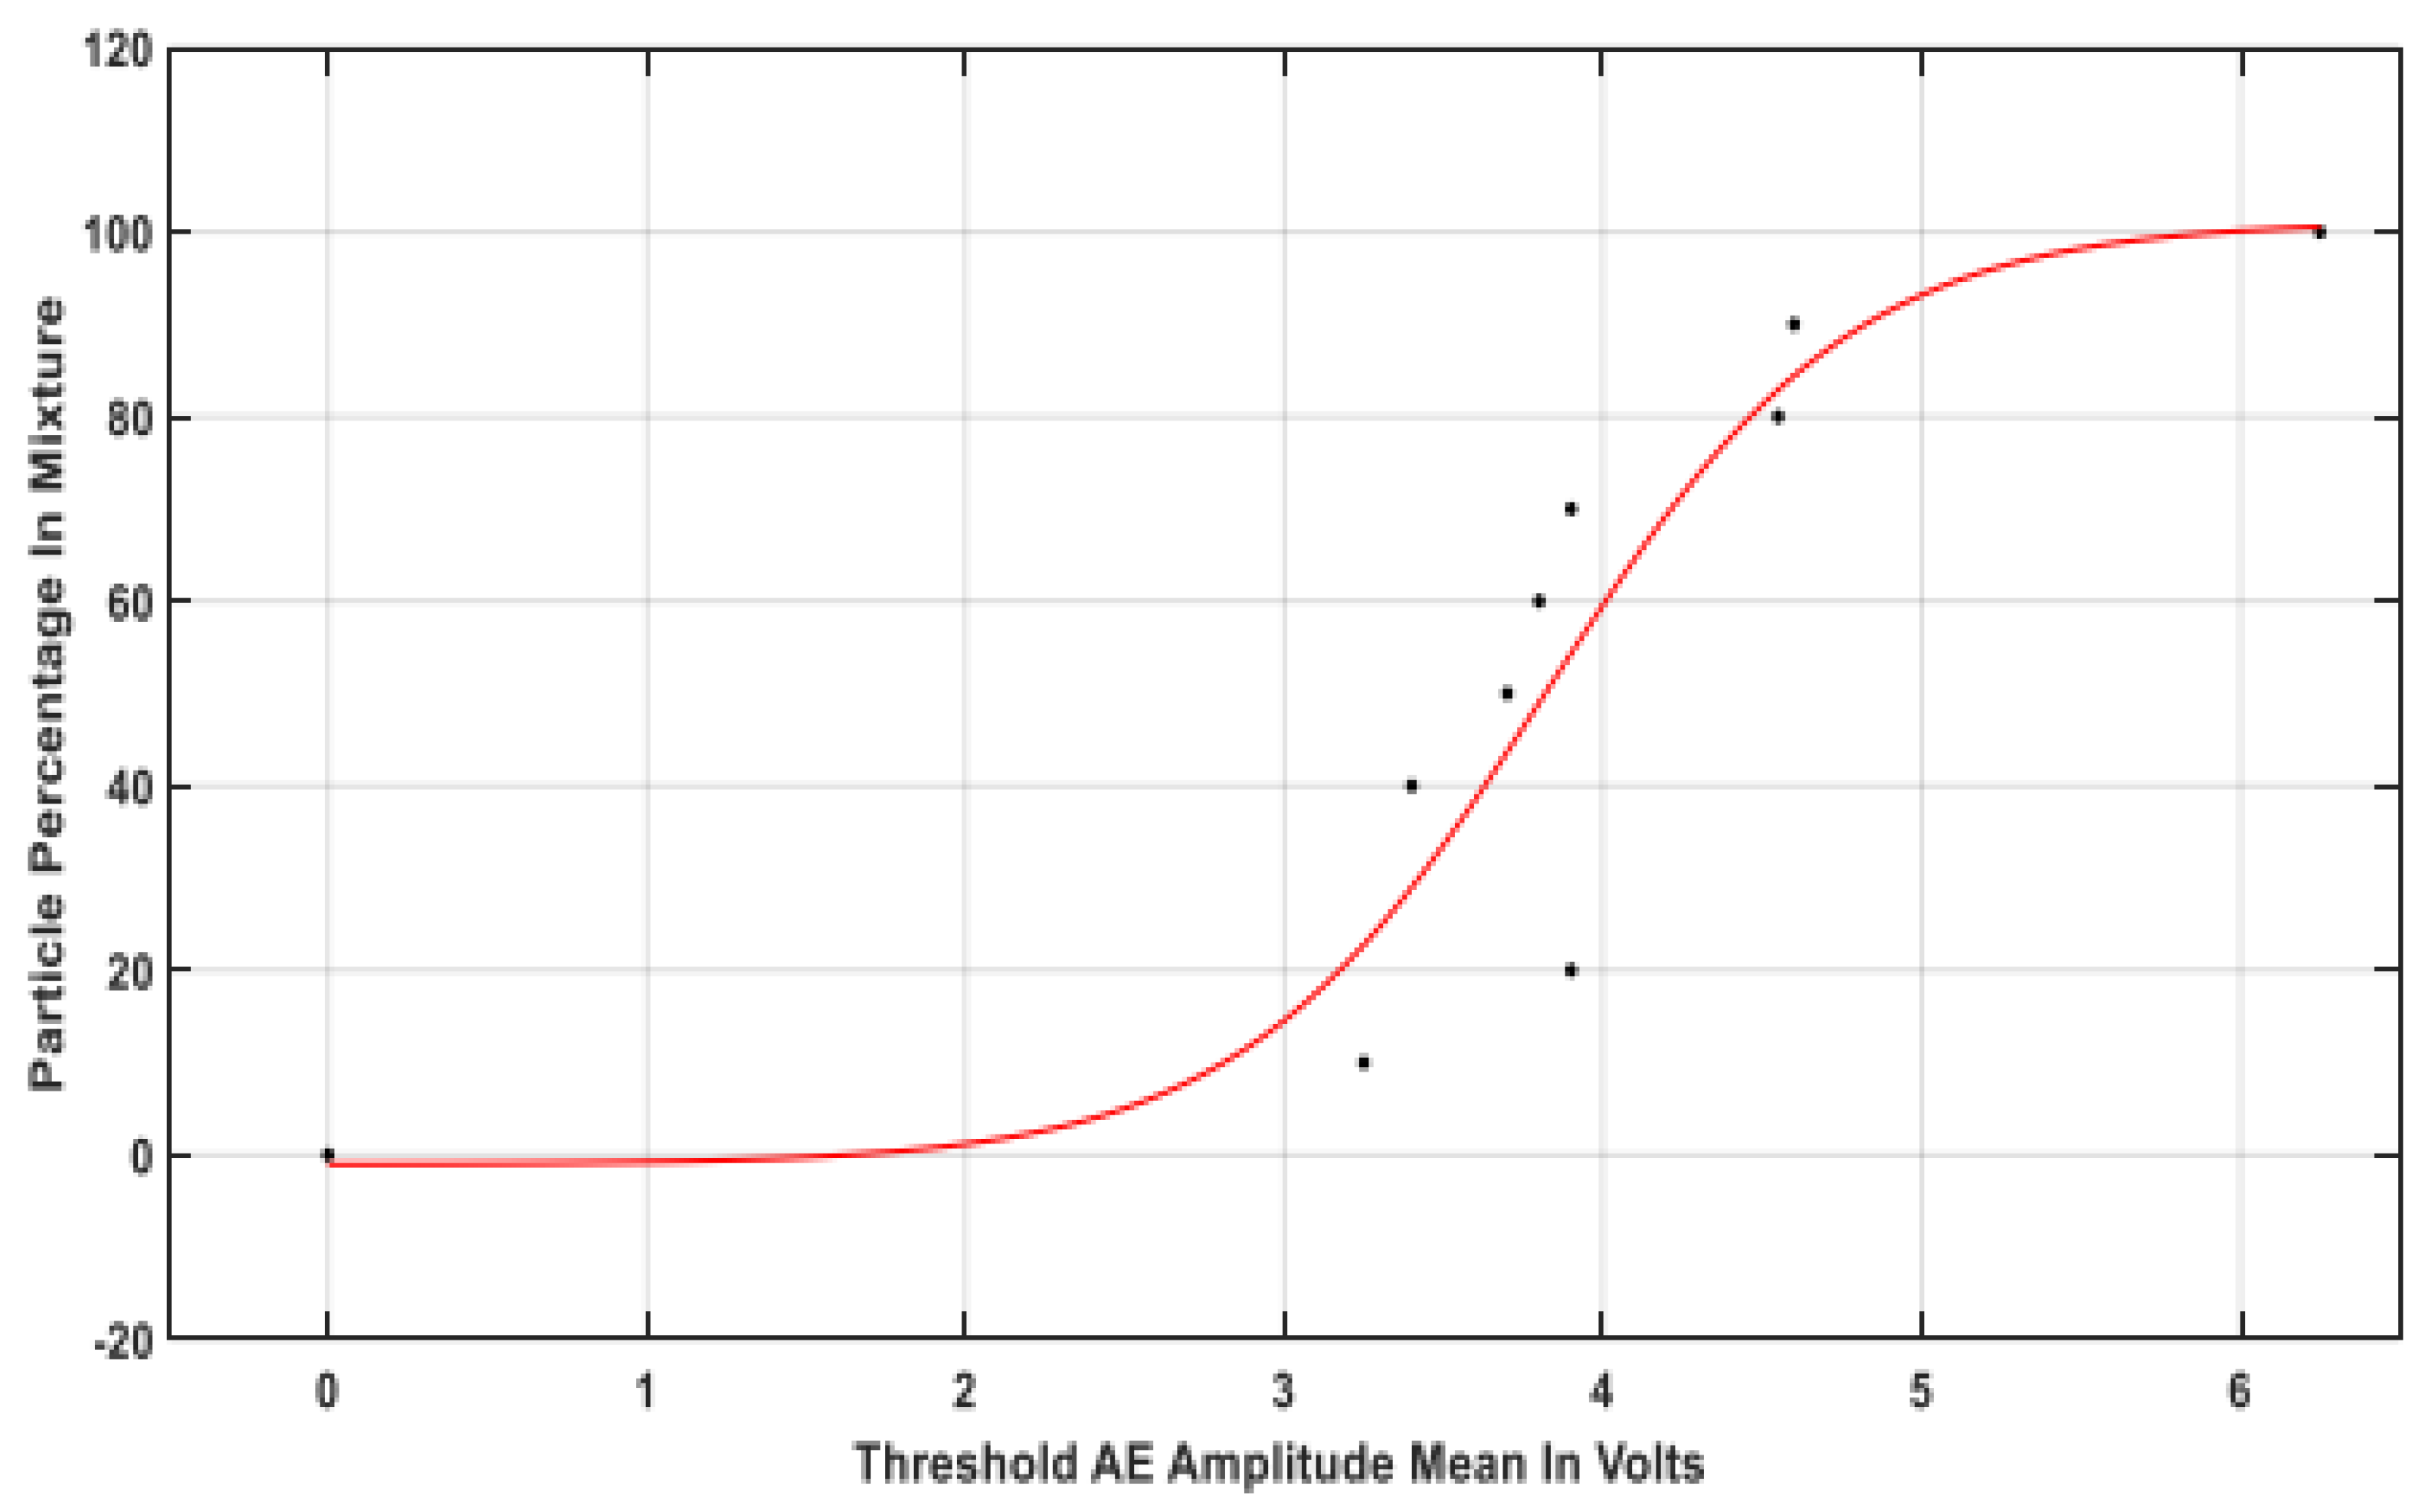
5.2. Two-Constituent Mixture PSD Estimation with Experimental Materials

In this section, the signal processing model for powder mixtures was utilized for the PSD estimation of different variants of binary mixtures comprising of the experimental powders in order to observe the behavior of the devised approach and the extent to which AE can be used to estimate mixture constituent distribution.

5.2.1. Mixture of Similar-Size Particles with Regular Geometry

For this experiment, a group of glass beads with a size range spanning 150–212 microns and 212–300 microns which had a bulk density difference of around 2.6% was used. The optimal threshold showed that a linear relationship existed for change in the mixture ratio of the powders with the accompanying AE signal. The validation exercise carried out on a set of unseen mixtures provided validation statistics where the average absolute error metric was recorded as 12%, where it is thought that the reason for this seemingly high error metric was due to the similarities in particle sizes, which implies a similar range of AE signals, thus deeming them to be challenging for effective separation from an acquired AE signal [27].

5.2.2. Mixture of Different Sized Particles

For this experiment, a mixture of a range of glass bead particles spanning 150–212 microns and 425–600 microns were mixed together in different capacities, both of which had a bulk density difference of 6.3%. Using the designed approach, the optimal threshold region produced a sigmoidal relationship between the change in AE signal for various mixture ratios (as seen in Figure 12), and this could potentially be attributed to the difference in particle sizes which makes for a non-linear change in the AE signal for various mixture ratios, as modelled by the sigmoid in this case [27].
The average absolute error in this case for an unseen set of mixtures produced a figure of 10%, which is down from the prior experiments involving particles closer in size range. This implies that the greater the bulk density difference and separation in particle size range, then the greater the potential of a PSD estimate with a higher error value using the proposed approach.

5.2.3. Mixture of Particles with Regular and Irregular Geometry

For this experiment, a mixture comprising of powders with different geometries (i.e., spherical glass beads and irregular polyethylene) was mixed together. Although the size ranges (150–250 microns) were similar to the glass beads (150–212 microns), the different materials for each set of powders led a to a bulk density difference of 76.9%, alongside different Young’s modulus and Poisson’s ratio values, again due to their material properties [27,80].
Similar to the prior experiment, the relationship between the AE signal and the varying powder mixture yielded a sigmoidal curve and was again indicative of the non-linear AE behavior as the mixture ratio varied. The validation exercises carried out produced an average absolute error of 3%, which was down considerably when compared with the prior two experiments. The reason for this could be attributed potentially to the wide bulk density difference between the two sets of powder groups, which can be assumed to be a driver for the extent to which the powders can be separated and their PSD estimated from their AE signal. An auxiliary reason could be the material characteristics, in the sense that the glass beads are crystalline and generally of a harder nature, while the polyethylene particles have a relatively brittle nature and a relatively lower hardness characteristic, which would inevitably drive the AE signal and render their impacts to be distinctly different from that of the glass beads, which in turn has ultimately yielded a good error metric for their PSD estimation from the AE signal.

5.2.4. Estimation of Big (>500 Microns) and Small (<500 Microns) Particles in a Heterogenous Washing Powder Compound

Building on the results from prior experiments, this work involved the use of the actual in-process material which, as mentioned, was heterogenous, spanning 53–1500 microns, and was a mixture of particles of different physical characteristics, geometries and so on [29]. The first exercise involved the replication of the sieving process carried out as part of the offline process checks using a layer sieve where the powders are sieved to separate the Small (<500 microns) from the Big (>500 microns) and where a bulk density difference between the two groups of powders was 8% [29]. This experiment involved the replication of this procedure solely from the acquired AE signal.
The regression curve from the optimal threshold region showed that a non-linear relationship exists between the change in the powder mixture ratio and the concurrent AE signal, while the subsequent validation exercise with an unseen set of test mixtures produced an average absolute error of 6%. The results suggest that despite the apparent stochasticity of the washing powder AE, the designed signal processing approach was indeed capable of distinguishing and mapping out the PSD of the two sets of constituents created from the washing powder itself. The results have helped to show how the bulk AE signal from each group of powders (i.e., Small and Big) can be modelled and recognized and how their changes can be tracked using the proposed signal processing approach, despite the variability and stochastic nature of the signals.

5.3. AE-Based PSD Estimation of up to Six Bins for the Washing Powder Compound

For this experiment, it was investigated whether it would be possible to estimate the PSD of mixtures which have more than two component powders [98]. As part of this, the two-constituent approach was extended using the one-vs-all approach, similar to Newton’s two-body problem mentioned earlier. For this exercise, it was investigated what kind of distribution would be best to use to train and assemble the regression curve, of which a contrastive exercise was carried out between a normal and a uniform distribution [98]. The results of this comprised a use of the designed signal processing approach alongside an auxiliary mathematical model and showed that the uniform distribution produced the best results all around for when the powder mixture was in its normal mixture distribution and also when there was a process deviation and a mixture skew occurred, i.e., too many small or big particles present in the mixture [98]. This also provides evidence to support the notion that the designed approach may be useful in tracking process deviations at various points in the batch mixing process.

5.4. Algorithm Comparison Case Study

The designed signal processing approach is centered around the use of the time domain as the principal signal analysis domain due to computational efficiency and without the need for further domain transformation. The algorithm comparison case study involved a time-frequency domain comparison, where this domain was chosen instead of the frequency domain due to the importance of temporal information as part of the actual process itself (where the time–frequency domain involves a dual component of both temporal and frequency-based information).
It should be noted that, although the wavelet transform approach is computationally intensive and overall unsuited to this particular manufacturing problem, the work done as part of this section contributes to a research-based comparison and a benchmarking of the designed signal processing approach.
Here, the wavelet decomposition was adopted from the literature to serve as a basis for algorithm comparison. A wavelet can be defined as a highly dynamic function that can be localized in both time and frequency, where the wavelet transform itself is capable of producing a time–frequency projection of a signal and also serving to decompose the signal into sub-components as part of its filter banks [51,106,107]. A continuous mathematical formula of the wavelet equation can be seen as follows:
Ψ a , b t = 1 a Ψ t a a
From Equation (6), Ψ represents the mother wavelet, a is the scale, b is the translation (where a,b R, and a ≠ 0) and t is the time parameter. A discrete and computationally efficient means of representing the continuous wavelet transform is the discrete wavelet transform (DWT), which allows for the separation and breakdown of signals into a set of orthogonal wavelets using a set of filter banks that contribute to the filtering of signals, as well as dimensionality reduction [108]. The discretized representation of the continuous wavelet can be seen as follows and is expressed using the dyadic scaling:
Ψ j , k t = 2 1 2 Ψ 2 j t k
where j is the wavelet level and k is the temporal location. The procedure of the wavelet decomposition involves the iterative separation of the signal into the approximate (low frequency components) and detailed (high frequency components) and coefficients.
The Daubechies mother wavelet was used as part of this algorithm comparison case study [109], while the AE signal energy was used in this scenario as the primary feature, and details of the specific technical details of the decomposition levels, etc., can be found in Nsugbe [27].
The first exercise carried out as part of the algorithm comparison study was the size differentiation exercise, from which the anticipated linear relationship between particle sizes and resulting AE signal energy was noted and validated, further reinforcing the mentioned LTI principle [27]. This was followed by a two-component mixture PSD estimation exercise where the performance of the wavelet was compared with the designed approach, where it was seen that the wavelet produced an estimation accuracy of 7% while the threshold method produced a figure of 10% [27]. This was followed by an exercise involving the actual washing powder compound with the small and big powder estimation, of which the regression curve showed that the wavelet approach was unable to detect changes in mixtures which were not dominated by bigger particles, i.e., 60%+, and thus proved to be limited in its scope [27]. The implications of this are that the wavelet approach effectively struggles to deal with the non-linear and stochastic AE signals resulting from the washing powder compound, whereas the designed signal processing approach appears to be capable of dealing with these kinds of signals alongside an appropriate estimation of the PSD with a reasonable accuracy.
Theoretically, it is still unclear why this is the case, as there could be a combination of reasons for this apparent observation, which may include the frequency domain being generally unsuitable for estimation exercises comprising of highly stochastic signals, all the way down to the possibility of the intrinsic modes of the wave propagation medium limiting a frequency-based manifestation and analysis of the signal [110]. Further research and emphasis would be required to clarify and investigate this notion further.

5.5. Benchmarking against Current Literature

In addition to the above comparison exercise, the proposed PSD estimation signal processing approach was also qualitatively contrasted against the work of other authors as seen in Table 2.

6. Implementation of the Framework and Further Work

The implementation of the framework and control system proposed as part of Figure 2 can be assumed to be a process involving a multitude of steps. First, a region on the drum mixer from the actual process needs to be identified, one which the powders regularly strike during the mixture process and can allow the acquisition of rich structural borne passive AE signals. If this is not possible, then a minor process modification would need to take place where a waveguide of desired properties can be utilized and serve as the information carrier of the AE events from the mixing process [112,113]. This can then be interfaced with an embedded system which can be of either a field-programmable gate array (FPGA) or an appropriate variant of the Arduino devices [114,115]. This embedded electronic system can host the signal processing algorithm (LSDL) and its final parameters once calibrated and obtained, as well as subsequent algorithmic components such as the optimal state tracker and the control scheme.
In terms of further work that can be done to build on the process control architecture proposed as part of this study, once the manufacturing process is performing satisfactorily under the influence of feedback and the product is now within an acceptable quality band, the manufacturing process could be expanded from its continuous batch production format into a continuous production line, which would see a greater turnover in manufacturing throughput and ultimately greater revenue drawn in from sales. Other aspects of improvement that could be carried out in relation to the signal processing side of things could involve an exploration of additional statistical features that can be included as part of the feature extraction stage that would yield an increase in the overall accuracy of the proposed model. Note that non-linear and complexity features (i.e., entropy and fractal features) should be avoided, since despite their ability to effectively characterize stochastic signals, their premium computation time would ultimately be unsatisfactory for the requirements of this manufacturing process.
Finally, unsupervised learning could be explored as part of the control architecture to cue and serve as a means of self-learning and independent adaptation for the process, which would reduce the amount of offline training and calibrations necessary for the setup of the system. This would ultimately elevate the level of autonomy of the process control system and would yield some cost-saving benefits through eliminating a need for offline calibration and so on. However, it does need to be acknowledged that the implementation of unsupervised learning for a highly variable process of this kind can be anticipated to not be trivial [116].

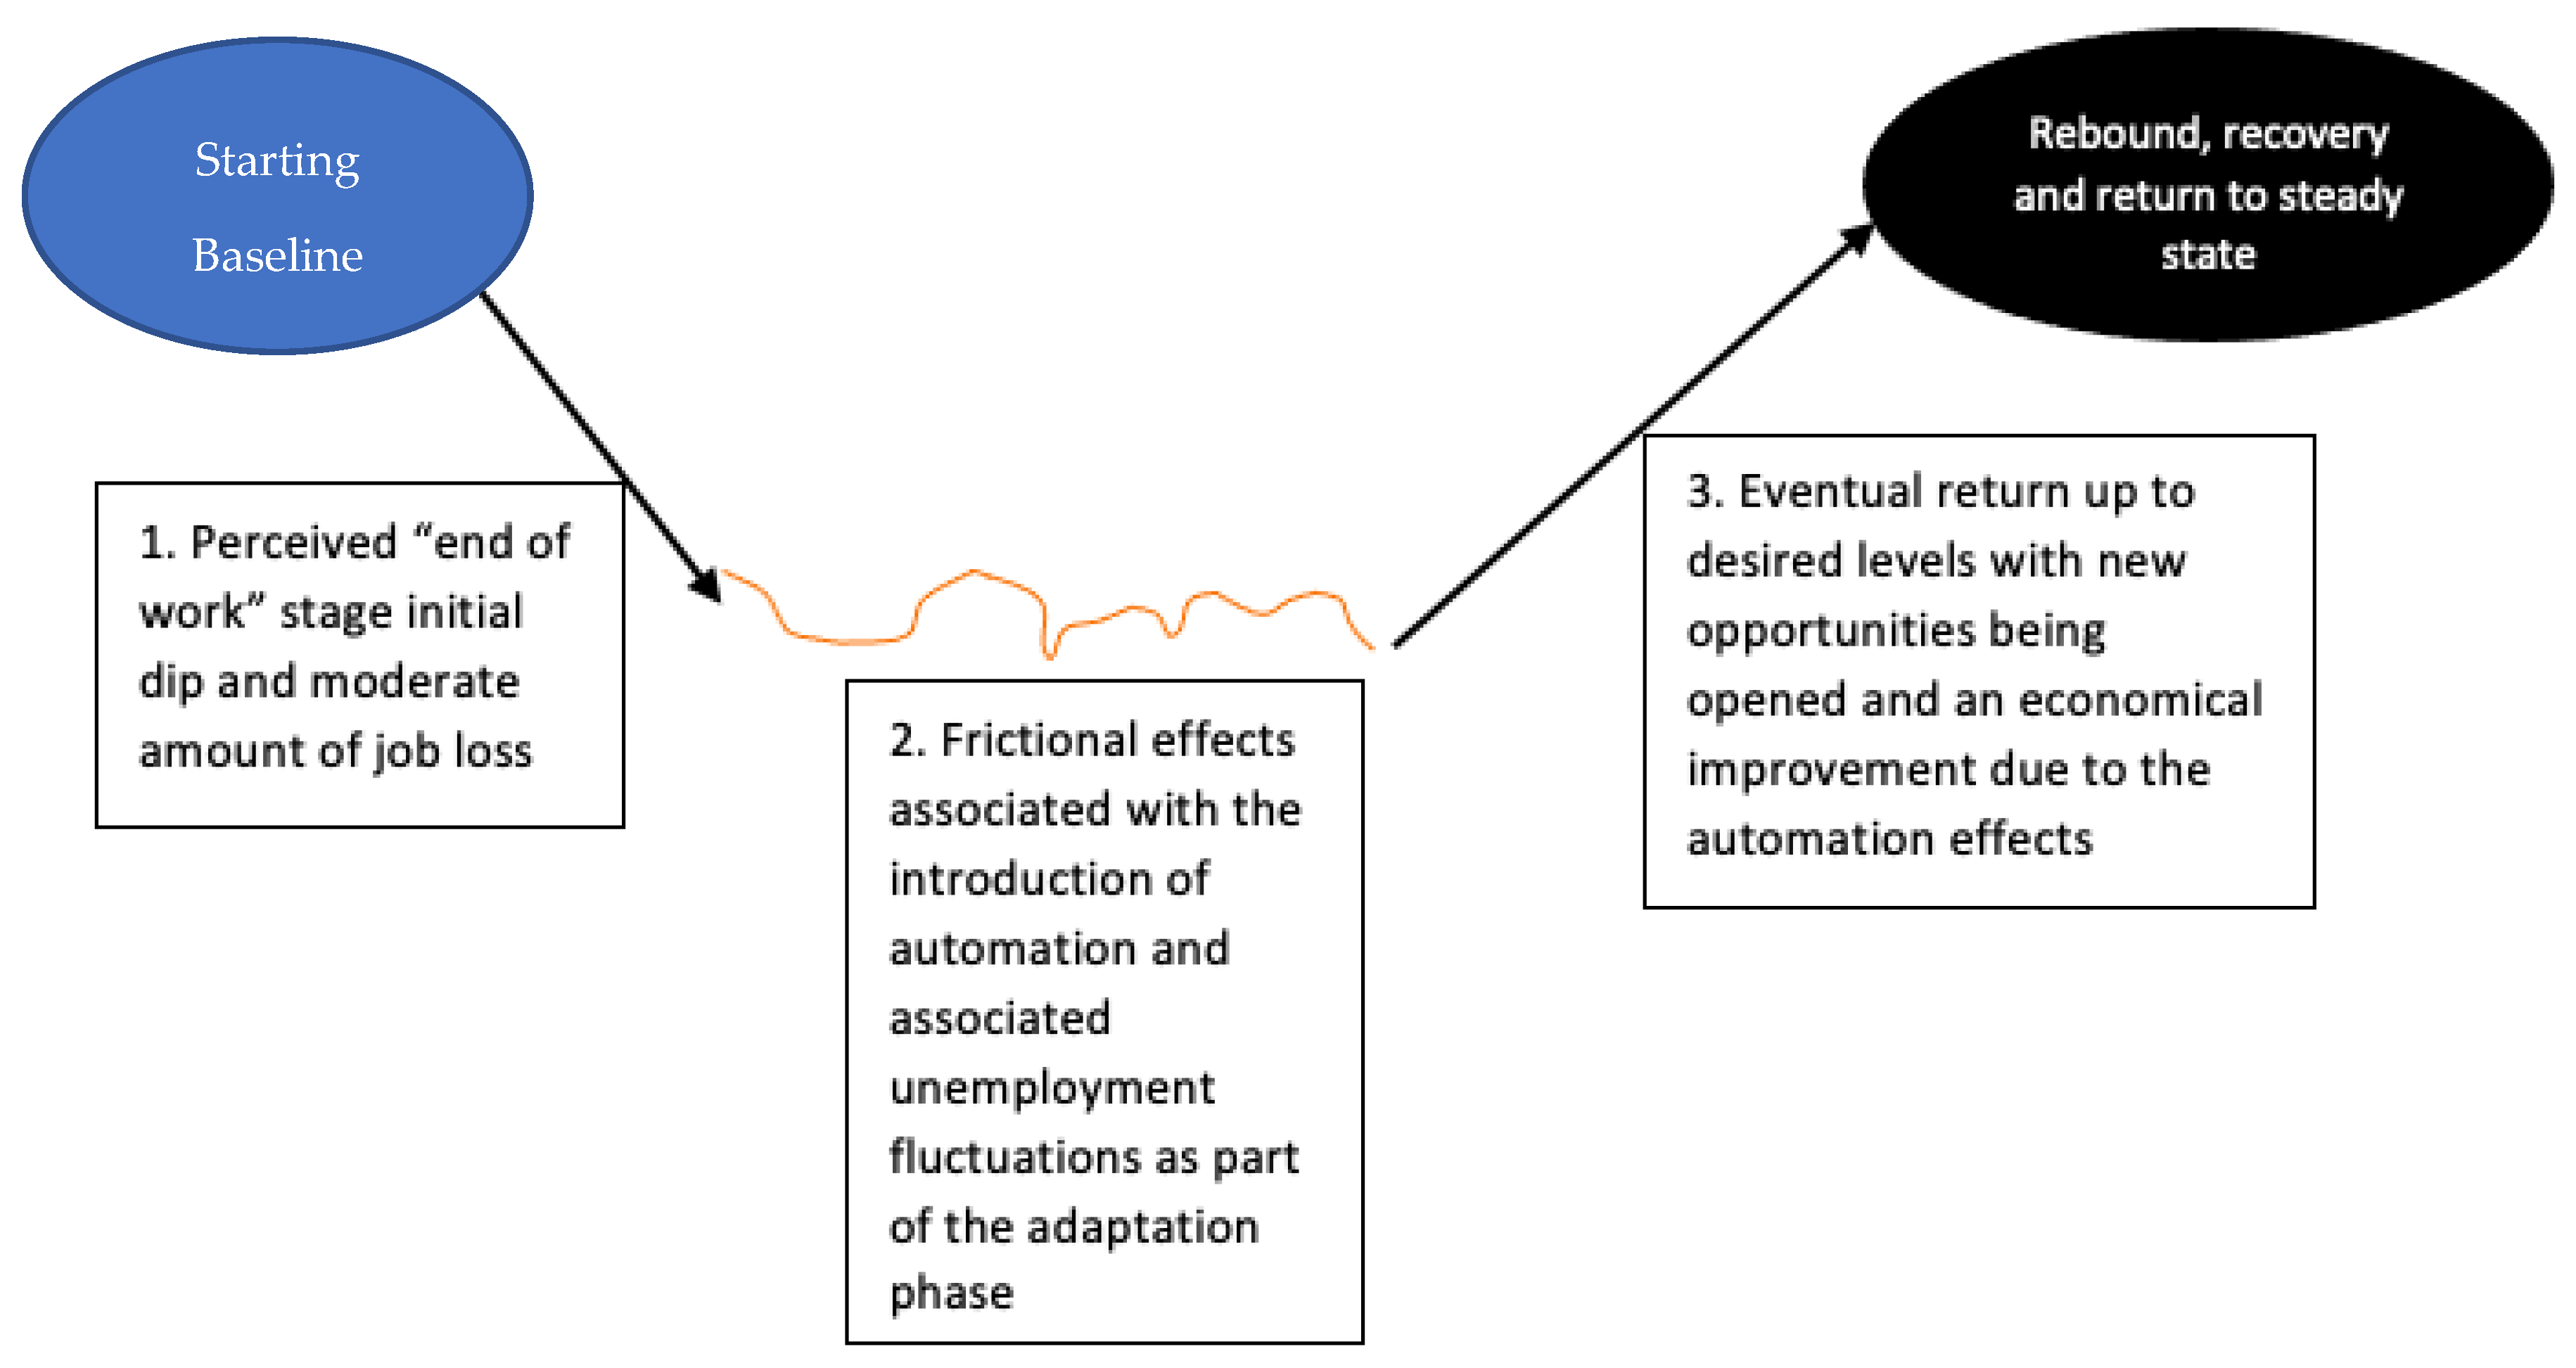
7. Influence of the Adoption of Cybernetics and Enhanced Automation on Wider Society

It needs to be acknowledged that the creation of an enhanced automation that boosts process efficiency and makes for a leaner manufacturing space and a more sustainable operating line would still inevitably have shortcomings, as in non-technical shortcomings emanating from the dynamic change in the setup of the process. That is to say that the workspace for the particular process in question would potentially leave a number of human workers redundant and not required as part of that particular production line itself as the process becomes capable of self-regulation. For example, staff workers who originally were assigned the tasks of sporadic product quality checking, and so on, will effectively be nulled out due to the potential new arrival of an enhanced automation platform via the veil of the proposed cybernetic process. This is a widespread problem as cybernetic methods and its periphery, i.e., AI, and robotics inevitably grow into manufacturing processes as well as various walks of life in the time to come. Thus, it feels appropriate to use this opportunity to discuss the issue of technological-based redundancies, the reality of it all and how policy makers can support, as smoothly as possible, a transition [117].
One of the more frequently used buzzwords as part of the literature on the effects of enhanced automation technology on society as a whole is “the end of work”, as described by Vermeulen et al., which is used to encompass the potential of resulting unemployment whose consequences could span knock-on effects to wages, substantial income inequality and long-term economic instability [118,119,120]. Conversely, there are also sparse counter notions which suggest that the rise and variation of technologies would also create their own form of opportunities and therein create novel job roles in the process. Furthermore, a historical significance study has implied that prior industrial revolutions have spurred reorganizations which have been accompanied by frictional unemployment before the resumption of a steady state, which saw multifaceted improvements instead of the feared societal poverty [121,122].
It has been seen that the spill-over of enhanced automation technology has potential for the creation of new job opportunities in scenarios which include the following: a rise in product demands due to improved product quality and therein the need for more workers in various capacities and jobs created from the interfacing sector which facilitate the societal adaptation to the presence of automation, i.e., the education sector as workers are being rapidly upskilled before returning to the workforce [118].
As mentioned, there is bound to be friction associated with the effects of the change in the working dynamics in industry due to automation. This can be projected to primarily comprise of three key phases which are illustrated in Figure 13.
The three highlighted stages are described as follows:
1. The first phase is the feared “end of work” setting, which is a dystopian projection with robots taking the jobs of workers as part of the rise of the new wave of advanced automation. In reality, it is anticipated that there inevitably would be forms of layoff due to the new inclusion of the automation technology. However, these workers who are made redundant would be expected to be guided through finding alternative opportunities which would ensure they are not unemployed over a prolonged stretch of time. Thus, the feared “end of work” stage is realistically a frictional dip associated with the introduction of the new technology into the workplace, which is expected to not last for a prolonged time frame [120,123]. The most primed scenario where this automation includes redundancy and job loss becomes a long-lasting trend is where the pace of re-education, re-skilling and job creation lag behind the pace of technological advancements within industry. Thus, it is paramount to make sure the aforementioned are given priority and emphasis as a means towards preventing and controlling the manifestation of a true “end of work” [120,123].
2. During the second phase of the diagram, moderate fluctuations are implied from the preceding automation-induced redundancy and job losses whereby a form of instability is experienced, during which there is an increased demand for things such as education for upskilling and a return to the workforce, including workers moving between industries and also assuming new roles that have emerged as a result of the mentioned automation wave [118].
3. The third phase is the rebound stage, at which a form of normal service resumes where employment rates within the sector return back to their baseline state and increase from the introduction of enhanced automation and its immediate frictional afterward [124,125]. The rebound phase is spurred by some of the aforementioned means towards combating the end of work, which include the introduction of a new sector and opportunities as a by-product of the new automation technologies, as well as a quicker turnaround in education and upskilling measures. It can be said that education plays a key role in the pace of technological development and thus can serve as a form of control mechanism to inhibit or accelerate technological growth and its associated effects [124,125].
It is worth addressing that the dystopian view of the effects of automation, termed as the “end of work”, can be said to neglect key components of the effects of automation and perhaps focus overtly on the knock-on effects of the initial job losses without accepting the associated positive effects of the same technology. These include the creation of new jobs around the operation and maintenance of the automation technologies, equipment supply and technology assembly, and control and compensational factors such as education, which can be used to both inhibit technological advancement while also serving to upskill workers [118]. This notion has led to authors such as Vermeulen et al. to rephrase the coined “end of work” as “usual structural change”, citing how society has had to adapt to previous technological waves involving the various technological revolutions [118]. Instead, the introduction of the new wave of automation technology would mostly yield the described frictional job losses (illustrated in Figure 13) as part of the adaptation process before swiftly returning to a steady state [118].
The roles of governing bodies and policy makers are thought to be crucial and are recommended to have strong involvement in supporting the adaptation and transition process. A summary of some of the key policies that could be put in place, as recommended by famous scholars and entrepreneurs, includes a shortlist of the following [126]:
  • Bill Gates has recommended a form of fee and levy to be applied to different bodies—depending on the extent to which they choose to adopt automation technologies—with a view towards further preventing mass adoption and somewhat serving as a soft penalty for its use [118,127].
  • The likes of Elon Musk and Richard Branson have commented in the light of the “end of work” notion—and a subsequent income disparity due to an assumed mass layoff and unemployment—and have called for a system where a possible re-distribution of wealth could take place [110,121]. This is termed as a form of “universal basic income”, which could serve as a support buffer to help minimize the effect of an assumed poverty from the enhanced automation technology [118,128].
  • Other ad-hoc measures include policy-based incentives for employers to look to hire workers who are of low skills and modification of the educational system to include components which could make workers attuned to working with, and collaborating alongside, enhanced automation-based technology [118,129].

8. Scope for Transferability of Knowledge and Findings

The science assembled as part of the solution to the process control case study has component parts which can be said to have applicability and transferability in various other areas of scientific research; a select shortlist of which includes the following:
  • A framework of the constituent parts required for the assembly of a self-regulating framework for a batch manufacturing process [130];
  • A case study on how cybernetic technology can be utilized towards the enhancement of process efficiency, but also on its use towards promoting a more sustainable manufacturing practice [131];
  • The described LSDL signal processing method, which was incepted for source separation of mixtures from stochastic AE signals, has subsequently seen applications in the processing of physiological signals within clinical medicine, areas of which include pregnancy medicine for the prediction of preterm births from uterine contraction signals, brain-machine interfaces for prosthesis control, prediction of adolescent schizophrenia using EEG signals and the depth of anesthesia during surgical processes using EEG signals [93,95,96].

9. Concluding Remarks

This work has covered the potential of applying the concepts of cybernetics towards the creation of self-regulating machinery for a powder-manufacturing process. The process in question was a batch powder agglomeration process which was in open loop and was running inefficiently, causing environmental issues from waste as well as being reliant on external influence. The proposed means towards dealing with this issue involved the use of real-time process sensors that can estimate the state of the in-process material and feed this into a control algorithm which is capable of optimizing the manufacturing process in real-time. The shortlisted control strategy that was proposed for use in this control loop was the adaptive control, while the process sensor was the AE sensor, as inspired by the related literature. As the challenges of AE sensing for powder in-process materials are related to signal processing, this paper distilled the proposed signal processing approach, reviewed its applications and ability to estimate the PSD of various powder mixtures from related studies and benchtop settings and explained how this can be transferred towards the actual process case study which is a powder-agglomeration process within a mix drum. A range of results were obtained for a variety of powder mixture scenarios, which were reviewed as part of this study.
This paper also discussed the sociological aspects and implications of the use of cybernetics and enhanced automation technology within industrial settings by analyzing the famed dystopian view of “end of work” scenario, how realistic it is to manifest itself and what is realistically likely to occur given the circumstance termed as “the usual structural change”, as coined by Vermeulen et al. [118]. It was also articulated how policy makers could contribute to easing into this transition, as well as specific policies that can be put in place [118].

Funding

This research received no external funding.

Institutional Review Board Statement

Not applicable.

Informed Consent Statement

Not applicable.

Data Availability Statement

Not applicable.

Acknowledgments

The author is and remains eternally grateful to the supervision team from the WP6s Chariot group and the wider consortium who provided him with feedback and guidance during the days of his doctoral research. The author would also like to thank Brian Kerr for his contributions.

Conflicts of Interest

The author declares no conflict of interest.

References

  1. Rao, P.N. Manufacturing Technology V1; McGraw Hill Education: New Delhi, India, 2013; ISBN 978-1-259-06257-5. [Google Scholar]
  2. Klocke, F. Manufacturing Processes; RWTHedition; Springer: Berlin/Heidelberg, Germany, 2009; ISBN 978-3-540-92259-9. [Google Scholar]
  3. Sundar, R.; Balaji, A.N.; Kumar, R.M.S. A Review on Lean Manufacturing Implementation Techniques. Procedia Eng. 2014, 97, 1875–1885. [Google Scholar] [CrossRef] [Green Version]
  4. Ge, M.; Xu, Y.; Du, R. An Intelligent Online Monitoring and Diagnostic System for Manufacturing Automation. IEEE Trans. Autom. Sci. Eng. 2008, 5, 127–139. [Google Scholar] [CrossRef]
  5. Zijm, W.H.M. Towards intelligent manufacturing planning and control systems. OR-Spektrum 2000, 22, 313–345. [Google Scholar] [CrossRef]
  6. Leitão, P. A Bio-Inspired Solution for Manufacturing Control Systems. In Proceedings of the Innovation in Manufacturing Networks; Azevedo, A., Ed.; Springer US: Boston, MA, USA, 2008; pp. 303–314. [Google Scholar]
  7. Leitão, P. Agent-based distributed manufacturing control: A state-of-the-art survey. Eng. Appl. Artif. Intell. 2009, 22, 979–991. [Google Scholar] [CrossRef]
  8. Sum, C.-C.; Hill, A.V. A New Framework for Manufacturing Planning and Control Systems. Decis. Sci. 1993, 24, 739–760. [Google Scholar] [CrossRef]
  9. Hong, M.S.; Severson, K.A.; Jiang, M.; Lu, A.E.; Love, J.C.; Braatz, R.D. Challenges and opportunities in biopharmaceutical manufacturing control. Comput. Chem. Eng. 2018, 110, 106–114. [Google Scholar] [CrossRef]
  10. Karoly, P. Mechanisms of self-regulation: A systems view. Annu. Rev. Psychol. 1993, 44, 23–52. [Google Scholar] [CrossRef]
  11. Nsugbe, E. A cybernetic framework for predicting preterm and enhancing care strategies: A review. Biomed. Eng. Adv. 2021, 2, 100024. [Google Scholar] [CrossRef]
  12. Doyle, J.C.; Francis, B.A.; Tannenbaum, A. Feedback Control Theory; Dover: Mineola, NY, USA, 2009; ISBN 978-0-486-46933-1. [Google Scholar]
  13. Lhote, F.; Chazelet, P.; Dulmet, M. The extension of principles of cybernetics towards engineering and manufacturing. Annu. Rev. Control 1999, 23, 139–148. [Google Scholar] [CrossRef]
  14. Scala, J.; Purdy, L.; Safayeni, F. Application of cybernetics to manufacturing flexibility: A systems perspective. J. Manuf. Technol. Manag. 2006, 17, 22–41. [Google Scholar] [CrossRef]
  15. Wu, J.; Plenert, G. Management cybernetics: Manufacturing in China. Kybernetes 1995, 24, 50–56. [Google Scholar] [CrossRef]
  16. Tzafestas, S.G. Systems, Cybernetics, Control, and Automation: Ontological, Epistemological, Societal, and Ethical Issues; River Publishers: Gistrup, Denmark, 2017; ISBN 978-87-93609-06-8. [Google Scholar]
  17. Cao, Q.; Giustozzi, F.; Zanni-Merk, C.; de Bertrand de Beuvron, F.; Reich, C. Smart Condition Monitoring for Industry 4.0 Manufacturing Processes: An Ontology-Based Approach. Cybern. Syst. 2019, 50, 82–96. [Google Scholar] [CrossRef]
  18. Johnson, C.D. Process Control Instrumentation Technology, 6th ed.; Prentice Hall PTR: Upper Saddle River, NJ, USA, 1999; ISBN 978-0-13-938200-0. [Google Scholar]
  19. Ender, D.B. Process Control Performance: Not as Good as you Think. Control Eng. 1993, 40, 7. [Google Scholar]
  20. Leveson, N.G.; Heimdahl, M.P.E.; Hildreth, H.; Reese, J.D. Requirements specification for process-control systems. IEEE Trans. Softw. Eng. 1994, 20, 684–707. [Google Scholar] [CrossRef] [Green Version]
  21. Bequette, B.W. Process Control: Modeling, Design, and Simulation; Prentice-Hall international series in the physical and chemical engineering sciences; Prentice Hall PTR: Upper Saddle River, NJ, USA, 2003; ISBN 978-0-13-353640-9. [Google Scholar]
  22. Bao, J.; Lee, P.L. Process Control: The Passive Systems Approach; Advances in Industrial Control; Springer: London, UK, 2007; ISBN 978-1-84628-892-0. [Google Scholar]
  23. Goodwin, G.C.; Graebe, S.F.; Salgado, M.E.; Goodwin, G.C. Control System Design; Prentice Hall: Upper Saddle River, NJ, USA, 2001; ISBN 978-0-13-958653-8. [Google Scholar]
  24. Munir, M.T.; Wilson, D.I.; Depree, N.; Boiarkina, I.; Prince-Pike, A.; Young, B.R. Real-time product release and process control challenges in the dairy milk powder industry. Curr. Opin. Food Sci. 2017, 17, 25–29. [Google Scholar] [CrossRef]
  25. Vlasea, M.L.; Lane, B.; Lopez, F.; Mekhontsev, S.; Donmez, A. Development of Powder Bed Fusion Additive Manufacturing Test Bed for Enhanced Real-Time Process Control. In Proceedings of the 2015 International Solid Freeform Fabrication Symposium; University of Texas at Austin: Austin, TX, USA, 2015. [Google Scholar]
  26. Singh, R. Chapter 18—Implementation of control system into continuous pharmaceutical manufacturing pilot plant (powder to tablet). In Computer Aided Chemical Engineering, Proceedings of the Process Systems Engineering for Pharmaceutical Manufacturing, 2018; Singh, R., Yuan, Z., Eds.; Elsevier: Amsterdam, The Netherlands; Volume 41, pp. 447–469.
  27. Nsugbe, E. Particle Size Distribution Estimation of A Powder Agglomeration Process Using Acoustic Emissions. Ph.D. Thesis, Cranfield University, Cranfield, Bedfordshire, UK, September 2017. [Google Scholar]
  28. Nsugbe, E.; Starr, A.; Ruiz-Carcel, C. Monitoring the particle size distribution of a powder mixing process with acoustic emissions: A review. Eng. Technol. Ref. 2016, 1, 1–12. [Google Scholar] [CrossRef]
  29. Nsugbe, E.; Ruiz-Carcel, C.; Starr, A.; Jennions, I. Estimation of fine and oversize particle ratio in a heterogeneous compound with acoustic emissions. Sensors 2018, 18, 851. [Google Scholar] [CrossRef] [Green Version]
  30. Jillavenkatesa, A.; Dapkunas, S.J.; Lum, L.-S.H. Particle Size Characterization; National Institute of Standards and Technology: Gaithersburg, MD, USA, 2001. [Google Scholar]
  31. Kroetsch, D.; Wang, C. Particle size distribution. Soil Sampl. Methods Anal. 2008, 2, 713–725. [Google Scholar]
  32. Aversa, A.; Marchese, G.; Saboori, A.; Bassini, E.; Manfredi, D.; Biamino, S.; Ugues, D.; Fino, P.; Lombardi, M. New Aluminum Alloys Specifically Designed for Laser Powder Bed Fusion: A Review. Materials 2019, 12, 1007. [Google Scholar] [CrossRef] [Green Version]
  33. Strano, G.; Hao, L.; Everson, R.M.; Evans, K.E. Surface roughness analysis, modelling and prediction in selective laser melting. J. Mater. Process. Technol. 2013, 213, 589–597. [Google Scholar] [CrossRef]
  34. Ruiz-Carcel, C.; Starr, A.; Nsugbe, E. Estimation of powder mass flow rate in a screw feeder using acoustic emissions. Powder Technol. 2018, 336, 122–130. [Google Scholar] [CrossRef] [Green Version]
  35. Nsugbe, E.; Starr, A.; Jennions, I.; Ruiz-Carcel, C. Estimation of online particle size distribution of a particle mixture in free fall with acoustic emission. Part. Sci. Technol. 2019, 37, 953–963. [Google Scholar] [CrossRef]
  36. Gee, G.W.; Or, D. 2.4 Particle-Size Analysis. In Methods of Soil Analysis; John Wiley & Sons, Ltd.: Hoboken, NJ, USA, 2002; pp. 255–293. ISBN 978-0-89118-893-3. [Google Scholar]
  37. Eshel, G.; Levy, G.J.; Mingelgrin, U.; Singer, M.J. Critical Evaluation of the Use of Laser Diffraction for Particle-Size Distribution Analysis. Soil Sci. Soc. Am. J. 2004, 68, 736–743. [Google Scholar] [CrossRef]
  38. Mora, C.F.; Kwan, A.K.H.; Chan, H.C. Particle size distribution analysis of coarse aggregate using digital image processing. Cem. Concr. Res. 1998, 28, 921–932. [Google Scholar] [CrossRef]
  39. Igathinathane, C.; Pordesimo, L.O.; Columbus, E.P.; Batchelor, W.D.; Sokhansanj, S. Sieveless particle size distribution analysis of particulate materials through computer vision. Comput. Electron. Agric. 2009, 66, 147–158. [Google Scholar] [CrossRef]
  40. Liu, K. Some factors affecting sieving performance and efficiency. Powder Technol. 2009, 193, 208. [Google Scholar] [CrossRef]
  41. Kawamoto, H. Some techniques on electrostatic separation of particle size utilizing electrostatic traveling-wave field. J. Electrost. 2008, 66, 220–228. [Google Scholar] [CrossRef]
  42. Leach, M.F.; Rubin, G.A.; Williams, J.C. Particle size determination from acoustic emissions. Powder Technol. 1977, 16, 153–158. [Google Scholar] [CrossRef]
  43. Cooke, W.; Warr, S.; Huntley, J.M.; Ball, R.C. Particle size segregation in a two-dimensional bed undergoing vertical vibration. Phys. Rev. E 1996, 53, 2812–2822. [Google Scholar] [CrossRef]
  44. Pasikatan, M.C.; Steele, J.L.; Spillman, C.K.; Haque, E. Near Infrared Reflectance Spectroscopy for Online Particle Size Analysis of Powders and Ground Materials. J. Infrared Spectrosc. 2001, 9, 153–164. [Google Scholar] [CrossRef]
  45. Heath, A.R.; Fawell, P.D.; Bahri, P.A.; Swift, J.D. Estimating Average Particle Size by Focused Beam Reflectance Measurement (FBRM). Part. Part. Syst. Charact. 2002, 19, 84–95. [Google Scholar] [CrossRef]
  46. Hay, K.J.; Liu, Z.-C.; Hanratty, T.J. A backlighted imaging technique for particle size measurements in two-phase flows. Exp. Fluids 1998, 25, 226–232. [Google Scholar] [CrossRef]
  47. Zhang, J.Q.; Yan, Y. On-line continuous measurement of particle size using electrostatic sensors. Powder Technol. 2003, 135–136, 164–168. [Google Scholar] [CrossRef]
  48. Watano, S.; Numa, T.; Koizumi, I.; Osako, Y. Feedback control in high shear granulation of pharmaceutical powders. Eur. J. Pharm. Biopharm. Off. J. Arb. Pharm. Verfahr. EV 2001, 52, 337–345. [Google Scholar] [CrossRef] [PubMed]
  49. Huang, J.; Kaul, G.; Utz, J.; Hernandez, P.; Wong, V.; Bradley, D.; Nagi, A.; O’Grady, D. A PAT approach to improve process understanding of high shear wet granulation through in-line particle measurement using FBRM C35. J. Pharm. Sci. 2010, 99, 3205–3212. [Google Scholar] [CrossRef]
  50. Hancke, G.P.; Malan, R. A modal analysis technique for the on-line particle size measurement of pneumatically conveyed pulverized coal. IEEE Trans. Instrum. Meas. 1998, 47, 114–122. [Google Scholar] [CrossRef]
  51. Bastari, A.; Cristalli, C.; Morlacchi, R.; Pomponi, E. Acoustic emissions for particle sizing of powders through signal processing techniques. Mech. Syst. Signal Process 2011, 25, 901–916. [Google Scholar] [CrossRef]
  52. Sieve Shakers & Sieving Machines—Excellent Performance by Endecotts. Available online: https://www.endecotts.com/products/sieve-shakers/ (accessed on 27 June 2022).
  53. Soori, U.; Yuen, P.W.T.; Zahidi, U.; James, D. Chemical sensing of washing powder by multispectral imaging. AIP Conf. Proc. 2019, 2146, 020011. [Google Scholar] [CrossRef]
  54. Wiener, N. Cybernetics or Control and Communication in the Animal and the Machine, 2nd ed.; reprint; MIT Press: Cambridge, MA, USA, 2007; ISBN 978-0-262-73009-9. [Google Scholar]
  55. Ashby, W.R. An Introduction to Cybernetics; Martino Fine Books: Connecticut, CT, USA, 2015; ISBN 978-1-61427-765-1. [Google Scholar]
  56. Froese, T. From Cybernetics to Second-Order Cybernetics: A Comparative Analysis of Their Central Ideas. Constr. Found. 2010, 5, 75–85. [Google Scholar]
  57. Heylighen, F.; Joslyn, C. Cybernetics and Second-Order Cybernetics. In Encyclopedia of Physical Science and Technology; Elsevier: Amsterdam, The Netherlands, 2003; pp. 155–169. ISBN 978-0-12-227410-7. [Google Scholar]
  58. Dunn, W.C. Introduction to Instrumentation, Sensors and Process Control; Artech House: Boston, MA, USA, 2006; ISBN 978-1-58053-025-5. [Google Scholar]
  59. Helm, I.; Jalukse, L.; Leito, I. Measurement Uncertainty Estimation in Amperometric Sensors: A Tutorial Review. Sensors 2010, 10, 4430–4455. [Google Scholar] [CrossRef] [Green Version]
  60. Durrant-Whyte, H. Introduction to Estimation and the Kalman Filter. Aust. Cent. Field Robot. 2001, 28, 65–94. [Google Scholar]
  61. Simon, D. Kalman filtering with state constraints: A survey of linear and nonlinear algorithms. IET Control Theory Amp. Appl. 2010, 4, 1303–1318. [Google Scholar] [CrossRef] [Green Version]
  62. Provost, M.J. Kalman filtering applied to time series analysis. In Proceedings of the IEE Seminar on Aircraft Airborne Condition Monitoring (Ref. No. 2003/10203), 14 May 2003; pp. 3/1–3/7. Available online: https://ieeexplore.ieee.org/document/1291915 (accessed on 29 June 2022).
  63. Bequette, B.W. Process Control: Modeling, Design, and Simulation; Prentice Hall Professional: Hoboken, NJ, USA, 2003; ISBN 978-0-13-353640-9. [Google Scholar]
  64. Johnson, M.A.; Moradi, M.H. (Eds.) PID Control: New Identification and Design Methods; Springer: New York, NY, USA, 2005; ISBN 978-1-85233-702-5. [Google Scholar]
  65. Lewis, F.L.; Vrabie, D.; Syrmos, V.L. Optimal Control; John Wiley & Sons: Hoboken, NJ, USA, 2012; ISBN 978-1-118-12272-3. [Google Scholar]
  66. Mahfouf, M.; Linkens, D.A.; Kandiah, S. Fuzzy Takagi-Sugeno Kang model predictive control for process engineering. In Proceedings of the IEE Colloquium on Model Predictive Control: Techniques and Applications Day 2, London, UK, 29 April 1999. [Google Scholar] [CrossRef]
  67. Zhou, K.; Doyle, J.C. Essentials of Robust Control; Prentice Hall: Upper Saddle River, NJ, USA, 1998; ISBN 978-0-13-525833-0. [Google Scholar]
  68. Åström, K.J.; Wittenmark, B. Adaptive Control, 2nd ed.; Dover books on engineering; Dover Publications: Mineola, NY, USA, 2008; ISBN 978-0-486-46278-3. [Google Scholar]
  69. Qin, S.J.; Badgwell, T.A. A survey of industrial model predictive control technology. Control Eng. Pract. 2003, 11, 733. [Google Scholar] [CrossRef]
  70. Landau, I.D.; Lozano, R.; M’Saad, M.; Karimi, A. Adaptive Control: Algorithms, Analysis and Applications; Springer Science & Business Media: Berlin, Germany, 2011; ISBN 978-0-85729-664-1. [Google Scholar]
  71. Chen, Y.; Wei, Y.; Liang, S.; Wang, Y. Indirect model reference adaptive control for a class of fractional order systems. Commun. Nonlinear Sci. Numer. Simul. 2016, 39, 458–471. [Google Scholar] [CrossRef]
  72. Fritz, S.; See, L.; Carlson, T.; Haklay, M.; Oliver, J.L.; Fraisl, D.; Mondardini, R.; Brocklehurst, M.; Shanley, L.A.; Schade, S.; et al. Citizen science and the United Nations Sustainable Development Goals. Nat. Sustain. 2019, 2, 922–930. [Google Scholar] [CrossRef] [Green Version]
  73. Madou, M.; Florkey, J. From Batch to Continuous Manufacturing of Microbiomedical Devices. Chem. Rev. 2000, 100, 2679–2692. [Google Scholar] [CrossRef]
  74. Hu, Y.; Qian, X.; Huang, X.; Gao, L.; Yan, Y. Online continuous measurement of the size distribution of pneumatically conveyed particles by acoustic emission methods. Flow Meas. Instrum. 2014, 40, 163–168. [Google Scholar] [CrossRef]
  75. Hansuld, E.M.; Briens, L.; Sayani, A.; McCann, J.A.B. An investigation of the relationship between acoustic emissions and particle size. Powder Technol. 2012, 219, 111–117. [Google Scholar] [CrossRef]
  76. Watson, N.J.; Povey, M.J.W.; Reynolds, G.K.; Xu, B.H.; Ding, Y. Acoustic emission monitoring from a lab scale high shear granulator--a novel approach. Int. J. Pharm. 2014, 465, 262–274. [Google Scholar] [CrossRef]
  77. Hertz, H. Ueber die Berührung fester elastischer Körper. Heinrich Hertz 1882, 1882, 156–171. [Google Scholar] [CrossRef]
  78. Huo, D.; Chen, W.; Sun, Y. Chapter 4—Vibration-Assisted Milling. In Hybrid Machining; Luo, X., Qin, Y., Eds.; Academic Press: Cambridge, MA, USA, 2018; pp. 77–109. ISBN 978-0-12-813059-9. [Google Scholar]
  79. What is Acoustics. Available online: https://acoustics.byu.edu/what-is (accessed on 29 June 2022).
  80. Nsugbe, E.; Starr, A.; Jennions, I.K.; Ruiz-Cárcel, C. Particle size distribution estimation of a mixture of regular and irregular sized particles using acoustic emissions. Procedia Manuf. 2017, 11, 2252–2259. [Google Scholar] [CrossRef]
  81. Hunter, S.C. Energy absorbed by elastic waves during impact. J. Mech. Phys. Solids 1957, 5, 162–171. [Google Scholar] [CrossRef]
  82. Love, A.E.H. Chapter 8. In A Treatise on the Mathematical Theory of Elasticity; Dover: New York, NY, USA, 1944; pp. 184–203. ISBN 978-0-486-60174-8. [Google Scholar]
  83. Johnson, K.L. Contact Mechanics; Cambridge University Press: Cambridge, UK, 1992; ISBN 978-0-521-34796-9. [Google Scholar]
  84. Goldsmith, W. Chapter IV. In Impact: The Theory and Physical Behaviour of Colliding Solids; Dover Publications: Mineola, NY, USA, 2002; pp. 82–90. ISBN 978-0-486-42004-2. [Google Scholar]
  85. McLaskey, G.C.; Glaser, S.D. Hertzian impact: Experimental study of the force pulse and resulting stress waves. J. Acoust. Soc. Am. 2010, 128, 1087–1096. [Google Scholar] [CrossRef] [PubMed]
  86. Milton, G.W.; Willis, J.R. On modifications of Newton’s second law and linear continuum elastodynamics. Proc. R. Soc. Math. Phys. Eng. Sci. 2007, 463, 855–880. [Google Scholar] [CrossRef]
  87. von Niessen, W.; Schirmer, J.; Cederbaum, L.S. Computational methods for the one-particle green’s function. Comput. Phys. Rep. 1984, 1, 57–125. [Google Scholar] [CrossRef]
  88. Weisstein, E.W. Green’s Function. Available online: https://mathworld.wolfram.com/ (accessed on 29 June 2022).
  89. Hsu, N.; Breckenridge, F. Characterization and Calibration of Acoustic Emission Sensors. Mater. Eval. 1981, 39, 60–68. [Google Scholar]
  90. Stockham, T.G.; Cannon, T.M.; Ingebretsen, R.B. Blind deconvolution through digital signal processing. Proc. IEEE 1975, 63, 678–692. [Google Scholar] [CrossRef]
  91. Buttle, D.J.; Scruby, C.B. Characterization of particle impact by quantitative acoustic emission. Wear 1990, 137, 63–90. [Google Scholar] [CrossRef]
  92. Leach, M.F.; Rubin, G.A.; Williams, J.C. Particle size distribution characterization from acoustic emissions. Powder Technol. 1978, 19, 157–167. [Google Scholar] [CrossRef]
  93. Nsugbe, E.; Williams Samuel, O.; Asogbon, M.G.; Li, G. Contrast of multi-resolution analysis approach to transhumeral phantom motion decoding. CAAI Trans. Intell. Technol. 2021, 6, 360–375. [Google Scholar] [CrossRef]
  94. Nsugbe, E.; Starr, A.; Foote, P.; Ruiz-Carcel, C.; Jennions, I. Size differentiation of a continuous stream of particles using acoustic emissions. IOP Conf. Ser. Mater. Sci. Eng. 2016, 161, 012090. [Google Scholar] [CrossRef] [Green Version]
  95. Nsugbe, E.; Obajemu, O.; Samuel, O.W.; Sanusi, I. Enhancing care strategies for preterm pregnancies by using a prediction machine to aid clinical care decisions. Mach. Learn. Appl. 2021, 6, 100110. [Google Scholar] [CrossRef]
  96. Nsugbe, E.; Connelly, S. Multiscale depth of anaesthesia prediction for surgery using frontal cortex electroencephalography. Healthc. Technol. Lett. 2022, 9, 43–53. [Google Scholar] [CrossRef] [PubMed]
  97. The Two-Body Problem. Available online: https://web.physics.ucsb.edu/~fratus/phys103/LN/TBP.pdf (accessed on 11 July 2022).
  98. Nsugbe, E. Particle Size Distribution Estimation of A Heterogeneous Powder Mixture Using Acoustic Emissions. 2020. Available online: https://doi.org/10.13140/RG.2.2.26458.08643 (accessed on 29 June 2022).
  99. Weissman, S.A.; Anderson, N.G. Design of Experiments (DoE) and Process Optimization. A Review of Recent Publications. Org. Process Res. Dev. 2015, 19, 1605–1633. [Google Scholar] [CrossRef]
  100. Yang, R.Y.; Yu, A.B.; McElroy, L.; Bao, J. Numerical simulation of particle dynamics in different flow regimes in a rotating drum. Powder Technol. 2008, 188, 170–177. [Google Scholar] [CrossRef]
  101. Uher, M.; Benes, P. Measurement of Particle Size Distribution by Acoustic Emission Method. In Proceedings of the XX IMEKO World Congress, Busan, Korea, 9–14 September 2012; p. 5. [Google Scholar]
  102. Pecorari, C. Characterizing Particle Flow by Acoustic Emission. J. Nondestruct. Eval. 2013, 32, 104–111. [Google Scholar] [CrossRef]
  103. Sarkar, A.; Wassgren, C.R. Simulation of a continuous granular mixer: Effect of operating conditions on flow and mixing. Chem. Eng. Sci. 2009, 64, 2672–2682. [Google Scholar] [CrossRef]
  104. Physical Acoustics—World Leader in Acoustic Emission Equipment—Innovative AE Systems Since. 1968. Available online: https://www.physicalacoustics.com/ (accessed on 29 June 2022).
  105. Chumbley, A.; Areias, J.; Williams, C.; Khim, J. Linear Time Invariant Systems|Brilliant Math & Science Wiki. Available online: https://brilliant.org/wiki/linear-time-invariant-systems/ (accessed on 29 June 2022).
  106. Zhang, D. Wavelet Transform. In Fundamentals of Image Data Mining: Analysis, Features, Classification and Retrieval; Zhang, D., Ed.; Texts in Computer Science; Springer International Publishing: Cham, Switzerland, 2019; pp. 35–44. ISBN 978-3-030-17989-2. [Google Scholar]
  107. Ren, C.; Wang, J.; Song, D.; Jiang, B.; Liao, Z.; Yang, Y. Determination of particle size distribution by multi-scale analysis of acoustic emission signals in gas-solid fluidized bed. J. Zhejiang Univ.-Sci. A 2011, 12, 260–267. [Google Scholar] [CrossRef]
  108. Edwards, T. Discrete Wavelet Transforms: Theory and Implementation. Undefined 1991, 28–35. [Google Scholar]
  109. Daubechies, I. Ten Lectures on Wavelets; CBMS-NSF regional conference series in applied mathematics; Society for Industrial and Applied Mathematics: Philadelphia, PA, USA, 1992; ISBN 978-0-89871-274-2. [Google Scholar]
  110. Sosulin, I.G. Theory of detection and estimation of stochastic signals. Mosc. Izd. Sov. Radio 1978. [Google Scholar]
  111. Hu, Y.; Wang, L.; Huang, X.; Qian, X.; Gao, L.; Yan, Y. On-line Sizing of Pneumatically Conveyed Particles Through Acoustic Emission Detection and Signal Analysis. IEEE Trans. Instrum. Meas. 2015, 64, 1100–1109. [Google Scholar] [CrossRef]
  112. Halir, R.; Bock, P.J.; Cheben, P.; Ortega-Moñux, A.; Alonso-Ramos, C.; Schmid, J.H.; Lapointe, J.; Xu, D.-X.; Wangüemert-Pérez, J.G.; Molina-Fernández, Í.; et al. Waveguide sub-wavelength structures: A review of principles and applications. Laser Photonics Rev. 2015, 9, 25–49. [Google Scholar] [CrossRef]
  113. Hansuld, E.M.; Briens, L.; Sayani, A.; McCann, J.A.B. The effect of process parameters on audible acoustic emissions from high-shear granulation. Drug Dev. Ind. Pharm. 2013, 39, 331–341. [Google Scholar] [CrossRef] [PubMed]
  114. Monmasson, E.; Cirstea, M.N. FPGA Design Methodology for Industrial Control Systems—A Review. IEEE Trans. Ind. Electron. 2007, 54, 1824–1842. [Google Scholar] [CrossRef]
  115. Barrett, S.F. Arduino Microcontroller Processing for Everyone! Third Edition. Synth. Lect. Digit. Circuits Syst. 2013, 8, 1–513. [Google Scholar] [CrossRef]
  116. Barlow, H.B. Unsupervised Learning. Neural Comput. 1989, 1, 295–311. [Google Scholar] [CrossRef]
  117. Wiener, N. The Human Use of Human Beings: Cybernetics and Society; The Da Capo series in science; Da Capo Press: New York, NY, USA, 1988; ISBN 978-0-306-80320-8. [Google Scholar]
  118. Vermeulen, B.; Kesselhut, J.; Pyka, A.; Saviotti, P.P. The Impact of Automation on Employment: Just the Usual Structural Change? Sustainability 2018, 10, 1661. [Google Scholar] [CrossRef] [Green Version]
  119. Schwab, K. The Fourth Industrial Revolution; First published in Great Britain by Portfolio; Portfolio Penguin: London, UK, 2017; ISBN 978-0-241-30075-6. [Google Scholar]
  120. Ford, M. The Rise Of The Robots: Technology and the Threat of Mass Unemployment; A Oneworld book; Paperback edition; Oneworld: London, UK, 2016; ISBN 978-1-78074-848-1. [Google Scholar]
  121. Vivarelli, M. Innovation, Employment and Skills in Advanced and Developing Countries: A Survey of Economic Literature. J. Econ. Issues 2014, 48, 123–154. [Google Scholar] [CrossRef]
  122. Mokyr, J.; Vickers, C.; Ziebarth, N.L. The History of Technological Anxiety and the Future of Economic Growth: Is This Time Different? J. Econ. Perspect. 2015, 29, 31–50. [Google Scholar] [CrossRef] [Green Version]
  123. Brynjolfsson, E.; McAfee, A. Race against the Machine: How the Digital Revolution is Accelerating Innovation, Driving Productivity, and Irreversibly Transforming Employment and the Economy; Digital Frontier Press: Lexington, MA, USA, 2011; ISBN 978-0-9847251-0-6. [Google Scholar]
  124. Basu, S.; Fernald, J.G.; Kimball, M.S. Are Technology Improvements Contractionary? Am. Econ. Rev. 2006, 96, 1418–1448. [Google Scholar] [CrossRef] [Green Version]
  125. Trehan, B. Productivity shocks and the unemployment rate. Econ. Rev. 2003, 13–27. [Google Scholar]
  126. Snellen, I. Automation policy implementation: Re-engineering from within public administration. In Proceedings of the IFIP TC8 Open Conference on Business Process Re-engineering: Information Systems Opportunities and Challenges; Elsevier Science Inc.: Amsterdam, The Netherlands, 1994; pp. 545–556. [Google Scholar]
  127. Abbott, R.; Bogenschneider, B. Should Robots Pay Taxes: Tax Policy in the Age of Automation. Harv. Law Policy Rev. 2018, 12, 145. [Google Scholar] [CrossRef]
  128. Colombino, U. Is unconditional basic income a viable alternative to other social welfare measures? IZA World Labor 2019. [Google Scholar] [CrossRef]
  129. European Commission; Directorate-General for Employment, Social Affairs and Equal Opportunities; Unit, D.2; Evropska Unija. Towards Common Principles of Flexicurity: More and Better Jobs Through Flexibility and Security; Urad za Uradne Publikacije Evropske Skupnosti: Luxembourg, 2007; p. 45. ISBN 978-92-79-06477-7. [Google Scholar]
  130. Smith, C.L. Control of Batch Processes; Wiley: Hoboken, NJ, USA, 2014; ISBN 978-1-118-91394-9. [Google Scholar]
  131. Schwaninger, M. Organizing for sustainability: A cybernetic concept for sustainable renewal. Kybernetes 2015, 44, 935–954. [Google Scholar] [CrossRef]
Figure 1. Illustration of the KF model given an input x .
Powders 01 00019 g001
Figure 2. Proposed system diagram. * means the inferred variables.
Powders 01 00019 g002
Figure 3. The acoustic spectrum [79].
Powders 01 00019 g003
Figure 4. A flow diagram of the signal processing method for powder mixtures.
Powders 01 00019 g004
Figure 5. Image showing various flow regimes ((a) slumping, (b) slumping-rolling, (c) rolling, (d) cascading, (e) cataracting, (f) centrifuging) [100]. It is hypothesized that the AE sensor would be placed on the structure of the mixer itself.
Powders 01 00019 g005
Figure 6. Image of experimental rig [27].
Powders 01 00019 g006
Figure 7. A microscopic image of the washing powder compound [27].
Powders 01 00019 g007
Figure 8. Microscopic image of the glass beads [27].
Powders 01 00019 g008
Figure 9. Microscopic image of the polyethylene particles [27].
Powders 01 00019 g009
Figure 10. Flow diagram of the experimental pathway.
Powders 01 00019 g010
Figure 11. Resulting regression plot for optimal threshold region for polyethylene material [27].
Powders 01 00019 g011
Figure 12. Resulting regression model from optimal threshold region [27]. It can be noted that each point along the curve was produced with five experimental repetitions, each of which have been averaged out to produce a single point.
Powders 01 00019 g012
Figure 13. Diagram showing the various phases associated with the introduction and adaptation of automation technology.
Powders 01 00019 g013
Table 1. PSD monitoring sensors and their ranges.
InstrumentationPSD Range in MicronsReference
Electrostatics100–1000[47]
Imaging250–1000[27]
Near Infrared37–1000[48]
Focused Beam Reflectance Measurements1–1000[49]
Vibration38–150[50]
Acoustic Emissions63–1200[51]
Sieving and Weighing53–1000[52]
Table 2. Comparison of LSDL/proposed signal processing approach against the related literature.
LSDL/Proposed Signal Processing ApproachRelated LiteratureReference
The LSDL has been shown to be capable of sizing and differentiation of particles down to 53/63 microns.Hu et al.’s estimation model struggled with the sizing of highly fine particles.[111]
The LSDL has been seen to be computationally efficient and is based on a time domain implementation which negates the need for subsequent domain transformation.Bastari et al.’s estimation model comprised a three-stage system identification system which is computationally intensive and solely data driven.[51]
The LSDL is centered around metaheuristics and has also been applied to external cases outside of AE.Ren et al. utilized a physics-based model supported by the AE Energy from a decomposed signal in support from the Wavelet Transform.
Attempts at applying this model have proven to be unsuccessful.
[107]
Publisher’s Note: MDPI stays neutral with regard to jurisdictional claims in published maps and institutional affiliations.

