
Using Chia Powder as a Binder to Obtain Chewable Tablets Containing Quinoa for Dietary Fiber Supplementation

 ,
,  ,
,
Abstract
:1. Introduction
2. Materials and Methods
2.1. Material
2.2. Methods
2.2.1. Washing, Drying, and Grinding of Quinoa
2.2.2. Chia Grinding
2.2.3. Particle Size Analysis
2.2.4. Powder Flow Assessment
2.2.5. True Density
2.3. Design of Experiments
2.4. Mixer Torque Rheometer Equipment
2.5. Granule Production
Granule Characterization
2.6. Production of Chewable Tablets
2.7. Statistical Analysis
3. Results and Discussion
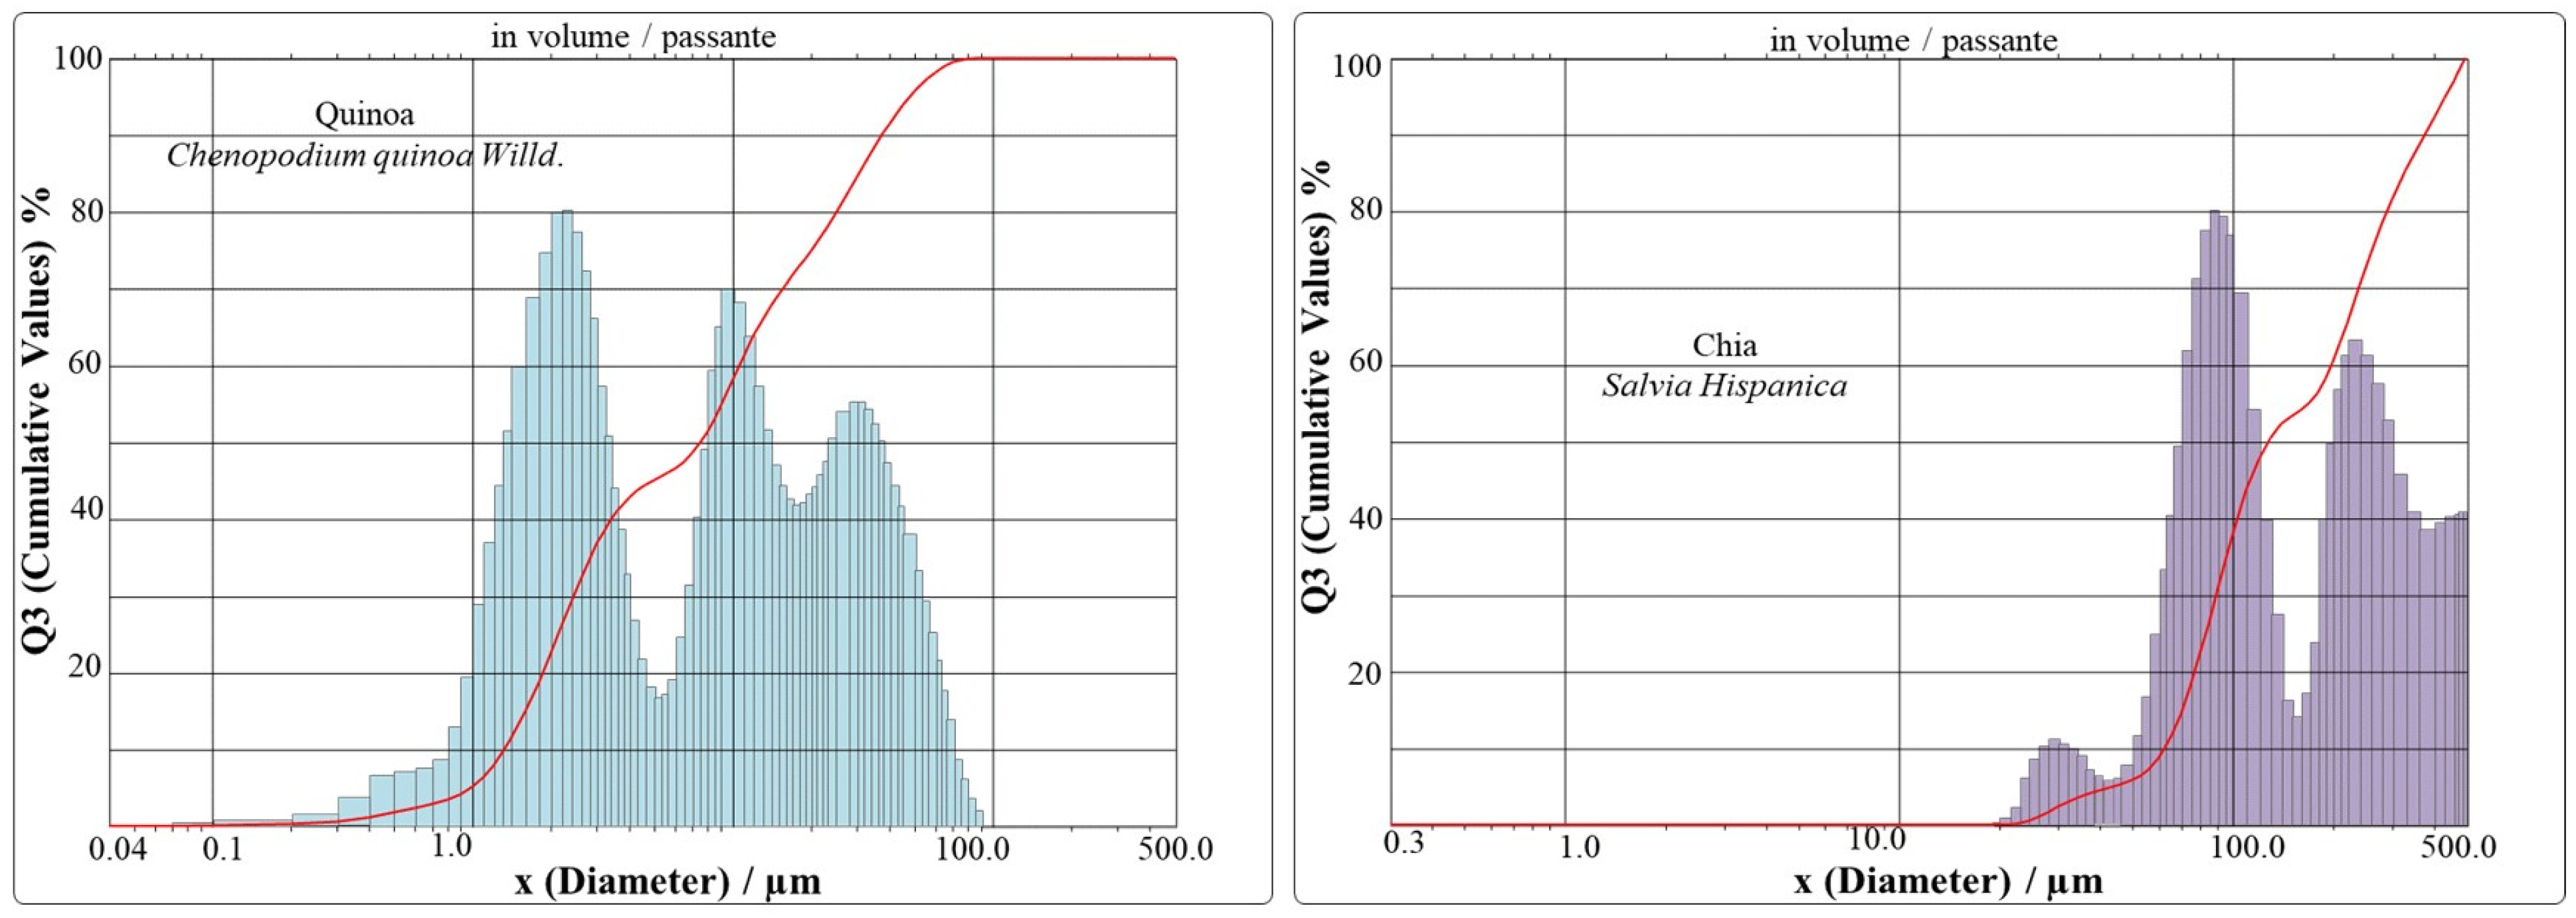
3.1. Particle Sizes of Quinoa and Chia
3.2. Flow Properties and True Density of Powders
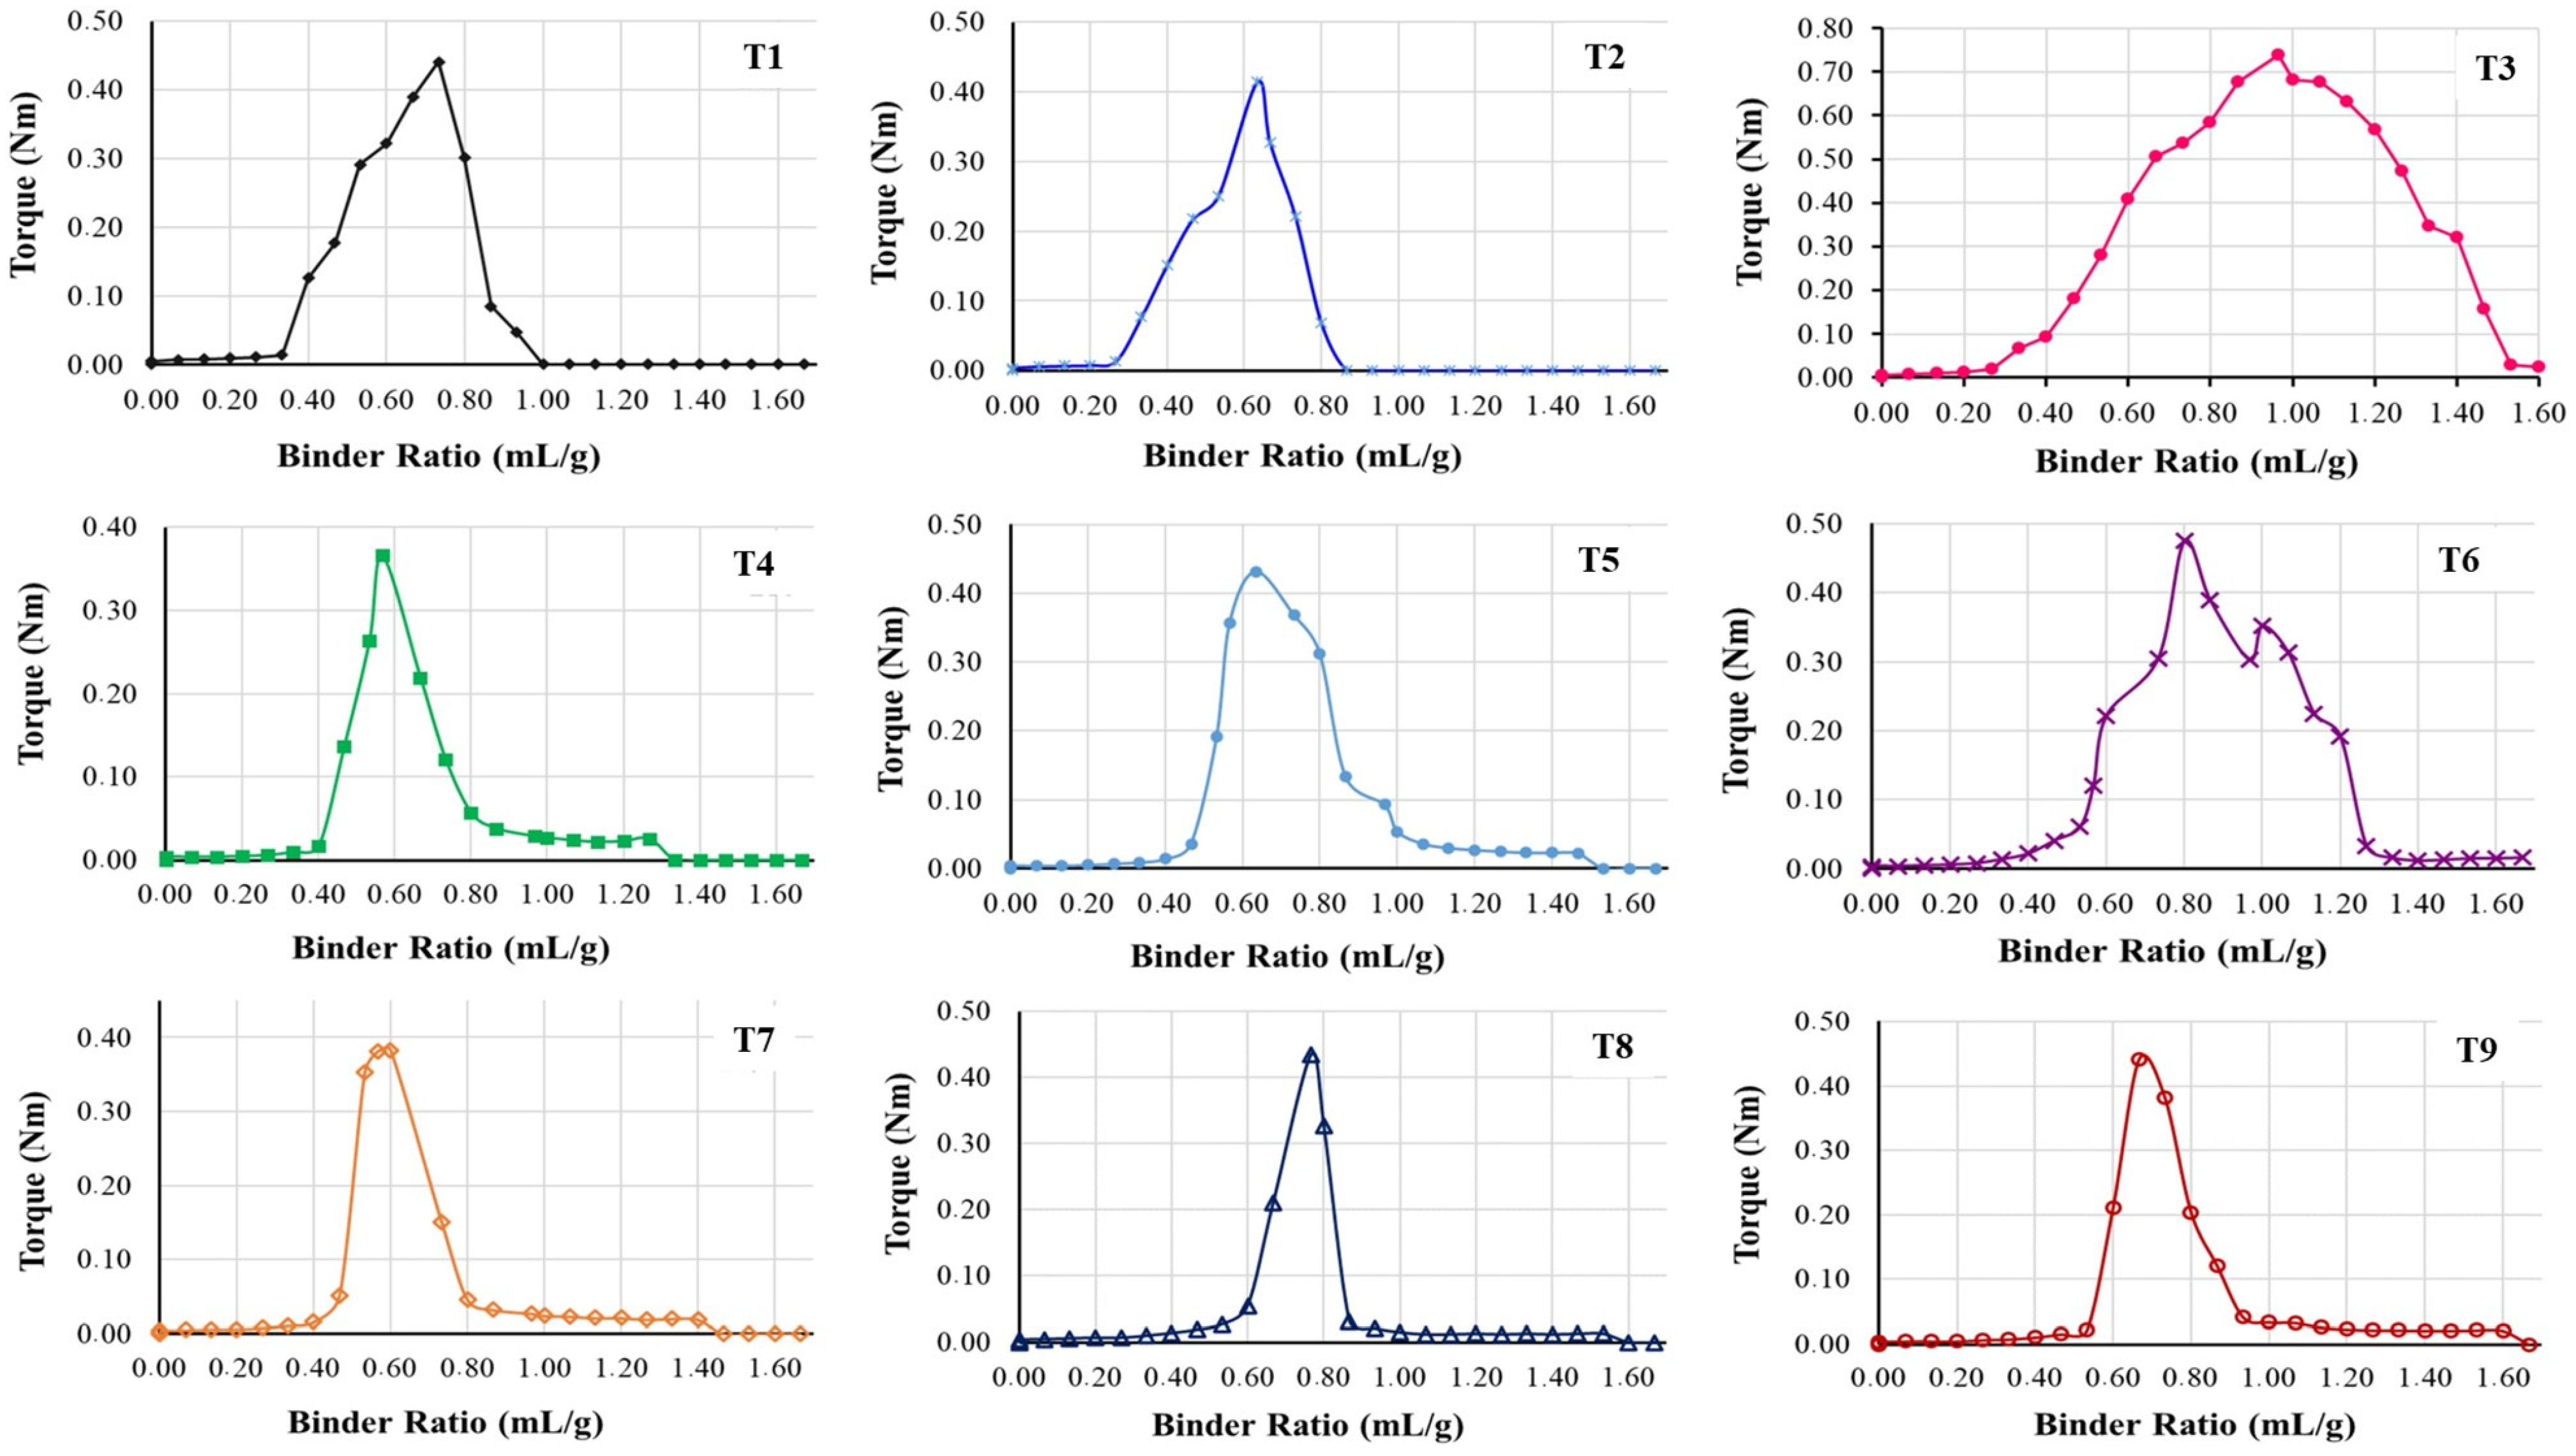
3.3. Mixer Torque Rheometry
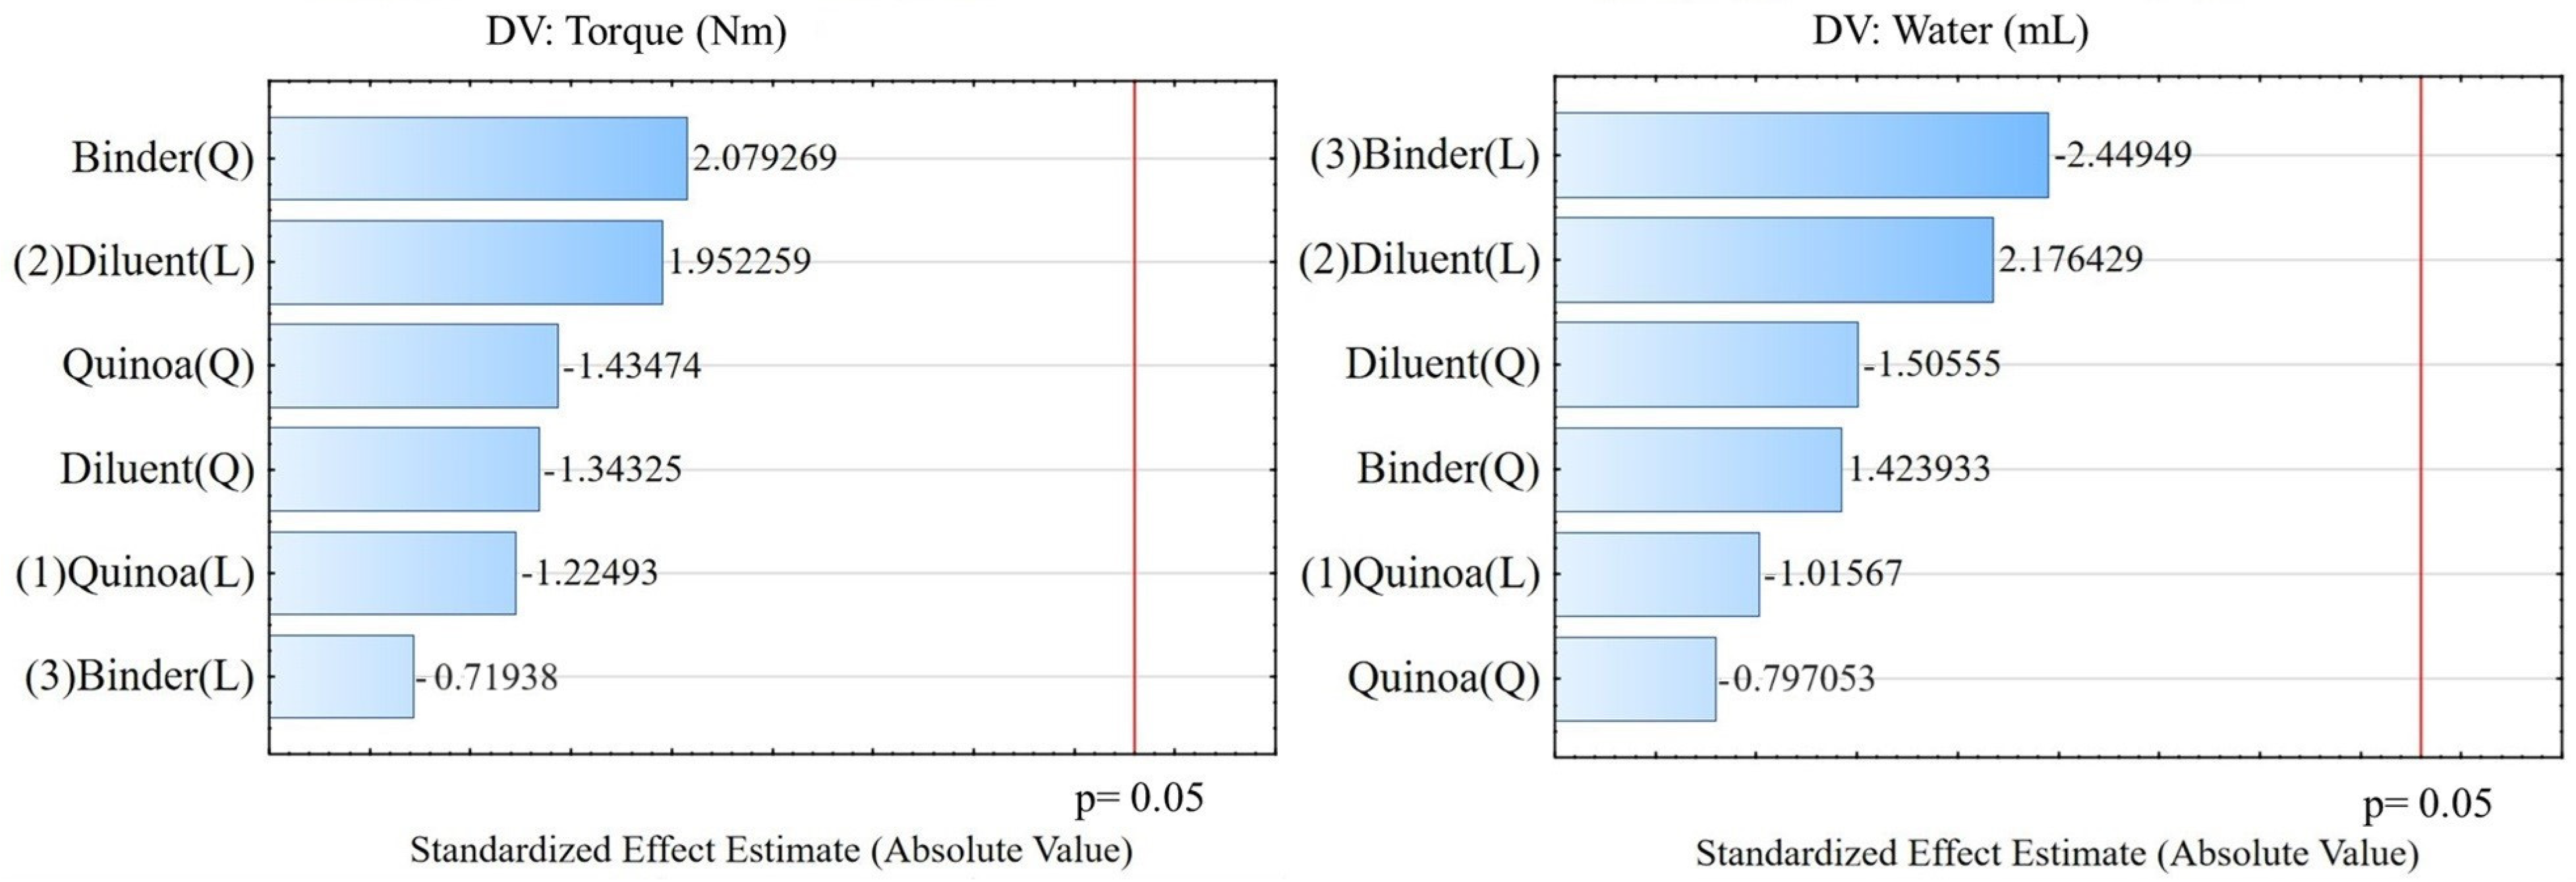
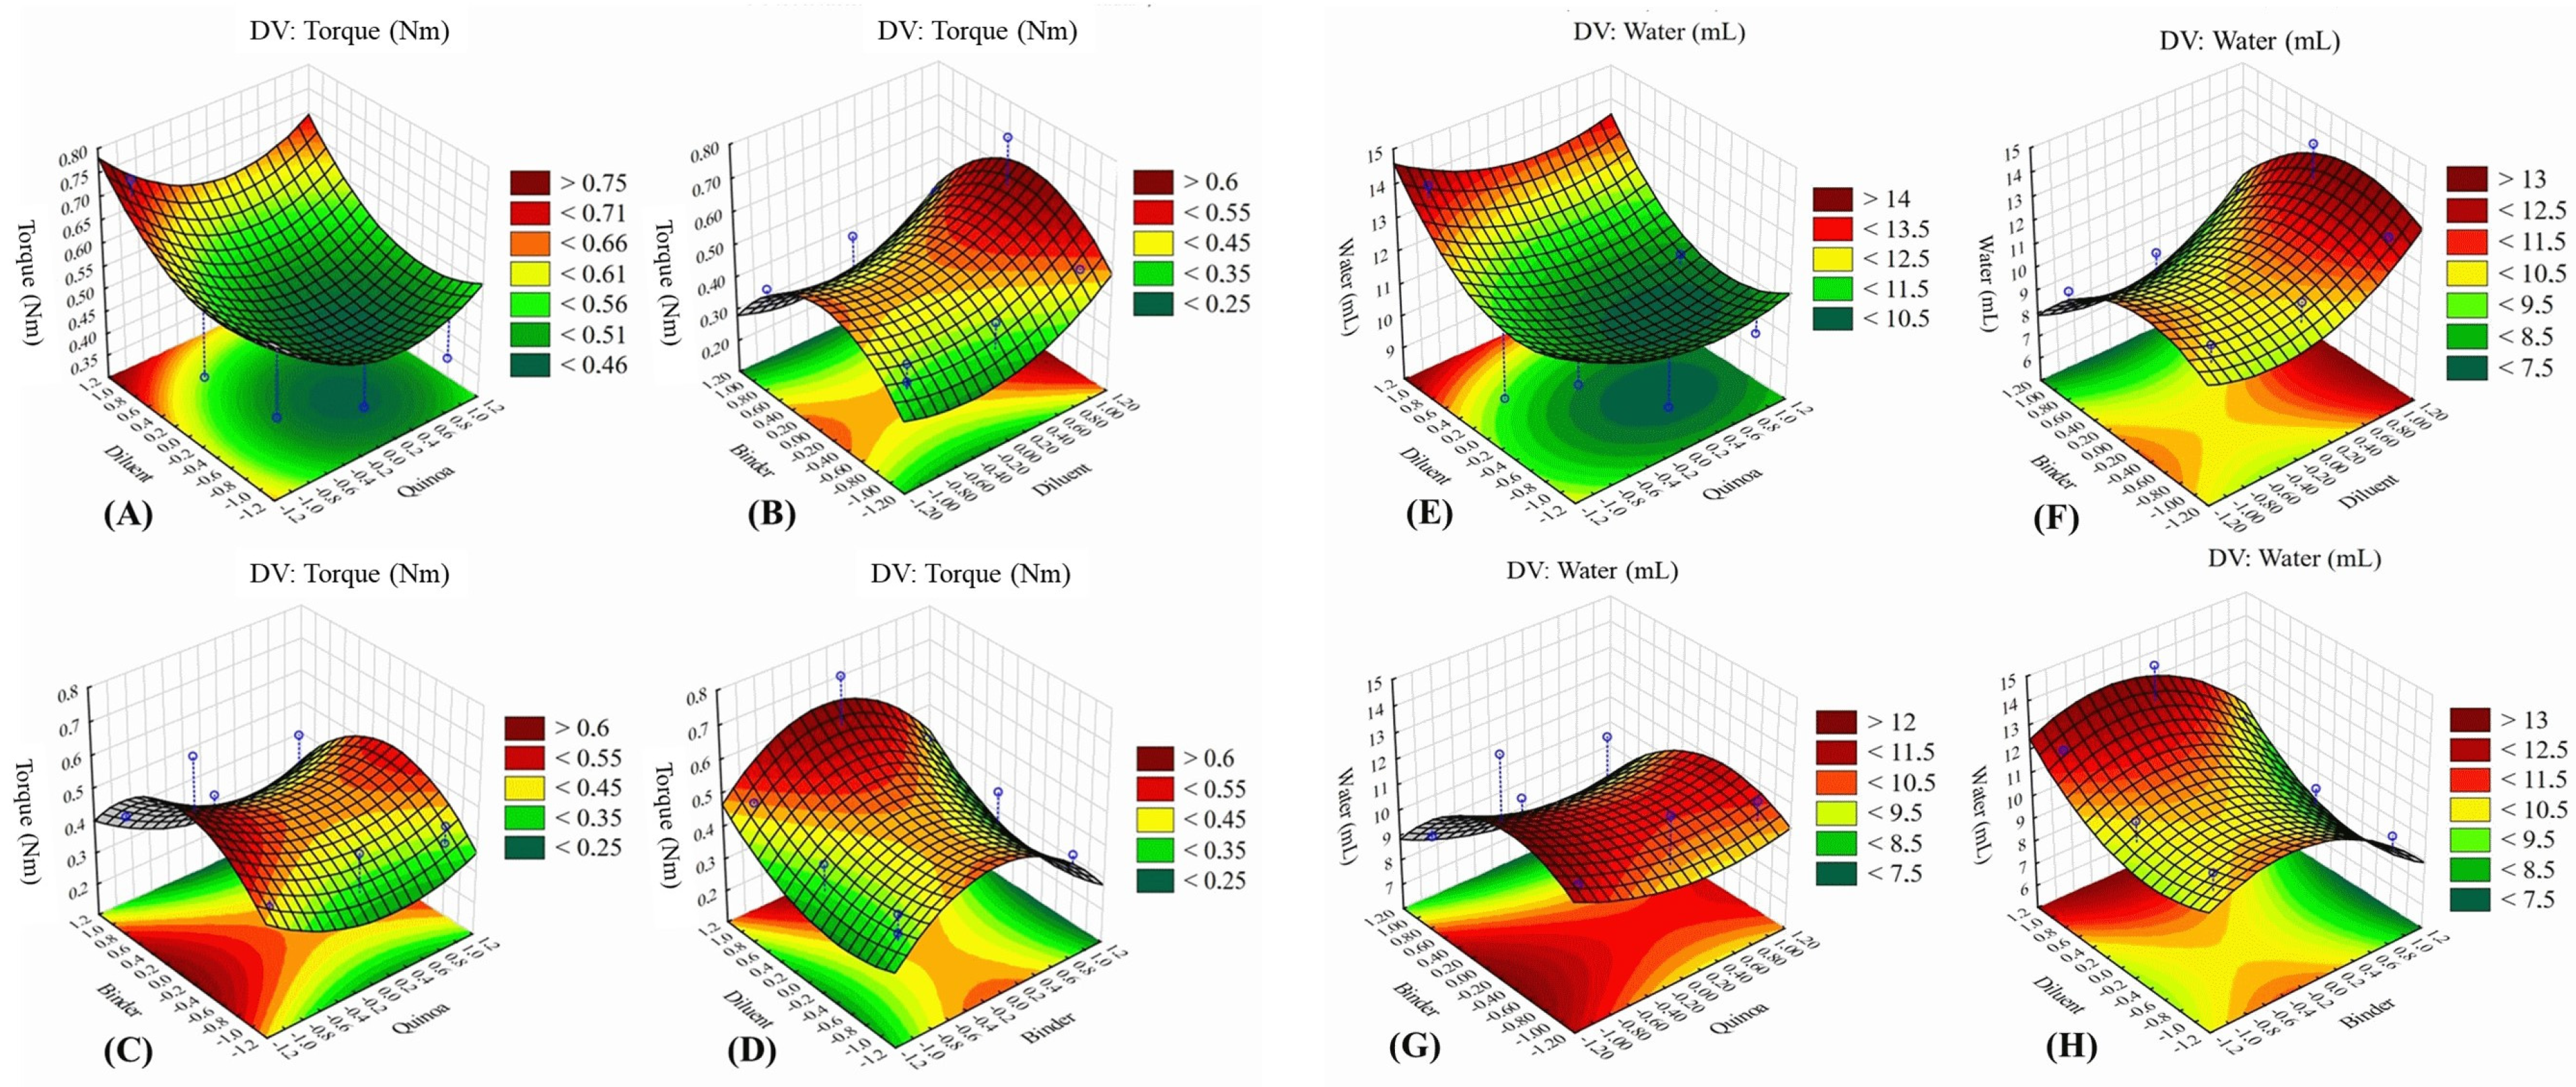
Statistical Analysis
3.4. Granule Production
3.5. Physical Characterization of Granules
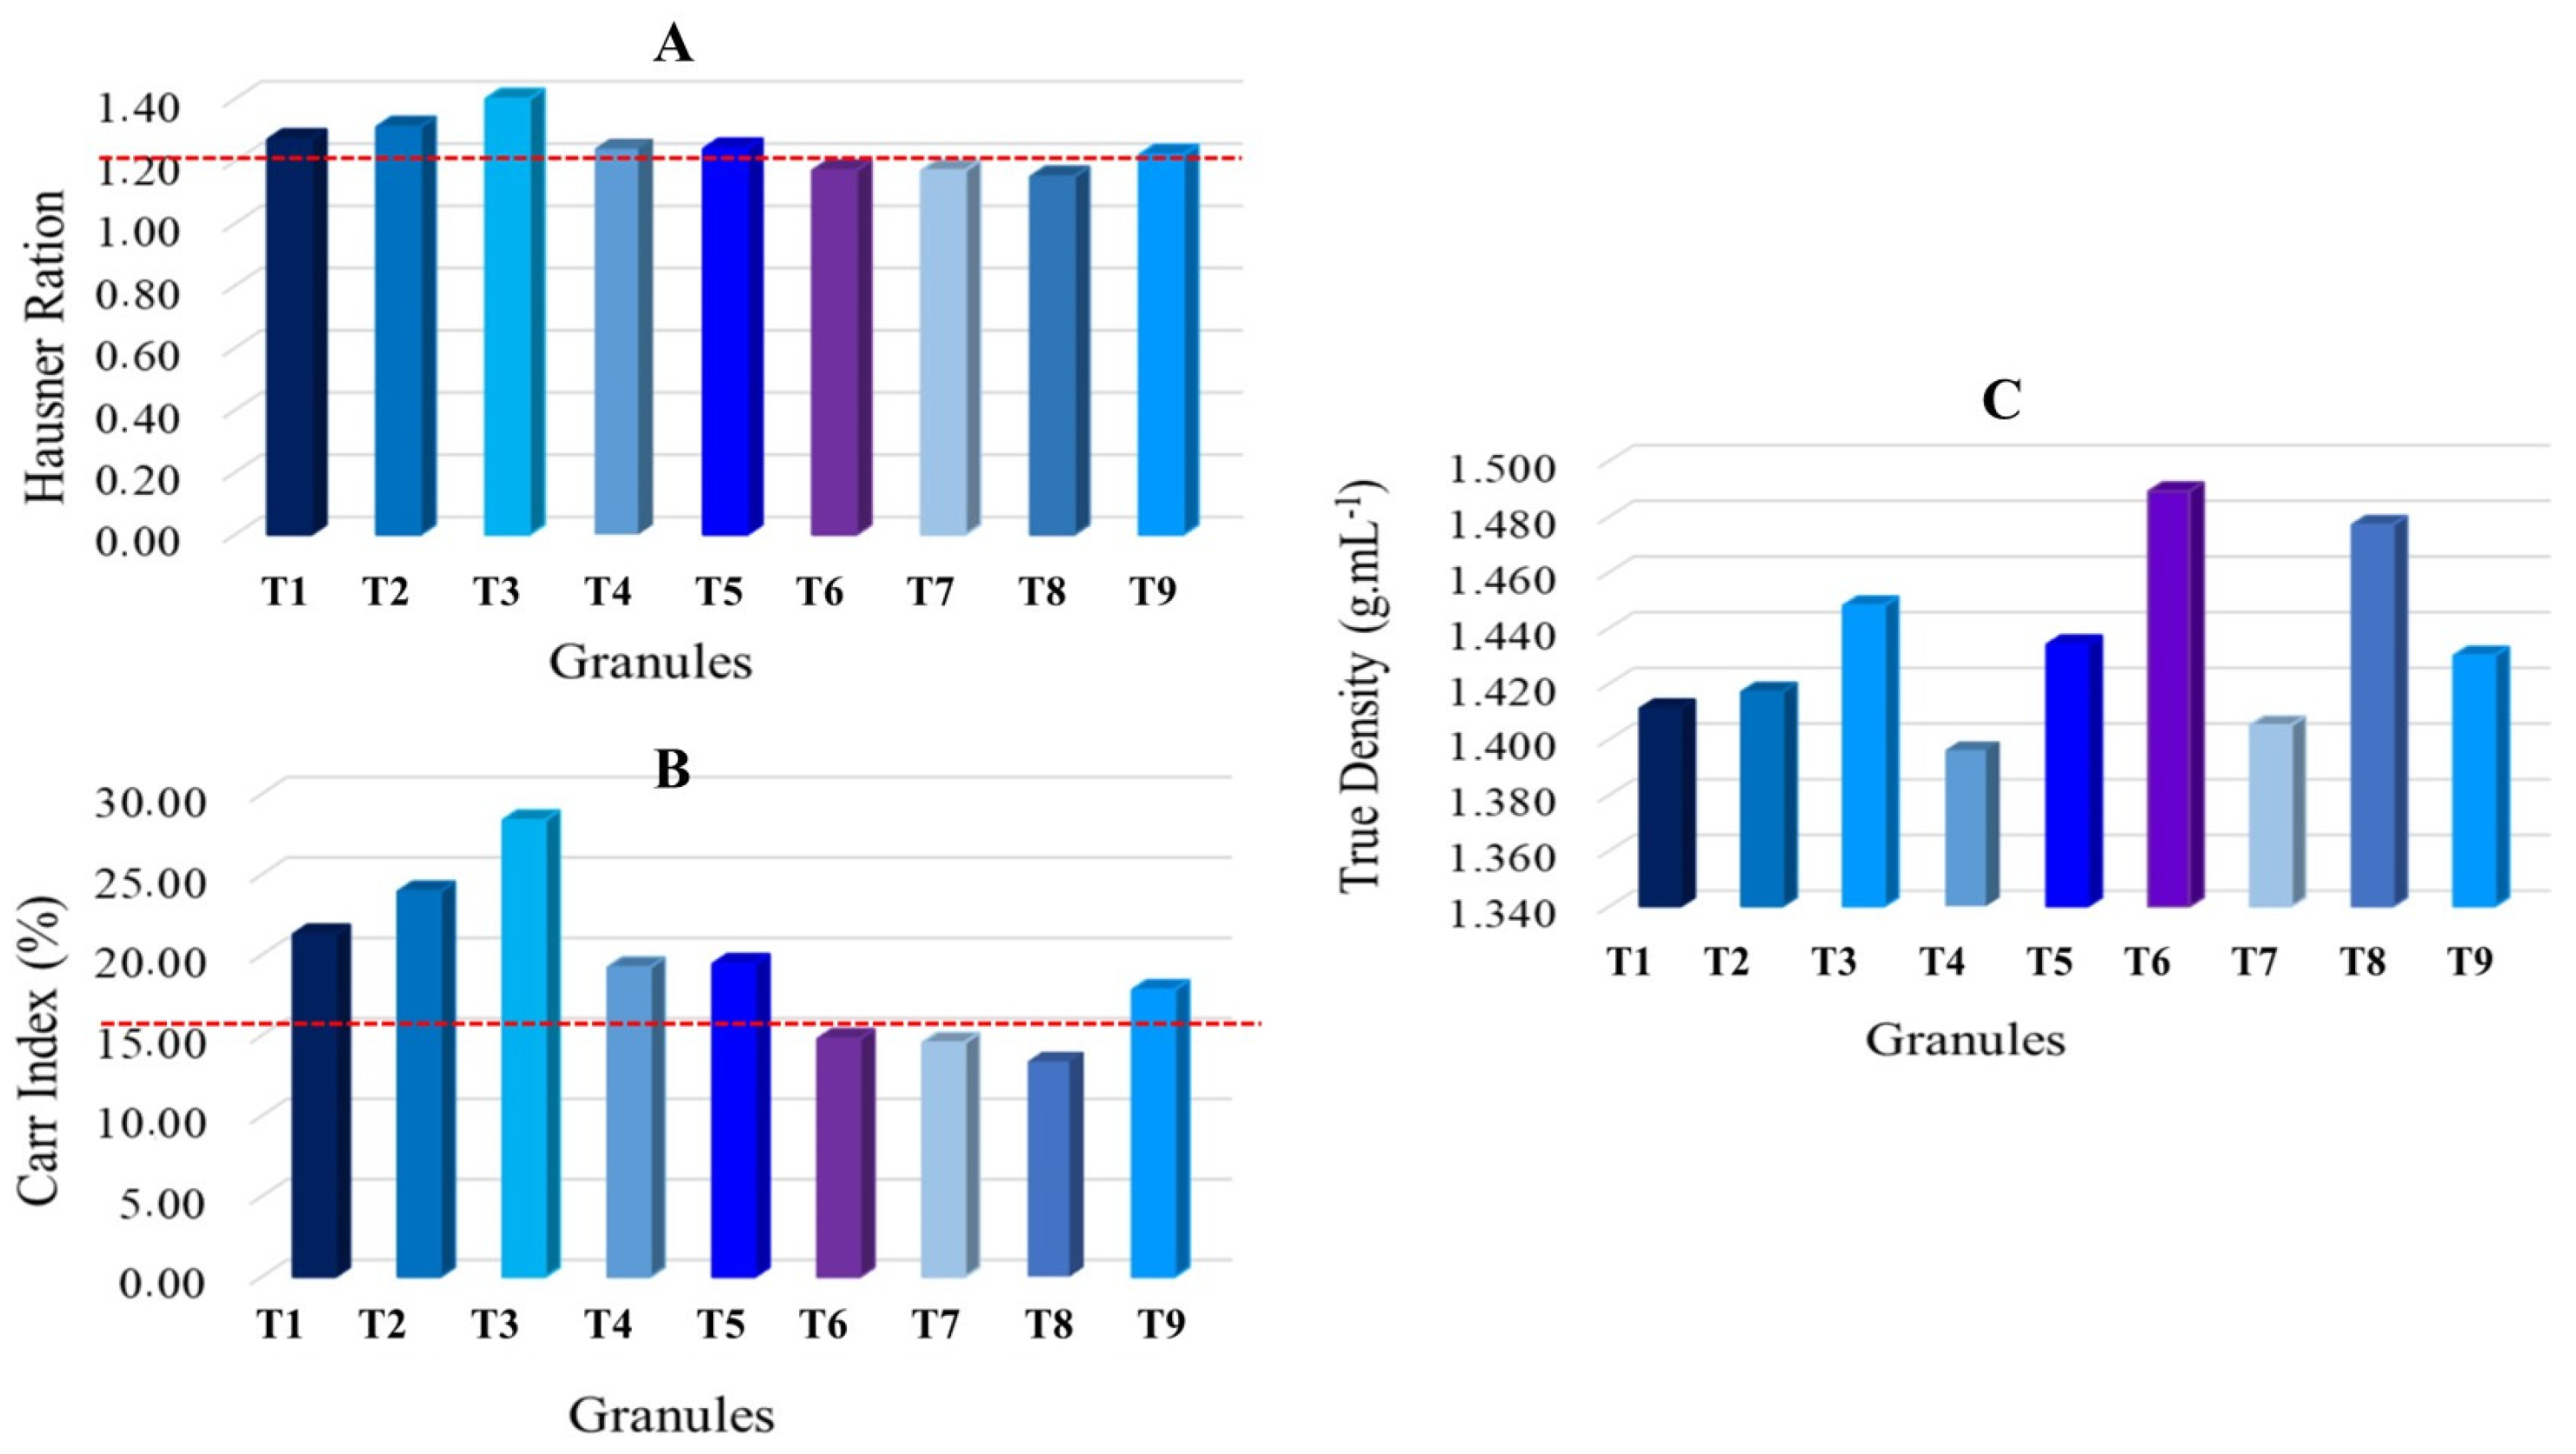
3.5.1. Granule Flow and True Density
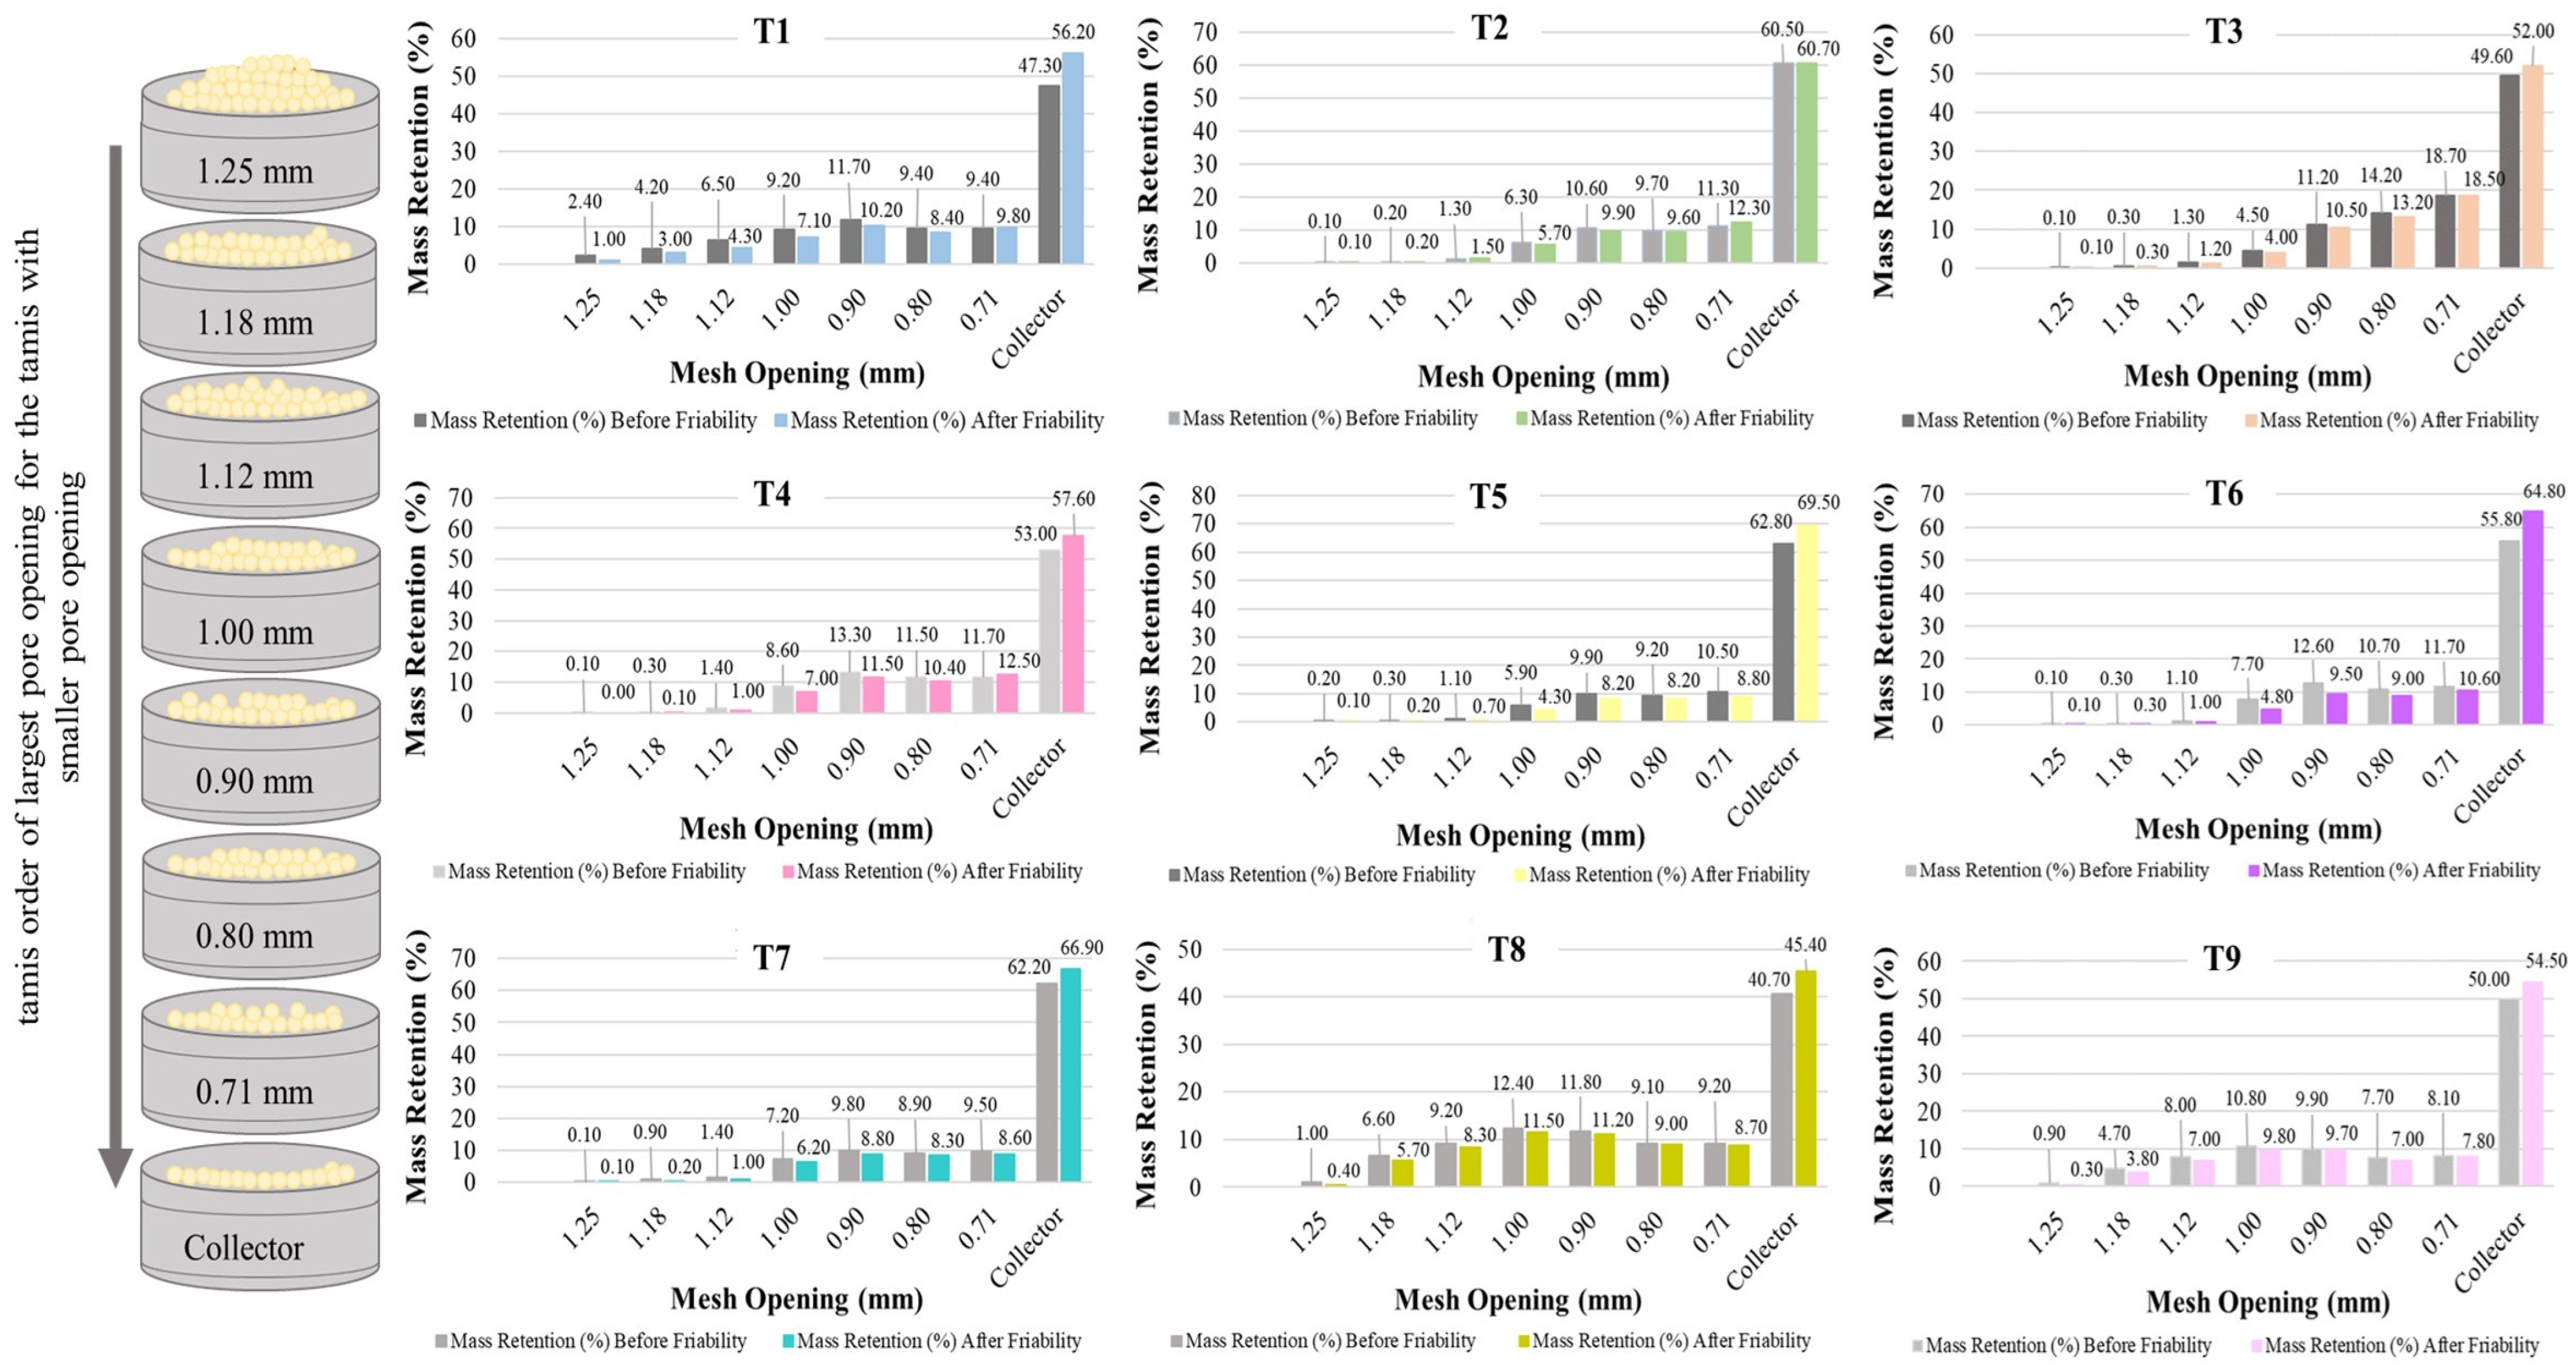
3.5.2. Granulometric Distribution and Granule Strength
3.5.3. Optical Microscopy
3.6. Production of Chewable Tablets
4. Conclusions
Supplementary Materials
Author Contributions
Funding
Institutional Review Board Statement
Informed Consent Statement
Data Availability Statement
Conflicts of Interest
References
- Angeli, V.; Silva, P.M.; Massuela, D.C.; Khan, M.W.; Hamar, A.; Khajehei, F.; Graeff-Hönninger, S.; Piatti, C. Quinoa (Chenopodium quinoa Willd.): An Overview of the Potentials of the “Golden Grain” and Socio-Economic and Environmental Aspects of Its Cultivation and Marketization. Foods 2020, 9, 216. [Google Scholar] [CrossRef] [PubMed]
- Hinojosa, L.; Leguizamo, A.; Carpio, C.; Munoz, D.; Mestanza, C.; Ochoa, J.; Castillo, C.; Murillo, A.; Villacréz, E.; Monar, C.; et al. Quinoa in Ecuador: Recent Advances under Global Expansion. Plants 2021, 10, 298. [Google Scholar] [CrossRef] [PubMed]
- Jancurová, M.; Minarovicová, L.; Dandár, A. Quinoa—A Review. Czech J. Food Sci. 2009, 27, 71–79. [Google Scholar] [CrossRef]
- Alonso-Miravalles, L.; O’Mahony, J.A. Composition, Protein Profile and Rheological Properties of Pseudocereal-Based Protein-Rich Ingredients. Foods 2018, 7, 73. [Google Scholar] [CrossRef] [PubMed]
- Segura-Campos, M.R.; Ciau-Solís, N.; Rosado-Rubio, G.; Chel-Guerrero, L.; Betancur-Ancona, D. Chemical and Functional Properties of Chia Seed (Salvia hispanica L.). Gum. Int. J. Food Sci. 2014, 2014, 241053. [Google Scholar] [CrossRef] [PubMed]
- Da Silva, B.P.; Dias, D.M.; Moreira, M.E.D.; Toledo, R.C.L.; da Matta, S.L.P.; Della Lucia, C.M.; Martino, H.S.D.; Pinheiro-Sant’Ana, H.M. Chia Seed Shows Good Protein Quality, Hypoglycemic Effect and Improves the Lipid Profile and Liver and Intestinal Morphology of Wistar Rats. Plant Foods Hum. Nutr. 2016, 71, 225–230. [Google Scholar] [CrossRef] [PubMed]
- Ding, Y.; Lin, H.W.; Lin, Y.L.; Yang, D.J.; Yu, Y.S.; Chen, J.W.; Wang, S.Y.; Chen, Y.C. Nutritional composition in the chia seed and its processing properties on restructured ham-like products. J. Food Drug Anal. 2018, 26, 124–134. [Google Scholar] [CrossRef]
- Felisberto, M.H.F.; Wahanik, A.L.; Gomes-Ruffi, C.R.; Clerici, M.T.P.S.; Chang, Y.K.; Steel, C.J. Use of chia (Salvia hispanica L.) mucilage gel to reduce fat in pound cakes. LWT Food Sci. Technol. 2015, 63, 1049–1055. [Google Scholar] [CrossRef]
- Barber, T.M.; Kabish, S.; Pfeiffer, A.F.H.; Weickert, M.O. The Health Benefits of Dietary Fibre. Nutrients 2020, 12, 3209. [Google Scholar] [CrossRef] [PubMed]
- Slavin, J. Fiber and Prebiotics: Mechanisms and Health Benefits. Nutrients 2013, 5, 1417–1435. [Google Scholar] [CrossRef]
- Stephen, A.M.; Champ, M.M.; Cloran, S.J.; Fleith, M.; Van Lieshout, L.; Mejborn, H.; Burley, V.J. Dietary fibre in Europe: Current state of knowledge on definitions, sources, recommendations, intakes and relationships to health. Nutr. Res. Rev. 2017, 30, 149–190. [Google Scholar] [CrossRef] [PubMed]
- Hijova, E.; Bertkova, I.; Stofilova, J. Dietary fibre as prebiotics in nutrition. Cent. Eur. J. Public Health 2019, 27, 251–255. [Google Scholar] [CrossRef] [PubMed]
- Weickert, M.O.; Mohlig, M.; Koebnick, C.; Holst, J.J.; Namsolleck, P.; Ristow, M.; Osterhoff, M.; Rochlitz, H.; Rudovich, N.; Spranger, J.; et al. Impact of cereal fibre on glucose-regulating factors. Diabetologia 2005, 48, 2343–2353. [Google Scholar] [CrossRef] [PubMed]
- Gianfredi, V.; Salvatori, T.; Villarini, M.; Moretti, M.; Nucci, D.; Realdon, S. Is dietary fibre truly protective against colon cancer? A systematic review and meta-analysis. Int. J. Food Sci. Nutr. 2018, 69, 904–915. [Google Scholar] [CrossRef] [PubMed]
- Cotovanu, I.; Batariuc, A.; Mironeasa, S. Characterization of Quinoa Seeds Milling Fractions and Their Effect on the Rheological Properties of Wheat Flour Dough. Appl. Sci. 2020, 10, 7225. [Google Scholar] [CrossRef]
- Muñoz-Pabon, K.S.; Roa-Acosta, D.F.; Hoyos-Concha, J.L.; Bravo-Gómez, J.E.; Ortiz-Gómez, V. Quinoa Snack Production at an Industrial Level: Effect of Extrusion and Baking on Digestibility, Bioactive, Rheological, and Physical Properties. Foods 2022, 11, 3383. [Google Scholar] [CrossRef] [PubMed]
- Afzal, I.; Ul Haq, M.Z.; Ahmed, S.; Hirich, A.; Bazile, D. Challenges and Perspectives for Integrating Quinoa into the Agri-Food System. Plants 2023, 12, 3361. [Google Scholar] [CrossRef] [PubMed]
- Graf, B.L.; Rojas-Silva, P.; Rojo, L.E.; Delatorre-Herrera, J.; Baldeon, M.E.; Raskin, I. Innovations in Health Value and Functional Food Development of Quinoa (Chenopodium quinoa Willd.). Compr. Rev. Food Sci. Food Saf. 2015, 14, 431–445. [Google Scholar] [CrossRef] [PubMed]
- Vera-Cespedes, N.; Muñoz, L.A.; Rincón, M.Á.; Haros, C.M. Physico-Chemical and Nutritional Properties of Chia Seeds from Latin American Countries. Foods 2023, 12, 3013. [Google Scholar] [CrossRef]
- Maradini Filho, A.M.; Pirozi, M.R.; Borges, J.T.d.S.; Sant’Ana, H.M.P.; Chaves, J.B.P.; Coimbra, J.S.D.R. Quinoa: Nutritional, functional, and antinutritional aspects. Crit. Rev. Food Sci. Nutr. 2017, 57, 1618–1630. [Google Scholar] [CrossRef]
- Fernandes, S.S.; Salas-Mellado, M.d.l.M. Addition of chia seed mucilage for reduction of fat content in bread and cakes. Food Chem. 2017, 227, 237–244. [Google Scholar] [CrossRef]
- Goyat, J.; Passi, S.J.; Suri, S.; Dutta, H. Development of Chia (Salvia Hispanica, L.) and Quinoa (Chenopodium Quinoa, L.) Seed Flour Substituted Cookies—Physicochemical, Nutritional and Storage Studies. Curr. Res. Nutr. Food. Sci. 2018, 6, 757–769. [Google Scholar] [CrossRef]
- Suresh, P.; Sreedhar, I.; Vaidhiswaran, R.; Venugopal, A. A comprehensive review on process and engineering aspects of pharmaceutical wet granulation. Chem. Eng. J. 2017, 328, 785–815. [Google Scholar] [CrossRef]
- Da Silva, R.P.; Fante, A.S.; Silva, A.R.P.; Pereira, F.L.S.; Gutierrez, Y.L.R.; Ferraz, H.G. Wet powder rheometry: The best conditions for wet granulation using diluent and binder in calcium carbonate samples. Powder Technol. 2022, 397, 117087. [Google Scholar] [CrossRef]
- Otsuka, T.; Kuroiwa, Y.; Sato, K.; Yamashita, K.; Hakomori, T.; Kimura, S.; Iwao, Y.; Itai, S. Use of Mixer Torque Rheometer to Clarify the Relationship between the Kneading States of Wet Mass and the Dissolution of Final Product in High Shear Granulation. Chem. Pharm. Bull. 2018, 66, 554–561. [Google Scholar] [CrossRef]
- Ibrahim, M.A.; Zayed, G.M.; Alsharif, F.M.; Abdelhafez, W.A. Utilizing mixer torque rheometer in the prediction of optimal wet massing parameters for pellet formulation by extrusion/spheronization. Saudi Pharm. J. 2019, 27, 182–190. [Google Scholar] [CrossRef] [PubMed]
- Zhang, S.Y.; Lamberto, D.J. Development of New Laboratory Tools for Assessment of Granulation Behavior During Bulk Active Pharmaceutical Ingredient Drying. J. Pharm. Sci. 2014, 103, 152–160. [Google Scholar] [CrossRef]
- Kuhs, M.; Moore, J.; Kollamaram, G.; Walker, G.; Croker, D. Predicting optimal wet granulation parameters for extrusion-spheronisation of pharmaceutical pellets using a mixer torque rheometer. Int. J. Pharm. 2017, 517, 19–24. [Google Scholar] [CrossRef]
- Di Stefano, C.; Ferro, V.; Mirabile, S. Comparison between grain-size analyses using laser diffraction and sedimentation methods. Biosyst. Eng. 2010, 106, 205–215. [Google Scholar] [CrossRef]
- Da Silva, R.P.; Kawai, G.S.D.; Andrade, F.R.D.D.; Bezzon, V.D.N.; Ferraz, H.G. Characterisation and traceability of calcium carbonate from the seaweed Lithothamnium calcareum. Solids 2021, 2, 192–211. [Google Scholar] [CrossRef]
- Belem, B.R.; Ferraz, H.G. Rheological profile in mixer torque rheometer of samples containing furazolidone and different binders. Chem. Eng. Res. Des. 2020, 160, 533–539. [Google Scholar] [CrossRef]
- Issa, M.G.; Pessole, L.; Takahashi, A.I.; Andreo, N.; Ferraz, H.C. Physicochemical and dissolution profile characterization of pellets containing different binders obtained by the extrusion-spheronization process. Braz. J. Pharm. Sci. 2012, 48, 379–388. [Google Scholar] [CrossRef]
- United States Pharmacopeia Convention. The United States Pharmacopeia: The National Formulary, 1st ed.; United States Pharmacopeial Convention: Rockville, Maryland, 2022. [Google Scholar]
- Horiba Scientific. A Guidebook to Particle Size Analysis; Horiba Instruments: Irvine, CA, USA, 2017. [Google Scholar]
- Wünsch, I.; Finke, J.H.; John, E.; Juhnke, M.; Kwade, A. The influence of particle size on the application of compression and compaction models for tableting. Int. J. Pharm. 2021, 599, 120424. [Google Scholar] [CrossRef] [PubMed]
- Leung, L.Y.; Mao, C.; Srivastava, I.; Du, P.; Yang, C.Y. Flow Function of Pharmaceutical Powders Is Predominantly Governed by Cohesion, Not by Friction Coefficients. J. Pharm. Sci. 2017, 106, 1865–1873. [Google Scholar] [CrossRef] [PubMed]
- Hiremath, P.; Nuguru, K.; Agrahari, V.; Narang, A.S.; Badawy, S.I.F. Chapter 8—Material Attributes and Their Impact on Wet Granulation Process Performance; Academic Press: Cambridge, MA, USA, 2019; pp. 263–315. [Google Scholar]
- Tank, D.; Karan, K.; Gajera, B.; Dave, R.H. Investigate the effect of solvents on wet granulation of microcrystalline cellulose using hydroxypropyl methylcellulose as a binder and evaluation of rheological and thermal characteristics of granules. Saudi Pharm. J. 2018, 26, 593–602. [Google Scholar] [CrossRef] [PubMed]
- Jones-Salkey, O.; Chu, Z.; Ingram, A.; Windows-Yule, C.R.K. Reviewing the Impact of Powder Cohesion on Continuous Direct Compression (CDC) Performance. Pharmaceutics 2023, 15, 1587. [Google Scholar] [CrossRef]
- Chattoraj, S.; Sun, C.C. Crystal and Particle Engineering Strategies for Improving Powder Compression and Flow Properties to Enable Continuous Tablet Manufacturing by Direct Compression. J. Pharm. Sci. 2018, 107, 968–974. [Google Scholar] [CrossRef]
- Tadauchi, T.; Yamada, D.; Koide, Y.; Yamada, M.; Shimada, Y.; Yamazoe, E.; Ito, T.; Tahara, K. Improving the Powder Properties of an Active Pharmaceutical Ingredient (Ethenzamide) with a Silica Nanoparticle Coating for Direct Compaction into Tablets. Powders 2022, 1, 231–242. [Google Scholar] [CrossRef]
- Schönfeld, B.V.; Westedt, U.; Wagner, K.G. Compression Modulus and Apparent Density of Polymeric Excipients during Compression-Impact on Tabletability. Pharmaceutics 2022, 14, 913. [Google Scholar] [CrossRef]
- Morin, G.; Briens, L. The Effect of Lubricants on Powder Flowability for Pharmaceutical Application. AAPS PharmSciTech 2013, 14, 1158–1168. [Google Scholar] [CrossRef]
- Luo, Y.; Ni, F.T.; Guo, M.Z.; Liu, J.; Chen, H.; Zhang, S.T.; Li, Y.L.; Chen, G.; Wang, G. Quinoa starch microspheres for drug delivery: Preparation and their characteristics. Food Sci. Technol. 2022, 42, e126421. [Google Scholar] [CrossRef]


| Variable | Level | ||
|---|---|---|---|
| −1 | 0 | 1 | |
| Quinoa | 20 | 40 | 60 |
| Microcrystalline Cellulose PH101 | 10 | 20 | 30 |
| Chia | 2 | 15 | 20 |
| Test | Quinoa | Microcrystalline Cellulose PH101 | Chia | ||||||
|---|---|---|---|---|---|---|---|---|---|
| Part | Grams | % | Part | Grams | % | Part | Grams | % | |
| 9 | 60 | 8.18 | 54.55 | 30 | 4.09 | 27.27 | 20 | 2.73 | 18.18 |
| 3 | 20 | 4.62 | 30.77 | 30 | 6.92 | 46.15 | 15 | 3.46 | 23.08 |
| 8 | 60 | 10.98 | 73.17 | 20 | 3.66 | 24.39 | 2 | 0.37 | 2.44 |
| 6 | 40 | 8.33 | 55.55 | 30 | 6.25 | 41.67 | 2 | 0.42 | 2.78 |
| 5 | 40 | 8.00 | 53.33 | 20 | 4.00 | 26.67 | 15 | 3.00 | 20.00 |
| 4 | 40 | 8.57 | 57.14 | 10 | 2.14 | 14.29 | 20 | 4.29 | 28.57 |
| 2 | 20 | 5.00 | 33.33 | 20 | 5.00 | 33.33 | 20 | 5.00 | 33.33 |
| 1 | 20 | 9.38 | 62.50 | 10 | 4.69 | 31.25 | 2 | 0.94 | 6.25 |
| 7 | 60 | 10.59 | 70.59 | 10 | 1.76 | 11.76 | 15 | 2.65 | 17.65 |
| Parameter | Quinoa Powder | Chia Powder |
|---|---|---|
| d10 | 1.31 ± 0.01 | 66.84 ± 2.15 |
| d50 | 7.09 ± 0.30 | 135.30 ± 3.47 |
| d90 | 37.60 ± 0.19 | 377.38 ± 5.52 |
| Average | 13.50 ± 0.07 | 186.50 ± 3.66 |
| Span | 5.12 | 2.29 |
| Parameters | Quinoa Powder | Chia Powder |
|---|---|---|
| Apparent density | 0.50 ± 0.05 | 0.44 ± 0.01 |
| Compressed density | 0.82 ± 0.01 | 0.59 ± 0.01 |
| Carr Index | 39.02 ± 0.01 | 25.42 ± 0.02 |
| Hausner ratio | 1.64 ± 0.11 | 1.34 ± 0.01 |
| True density | 1.519 ± 0.001 | 1.330 ± 0.010 |
| Test | Average Torque (Nm) | Average Binder Ratio (mg/mL) | Average Water Volume (mL) |
|---|---|---|---|
| T1 | 0.440 ± 0.051 | 0.733 ± 0.200 | 11.00 |
| T2 | 0.415 ± 0.036 | 0.634 ± 0.034 | 9.00 |
| T3 | 0.739 ± 0.013 | 0.967 ± 0.034 | 14.00 |
| T4 | 0.366 ± 0.006 | 0.567 ± 0.034 | 9.00 |
| T5 | 0.431 ± 0.005 | 0.634 ± 0.034 | 10.00 |
| T6 | 0.475 ± 0.087 | 0.800 ± 0.067 | 12.00 |
| T7 | 0.383 ± 0.025 | 0.600 ± 0.067 | 10.00 |
| T8 | 0.435 ± 0.060 | 0.767 ± 0.167 | 11.00 |
| T9 | 0.441 ± 0.017 | 0.667 ± 0.067 | 10.00 |
| Quinoa Grains | Grains Processing | Formulations Mass | Process | |
|---|---|---|---|---|
| Washing quinoa | Ground quinoa | Ground quinoa | 1. Powder mixing | |
| Drying quinoa | Ground chia | T1–T9 | Ground chia | 2. Wet granulation and |
| MCC PH101 | 3. Drying of granules | |||
| Water | 4. Calibrated granules | |||
| Granules | Mass Retention before Friability Test (%) | Mass Retention after Friability Test (%) | Difference in Mass Retention (%) |
|---|---|---|---|
| T1 | 41.00 | 33.00 | 8.00 |
| T2 | 28.10 | 26.90 | 1.20 |
| T3 | 31.50 | 29.20 | 2.30 |
| T4 | 35.10 | 30.00 | 5.10 |
| T5 | 26.40 | 21.60 | 4.80 |
| T6 | 32.40 | 24.60 | 7.80 |
| T7 | 28.20 | 24.50 | 3.70 |
| T8 | 48.10 | 45.70 | 3.40 |
| T9 | 40.59 | 37.30 | 3.29 |
Disclaimer/Publisher’s Note: The statements, opinions and data contained in all publications are solely those of the individual author(s) and contributor(s) and not of MDPI and/or the editor(s). MDPI and/or the editor(s) disclaim responsibility for any injury to people or property resulting from any ideas, methods, instructions or products referred to in the content. |
© 2024 by the authors. Licensee MDPI, Basel, Switzerland. This article is an open access article distributed under the terms and conditions of the Creative Commons Attribution (CC BY) license (https://creativecommons.org/licenses/by/4.0/).
Share and Cite
da Silva, R.P.; Reyes, F.J.V.; Daniel, J.S.P.; da Silva Pestana, J.E.; de Almeida Pires, S.; Ferraz, H.G. Using Chia Powder as a Binder to Obtain Chewable Tablets Containing Quinoa for Dietary Fiber Supplementation. Powders 2024, 3, 202-216. https://doi.org/10.3390/powders3020013
da Silva RP, Reyes FJV, Daniel JSP, da Silva Pestana JE, de Almeida Pires S, Ferraz HG. Using Chia Powder as a Binder to Obtain Chewable Tablets Containing Quinoa for Dietary Fiber Supplementation. Powders. 2024; 3(2):202-216. https://doi.org/10.3390/powders3020013
Chicago/Turabian Styleda Silva, Rosana Pereira, Fanny Judhit Vereau Reyes, Josiane Souza Pereira Daniel, Julia Estevam da Silva Pestana, Samara de Almeida Pires, and Humberto Gomes Ferraz. 2024. "Using Chia Powder as a Binder to Obtain Chewable Tablets Containing Quinoa for Dietary Fiber Supplementation" Powders 3, no. 2: 202-216. https://doi.org/10.3390/powders3020013