Article

The Crystal Structure of Thermal Green Protein Q66E (TGP-E) and Yellow Thermostable Protein (YTP-E) E148D

by
Matthew R. Anderson
,
Caitlin M. Padgett
,
Victoria O. Ogbeifun
and
Natasha M. DeVore
*
Department of Chemistry and Biochemistry, Missouri State University, Springfield, MO 65897, USA
*
Author to whom correspondence should be addressed.
Current address: Bayer Crop Science, 700 Chesterfield Pkwy W, MO 63017, USA.
Current address: Department of Chemistry and Biochemistry, Florida State University, Tallahassee, FL 32304, USA.
SynBio 2024, 2(3), 298-310; https://doi.org/10.3390/synbio2030018
Submission received: 17 May 2024 / Revised: 8 August 2024 / Accepted: 19 August 2024 / Published: 23 August 2024

Abstract

:
Thermal green protein Q66E (TGP-E) has previously shown increased thermal stability compared to thermal green protein (TGP), a thermal stable fluorescent protein produced through consensus and surface protein engineering. In this paper, we describe the protein crystal structure of TGP-E to 2.0 Å. This structure reveals alterations in the hydrogen bond network near the chromophore that may result in the observed increase in thermal stability. We compare the very stable TGP-E protein to the structure of a yellow mutant version of this protein YTP-E E148D. The structure of this mutant protein reveals the rationale for the observed low quantum yield and directions for future protein engineering efforts.

Graphical Abstract

1. Introduction

Fluorescent proteins are standard imaging tools utilized in cell biology. A fluorescent protein’s ability to self-assemble with molecular oxygen as its only requirement has enabled their use in labelling specific proteins within organelles, investigating protein interactions, and unique sensors of intracellular conditions [1,2,3,4]. Despite their widespread use, there are limitations depending on the specific environment of particular organelles including the eukaryotic secretory pathway and lysosome, or assays that require high temperature or potentially denaturing conditions [5]. Initially, most fluorescent proteins were derived from green fluorescent protein (GFP), but in the past 15 years, fluorescent proteins derived from other organisms or developed synthetically have been used to overcome some of the shortcomings of proteins obtained directly from GFP [6,7,8,9]. Thermal green protein (TGP) was developed at Los Alamos National lab through the protein engineering of a consensus-engineered CGP (consensus green protein) followed by targeted surface engineering to maintain high thermal stability and low aggregation [10,11,12]. TGP has a low sequence identity to GFP at 33% and is closest in identity to native green fluorescent protein Azami-Green (mAG) [13]. Like mAG, TGP has a chromophore composed of three amino acid residues, Gln66, Gly67, and Tyr68. Similar to the GFP proteins, the chromophore of TGP forms during protein folding through an intermolecular cyclization reaction followed by dehydration and oxidation by molecular oxygen [4]. TGP has been used to tag antibodies allowing for a one-step detection of antigen binding and also as an affinity tag for membrane proteins for assay by fluorescence-detection size exclusion chromatography (FSEC)-based thermostability assays [14,15]. Both applications utilized TGP’s superior thermal and chemo stability.
While developing a yellow version of TGP, presented in an earlier publication, we determined that mutation at the chromophore residue Q66E improved the chemical and thermal stability properties of TGP Q66E (TGP-E) compared to TGP [16]. The mutation at this site in the chromophore was based on the significance of the equivalent S65T residue mutation in GFP, which was one of the earliest mutations found to improve the excitation characteristics of GFP [4,17]. Additionally, mutation of the equivalent site in the monomeric red fluorescent protein (mRFP1) led to significant spectral property changes [18]. However, the rationale for a single mutation within the chromophore of glutamine to glutamate in improving thermal stability was not immediately obvious. To understand the rationale for thermal and chemical improvement, a crystal structure of TGP-E was solved to 2.0 Å resolution.
The yellow version of TGP-E, YTP-E, has remarkable thermal, pH, and chemical stability but a low quantum yield [16]. This reduction in quantum yield was also observed in the related protein Phanta. Phanta shares a mutation (in this case to glutamine) in the original His 197 located below the chromophore of TGP-E and all of its predecessors [19,20]. The YTP-E protein also contained a lower molecular weight non-fluorescent contaminant that was not possible to remove through purification [16]. We hypothesized that this contaminant may in part be due to the size difference between the histidine at residue 197 and the larger tyrosine contained at the same position in YTP-E, resulting in a portion of the protein that did not fold correctly and was prone to proteolysis. Glutamate 148 was in close proximity to histidine 193 based on the TGP and TGP-E crystal structures. We mutated this residue to a slightly shorter aspartate, preserving its acidic character. This single mutation improved the purity of YTP-E E148D, significantly reducing the lower molecular weight contaminant, but also further reduced the quantum yield. We were able to crystallize this protein, whereas previous attempts yielded poor-quality crystals. A protein structure at 3.0 Å resolution was obtained for YTP-E E148D.

2. Results and Discussion

Site-directed mutagenesis was used to incorporate the E148D mutation into a pETCK3 YTP-E-containing plasmid. YTP-E E148D and TGP-E were expressed in BL21(DE3) E. coli cells and purified using nickel affinity chromatography followed by ion exchange chromatography. The spectral features of YTP-E E148D were very similar to YTP-E with an excitation maximum of 513 nm and an emission maximum of 528 nm; a notable peak at 385 nm is also present, but excitation at this wavelength does not result in fluorescence (Figure 1). In contrast, TGP-E has an excitation maximum of 494 nm and an emission maximum of 509 nm (Figure 1) [16].
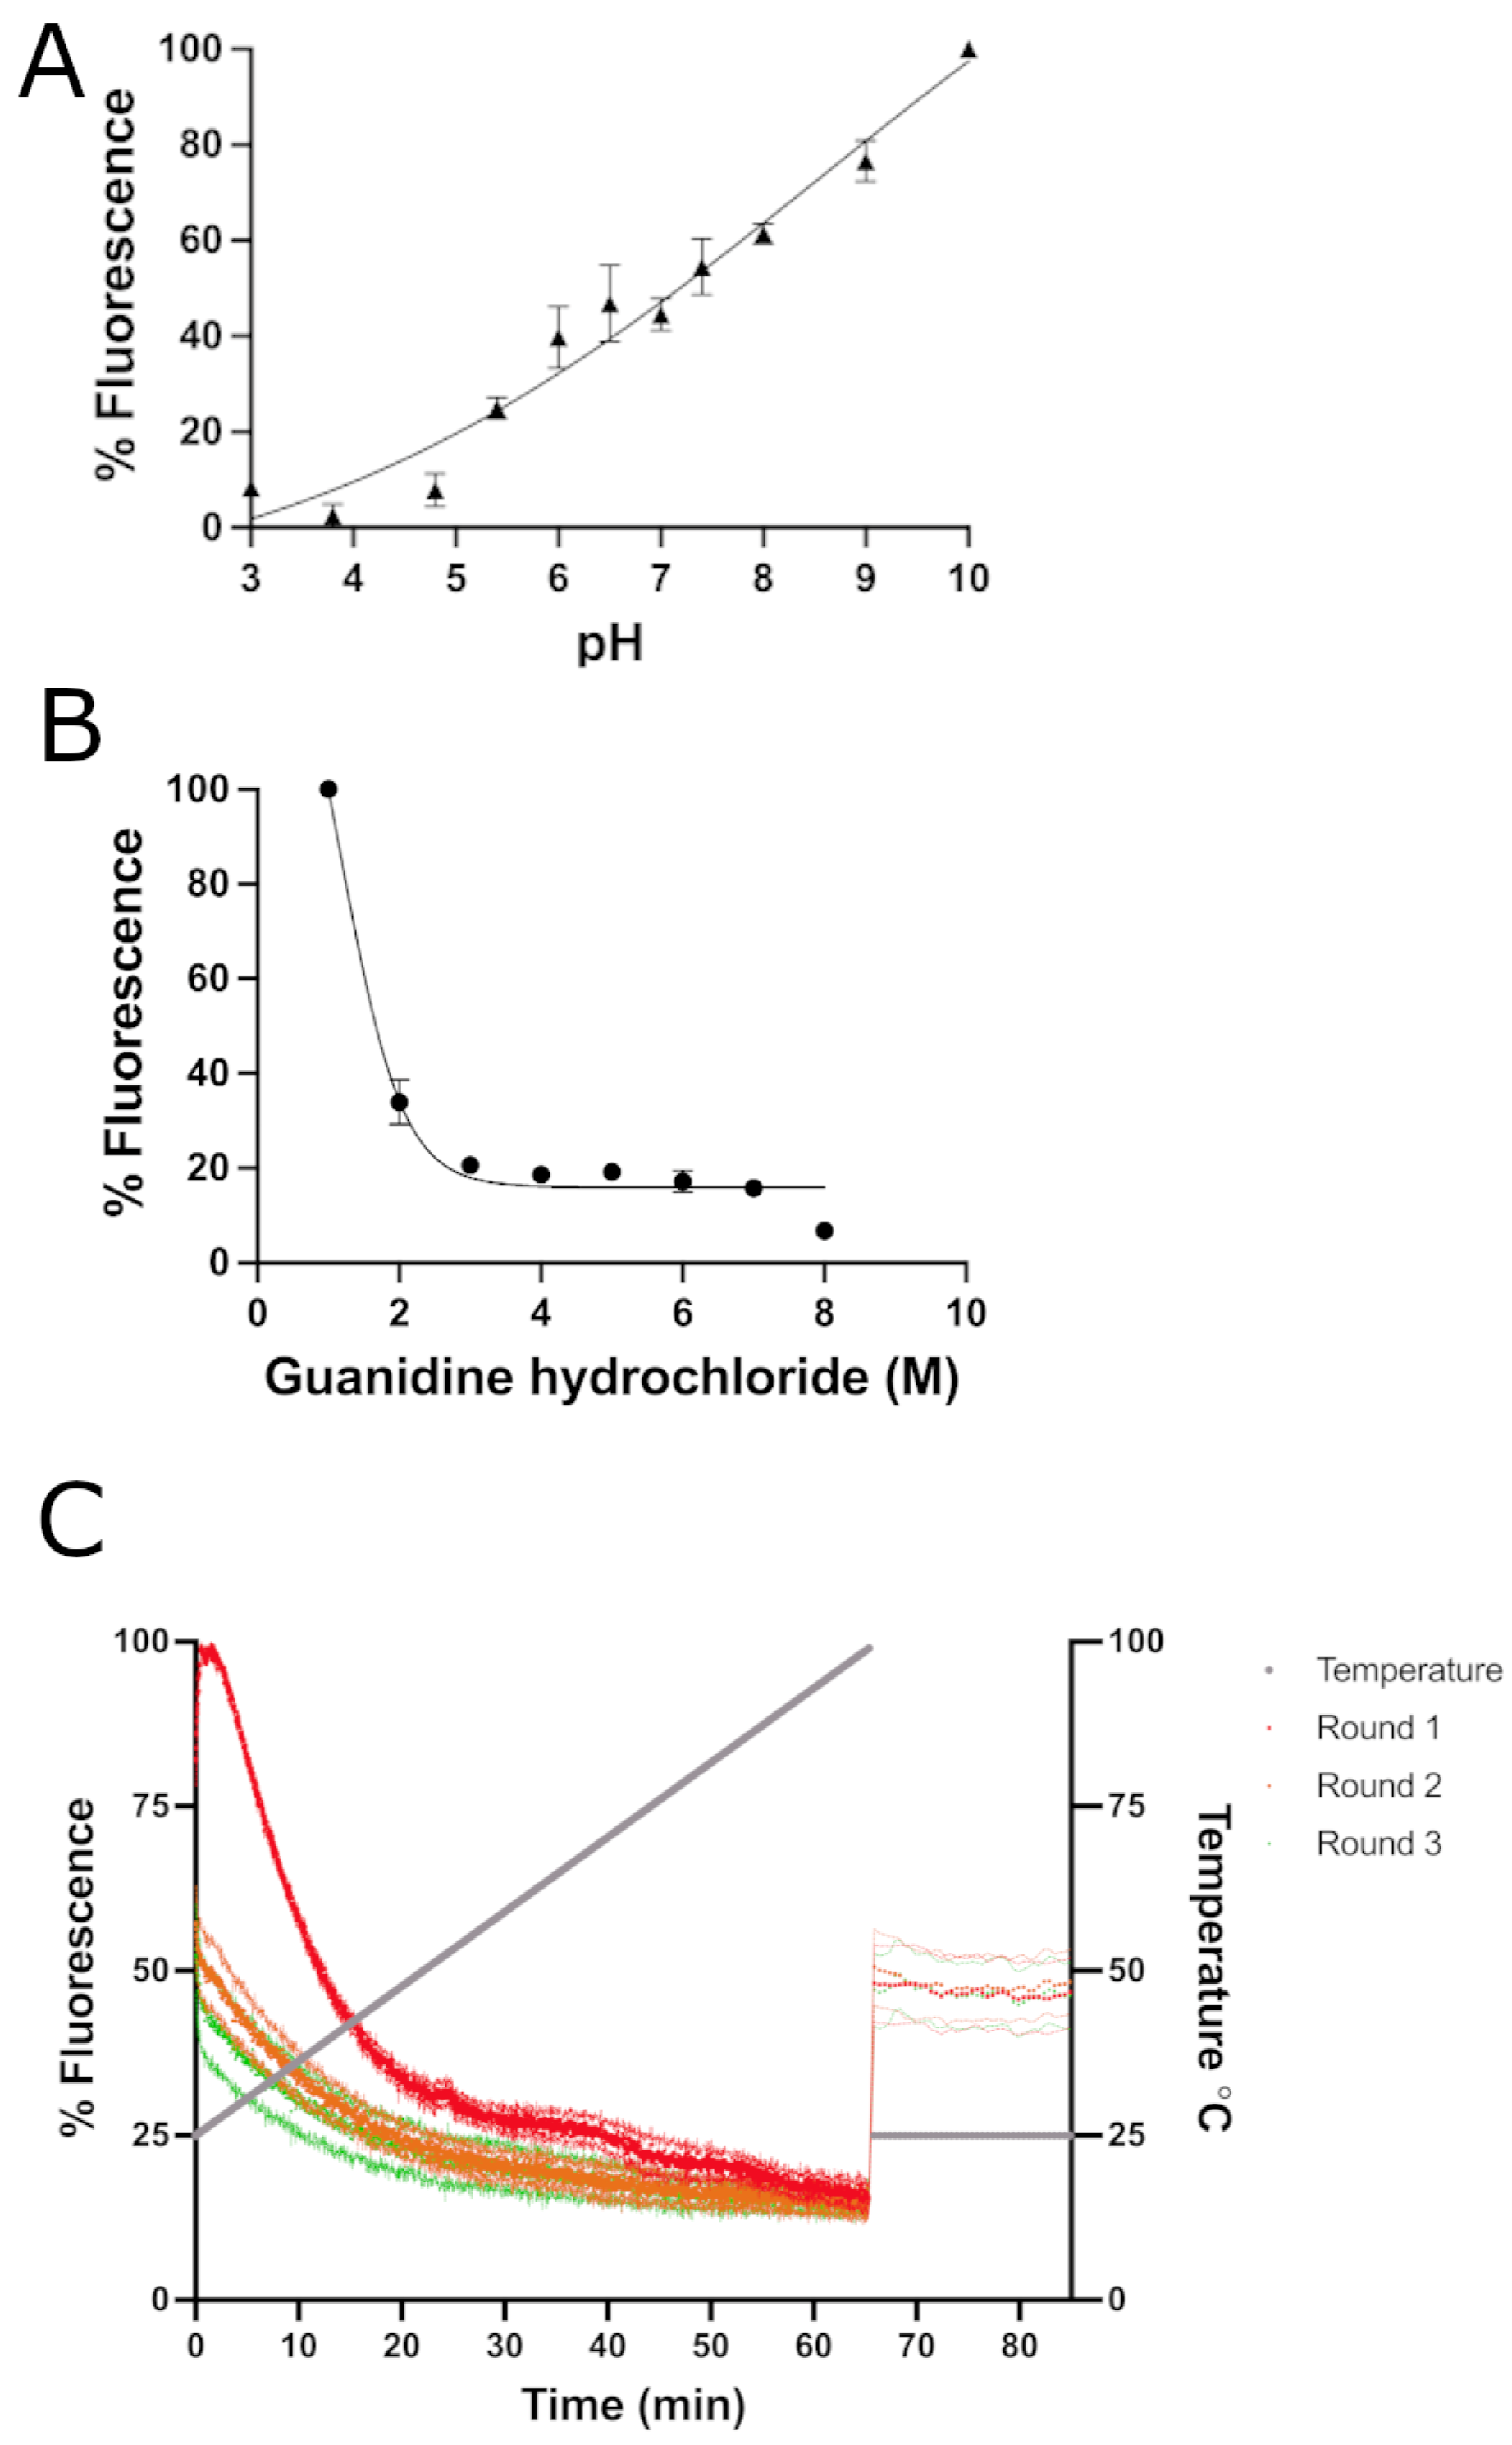
The impetus for the incorporation of YTP-E E148D was to increase the quantum yield of the YTP-E protein, which was very low at 0.03 ± 0.001 [16], but this was not the case because the YTP-E E148D mutation further decreased the quantum yield to 0.01. The YTP-E E148D mutant protein was also characterized for pH, chemical (Guanidine hydrochloride), and temperature stability (Figure 2). YTP-E E148D has a pKa value of 8.5 (R squared value 0.95), a Cm for guanidine hydrochloride of 1.18 (R squared value of 0.98), and also had a notable drop in temperature stability compared to YTP-E, with a return to 50% fluorescence with three repetitions of unfolding instead of 90% [16]. YTP-E E148D also contains a lower molecular weight contaminant evident in the YTP-E sample on an SDS-Page gel, but also has evidence for dimerization on a reducing SDS-page gel (Supplemental Figure S1). Crystallography was pursued as attempts at crystalizing YTP or YTP-E yielded crystals that diffracted poorly. A significant increase in crystal quality was observed with the E148D mutation, which led to the 3.0 Å crystal structure of YTP-E E148D (Supplemental Figure S2). Additionally, we were able to obtain protein crystals that diffracted well from TGP-E (Supplemental Figure S2).
Crystals of TGP-E and YTP-E E148D proteins were grown as described in the Section 3. Crystal diffraction data was collected on a Rigaku XtaLab Synergy-S system using CrysAlisPro software version 42.95a. Data collection and processing details are presented in Table 1. We determined the crystal structure of TGP-E to 2.0 Å using molecular replacement and YTP-E E148D to 3.0 Å (Table 2 contains refinement statistics). The TGP-E protein was in space group P1 with two molecules in the asymmetric unit. The YTP-E E148D structure was in space group P 1 21 1 with four molecules in the asymmetric unit. The two molecules of TGP-E are very similar with a root mean square deviation (RMSD) Cα carbons of 0.167 (Pymol) (Figure 3A). The density of the chromophore within TGP-E is clearly defined (Figure 3B).
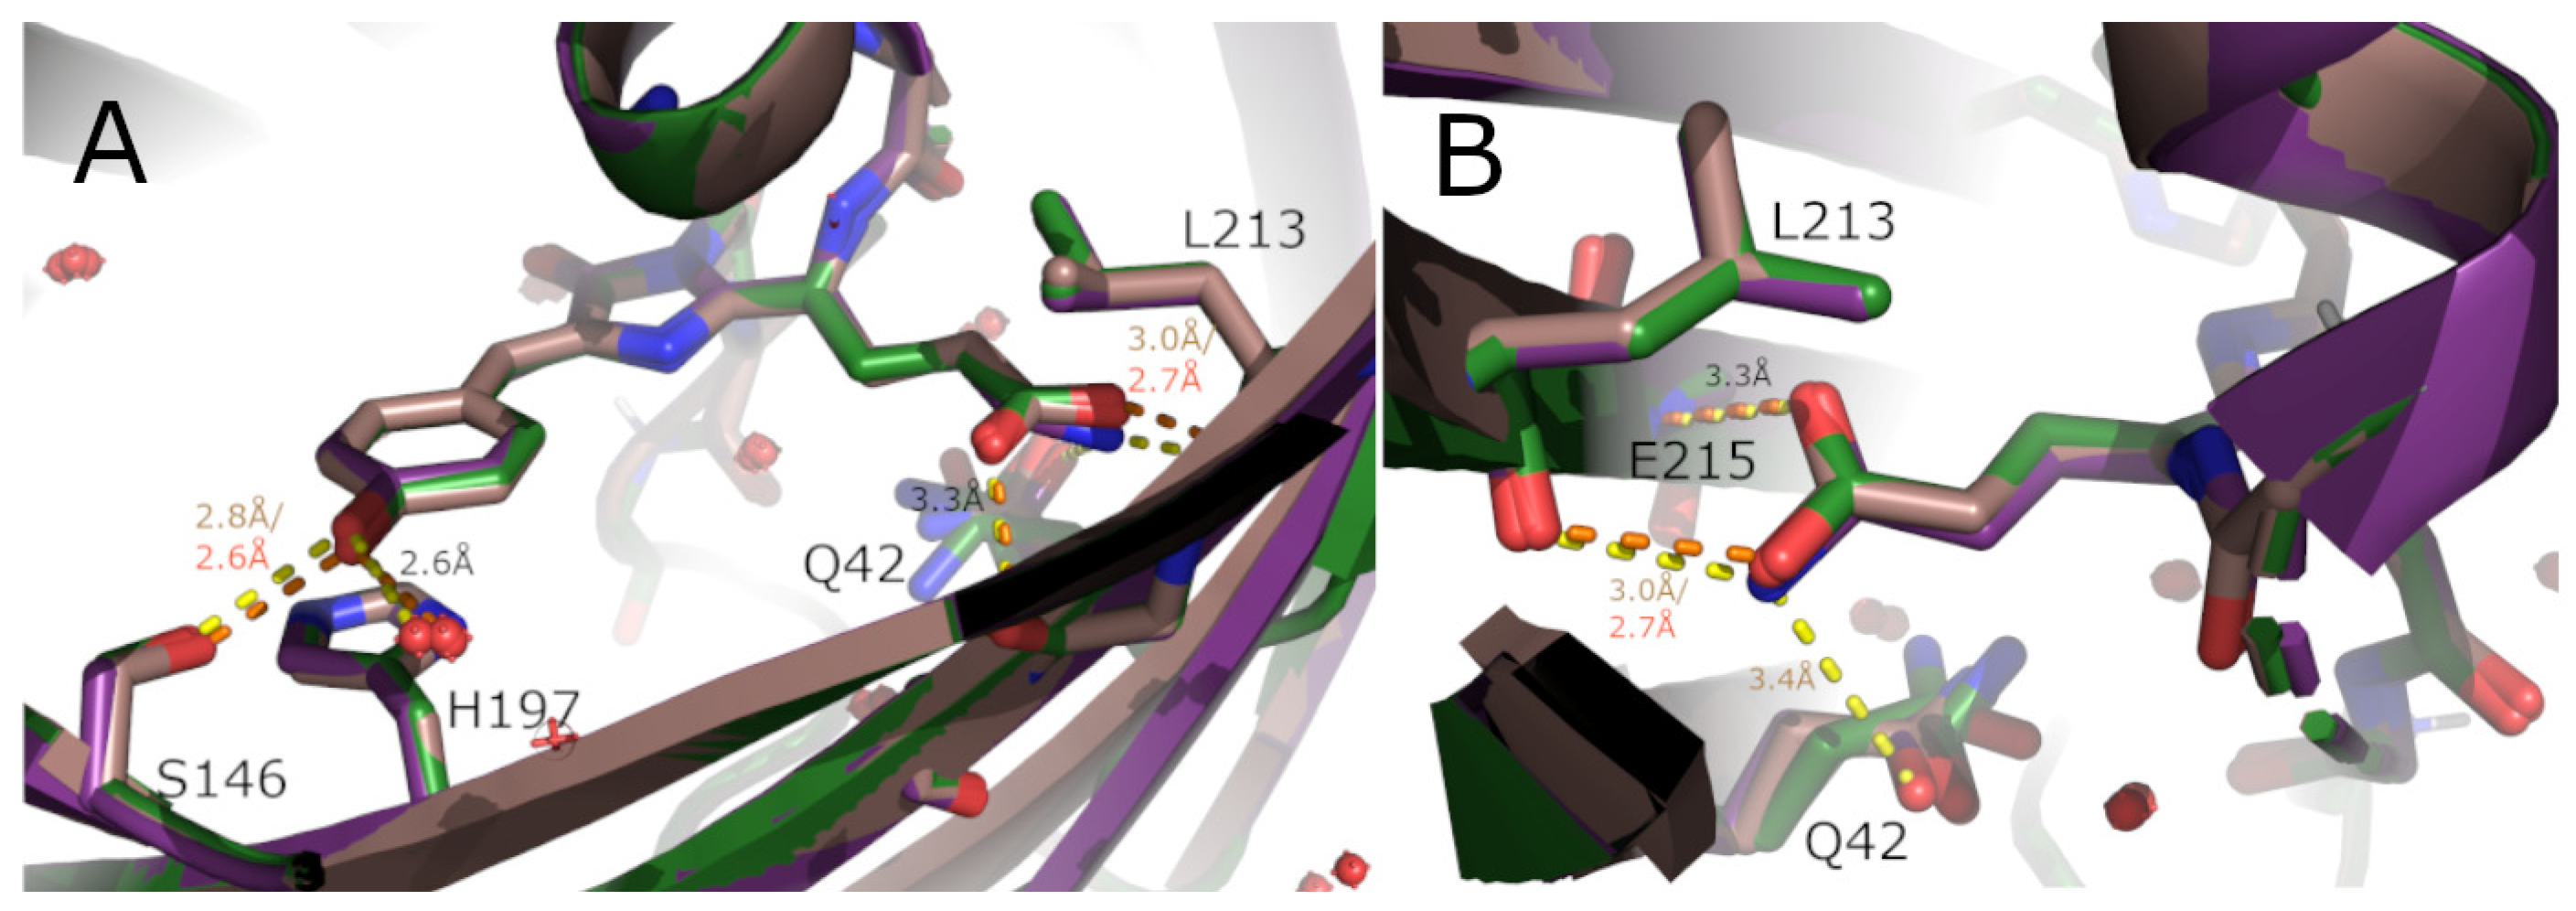
Both TGP-E and YTP-E E148D have an 11-strand beta barrel structure similar to that found in GFP. The chromophore found in the centre of the beta barrel is composed of residues Glu66, Tyr67, and Gly68. The density for chromophore placement was very clear within the TGP-E structure and can be observed in Figure 3B. The chromophore hydrogen bonds to several residues within the core of TGP-E. The carboxylic acid functional group within TGP-E is likely protonated; this assumption is based on the hydrogen bonding distance of only 2.7 Å to the carbonyl backbone of Leu213, the lack of nearby water molecules, and the (further) distance of other charged amino acids to the chromophore from the carboxylic acid functional group derived from Glu66 (Figure 4B) [21]. The carboxyl oxygen of the chromophore is also within hydrogen bonding distance (3.3 Å) to the nitrogen backbone of Glu215. The opposite end of the chromophore contains the phenol functional group from Tyr67 hydrogen bonds to both Ser146 (2.6 Å) and a conserved water molecule (W421) (2.6 Å) (Figure 4B). There is also a distinctive pi-stack with the phenol moiety of the chromophore with His197 (Figure 4A). The chromophore imidazolidinone ring oxygenhydrogen bonds to both Arg70 and conserved water (W431).
TGP-E is similar to TGP (RCSB PDB 4TZA) with root mean square deviation (RMSD) Cα carbons of 0.225 with only a single difference in amino acid sequence. As expected, there is no noticeable difference in the global structure. However, there are some alterations to the hydrogen bonding network involving the chromophore (Figure 4), most notably the change in the side chain conformations observed in Gln42 (Figure 4). Molecule B of TGP-E was modelled with two alternate conformations for this residue, while only one conformation is observed in molecule A. The carbonyl of Gln42 is much closer to the chromophore in TGP, forming a hydrogen bond with a 3.4 Å distance (Figure 4B). This hydrogen bond does not exist in TGP-E. Many of the other hydrogen bond interactions are conserved, but the bond lengths differ (Figure 4A). The hydrogen bonds near the altered chromophore are most affected. In TGP-E, the hydrogen bond to the backbone carbonyl of Leu213 has a 2.7 Å distance vs. the 3.0 Å distance in TGP. This stronger hydrogen bond could only exist if the carboxyl functional group is protonated. The nature of the hydrogen bond also differs between TGP-E and TGP with the hydroxyl-to-carbonyl hydrogen bond having a greater strength than the corresponding amide-to-carbonyl hydrogen bond in TGP [22]. A weaker bond to the nitrogen backbone of Glu215 is observed in both TGP-E and TGP (Figure 4B). On the opposite end of the chromophore, the TGP-E phenol hydrogen to Ser146 hydrogen bond is stronger, with a length of 2.6 Å versus the 2.8 Å in TGP (Figure 4A).
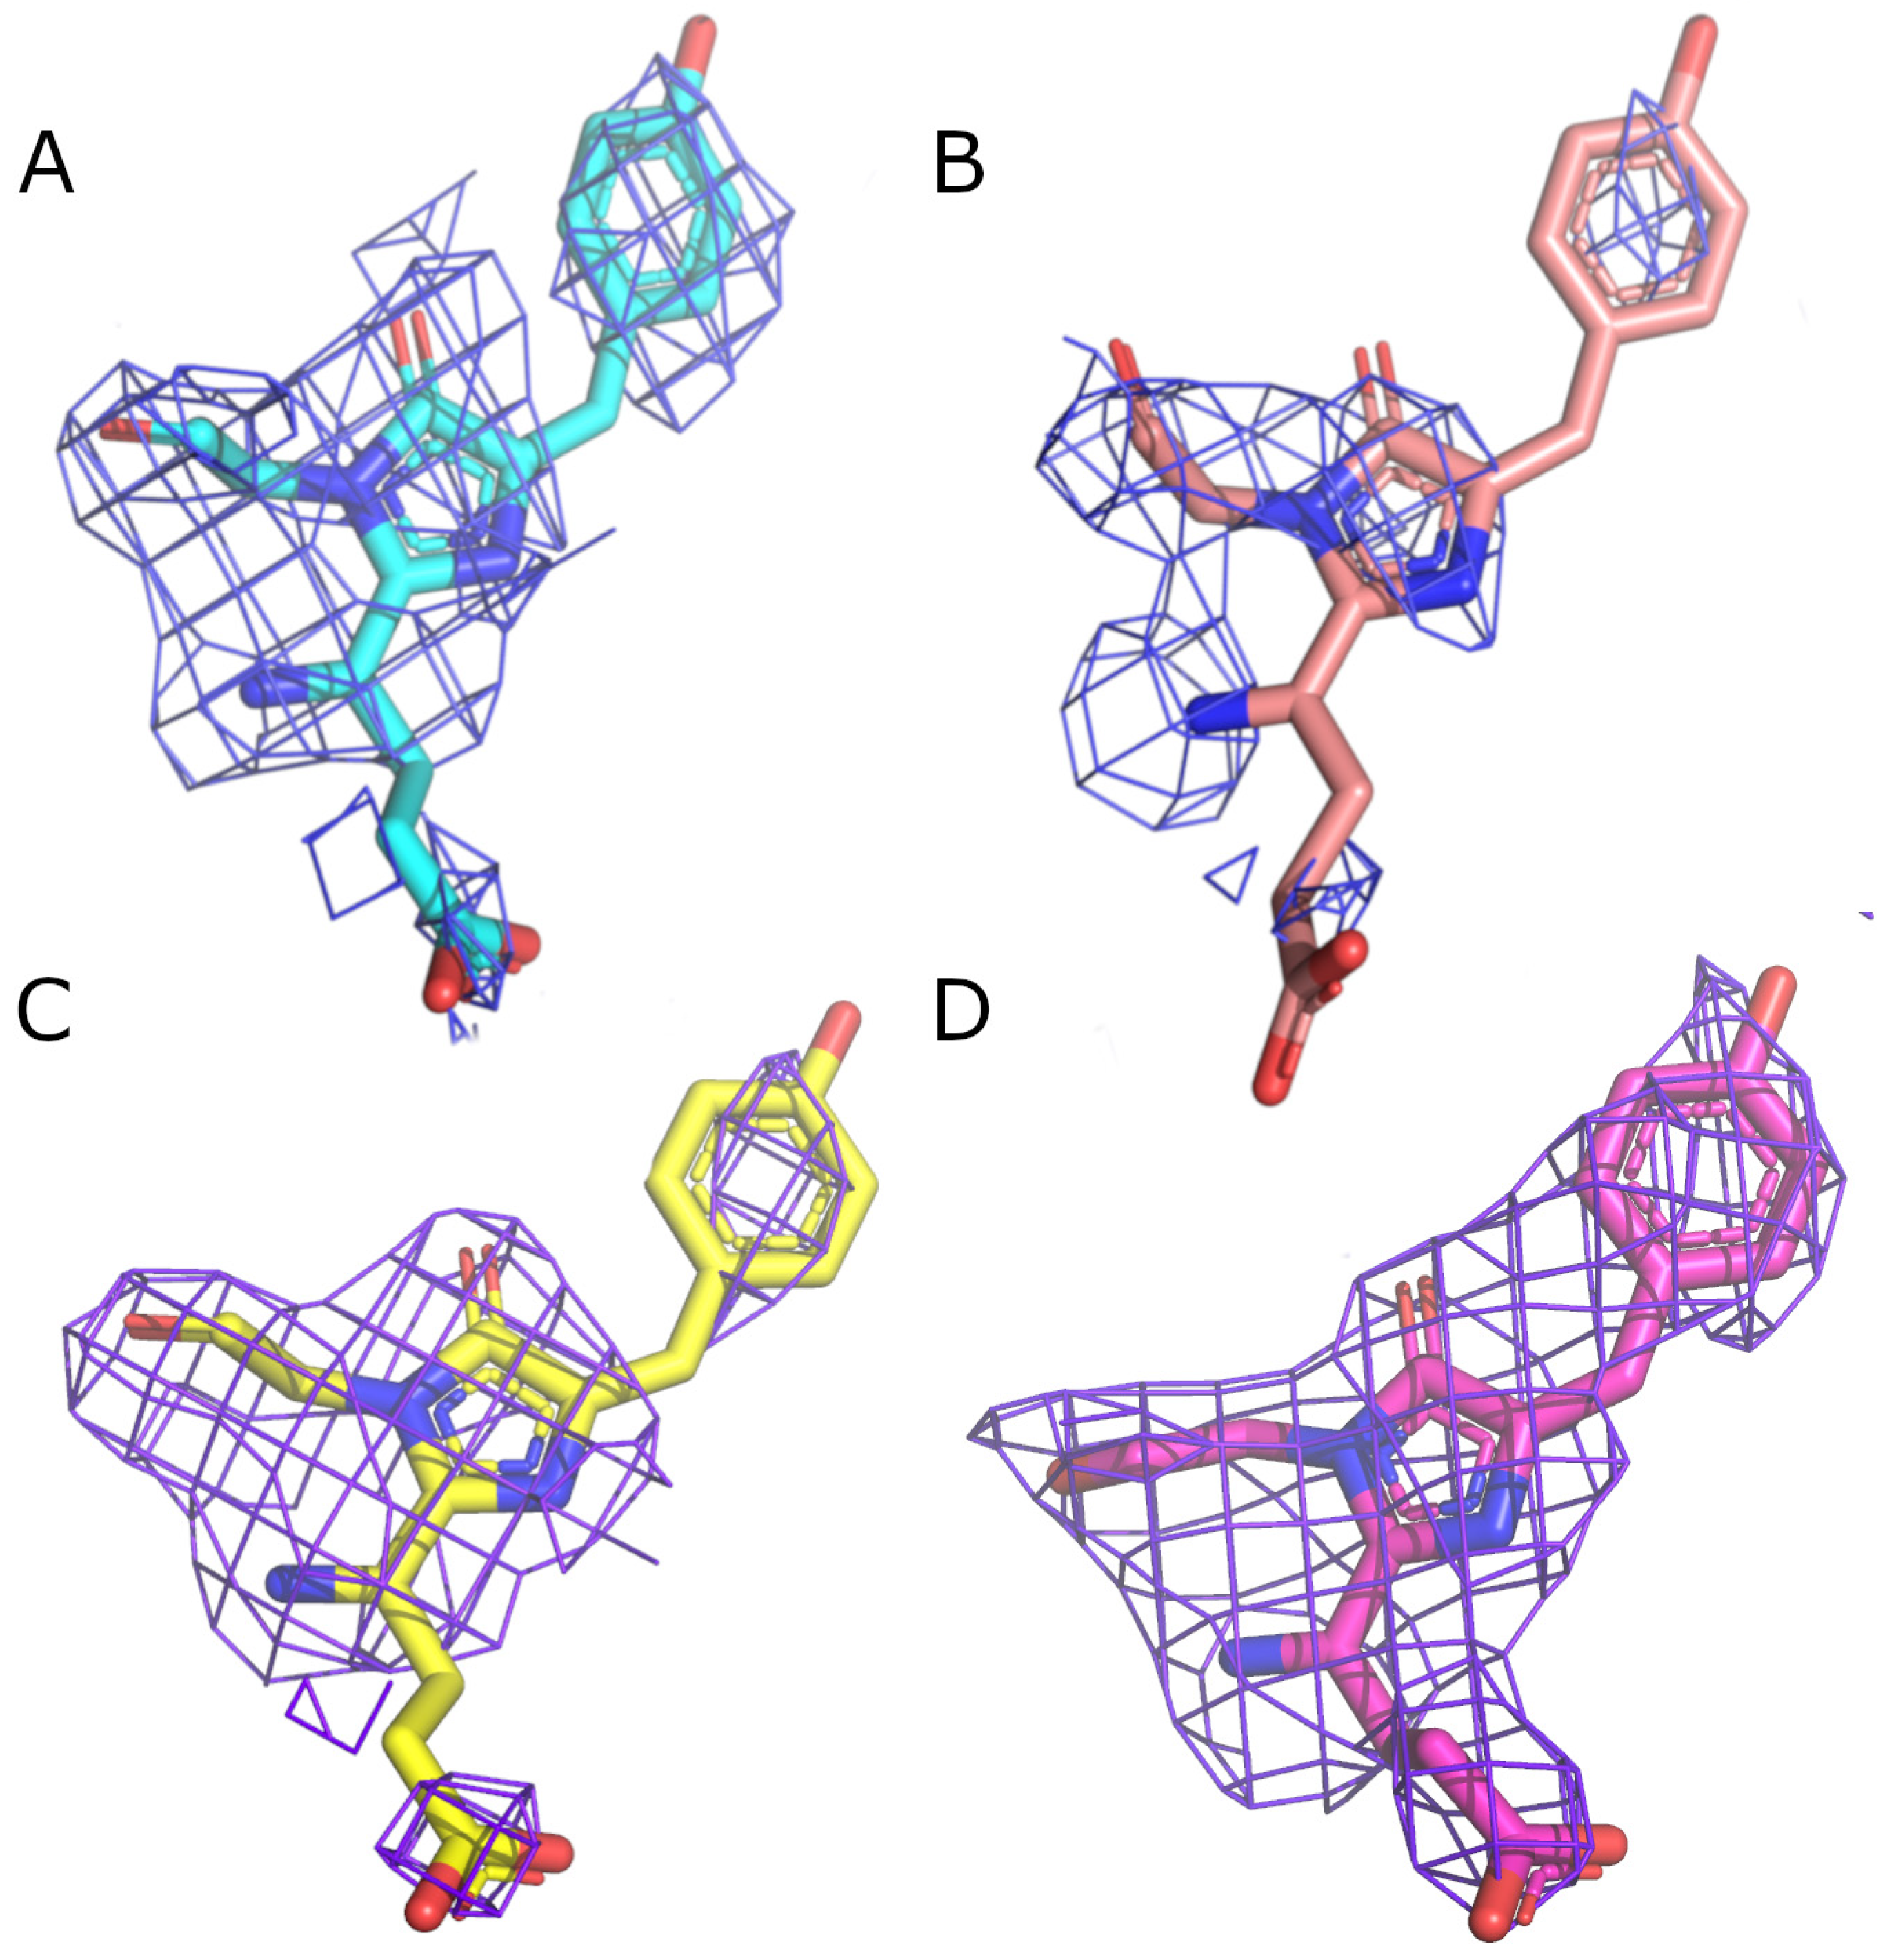
In contrast to TGP-E, YTP-E E148D had four molecules in the asymmetric unit. These four molecules had similar tertiary structures with an RMSD of Cα carbons ranging from 0.176 to 0.221. Several notable differences are observed within the core of the protein, explaining the extreme drop in quantum yield for this protein as compared to TGP-E. Most notable is the chromophore non-planarity. Unlike the chromophore observed in TGP-E, the chromophore within YTP-E E148D is twisted. In addition, an unusually high degree of disorder is present at or near the chromophore, suggesting some mobility. The chromophore within molecules A and D are well defined (Figure 5A,D), but the position of the chromophore in molecules B and C are less definitive (Figure 5B,C). The first residue after the chromophore, residue 69, and the residues that follow to 86 have B-factors approximately two times greater than surrounding residues.
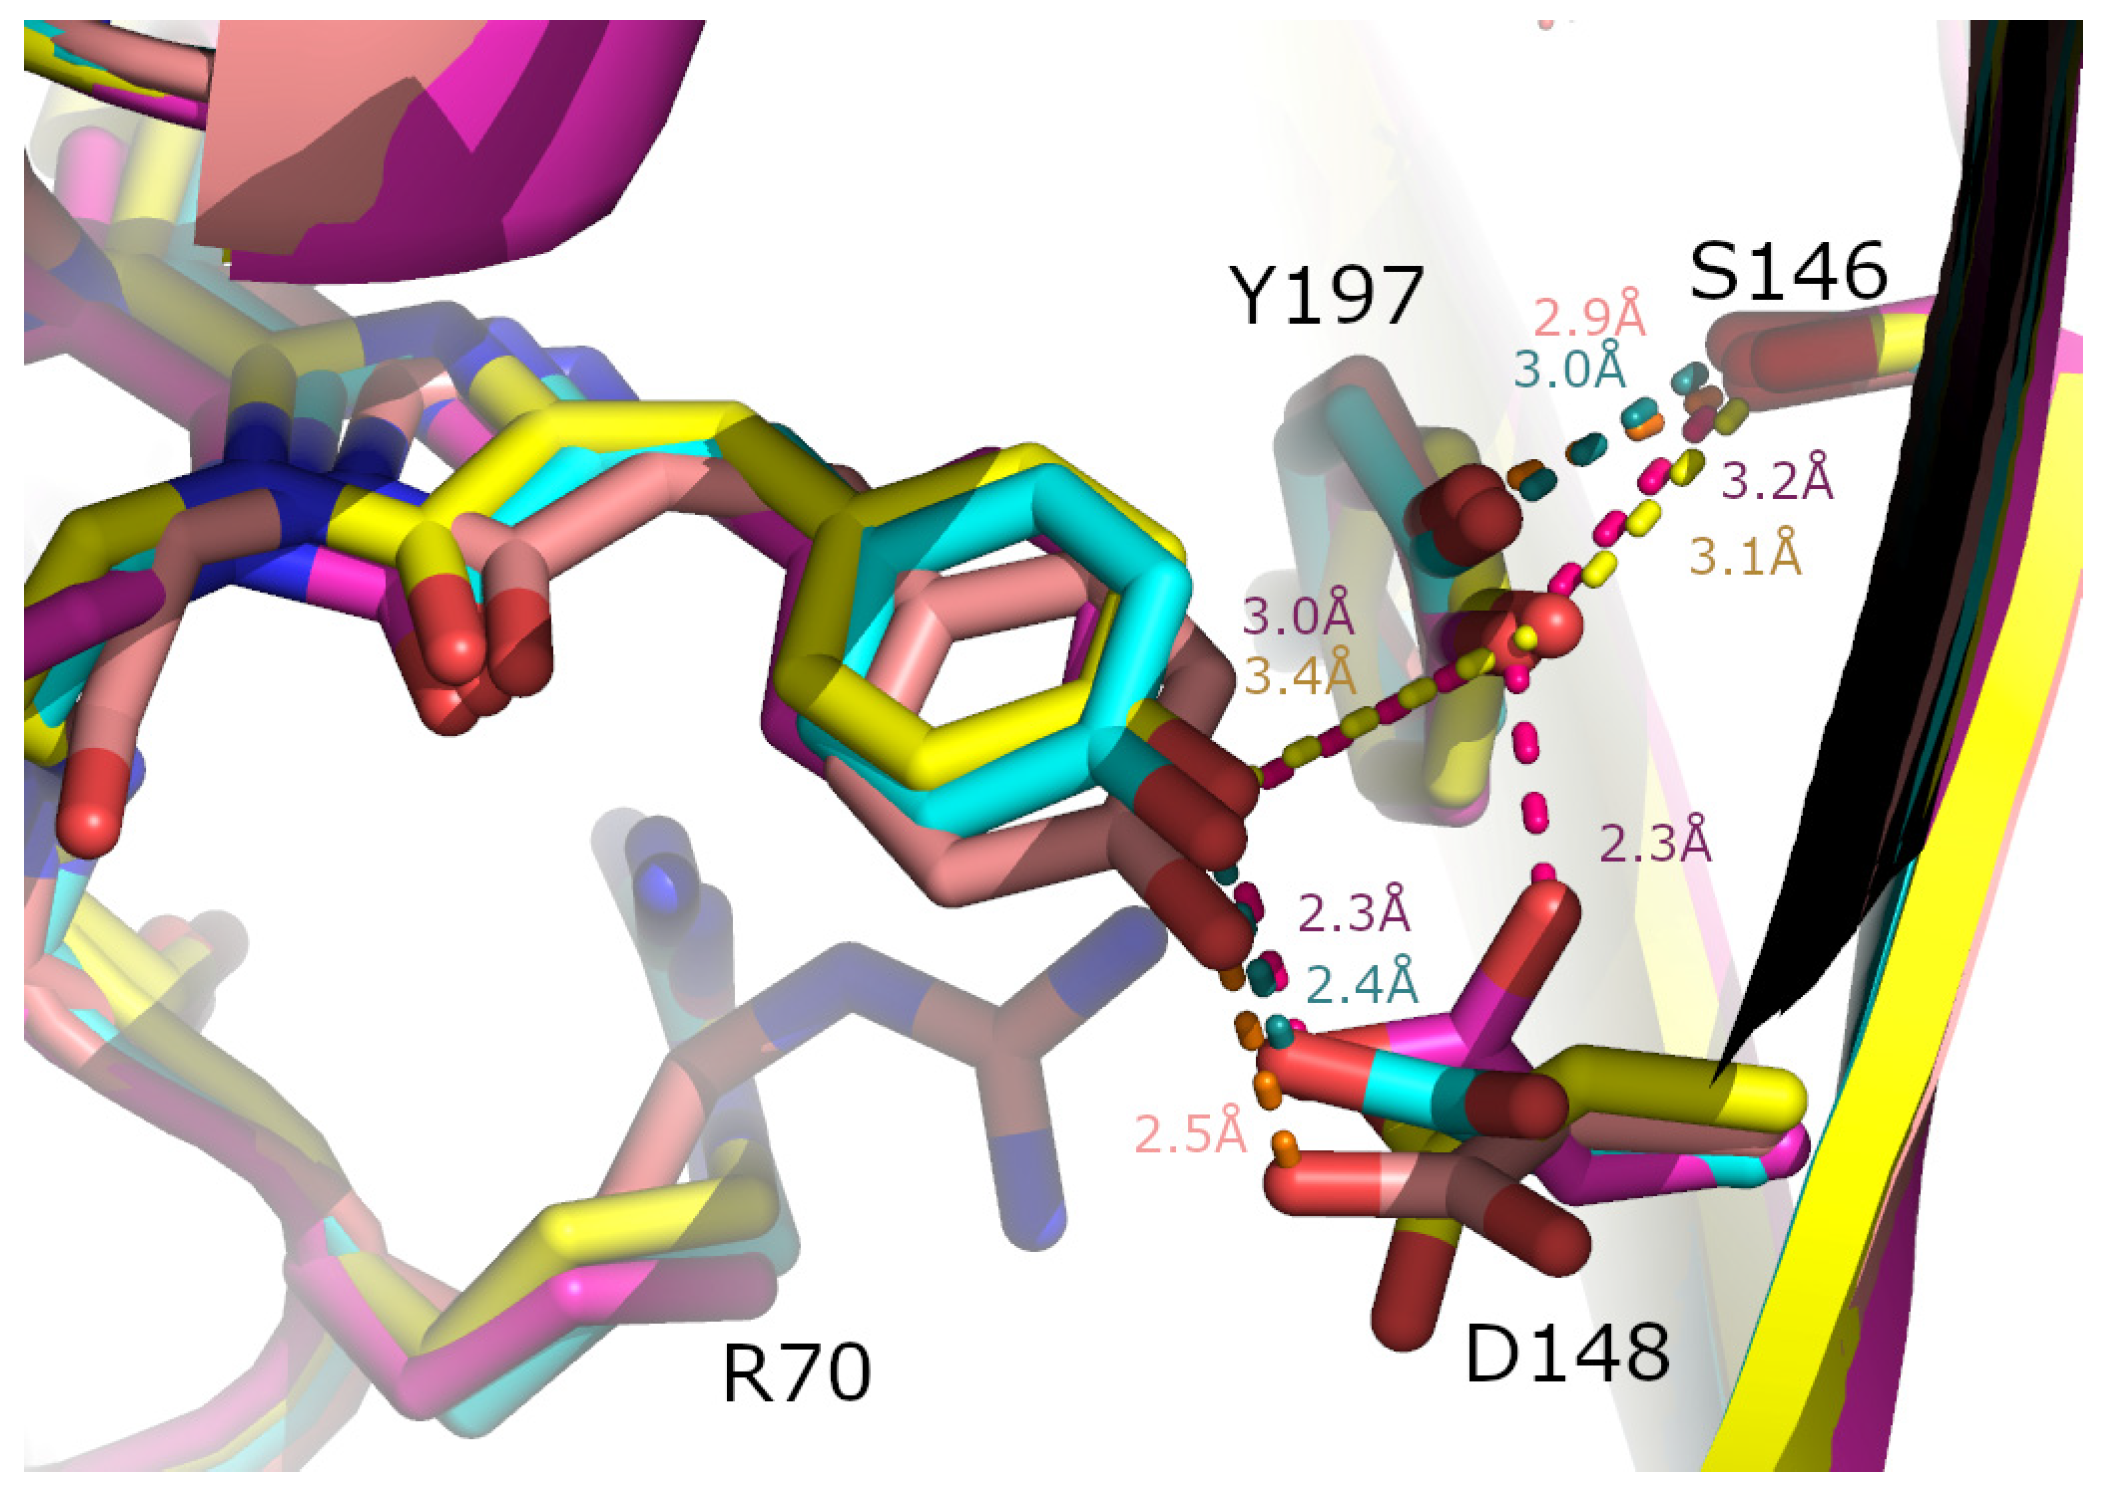
In yellow fluorescent proteins derived from GFP, the yellow fluorescence is due to a pi-stacking interaction between the chromophore hydroxyphenol functional group and a tyrosine residue located directly below [23]. In YTP-E E148D, this fluorescent shift to yellow was the result of mutating H197 to a tyrosine [16]. Although the Y197 in the active site does pi-stack, the pi-stack is perpendicular and not parallel displaced (Figure 6). The chromophore is a trans-chromophore position relative to the central bond instead of the cis-isomer observed in TGP-E (Figure 6). Several GFP-based proteins that are weakly fluorescent also contain a trans-chromophore, including the photoswitching protein Dronpa in its off state [19,24,25]. In the cyan fluorescent proteins, the trans-isomer is observed in low pH and also corresponds to a reduction in fluorescence [26]. However, a related photoswitching low fluorescent protein, Phanta, does not have a trans-chromophore [19,20].
The mutation of E148D, which was required to obtain quality protein crystals, resulted in a decrease in the quantum yield compared to YTP-E. In molecules A, B, and D, the chromophore hydroxyphenol forms a hydrogen bond to E148D, facilitating the distortion of the chromophore and the trans-chromophore form (Figure 6). In addition, slight differences are observed between the four molecules in the local hydrogen bond network near the chromophore (Figure 6). This gives further evidence for local flexibility within the chromophore region. Both molecule A and molecule D have the most optimal hydrogen bonding, which may explain the better electron density present in the chromophore of those molecules.
It is well established that a ridged chromophore is required for efficient fluorescent emission [4], and the lack of the ridged chromophore combined with the distortion of the hydroxyphenol of the YTPED chromophore likely explains the drop in quantum yield compared to the ridged, planar TGP-E chromophore (Figure 7A). A sharp contrast is observed in the chromophore region when compared to YFP (RCSB PDB 1YFP) (Figure 7B). In YFP, the residue corresponding to D148 is a valine; consequently, the hydrogen bond observed in YTP-E E148D is not possible. Instead, a hydrogen bond occurs between the chromophore hydroxyphenol and histidine 148, which corresponds to S146 in YTP-E E148D. Tyrosine 197 in YTP-E E148D is problematic as it extends toward the chromophore, whereas in YFP, tyrosine 203 lies planar (Figure 7B). The longer Arg70 residue found in YTP-E E148D is likely partially responsible for the displacement of Tyr197 because it is longer than the asparagine 69 at the equivalent position in YFP (Figure 7B). Arg70 in YTP-E E148D molecule A has a hydrogen bond directly to the chromophore imidazolidinone ring oxygen (Figure 7A). Arg70 in TGP-E is too far from the imidazolidinone ring to hydrogen bond directly; however, in the higher resolution TGP-E structure, several additional water molecules (W431, W428, W411, and W421) form an elaborate network of hydrogen bonding near the chromophore (Figure 7A). The alternative configuration of Arg70 in molecule B is at the same location as W428 in the TGP-E structure, allowing it to hydrogen bond directly to Asp148 (Figure 6). We could not model many waters in YTP-E E148D due to the lower resolution, but with the conformation changes in Arg70, chromophore rearrangement, and mutation of both E148D and H197Y, it is evident that the hydrogen bonding network has likely been altered. Future experiments will focus on investigating alternative residues at these positions within YTP-E E148D.

3. Materials and Methods

3.1. Site-Directed Mutagenesis

Site-directed mutagenesis was used to mutate YTP-E E148 to D. The QuickChange Lightning kit from Agilent was used with the forward primer CCTAGCACCGATAAAATGTAT and reverse primer ATACATTTTATCGGTGCTAGG. Incorporation of the mutation was verified by DNA sequencing at ACGT DNA Sequencing Services.

3.2. Protein Expression and Purification

The same procedure was used to purify TGP-E and YTP-E E148D. Both proteins were expressed in E. coli BL21(DE3) cells. A single cell was selected and scaled up into a 200 mL culture with overnight growth. The next day, 50 mL of overnight culture was used to scale up 2 L of LB media. Cells were induced with 1 mM IPTG once OD600 was greater than 0.4. Temperature was decreased to 28 °C and cells were grown for 3 days. After growth, cells were harvested by centrifugation at 5000 rpm. The cell pellets were resuspended in 50 mL of a lysis buffer containing 0.1 M Tris, 0.3 M NaCl, and 10% glycerol. The resuspended pellet was sonicated for 30 s three times with 30 s rests. This was followed by centrifugation for 20 min at 20,000 rpm. The supernatant-containing proteins were run on a nickel column (Gold Biotechnology). The column was rinsed with 10 column volumes of lysis buffer, washed with 10 column volumes of wash buffer (0.1 M Tris, 50 mM NaCl, 10 mM imidazole, and 10% glycerol), and finally eluted with 10 column volumes of an elution buffer (0.1 M Tris, pH 7.4, 200 mM imidazole, and 10% glycerol). The elution was run on a DEAE column to further purify. Protein on the DEAE column was rinsed with 10 column volumes of 0.1 M Tris, 10% glycerol and eluted from the column with 10 column volumes of a final buffer (0.1 M Tris, 0.5 M NaCl, and 10% glycerol). SDS PAGE gel electrophoresis was performed to verify purification. The protein was concentrated to perform quantum yield experiments and for crystallography.

3.3. Quantum Yield, pH Stability, Guanidine Hydrochloride Stability, and Thermostability

Quantum Yield: The quantum yield was determined using the relative method as described in Anderson et al.
Thermostability: Thermostability for YTP-E E148D was obtained on an RT-PCR (QuantStudio 6 Applied Biosystems). An amount of 3.75 pmol of the protein was added to the assay buffer (0.1 M Tris, pH 7.4, 20 mM MgCl2) on a 96-well plate. The assay was performed as described in Anderson et al. Five replicates of samples and buffer blanks were assayed.
Guanidinium: The chemical denaturation of YTP-E E148D was also tested with a guanidinium HCL assay. Several buffers (all containing 0.1 M Tris, pH 7.4, 20 mM MgCl2) were created that contained different concentrations of guanidinium HCl. The buffers ranged from 0–8 M. Forty-eight wells were prepared in a 96-well plate, which accounts for 4 trials. Four wells only consisted of the assay buffer and protein as a control. The other wells contained 1.4 μL of the YTP-E E148D protein (3.75 pmol) and 248.6 μL of the assay buffer with the respective guanidine concentrations. The plate was then incubated for 10 days at room temperature and then placed into the Spectramax M5 plate reader to measure the fluorescence in each well. The raw data were transformed for the highest fluorescence value in each trial to represent 100% fluorescence. Graphs were generated to display any type of association between guanidinium and fluorescence.
pH: The pH sensitivity of YTP-E E148D was also measured. The pH buffers were made from a range of pH 3–10 with 0.1 M of glycine, citrate, or phosphate buffers with 0.1 M NaCl depending on the target pH. Forty wells were prepared in a 96-well plate, which accounts for 4 trials. Eleven wells only consisted of pH buffers to act as controls. The other wells contained 1.4 μL of the YTP-E E148D protein (3.75 pmol) and 248.6 μL of the respective buffers for a total volume of 250 μL in each well. The plate was then incubated for 1 h and then placed into the Spectramax M5 plate reader to measure the fluorescence in each well. The raw data were transformed for the highest fluorescence value to represent 100% fluorescence. Graphs were generated to display the association between pH and fluorescence.

3.4. Crystallization

Once purified, TGP-E protein was concentrated to 20 mg mL−1 in the final buffer (0.1 M Tris, pH 7.4, 0.5 M NaCl, 10% glycerol). TGP-E protein crystals were identified from a screen of Crystal I (Hampton Research, Aliso Viejo, CA, USA). Next, the initial hit condition was optimized, and the best crystals were grown by vapour diffusion with a mother liquor consisting of 0.35 M magnesium chloride hexahydrate, 0.1 M Tris hydrochloride pH 8.5, and 37.5% PEG 4000 at a 1:1 ratio with the concentrated protein in a 2 µL drop. Finally, the 24-well VDX plates were sealed with immersion oil and incubated at 22 °C. Crystals appeared approximately two weeks after set-up.
YTP-E E148D protein was concentrated to 20 mg mL−1 in the final buffer. For this protein, a screen was made based on the conditions that crystalized TGP-E above. All the crystals were grown by vapour diffusion in 0.2 M magnesium chloride hexahydrate, 0.1 M Tris hydrochloride pH 8.5, and 35% PEG 4000 with a 1:1 ratio of concentrated protein to good solution in a 2 µL drop. Crystals were incubated at 22 °C and appeared at 10 days.
Before data collection, crystals were cryo-preserved with a 2:1 mother solution to glycerol. Finally, the crystals were transferred to 0.2 mm-mounted CryoLoops (Hampton Research, Aliso Viejo, CA, USA) and flash-frozen directly in the cryo stream at 100 K.

3.5. Data Collection and Processing

Diffraction data was collected on a Rigaku XtaLab Synergy-S system using CrysAlisPro software. The TGP-E crystal diffracted to a resolution of 2.00 Å. The TGP-E diffraction data was indexed in space group P1 with unit cell parameters of a = 38.74 Å, b = 49.06 Å, and c = 59.11 Å. The YTP-E E148D crystal diffracted to a resolution of 3.0 Å and indexed in space group P1 21 1 with unit cell parameters of a = 42.78 Å, b = 137.78 Å, and c = 74.56 Å. Both structures were integrated with CrysAlisPro and scaled with CCP4i Scala [27]. Statistics from data collection and processing are shown in Table 1.
Originally, the YTP-E E148D crystal was processed with a higher resolution of 2.5 Å. The statistics for this resolution appeared valid; however, when checked, the scaled data in Phenix Xtriage reported unusual intensity statistics, even though there was no evidence for twinning. Likewise, the data is moderately anisotropic. We proceeded with several rounds of refinement at the higher resolution, but it became apparent that there were issues with the map quality and refinement. Close examination of the Wilson plot indicated that the intensity at resolutions below 3.0 Å did not follow the expected trend. The YTP-E E148D data was reprocessed at 3.0 Å. Phenix Xtriage noted only that the data was still moderately anisotropic after reprocessing. The structure refined normally with a noticeable map quality increase at this lower resolution.

3.6. Structure Solution and Refinement

The TGP-E structure was solved by molecular replacement with the coordinates of Azami-Green (mAG) (PDB: 3ADF) as a search model, and the YTP-E E148D structure was solved by molecular replacement using TGP-E’s coordinates with Phaser in CCP4i [28]. Refinement and model building were performed using CCP4i, Phenix Refine, and Coot [29,30,31]. The structure of TGP-E and its diffraction data have been deposited in the worldwide Protein Data Bank (wwPDB) as entry 8TJH. The structure of YTP-E E148D and its diffraction data have been deposited in the worldwide Protein Data Bank (wwPDB) as entry 9BQ4. The refinement statistics are summarized in Table 2. Figures were made using Pymol (Version 2.5.4) and Gimp (Version 2.10).

4. Conclusions

The crystal structure of TGP-E illustrates the role hydrogen bond interactions have in improving fluorescent protein properties. A single mutation within the chromophore from glutamine to glutamic acid in TGP-E led to an improvement in thermostability [16]. The crystal structure of TGP-E has stronger hydrogen bonding interactions on both ends of the chromophore, likely resulting in the observed increase in thermostability. While the structure of the related protein YTP-E E148D has a very low quantum yield and some undesirable properties for a thermostable fluorescent protein, it fundamentally illustrates the importance of the planer chromophore and local hydrogen bonding network. This structure indicates that the reduction in quantum yield is due to disruption of the hydrogen bond network present below the chromophore, distortion in the chromophore, and added freedom of motion evident in high B-factors in the chromophore region of the protein structure. Although in its current form, YTP-E E148D would not be a good substitute for a GFP-based YFP protein, its structure suggests further mutations that may significantly improve fluorescence.

Supplementary Materials

The following supporting information can be downloaded at: https://www.mdpi.com/article/10.3390/synbio2030018/s1, Supplemental Figure S1: Lane 1 are Bio-Rad All Blue Standard molecular weight markers. Lane 2 is purified TGP-E protein. Lane 3 is purified YTP-E. Lane 4 is purified YTP-E E148D, which shows evidence of dimerization with both a monomeric band at 28 KDa and a dimer at 50 KDa; Supplemental Figure S2: (A) A crystal of TGP-E. (B) The crystal of TGP-E during data collection. (C) Crystals of YTP-E E148D. (D) The crystal of YTP-E E148D during data collection.

Author Contributions

Conceptualization, M.R.A. and N.M.D.; methodology, M.R.A., C.M.P. and V.O.O.; validation, N.M.D.; investigation, M.R.A., C.M.P., V.O.O. and N.M.D.; resources, N.M.D.; writing—original draft preparation, V.O.O. and N.M.D.; writing—review and editing, M.R.A., C.M.P. and V.O.O.; supervision, N.M.D.; project administration, N.M.D.; funding acquisition, N.M.D. All authors have read and agreed to the published version of the manuscript.

Funding

This research was funded by the National Science Foundation, grant number 2117129.

Institutional Review Board Statement

Not applicable.

Informed Consent Statement

Not applicable.

Data Availability Statement

The original data presented in the study are openly available in RCSB Protein Data Bank at www.rcsb.org (accessed on 8 August 2024) with accession numbers 8TJH and 9BQ4.

Acknowledgments

We thank Renee Michno for editing this manuscript.

Conflicts of Interest

The authors declare no conflicts of interest. In addition, the funders had no role in the design of the study; in the collection, analyses, or interpretation of data; in the writing of the manuscript; or in the decision to publish the results.

References

  1. Aliye, N.; Fabbretti, A.; Lupidi, G.; Tsekoa, T.; Spurio, R. Engineering Color Variants of Green Fluorescent Protein (GFP) for Thermostability, pH-Sensitivity, and Improved Folding Kinetics. Appl. Microbiol. Biotechnol. 2015, 99, 1205–1216. [Google Scholar] [CrossRef]
  2. Nguyen, A.W.; Daugherty, P.S. Evolutionary Optimization of Fluorescent Proteins for Intracellular FRET. Nat. Biotechnol. 2005, 23, 355–360. [Google Scholar] [CrossRef] [PubMed]
  3. Holder, A.N.; Ellis, A.L.; Zou, J.; Chen, N.; Yang, J.J. Facilitating Chromophore Formation of Engineered Ca2+ Binding Green Fluorescent Proteins. Arch. Biochem. Biophys. 2009, 486, 27–34. [Google Scholar] [CrossRef] [PubMed]
  4. Tsien, R.Y. The Green Fluorescent Protein. Annu. Rev. Biochem. 1998, 67, 509–544. [Google Scholar] [CrossRef]
  5. Costantini, L.M.; Baloban, M.; Markwardt, M.L.; Rizzo, M.A.; Guo, F.; Verkhusha, V.V.; Snapp, E.L. A Palette of Fluorescent Proteins Optimized for Diverse Cellular Environments. Nat. Commun. 2015, 6, 7670. [Google Scholar] [CrossRef] [PubMed]
  6. Shu, X.; Shaner, N.C.; Yarbrough, C.A.; Tsien, R.Y.; Remington, S.J. Novel Chromophores and Buried Charges Control Color in mFruits. Biochemistry 2006, 45, 9639–9647. [Google Scholar] [CrossRef]
  7. Habuchi, S.; Ando, R.; Dedecker, P.; Verheijen, W.; Mizuno, H.; Miyawaki, A.; Hofkens, J. Reversible Single-Molecule Photoswitching in the GFP-like Fluorescent Protein Dronpa. Proc. Natl. Acad. Sci. USA 2005, 102, 9511–9516. [Google Scholar] [CrossRef]
  8. Jöhr, R.; Bauer, M.S.; Schendel, L.C.; Kluger, C.; Gaub, H.E. Dronpa: A Light-Switchable Fluorescent Protein for Opto-Biomechanics. Nano Lett. 2019, 19, 3176–3181. [Google Scholar] [CrossRef]
  9. Tubbs, J.L.; Tainer, J.A.; Getzoff, E.D. Crystallographic Structures of Discosoma Red Fluorescent Protein with Immature and Mature Chromophores:  Linking Peptide Bond Trans−Cis Isomerization and Acylimine Formation in Chromophore Maturation. Biochemistry 2005, 44, 9833–9840. [Google Scholar] [CrossRef]
  10. Kiss, C.; Temirov, J.; Chasteen, L.; Waldo, G.S.; Bradbury, A.R.M. Directed Evolution of an Extremely Stable Fluorescent Protein. Protein. Eng. Des. Sel. 2009, 22, 313–323. [Google Scholar] [CrossRef]
  11. Dai, M.; Fisher, H.E.; Temirov, J.; Kiss, C.; Phipps, M.E.; Pavlik, P.; Werner, J.H.; Bradbury, A.R.M. The Creation of a Novel Fluorescent Protein by Guided Consensus Engineering. Protein. Eng. Des. Sel. 2007, 20, 69–79. [Google Scholar] [CrossRef] [PubMed]
  12. Close, D.W.; Paul, C.D.; Langan, P.S.; Wilce, M.C.J.; Traore, D.A.K.; Halfmann, R.; Rocha, R.C.; Waldo, G.S.; Payne, R.J.; Rucker, J.B.; et al. Thermal Green Protein, an Extremely Stable, Nonaggregating Fluorescent Protein Created by Structure-Guided Surface Engineering. Proteins 2015, 83, 1225–1237. [Google Scholar] [CrossRef] [PubMed]
  13. Ebisawa, T.; Yamamura, A.; Kameda, Y.; Hayakawa, K.; Nagata, K.; Tanokura, M. The Structure of mAG, a Monomeric Mutant of the Green Fluorescent Protein Azami-Green, Reveals the Structural Basis of Its Stable Green Emission. Acta. Crystallogr. Sect. F Struct. Biol. Cryst. Commun. 2010, 66, 485–489. [Google Scholar] [CrossRef]
  14. Cai, H.; Yao, H.; Li, T.; Hutter, C.A.J.; Li, Y.; Tang, Y.; Seeger, M.A.; Li, D. An Improved Fluorescent Tag and Its Nanobodies for Membrane Protein Expression, Stability Assay, and Purification. Commun. Biol. 2020, 3, 1–16. [Google Scholar] [CrossRef] [PubMed]
  15. Velappan, N.; Close, D.; Hung, L.-W.; Naranjo, L.; Hemez, C.; DeVore, N.; McCullough, D.K.; Lillo, A.M.; Waldo, G.S.; Bradbury, A.R.M. Construction, Characterization and Crystal Structure of a Fluorescent Single-Chain Fv Chimera. Protein Eng. Des. Sel. 2021, 34, gzaa029. [Google Scholar] [CrossRef]
  16. Anderson, M.R.; Padgett, C.M.; Dargatz, C.J.; Nichols, C.R.; Vittalam, K.R.; DeVore, N.M. Engineering a Yellow Thermostable Fluorescent Protein by Rational Design. ACS Omega 2023, 8, 436–443. [Google Scholar] [CrossRef]
  17. Jung, G.; Wiehler, J.; Zumbusch, A. The Photophysics of Green Fluorescent Protein: Influence of the Key Amino Acids at Positions 65, 203, and 222. Biophys. J. 2005, 88, 1932–1947. [Google Scholar] [CrossRef]
  18. Khrameeva, E.E.; Drutsa, V.L.; Vrzheshch, E.P.; Dmitrienko, D.V.; Vrzheshch, P.V. Mutants of Monomeric Red Fluorescent Protein mRFP1 at Residue 66: Structure Modeling by Molecular Dynamics and Search for Correlations with Spectral Properties. Biochemistry 2008, 73, 1085–1095. [Google Scholar] [CrossRef]
  19. Don Paul, C.; Traore, D.A.K.; Olsen, S.; Devenish, R.J.; Close, D.W.; Bell, T.D.M.; Bradbury, A.; Wilce, M.C.J.; Prescott, M. X-Ray Crystal Structure and Properties of Phanta, a Weakly Fluorescent Photochromic GFP-Like Protein. PLoS ONE 2015, 10, e0123338. [Google Scholar] [CrossRef]
  20. Don Paul, C.; Kiss, C.; Traore, D.A.K.; Gong, L.; Wilce, M.C.J.; Devenish, R.J.; Bradbury, A.; Prescott, M. Phanta: A Non-Fluorescent Photochromic Acceptor for pcFRET. PLoS ONE 2013, 8, e75835. [Google Scholar] [CrossRef]
  21. Liu, Y.; Ke, M.; Gong, H. Protonation of Glu(135) Facilitates the Outward-to-Inward Structural Transition of Fucose Transporter. Biophys. J. 2015, 109, 542–551. [Google Scholar] [CrossRef] [PubMed]
  22. Arunan, E.; Desiraju, G.R.; Klein, R.A.; Sadlej, J.; Scheiner, S.; Alkorta, I.; Clary, D.C.; Crabtree, R.H.; Dannenberg, J.J.; Hobza, P.; et al. Definition of the hydrogen bond (IUPAC Recommendations 2011). Pure Appl. Chem. 2011, 83, 1637–1641. [Google Scholar] [CrossRef]
  23. Wachter, R.M.; Elsliger, M.A.; Kallio, K.; Hanson, G.T.; Remington, S.J. Structural Basis of Spectral Shifts in the Yellow-Emission Variants of Green Fluorescent Protein. Structure 1998, 6, 1267–1277. [Google Scholar] [CrossRef]
  24. Battad, J.M.; Wilmann, P.G.; Olsen, S.; Byres, E.; Smith, S.C.; Dove, S.G.; Turcic, K.N.; Devenish, R.J.; Rossjohn, J.; Prescott, M. A Structural Basis for the pH-Dependent Increase in Fluorescence Efficiency of Chromoproteins. J. Mol. Biol. 2007, 368, 998–1010. [Google Scholar] [CrossRef]
  25. Andresen, M.; Stiel, A.C.; Trowitzsch, S.; Weber, G.; Eggeling, C.; Wahl, M.C.; Hell, S.W.; Jakobs, S. Structural Basis for Reversible Photoswitching in Dronpa. Proc. Natl. Acad. Sci. USA 2007, 104, 13005–13009. [Google Scholar] [CrossRef]
  26. Gotthard, G.; von Stetten, D.; Clavel, D.; Noirclerc-Savoye, M.; Royant, A. Chromophore Isomer Stabilization Is Critical to the Efficient Fluorescence of Cyan Fluorescent Proteins. Biochemistry 2017, 56, 6418–6422. [Google Scholar] [CrossRef]
  27. Agirre, J.; Atanasova, M.; Bagdonas, H.; Ballard, C.B.; Baslé, A.; Beilsten-Edmands, J.; Borges, R.J.; Brown, D.G.; Burgos-Mármol, J.J.; Berrisford, J.M.; et al. The CCP4 Suite: Integrative Software for Macromolecular Crystallography. Acta. Crystallogr. D Struct. Biol. 2023, 79, 449–461. [Google Scholar] [CrossRef] [PubMed]
  28. McCoy, A.J.; Grosse-Kunstleve, R.W.; Adams, P.D.; Winn, M.D.; Storoni, L.C.; Read, R.J. Phaser Crystallographic Software. J. Appl. Crystallogr. 2007, 40, 658–674. [Google Scholar] [CrossRef]
  29. Afonine, P.V.; Grosse-Kunstleve, R.W.; Echols, N.; Headd, J.J.; Moriarty, N.W.; Mustyakimov, M.; Terwilliger, T.C.; Urzhumtsev, A.; Zwart, P.H.; Adams, P.D. Towards Automated Crystallographic Structure Refinement with Phenix.Refine. Acta Crystallogr. D Biol. Crystallogr. 2012, 68, 352–367. [Google Scholar] [CrossRef]
  30. Emsley, P.; Lohkamp, B.; Scott, W.G.; Cowtan, K. Features and Development of Coot. Acta. Crystallogr. D Biol. Crystallogr. 2010, 66, 486–501. [Google Scholar] [CrossRef]
  31. Murshudov, G.N.; Skubák, P.; Lebedev, A.A.; Pannu, N.S.; Steiner, R.A.; Nicholls, R.A.; Winn, M.D.; Long, F.; Vagin, A.A. REFMAC5 for the Refinement of Macromolecular Crystal Structures. Acta. Crystallogr. D Biol. Crystallogr. 2011, 67, 355–367. [Google Scholar] [CrossRef] [PubMed]
Figure 1. Absorbance of TGP-E (green dashed) and YTP-E E148D (yellow dashed) normalized to the highest absorbance after 280 nm. The emission spectra of TGP-E (green solid) and YTP-E E148D (yellow solid) with excitation normalized to the highest fluorescent value.
Synbio 02 00018 g001
Figure 2. (A) pH stability of YTP-E E148D plotted as percent fluorescence. The sample with the highest fluorescence (pH 10) was set to 100% fluorescence. This data was performed as duplicate trials in triplicate. (B) The chemical stability of YTP-E E148D was assayed as % fluorescence in increasing concentrations of guanidine hydrochloride. One-hundred percent fluorescence was set to the fluorescence with 0 M guanidine hydrochloride present. (C) The thermostability was measured using a real-time PCR instrument. Three rounds of temperature increase to 100 °C followed by rapid temperature return to 25 °C were repeated. Temperature is plotted on the right axis with a grey line. Each cycle of temperature increases to 100 °C followed by a decrease to 25 °C is plotted in a different colour (cycle 1 is red, cycle 2 is orange, and cycle 3 is green). The left axis measures the percent fluorescence with the first cycle percent fluorescence at 25 °C prior to heating set to 100%. This assay was performed in quadruplicate.
Synbio 02 00018 g002
Figure 3. (A) TGP-E global structure alignment of molecule A (pink) and molecule B (green). (B) Chromophore and S146 and L213 electron density shown as blue netting (2mFo-DFc contoured at 1σ) of TGP-E molecule B.
Synbio 02 00018 g003
Figure 4. (A) Overlay of TGP-E molecule A (pink), molecule B (green), and TGP molecule A (purple: PDB: 4TZA) with the chromophore hydrogen bond network shown near the chromophore phenol. (B) Overlay of TGP-E molecule A (pink), molecule B (green), and TGP molecule A (purple: PDB: 4TZA) with the chromophore hydrogen bond network shown near the altered portion of the chromophore. For both A and B, hydrogen bonds with differing lengths are coloured orange (TGP-E) and yellow (TGP), respectively. Hydrogen bonds with the same length in all molecules are coloured black. Key residues interacting with the chromophore are shown as sticks and labelled.
Synbio 02 00018 g004
Figure 5. (A) Chromophore of molecule A YTPE E148D with electron density (2mFo-DFc contoured at 1σ) (B) Chromophore of molecule B YTPE E148D with electron density (2mFo-DFc contoured at 1σ) (C) Chromophore of molecule C YTPE E148D with electron density (2mFo-DFc contoured at 1σ) (D) Chromophore of molecule D YTPE E148D with electron density (2mFo-DFc contoured at 1σ).
Synbio 02 00018 g005
Figure 6. An overlay of YTP-E E148D molecules A (cyan), B (salmon), C (yellow), and D (pink). Hydrogen bond interactions and distances to nearby residues are labelled with the same colour as the corresponding molecule.
Synbio 02 00018 g006
Figure 7. (A) An overlay of YTP-E E148D molecule A (cyan) with TGP-E (green). Hydrogen bond distances are coloured to match the molecule colour. The water molecules shown are from TGP-E. (B) An overlay of YTP-E E148D molecule A (cyan) with YTP (RCSB PDB 1YFP) (orange). Hydrogen bond distances and residue names are coloured to match the molecule colour.
Synbio 02 00018 g007
Table 1. Data collection and processing. Values given in parenthesis are for the highest resolution shell.
TGP-EYTP-E E148D
Diffraction source Rigaku XtaLab Synergy-SRigaku XtaLab Synergy-S
Wavelength (Å) 1.541.54
Temperature (K)100100
DetectorHyPix-6000HEHyPix-6000HE
Crystal-to-detector distance (mm)36.3436.34
Rotation range per image (°)0.50.15
Exposure time per image (s)4521.29
Space groupP1P 1 21 1
a, b, c (Å)38.74, 49.06, 59.1142.78, 137.78, 74.56
α, β, γ (°)78.55, 72.08, 71.4190.00, 97.71, 90.00
Mosaicity (°)1.371.23
Resolution range (Å)20.42–2.0020.32–3.00
Total no. of reflections149,158 (10,544)79,636 (15,409)
No. of unique reflections26,322 (1957)16,717 (2738)
Completeness (%)99.9 (100.0)98.6 (97.0)
Redundancy5.7 (5.4)4.8 (5.6)
<I/σ(I)> from merged data7.6 (2.1)11.5 (5.7)
CC1/20.990 (0.776)0.986 (0.970)
Rr.i.m. or Rmeas0.125 (0.552)0.051 (0.099)
Overall B factor from Wilson plot (Ã2) 12.6830.84
Table 2. Structure Refinement. Values given in parenthesis are for the highest resolution shell.
TGP-EYTP-E E148D
Resolution range (Å)20.42–2.0020.32–3.00
Completeness (%)99.75 (100.0)97.37 (99.71)
No. of reflections, working set26,282 (2606)16,706 (1702)
No. of reflections, test set1248 (124)1671 (170)
Final Rcryst0.1692 (0.2078)0.2207 (0.3394)
Final Rfree0.2291 (0.2821)0.2807 (0.4392)
No. of non-H atoms3706126
Protein/nucleic acid34296787
Ions00
Ligands4896
Waters42230
Total37066913
R.m.s. deviations from idealityMolprobity validationMolprobity validation
Bonds (Å)0.0360.003
Angles (°)2.10.67
Average B factors (Å2)16.3631.08
Protein/nucleic acid16.0531.04
IonsN/AN/A
Ligands9.0337.65
Waters22.5619.74
Ramachandran plotMolprobity validationMolprobity validation
Favoured regions (%)99.5296.26
Outliers (%)00.00
Disclaimer/Publisher’s Note: The statements, opinions and data contained in all publications are solely those of the individual author(s) and contributor(s) and not of MDPI and/or the editor(s). MDPI and/or the editor(s) disclaim responsibility for any injury to people or property resulting from any ideas, methods, instructions or products referred to in the content.