Abstract
Despite the recent pandemic, the origin of its causative agent, SARS-CoV-2, remains controversial. This study identifies several prototype SARS-CoV-2 variants (proto-variants) that are descendants of the Wuhan variant. A thorough evaluation of the evolutionary histories of the genomes of these proto-variants reveals that most mutations in proto-variants were biased toward mutations that change the amino acid sequence. While these nonsynonymous substitutions (N mutations) were common in SARS-CoV-2 proto-variants, nucleotide changes that do not result in an amino acid change, termed synonymous substitutions (S mutations), dominate the mutations found in other RNA viruses. The N mutation bias in the SARS-CoV2 proto-variants was found in the spike gene as well as several other genes. The analysis of the ratio of N to S mutations in general RNA viruses revealed that the probability that an RNA virus spontaneously evolves a proto-variant is between 1.5 × 10⁻⁹ and 2.7 × 10⁻²⁶ under natural conditions. These results suggest that SARS-CoV-2 variants did not emerge via a canonical route.
1. Introduction
The SARS-CoV-2 Omicron variant (strain B.1.1.529) was first identified in Botswana [1] and reported to the World Health Organization (WHO) from South Africa on 24 November 2021 [2]. The Omicron variant carries many novel mutations in its spike gene [3,4,5]. The large number of mutations and their uniqueness led to concerns that the Omicron variant could effectively evade the immune responses elicited by the existing COVID-19 vaccines [1].
Mutations in viral proteins are a normal part of viral evolution and are expected in the case of SARS-CoV-2, given its prevalence. However, the Omicron variant is unique as it acquired many mutations suddenly, a pattern of evolution more consistent with punctuated rather than Darwinian evolution. Given this highly unusual evolutionary trajectory, the origins of the Omicron variant are an active topic of debate among scientists [1,2]. The current hypotheses regarding the origins of the Omicron variant include that (1) it arose in immunosuppressed patients chronically infected with COVID-19 [6], (2) it slowly evolved over months in a community with little or no viral surveillance infrastructure [1,2], (3) the Omicron variant evolved in a non-human host, such as mice [7], before spilling over into a human again with a new repertoire of mutations. Bats [8] and pangolins [9] have been implicated as the putative species of the origin of SARS-CoV-2, with cats [10] implicated as a possible source of SARS-CoV-2 variants. Despite considerable research efforts, the origin of the Omicron variant and other SARS-CoV-2 variants has yet to be definitively identified.
There are several well-established ways in which organisms change and adapt over time. One of these paths—Darwinian evolution—holds that beneficial genetic traits, N mutations, survive competition by natural selection. However, genetic changes that alter the amino acid sequence of their associated protein are relatively rare. Thus, most genetic mutations are S mutations. These changes are not associated with an altered protein structure or a fitness effect and are fixed in the genome by random drift in a process called neutral evolution [11]. The ratio of N to S mutations provides a way to estimate the balance between neutral mutations, purifying selection, and beneficial mutations [12].
N and S mutations naturally accumulate in a viral genome over time; therefore, each new proto-variant of the SARS-CoV-2 should contain a mixture of both mutational signatures, with a bias toward the more common silent S mutations. Large-scale global viral genome analyses have thoroughly described the characteristics [13,14,15] and fitness [16] of the evolutionary variants of SARS-CoV-2 and the impact of vaccines upon them [17]. This wealth of data makes it possible to analyze the sequences of SARS-CoV-2 proto-variants and determine how they have changed from the Wuhan prototype (proto-Wuhan). The high proportion of N mutations in the genomes of SARS-CoV-2 proto-variants strongly suggests that these variants did not emerge via canonical evolutionary trajectories.
2. Results
2.1. Putative Ancestral Sequences of SARS-CoV-2 Variants
This study focused on how the prototype of each SARS-CoV-2 variant, including Omicron, has evolved from the Wuhan variant. Each sequence is expected to be slightly different from its prototype because the virus accumulates diversity via mutations, deletions, and insertions after the variant’s prototype emerges. In addition, deep-sequencing errors and other factors may affect each sequence. Ten or more of the earliest sequences of each variant collected in the GISAID database [3] were used to characterize their ancestor sequences. The ancestral prototypes of SARS-CoV-2 variants were identified by the shared and conserved sequences among the sequences of each variant and named “proto-variants”. The molecular phylogenetic tree of the ancestral sequences shows that they are distinct descendants of the ancestral Wuhan SARS-CoV-2, proto-Wuhan (Figure 1A). The mutational spectrums of the variants were identified by comparing the sequences of the proto-variants with that of proto-Wuhan.
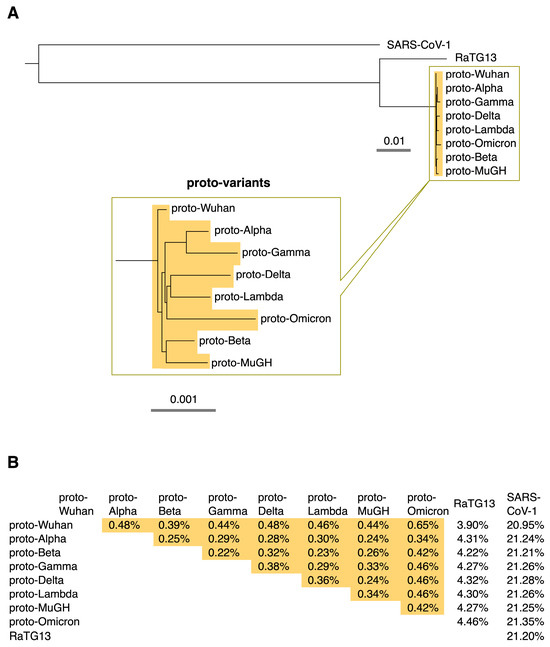
Figure 1.
(A) Phylogenetic tree. The ancestral type of each SARS-CoV-2 variant was named its “proto-variant”. The evolutionary relationships among proto-variants are expanded below. The scale shows their evolutionary distance. (B) Percentage differences among proto-variants, RaTG13, and SARS-CoV-1. Differences among proto-variants are highlighted in orange.
Interestingly, variation among the proto-variants is limited; the proto-variants differ from RaTG13 by about 4% and SARS-CoV-1 by about 21%, but the variation among the proto-variants is generally less than 0.5% (Figure 1B). This result raises the question of whether the proto-variants have indeed accumulated many mutations, although it is generally believed that SARS-CoV-2 has a high mutation rate [1].
2.2. Nonsynonymous Substitution (N Mutation) Bias of SARS-CoV-2 Variants
SARS-CoV-1 is the coronavirus that caused SARS [18], and the bat coronavirus RaTG13 is thought to be one of the proximal origins of SARS-CoV-2 [8]. A comparison of the mutational spectra between SARS-CoV-1, RaTG13, and proto-Wuhan showed that synonymous substitutions (S mutations) were more frequent than N mutations in most genes (Figure 2A). While the spike gene is 3.8 kb, ORF1ab is a large ORF, extending over 21.3 kb and accounting for 71.2% of the 30 kb of the SARS-CoV-2 genome. The sizes of other genes, ORF3a, E, M, ORF6, ORF7a, NS7b, ORF8, and N, are small. Given the size of each gene, it makes sense that ORF1ab is more frequently mutated than other genes.
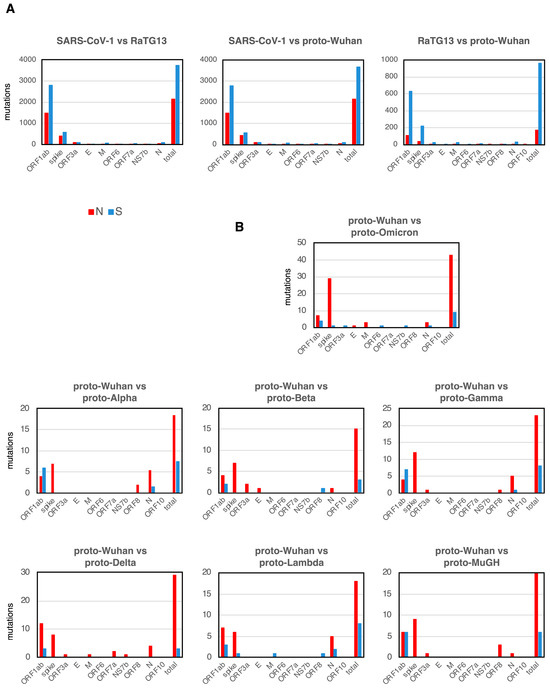
Figure 2.
N and S mutations. (A) N and S mutations of each gene among SARS-CoV-1, RaTG13, and proto-Wuhan. (B) Those from proto-Wuhan to the different proto-variants.
Interestingly, the accumulation of new mutations in the proto-variants shows a striking bias toward N mutations. However, the net accumulation of new mutations in each proto-variant is limited compared to SARS-CoV1, RaTG13, and proto-Wuhan, reflecting their close evolutionary distances (Figure 2B). Proto-Omicron harbored the most mutations and represented the most divergent variant of proto-Wuhan (Figure 2B). In addition to one insertion and five deletions (Table 1), proto-Omicron has 52 mutations, of which 30 are located in the spike gene (Figure 2B). Of note, 29 of the 30 mutations in the gene encoding the spike protein are N mutations (Figure 2B), while S mutations are concentrated in ORF1ab. When ORF1ab is excluded from Omicron’s total mutations, 36 out of the 41 are N mutations (87.8%).

Table 1.
Sequence changes other than N or S mutations.
I observed a similar trend in the other mutants (Figure 2B), with most proto-variant mutations concentrated in the genes encoding the spike protein and ORF1ab. Other genes had very few mutations. Interestingly, only proto-Omicron and proto-Lambda had one S mutation in the gene encoding the spike protein. The highest concentration of S mutations was located in ORF1ab.
2.3. The Lack of Neutral Evolution in the Spike Gene of SARS-CoV-2 Variants
The total number of possible S and N mutations varies across codons. For example, a single nucleotide substitution of the Leu codon TTA can generate nine different codons. Of these, seven will be N mutations, while two will result in S mutations. Therefore, to compare the mutational landscapes of genes with different lengths, it is necessary to normalize by the number of possible N and S mutations. The mutation frequency can then be expressed as the ratio of N mutations per N sites (dN) to the number of S mutations per S sites (dS). A dN/dS ratio greater than 1 indicates positive selection, while a ratio less than 1 suggests neutral evolution [12].
The evolution of many coronaviruses was evaluated using the well-established principles of dN/dS. Most genes showed dN/dS ratios of less than 1 during the evolution of SARS-CoV-1, RaTG13, and proto-Wuhan, which indicated neutral evolution (Figure 3A).
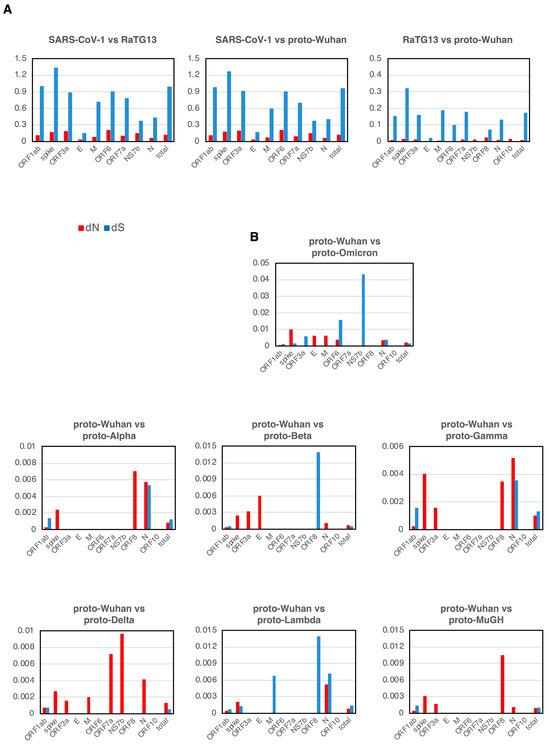
Figure 3.
dN and dS (A) dN and dS in each gene of SARS-CoV-1, RaTG13, and proto-Wuhan. (B) dN and dS from proto-Wuhan to the respective proto-variants. dN is the N mutations per N sites, and dS is the S mutations per S sites. When there is no selective pressure and mutations are introduced randomly, the ratio of dN to dS is 1.
Mutational signatures from proto-Wuhan to its descendant proto-variants are shown in Figure 3B. The dN and dS of genes other than ORF1ab or the spike gene are over-represented, reflecting their small sizes (Figure 3B). The dN of ORF1ab was consistently lower than its dS in all the variants except for proto-Delta. Conversely, the dN of the spike gene is notably higher than its dS across all of the proto-variants. The dN/dS ratios of the spike gene of proto-variants are in striking contrast to those observed during the evolution of SARS-CoV-1, RaTG13, and proto-Wuhan. Thus, the spike gene of these SARS-CoV-2 variants appears to deviate from a neutral evolutionary trajectory.
In addition, most proto-variants had dN-only genes in addition to the spike gene (Table 2). The E and M of Proto-Omicron had only dN. Proto-Delta, which has the most pronounced N bias, had only dN in its spike, ORF3a, M, ORF7a, NS7b, and N. Proto-Alpha, Proto-Beta, Proto-Gamma, and Proto-MuGH also had genes with only dN among ORF3a, E, ORF8, and N.
Table 2.
Genes without S mutations.
2.4. Low dN/dS of RNA Viruses Other Than Proto-Variants
To gain a comprehensive understanding of the evolutionary trajectory of SARS-CoV-2 within the context of RNA virus evolution, I also analyzed the dN/dS ratios of the 17 mammalian lineages presented by Nikolaev et al. [19] and those of 29 different viruses reported by Lin et al. [20] (Figure 4A). Because coronaviruses were not included in Lin et al., I also included data from RdRp and the spike-protein-coding genes of human seasonal coronaviruses published by Kistler et al. [21].
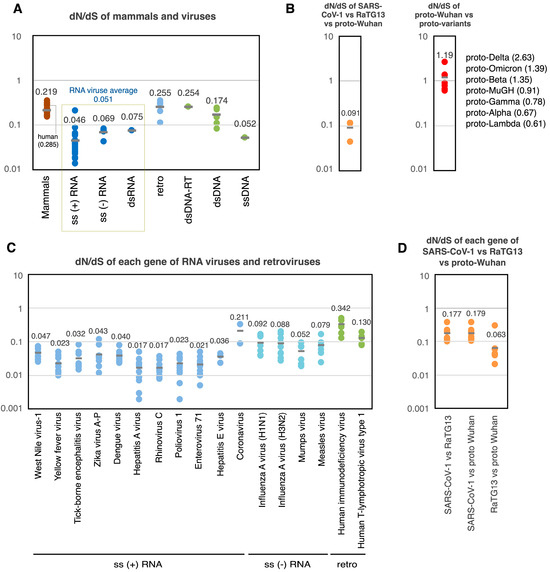
Figure 4.
dN/dS values of proto-variants and various viruses. (A) dN/dS of mammals and various viruses. Each dot indicates the dN/dS of the entire coding region of each genome. (B) dN/dS of SARS-CoV-1 vs. RaTG13 vs. proto-Wuhan (left). dN/dS of proto-Wuhan vs. proto-variants (right). (C) dN/dS of each gene of RNA viruses and retroviruses. Each dot indicates the dN/dS of the coding region of the respective gene. (D) dN/dS of each gene in SARS-CoV-1 vs. RaTG13 vs. proto-Wuhan. Data on mammals are from Nikolaev et al. [19], data on non-coronaviruses are from Lin et al. [20], and data on coronaviruses are from Kistler et al. [21].
The analysis of this data set revealed that the distribution of dN/dS across mammals and viruses’ genomes was consistently less than one [19] (Figure 4A). The dN/dS ratio of retroviruses was 0.255, while DNA viruses ranged from 0.052 to 0.254. Finally, RNA viruses featured dN/dS ratios ranging from 0.046 to 0.075, averaging 0.051 [20]. S mutations are more common than N mutations in RNA viral genomes. This could be due to the elevated rates of mutation that their genomes experience, which result from a lack of RNA repair. Like other RNA viruses, the average dN/dS ratio among the SARS-CoV-1, RaTG13, and proto-Wuhan was 0.091 (Figure 4B left). However, the dN/dS of the proto-variants ranged from 0.61 (proto-Lambda) to 2.63 (proto-Delta), averaging 1.19 (Figure 4B right).
Further analysis of the dN/dS ratios of the individual genes of RNA viruses and retroviruses showed that neutral evolution predominates under normal conditions, with the dN/dS of viral genes being less than 1 (Figure 4C). The same was true for individual genes from SARS-CoV-1, RaTG13, and proto-Wuhan, which featured dN/dS ratios ranging from 0.063 to 0.179 (Figure 4D). Strikingly, however, many of the genes in the proto-variants lacked S mutations (Table 2). Some genes did contain N mutations despite the lack of S mutations, showing an infinite dN/dS. S mutations are not thought to influence gene function and should accumulate over time due to replication errors as the virus propagates.
2.5. The Probability of the Spontaneous Emergence of Proto-Variants
My analysis reveals that the dN/dS ratios of the proto-variants included in this study are remarkably high. This intriguing observation raises a question: Is it possible to calculate the probability of the natural emergence of proto-variants within the context of RNA virus evolution? The average value of dN/dS for general RNA viruses is 0.051 (Figure 4A and Figure 5A). Because the dN/dS is N mutations/N sites divided by S mutations/S sites, by transforming this equation, the ratio of N mutations/S mutations can also be expressed as a multiplication of dN/dS and N sites/S sites. The N sites/S sites per gene for proto-Wuhan is 3.75 ± 0.46, and the N sites/S sites of its entire coding region is 3.68 (Figure 5A). Multiplying dN/dS (0.051) and N sites/S sites (3.68) generates a ratio of N mutations/S mutations that is 0.188. Thus, assuming that the proto-variants follow a neutral evolution similar to general RNA viruses, the N mutation ratios of proto-variants are expected to be 15.8%.
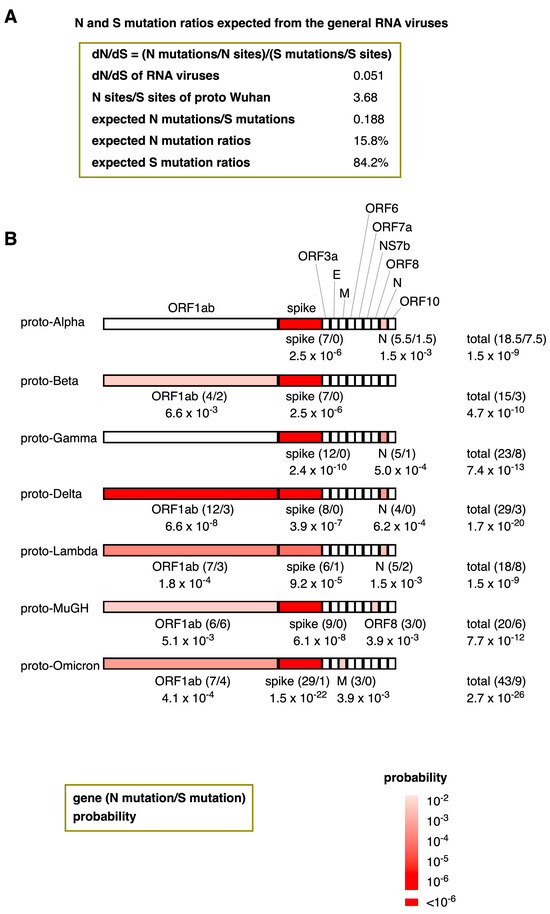
Figure 5.
The probability of the natural emergence of proto-variants expected from the dN/dS ratios of general RNA viruses. (A) N and S mutation ratios of proto-variants expected from general RNA viruses. By transforming the dN/dS equation, the ratio of N mutations/S mutations can be expressed as a multiplication of dN/dS and N sites/S sites. (B) The probability of the natural emergence of proto-variants and their genes. The number of N and S mutations (in brackets) and their probabilities are shown below the genes. Supposing the N mutation ratio is 15.8% and the number of N and S mutations are “n” and “s”, the probability “P” can be calculated based on the Bernoulli trial via the binomial distribution formula: P = n+sCn 0.158n × 0.842s. Here, n+sCn means (n+s)!/(n! × s!). Only genes with probabilities less than 1% were colored in red. The heatmap’s color intensity indicates the probability; probabilities less than one in a million were considered almost impossible and highlighted in deep red.
A trial with a constant probability of success, where only one of the two types of events occurs in one trial, is called a Bernoulli trial. Assuming that the N mutation ratio, p, is constant, the probability of accumulating N and S mutations (n and s, respectively) follows a binomial distribution in a Bernoulli trial; its probability, “P,” can be calculated by the binomial distribution formula: P = n+sCn pn (1 − p)s.
Thus, the probability of the spontaneous emergence of these proto-variants was assessed by a binomial distribution. Figure 5B shows the probability of the natural emergence of proto-variants and their genes following the N mutation ratio of 15.8%. For instance, because the spike gene of proto-Alpha has 7 N mutations without any S mutations, the formula can calculate its probability to be 7C0 0.1587 × 0.8420 = 2.5 × 10⁻⁶. All the proto-variants assessed contained at least one gene with a mutation probability of < 1% (Figure 5B). The most common gene with a low probability among the proto-variants was the gene encoding the spike protein, with probabilities ranging from 9.2 × 10⁻⁵ in Proto-Lambda to 1.5 × 10⁻²² in Omicron. Additionally, the ORF1ab in Proto-Delta was heavily N-biased, with a probability of 6.6 × 10⁻⁸. Similar N trends were also observed in the ORF1ab (proto-Beta, proto-Delta, proto-Lambda, proto-MuGH, and proto-Omicron), in the M gene (proto-Omicron), ORF8 (proto-MuGH), and the N genes (proto-Alpha, proto-Gamma, proto-Delta, and proto-Lambda). The probability of the spontaneous emergence of proto-variants ranged from 1.5 × 10⁻⁹ (proto-Alpha and proto-Lambda) to 2.7 × 10⁻²⁶ (proto-Omicron).
3. Discussion
The origin and evolution of SARS-CoV-2 have been actively debated since its emergence. To address this open question, I used a thorough analysis of the genomes of SARS-CoV-2, relevant variants, and other RNA viruses. My analysis—focused on the genomic differences between the early Wuhan variant and later proto-variants—strongly suggests that the proto-variants did not emerge via canonical virus evolution.
Several groups have recently reported that the coding sequence of the spike protein harbors an N mutation bias in the Omicron variant [14,15,16,17]. This is even more pronounced in the coding sequences of the spike protein and other genes in all the proto-variants analyzed in this study.
Mutations in the proto-variants are highly biased toward N mutations (Figure 2), and this observation is even more apparent when considering the nature of the total mutational load in these genomes (Figure 3). This bias toward N mutations does not appear in the genomes of proto-Wuhan from RaTG13 and SARS-CoV-1, whose genomes are dominated by S mutations (Figure 2 and Figure 3). This makes the N mutational bias unique to the proto-variants evaluated here. Compared to other RNA viruses, the probability of the stochastic emergence of the mutant gene that encodes the spike protein is incredibly low, ranging from 9.2 × 10⁻⁵ to 1.5 × 10⁻²² (Figure 5B). Additionally, ORF1ab, N, and other genes of some proto-variants evaluated herein also have low probabilities of spontaneous emergence. The likelihood that these proto-variants have emerged naturally ranges from 1.5 × 10⁻⁹ to 2.7 × 10⁻²⁶ (Figure 5B), like the probability of a lottery ticket, with a probability of 1 in 100 million being won repeatedly and many times.
The inconsistency of dN/dS is not only a matter of proto-variants, RaTG13, and SARS-CoV-1. Curiously, the dN/dS of spike genes significantly varies depending on human seasonal and animal coronaviruses [21,22,23]. In addition, proto-Wuhan did not acquire any S mutations in its NS7b or ORF10 sequences during its evolution from RaTG13 (Table 2). The purpose of this study is to reconsider whether the SARS-CoV-2 variants emerged through natural evolution. However, it is difficult to determine which coronaviruses evolved naturally. Thus, I used general RNA viruses’ dN/dS ratios to view the proto-variants’ evolution comprehensively. Nevertheless, even if any general viruses’ dN/dS values in Figure 4A or Figure 4C were used, the natural emergence probabilities of the proto-variants were still astronomically low.
The emergence of these proto-variants without following natural evolution means that the rules of thumb for virus evolution learned from past influenza and other pandemics do not apply to SARS-CoV-2 variants. In other words, the problem is the unpredictability of the newly emerging variants’ infectivity, virulence, or aggressiveness.
Recent studies suggest that SARS-CoV-2 behaves like a bacteriophage and replicates in intestinal bacteria [24]. Indeed, bacteriophage genomes mutate through replication errors, generating phage diversity and contributing to their adaptation to host bacteria, while phage mutation rates vary widely depending on the phages, host bacteria, and selective pressures [25,26]. Nevertheless, the SARS-CoV-2 variants were adapted to human infection when they emerged during the pandemic [1], limiting the possibility that the proto-variants evolved from the Wuhan variant in non-human hosts.
The spike protein of coronaviruses mediates the transmission of the virus; it functions as a fusogen, which mediates membrane fusion after binding to the ACE2 receptor [27]. Selective pressure on the spike gene depends on human ACE2-mediated cell transmission. Therefore, generally, the spike protein will not accept random amino acid changes to maintain the function of the fusogen.
Mutation and selection usually occur stepwise; a mutation is fixed after its functional selection, followed by the next mutation and selection. N mutations rarely improve protein function, and they can often be detrimental. Purifying selection removes N mutations that damage enzymatic activity or protein structure, thus reducing the number of N mutations in critical genes. On the other hand, S mutations rarely elicit phenotypic change; therefore, they are not generally subject to purifying selection unless they drastically reduce translation efficiency. Thus, S mutations tend to accumulate during evolution. Since the rate of S mutations is usually similar among different genes, S mutations can be used as a molecular clock for dating the evolutionary time of closely related species [28]. Surprisingly, S mutations are significantly less prevalent than N mutations among the SARS-CoV-2 proto-variants. Proto-variants lack S mutations in their spike gene, suggesting that its evolution was outside a classic trial-and-error mutation and selection scheme.
Though S mutations in a gene do not change the resulting protein’s amino acid sequence or function, many can improve translation efficiency. For this reason, both Pfizer and Moderna mRNA-based vaccines encode for a full-length spike gene, whose amino acid sequence is nearly identical to that of the Wuhan SARS-CoV-2 spike gene [29]. However, to increase translation, the spike protein coding sequence in these mRNA vaccines was heavily modified with S mutations [30]. Thus, given the advantage S mutations can carry, codon usage cannot explain the under-representation of S mutations in the spike genes of multiple proto-variants. Indeed, it should result in increased S mutations.
The analyzed SARS-CoV-2 variants have evolved novel spike proteins quickly while maintaining high transmission rates. The spike genes of these variants do not appear to have undergone neutral evolution (Figure 5B).
Of note, S mutations are also achieved during artificial evolution for gain-of-function purposes using somatic hypermutations in a cell line [31]. Thus, natural and even artificial evolution did not occur during the proto-variants’ evolution. However, the lack of S mutation in the spike gene could be explained if one postulates that spike genes with specific mutations have been “artificially inserted” into the viral genome. Depending on the proto-variant, in addition to the spike gene, ORF1ab, M, ORF8, and N are also likely to be artificial genes (Figure 5B). Technically, site-directed mutagenesis can introduce specific mutations via seamless cloning or genome editing.
The evolution of SARS-CoV-2 remains a mystery, as does the controversy over how SARS-CoV-2 acquired the furin cleavage site [32]. Furthermore, we recently reported that commercially available oligonucleotides are often cross-contaminated with diverse and unrelated nucleotide sequences [33]. Interestingly, a cross-contaminated SARS-CoV-2 oligo was identified in an unrelated oligo ordered before the virus was formally recognized in January 2019 [33].
4. Materials and Methods
4.1. Collection of Genomes
To identify the prototype of each SARS-CoV-2 variant, it is necessary to minimize the effects of mutations, deletions, and insertions accumulated during the variants’ evolution, as well as errors in deep sequencing or other factors. For this purpose, the earliest collection of 10 or more sequences of each variant was downloaded from the GISAID database (https://www.gisaid.org/, accessed on 28 December 2021) [3]. Sequences of Wuhan SARS-CoV-2 were also retrieved from Genbank. The accession numbers are summarized in Supplementary Table S1. Table S2 acknowledges the authors responsible for these SARS-CoV-2 sequences.
4.2. Genome Analysis
SARS-CoV-2 genome sequences were aligned using the alignment tool of CLC Genomics Workbench (QIAGEN, Aarhus, Denmark) to identify the ancestral prototypes of SARS-CoV-2 variants (proto-variants) via the shared and conserved sequences among the sequences of each variant. Phylogenetic trees were constructed using the neighbor-joining algorithm [34] using the CLC Genomics Workbench tree tool. Jukes-Cantor was used for distance measurements. Bootstrap resampling was performed with 100 replications. The sequences of proto-variants and their alignment, crucial for further research, are readily accessible at the widely used open repository zenodo, https://zenodo.org/record/6601991#.Y7bR_S3qO2x, accessed on 14 August 2024.
4.3. Mutation Analysis
Each mutation of the proto-variants was identified by aligning the proto-variant sequences to proto-Wuhan using the alignment tool of CLC Genomics Workbench. dN/dS values were analyzed by the LWL method [35] using the KaKs calculator [36], which calculates nonsynonymous and synonymous substitution rates through model selection and averaging. While the number of N and S sites in proto-Wuhan was calculated by comparing proto-Wuhan and proto-Alpha, the numbers were similar between proto-Wuhan and the other proto-variants.
4.4. dN/dS of Viruses and Mammals
dN/dS values for mammals are from Nikolaev et al. [19], who estimated the dN/dS values of 17 mammalian lineages using 218 protein-coding genes by Goldman and Yang [37]. The dN/dS values of 4 seasonal human coronaviruses are from Kistler et al. [21], who calculated the dN/dS values for RdRp and spike using a mixed-effects model of evolution (MEME) [38]. The dN/dS values of viruses other than coronaviruses, critical data to compare with the proto-variants, are from Lin et al. [20], who analyzed the dN/dS values of each gene and the entire (concatenated) coding region of each virus genome using the LWL method.
The list of mammals is as follows: Armadillo, Baboon, bat, Chimpanzee, Cow, Dog, Elephant, Galago, Gray short-tailed opossum, human, Macaque, Marmoset, Mouse, Rabbit, Rat, Shrew, and Tenrec [19]. The list of seasonal human coronaviruses is as follows: OC43, 229E, NL63, and HKU1 [21]. The list of other viruses is as follows: Adenovirus C, BK polyomavirus, Dengue virus serotype 1, Ebola virus, Hepatitis A virus, Hepatitis B virus, Hepatitis C virus, Hepatitis E virus, Herpes Simplex Virus 1, Human immunodeficiency virus, Human enterovirus 71, Human papillomavirus type 16, Human parvovirus B19, Human poliovirus 1, Human T-lymphotropic virus type 1, Influenza A virus (H1N1), Influenza A virus (H3N2), JC polyomavirus, Measles virus, Mumps virus, Norovirus, Rhinovirus C, Rotavirus A, Rubella virus, Tick-borne encephalitis virus, Variola virus, West Nile Virus, Yellow fever virus, and Zika virus [20].
5. Conclusions
While it is impossible to rule out that the proto-variants emerged stochastically, the probability of such an event is exceedingly low. Classical evolutionary theories fail to explain the lack of S mutations in the proto-variants. This could suggest that SARS-CoV-2 has a fundamentally different evolutionary strategy from other related RNA viruses for which a molecular mechanism has yet to be described. Alternatively, the presence of so many N mutations combined with a lack of S mutations in several critical genes in the proto-variants’ genomes suggests that they are the byproduct of gain-of-function research.
Supplementary Materials
The following supporting information can be downloaded at https://www.mdpi.com/article/10.3390/synbio2030017/s1, Table S1: Accession number of SARS-CoV-2 variants; Table S2: GISAID acknowledgment table.
Funding
This research received no external funding.
Data Availability Statement
Sequences of the proto-variants and their alignments are available at a general-purpose open repository, zenodo; https://zenodo.org/record/6601991#.Y7bR_S3qO2x, accessed on 14 August 2024.
Acknowledgments
I am grateful to Benjamin Hershey and Ivan Psakhye for critically reading the manuscript and to Akiko Arakawa for the graphical abstract.
Conflicts of Interest
The author declares no conflicts of interest.
References
- Callaway, E. Heavily mutated Omicron variant puts scientists on alert. Nature 2021, 600, 21. [Google Scholar] [CrossRef] [PubMed]
- Kupferschmidt, K. Where did ‘weird’ Omicron come from? Science 2021, 374, 1179. [Google Scholar] [CrossRef] [PubMed]
- Shu, Y.; McCauley, J. GISAID: Global initiative on sharing all influenza data—From vision to reality. Euro Surveill. 2017, 22. [Google Scholar] [CrossRef]
- Hadfield, J.; Megill, C.; Bell, S.M.; Huddleston, J.; Potter, B.; Callender, C.; Sagulenko, P.; Bedford, T.; Neher, R.A. Nextstrain: Real-time tracking of pathogen evolution. Bioinformatics 2018, 34, 4121–4123. [Google Scholar] [CrossRef] [PubMed]
- Kandeel, M.; Mohamed, M.E.M.; Abd El-Lateef, H.M.; Venugopala, K.N.; El-Beltagi, H.S. Omicron variant genome evolution and phylogenetics. J. Med. Virol. 2021. [Google Scholar] [CrossRef] [PubMed]
- Choi, B.; Choudhary, M.C.; Regan, J.; Sparks, J.A.; Padera, R.F.; Qiu, X.; Solomon, I.H.; Kuo, H.H.; Boucau, J.; Bowman, K.; et al. Persistence and Evolution of SARS-CoV-2 in an Immunocompromised Host. N. Engl. J. Med. 2020, 383, 2291–2293. [Google Scholar] [CrossRef]
- Wei, C.; Shan, K.J.; Wang, W.; Zhang, S.; Huan, Q.; Qian, W. Evidence for a mouse origin of the SARS-CoV-2 Omicron variant. J. Genet. Genomics 2021. [Google Scholar] [CrossRef] [PubMed]
- Zhou, P.; Yang, X.L.; Wang, X.G.; Hu, B.; Zhang, L.; Zhang, W.; Si, H.R.; Zhu, Y.; Li, B.; Huang, C.L.; et al. A pneumonia outbreak associated with a new coronavirus of probable bat origin. Nature 2020, 579, 270–273. [Google Scholar] [CrossRef]
- Zhang, T.; Wu, Q.; Zhang, Z. Probable Pangolin Origin of SARS-CoV-2 Associated with the COVID-19 Outbreak. Curr. Biol. 2020, 30, 1346–1351.e1342. [Google Scholar] [CrossRef]
- Gomez-Romero, N.; Basurto-Alcantara, F.J.; Velazquez-Salinas, L. Assessing the Potential Role of Cats (Felis catus) as Generators of Relevant SARS-CoV-2 Lineages during the Pandemic. Pathogens 2023, 12, 1361. [Google Scholar] [CrossRef]
- Kimura, M. Evolutionary rate at the molecular level. Nature 1968, 217, 624–626. [Google Scholar] [CrossRef] [PubMed]
- Nei, M.; Gojobori, T. Simple methods for estimating the numbers of synonymous and nonsynonymous nucleotide substitutions. Mol. Biol. Evol. 1986, 3, 418–426. [Google Scholar] [CrossRef]
- Faraji, N.; Zeinali, T.; Joukar, F.; Aleali, M.S.; Eslami, N.; Shenagari, M.; Mansour-Ghanaei, F. Mutational dynamics of SARS-CoV-2: Impact on future COVID-19 vaccine strategies. Heliyon 2024, 10, e30208. [Google Scholar] [CrossRef]
- Xi, B.; Meng, Y.; Jiang, D.; Bai, Y.; Chen, Z.; Qu, Y.; Li, S.; Wei, J.; Huang, L.; Du, H. Analyses of Long-Term Epidemic Trends and Evolution Characteristics of Haplotype Subtypes Reveal the Dynamic Selection on SARS-CoV-2. Viruses 2022, 14, 454. [Google Scholar] [CrossRef] [PubMed]
- Fumagalli, S.E.; Padhiar, N.H.; Meyer, D.; Katneni, U.; Bar, H.; DiCuccio, M.; Komar, A.A.; Kimchi-Sarfaty, C. Analysis of 3.5 million SARS-CoV-2 sequences reveals unique mutational trends with consistent nucleotide and codon frequencies. Virol. J. 2023, 20, 31. [Google Scholar] [CrossRef]
- Bloom, J.D.; Neher, R.A. Fitness effects of mutations to SARS-CoV-2 proteins. Virus Evol. 2023, 9, vead055. [Google Scholar] [CrossRef]
- Gupta, S.; Gupta, D.; Bhatnagar, S. Analysis of SARS-CoV-2 genome evolutionary patterns. Microbiol. Spectr. 2024, 12, e0265423. [Google Scholar] [CrossRef] [PubMed]
- Marra, M.A.; Jones, S.J.; Astell, C.R.; Holt, R.A.; Brooks-Wilson, A.; Butterfield, Y.S.; Khattra, J.; Asano, J.K.; Barber, S.A.; Chan, S.Y.; et al. The Genome sequence of the SARS-associated coronavirus. Science 2003, 300, 1399–1404. [Google Scholar] [CrossRef]
- Nikolaev, S.I.; Montoya-Burgos, J.I.; Popadin, K.; Parand, L.; Margulies, E.H.; Antonarakis, S.E. Life-history traits drive the evolutionary rates of mammalian coding and noncoding genomic elements. Proc. Natl. Acad. Sci. USA 2007, 104, 20443–20448. [Google Scholar] [CrossRef]
- Lin, J.J.; Bhattacharjee, M.J.; Yu, C.P.; Tseng, Y.Y.; Li, W.H. Many human RNA viruses show extraordinarily stringent selective constraints on protein evolution. Proc. Natl. Acad. Sci. USA 2019, 116, 19009–19018. [Google Scholar] [CrossRef]
- Kistler, K.E.; Bedford, T. Evidence for adaptive evolution in the receptor-binding domain of seasonal coronaviruses OC43 and 229e. Elife 2021, 10, 64509. [Google Scholar] [CrossRef] [PubMed]
- Yu, D.; Zhao, Z.Y.; Yang, Y.L.; Qin, Y.; Pan, D.; Yuan, L.X.; Huang, Y.W.; Wang, B. The origin and evolution of emerged swine acute diarrhea syndrome coronavirus with zoonotic potential. J. Med. Virol. 2023, 95, e28672. [Google Scholar] [CrossRef] [PubMed]
- Peng, Q.; Zhang, X.; Li, J.; He, W.; Fan, B.; Ni, Y.; Liu, M.; Li, B. Comprehensive analysis of codon usage patterns of porcine deltacoronavirus and its host adaptability. Transbound. Emerg. Dis. 2022, 69, e2443–e2455. [Google Scholar] [CrossRef] [PubMed]
- Brogna, C.; Brogna, B.; Bisaccia, D.R.; Lauritano, F.; Marino, G.; Montano, L.; Cristoni, S.; Prisco, M.; Piscopo, M. Could SARS-CoV-2 Have Bacteriophage Behavior or Induce the Activity of Other Bacteriophages? Vaccines 2022, 10, 708. [Google Scholar] [CrossRef] [PubMed]
- Mavrich, T.N.; Hatfull, G.F. Bacteriophage evolution differs by host, lifestyle and genome. Nat. Microbiol. 2017, 2, 17112. [Google Scholar] [CrossRef] [PubMed]
- Kupczok, A.; Neve, H.; Huang, K.D.; Hoeppner, M.P.; Heller, K.J.; Franz, C.; Dagan, T. Rates of Mutation and Recombination in Siphoviridae Phage Genome Evolution over Three Decades. Mol. Biol. Evol. 2018, 35, 1147–1159. [Google Scholar] [CrossRef] [PubMed]
- Wrapp, D.; Wang, N.; Corbett, K.S.; Goldsmith, J.A.; Hsieh, C.L.; Abiona, O.; Graham, B.S.; McLellan, J.S. Cryo-EM structure of the 2019-nCoV spike in the prefusion conformation. Science 2020, 367, 1260–1263. [Google Scholar] [CrossRef] [PubMed]
- Gojobori, T.; Moriyama, E.N.; Kimura, M. Molecular clock of viral evolution, and the neutral theory. Proc. Natl. Acad. Sci. USA 1990, 87, 10015–10018. [Google Scholar] [CrossRef] [PubMed]
- Jackson, L.A.; Anderson, E.J.; Rouphael, N.G.; Roberts, P.C.; Makhene, M.; Coler, R.N.; McCullough, M.P.; Chappell, J.D.; Denison, M.R.; Stevens, L.J.; et al. An mRNA Vaccine against SARS-CoV-2—Preliminary Report. N. Engl. J. Med. 2020, 383, 1920–1931. [Google Scholar] [CrossRef]
- Jeong, D.-E.; McCoy, M.J.; Artiles, K.L.; Ilbay, O.; Fire, A.Z.; Nadeau, K.C.; Park, H.R.; Betts, B.E.; Boyd, S.D.; Hoh, R.A.; et al. Assemblies of putative SARS-CoV2-spike-encoding mRNA sequences for vaccines BNT-162b2 and mRNA-1273. Available online: https://virological.org/t/assemblies-of-putative-sars-cov2-spike-encoding-mrna-sequences-for-vaccines-bnt-162b2-andmrna-1273/663 (accessed on 14 August 2024).
- Arakawa, H.; Kudo, H.; Batrak, V.; Caldwell, R.B.; Rieger, M.A.; Ellwart, J.W.; Buerstedde, J.M. Protein evolution by hypermutation and selection in the B cell line DT40. Nucleic Acids Res. 2008, 36, e1. [Google Scholar] [CrossRef]
- Ambati, B.K.; Varshney, A.; Lundstrom, K.; Palú, G.; Uhal, B.D.; Uversky, V.N.; Brufsky, A.M. MSH3 Homology and Potential Recombination Link to SARS-CoV-2 Furin Cleavage Site. Front. Virol. 2022, 2, 834808. [Google Scholar] [CrossRef]
- Arakawa, H.; Miura, H.; Quadros, R.M.; Ohtsuka, M.; Gurumurthy, C.B. Cross-contamination of CRISPR guides and other unrelated nucleotide sequences among commercial oligonucleotides. Nucleic Acids Res. 2024, 52, 3137–3145. [Google Scholar] [CrossRef] [PubMed]
- Saitou, N.; Nei, M. The neighbor-joining method: A new method for reconstructing phylogenetic trees. Mol. Biol. Evol. 1987, 4, 406–425. [Google Scholar] [CrossRef] [PubMed]
- Li, W.H.; Wu, C.I.; Luo, C.C. A new method for estimating synonymous and nonsynonymous rates of nucleotide substitution considering the relative likelihood of nucleotide and codon changes. Mol. Biol. Evol. 1985, 2, 150–174. [Google Scholar] [CrossRef] [PubMed]
- Zhang, Z.; Li, J.; Zhao, X.Q.; Wang, J.; Wong, G.K.; Yu, J. KaKs_Calculator: Calculating Ka and Ks through model selection and model averaging. Genom. Proteom. Bioinform. 2006, 4, 259–263. [Google Scholar] [CrossRef]
- Goldman, N.; Yang, Z. A codon-based model of nucleotide substitution for protein-coding DNA sequences. Mol. Biol. Evol. 1994, 11, 725–736. [Google Scholar] [CrossRef]
- Murrell, B.; Wertheim, J.O.; Moola, S.; Weighill, T.; Scheffler, K.; Kosakovsky Pond, S.L. Detecting individual sites subject to episodic diversifying selection. PLoS Genet. 2012, 8, e1002764. [Google Scholar] [CrossRef] [PubMed]
Disclaimer/Publisher’s Note: The statements, opinions and data contained in all publications are solely those of the individual author(s) and contributor(s) and not of MDPI and/or the editor(s). MDPI and/or the editor(s) disclaim responsibility for any injury to people or property resulting from any ideas, methods, instructions or products referred to in the content. |
© 2024 by the author. Licensee MDPI, Basel, Switzerland. This article is an open access article distributed under the terms and conditions of the Creative Commons Attribution (CC BY) license (https://creativecommons.org/licenses/by/4.0/).