Article

First-Principles Study on Thermodynamic, Structural, Mechanical, Electronic, and Phonon Properties of tP16 Ru-Based Alloys

by
Bhila Oliver Mnisi
1,*,
Moseti Evans Benecha
2 and
Malebo Meriam Tibane
1
1
Department of Physics, Science Campus, University of South Africa, Florida 1709, South Africa
2
Center for Augmented Intelligence and Data Science, Florida Science Campus, University of South Africa, Florida 1709, South Africa
*
Author to whom correspondence should be addressed.
Alloys 2024, 3(2), 126-139; https://doi.org/10.3390/alloys3020007 (registering DOI)
Submission received: 4 March 2024 / Revised: 9 April 2024 / Accepted: 10 April 2024 / Published: 15 April 2024

Abstract

:
Transition metal-ruthenium alloys are promising candidates for ultra-high-temperature structural applications. However, the mechanical and electronic characteristics of these alloys are not well understood in the literature. This study uses first-principles density functional theory calculations to explore the structural, electronic, mechanical, and phonon properties of X3Ru (X = Sc, Ti, V, Cr, Mn, Fe, Co, Ni, Cu, and Zn) binary alloys in the tP16 crystallographic phase. We find that Mn3Ru, Sc3Ru, Ti3Ru, V3Ru, and Zn3Ru have negative heats of formation and hence are thermodynamically stable. Mechanical analysis (Cij) indicates that all tP16-X3Ru alloys are mechanically stable except, Fe3Ru and Cr3Ru. Moreover, these compounds exhibit ductility and possess high melting temperatures. Furthermore, phonon dispersion curves indicate that Cr3Ru, Co3Ru, Ni3Ru, and Cu3Ru are dynamically stable, while the electronic density of states reveals all the X3Ru alloys are metallic, with a significant overlap between the valence and conduction bands at the Fermi energy. These findings offer insights into the novel properties of the tP16 X3Ru intermetallic alloys for the exploration of high-temperature structural applications.

1. Introduction

Intermetallic alloys offer potential as structural materials in extreme environments. Nickel-based superalloys (NBSAs) are the current material of choice in high-temperature structural applications such as in aerospace, marine, nuclear reactor, and chemical industries. This is attributed to the distinctive surface and mechanical properties of NBSAs [1], which arise from the γ / γ microstructures in the L12 cubic phase ( γ ) and ordered tetragonal phase ( γ ), where the trans-granular and grain boundary weakness are found to play a critical role [2]. For this reason, research on high-temperature structural materials has revolved around NBSAs for a number of years [3,4,5]. Despite the accomplishment of NBSAs, they are currently limited by their high-temperature capability due to nickel’s low melting point [6,7,8], thus hindering the development of next-generation, high-temperature structural engineering systems.
In this context, several intermetallic structures, including the refractory metals (RMs), platinum group metals (PGMs), as well as their binaries, have been studied in an effort to raise the melting point of NBSAs. However, RMs based on Mo, Nb, Ta, and W suffer intense oxidation in the air above 500 °C (normally referred to as pesting [9]), while the strength of titanium alloys deteriorates with increasing temperature. Although the PGMs (consisting of Pt, Ru, Os, Rh, Pd, and Ir) have comparable chemical properties and similar mineral deposits to NBSAs [10], their use is hampered by weight and cost.
The phase diagrams of the binaries of these metals have also been studied in an effort to find suitable stable alternatives to NBSAs. McAlister and Kahan [11] studied the phase diagram of Pt-Ga, and their findings [8] suggest that L12-Pt3Ga transforms to tetragonal tP16-Pt3Ga at excessive temperatures of around 1290 °C [12]. On the other hand, Mishima et al. [13] found a phase transformation in Pt3Al from L12 to D0c and L12 to D0c’, at around 420 °C and 130 °C, respectively [14,15]. Furthermore, Tibane et al. [16] studied the phase stability of Pt-Cr and Cr-Ru in various phases including A15, B2, tP16, D0c, D0c’, and L12 and found tP16 Pt3Cr to be the most energetically favorable. In a similar study by Chauke et al. [17], the tP16 phase of Pt3Al was found to be the most stable. Other studies have similarly found the tP16 phase to be stable in a number of alloys [12,18].
Recently, we have studied a number of [19,20,21] 3d-transition metal Ru-based alloys due to Ru potential as a high-temperature structural material [16]. Specifically, in A15 Cr3Ru and Ru3Cr alloys doped with 3d and 4d transition metals (Mn, Mo, Pt, Pd, Fe, Co, Re, and Zr), it was established that doping leads to thermodynamic stability. Furthermore, we investigated A15 X-Ru (X = Sc, Ti, V, Cr, Mn, Fe, Co, Ni, Cu, and Zn) [20], and it was found that Mn3Ru has a negative heat of formation, which may lead to its experimental realization, among other attractive mechanical properties. In D0c X3Ru, we found [19] that the calculated heat of formation for Sc3Ru, Ti3Ru, V3Ru, Mn3Ru, and Zn3Ru is negative, signifying their thermodynamic stability. The utilization of 3d transition metals is motivated by their capability to form alloys with relatively higher melting points and low densities [22]. Furthermore, the incorporation of transition metal elements is known to improve thermodynamic stability [21] and increase room temperature ductility in various materials [23]. It is therefore of interest to study the properties of Ruthenium-based transition metal alloys in other crystallographic phases in order to understand their full potential for high-temperature structural applications.
In this paper, we investigate the structural, electronic, and mechanical properties of tetragonal tP16 X3Ru (X = Sc, Ti, V, Cr, Mn, Fe, Co, Ni, Cu, and Zn) alloys using the density functional theory (DFT) technique [24,25]. Specifically, we compute their thermodynamic stability, mechanical stability, and electronic properties to determine their potential for high-temperature structural applications.

2. Methods

In this work, the properties of tP16 X3Ru (X = Sc, Ti, V, Cr, Mn, Fe, Co, Ni, Cu, and Zn) are studied by first-principles density functional theory method using the CASTEP code [25]. The interaction between the core and valence electrons is described by the Vanderbilt ultrasoft pseudopotential [26], with a converged plane wave cut-off of 800 eV, while the electronic exchange correlation is treated by the Perdew–Burke–Ernzerhof Generalized Gradient Approximation (PBE-GGA) functional incorporating the Hubbard parameter (U = 2.5 eV) [27]. The value of U in this study has been chosen to reproduce the experimental lattice constants and magnetic moments of the individual elements X (Sc, Ti, V, Cr, Mn, Fe, Co, Ni, Cu, and Zn) and Ru. The properties of the tP16 X3Ru (X = Sc, Ti, V, Cr, Mn, Fe, Co, Ni, Cu, and Zn) alloys were modeled from their respective unit cells (Figure 1), using a well-converged Monkhorst-Pack [28] k-point sampling of 15 × 15 × 11.
For each system, geometry optimization was performed using the BFGS algorithm, with the self-consistent convergence of the total energy and the forces set to 5.0 × 10⁻⁶ eV/atom and 0.01 eV/Å. To ensure an accurate representation of the ground state magnetic properties, the smearing width was set to 0.001 eV, allowing an initial random magnetic moment corresponding to a ferromagnetic state. It should be noted that, by symmetry and periodicity of the supercell approach, any calculated magnetic moment is ferromagnetic, since the spin alignment is replicated in all neighboring image supercells. Phonon calculations were conducted using finite displacement method [29,30,31,32], utilizing larger supercells size of 4 × 4 × 4, with a cut-off radius of 5.0 Å, and a k-grid sampling of 5 × 5 × 3.

3. Results and Discussion

3.1. Crystal Structure

The X3Ru alloy crystallizes in the space group P4/mbm (Pearson symbol tP16) in a primitive tetragonal phase. The crystal structure consists of 16 atoms per unit cell (4Ru and 12X) with Ru on 4f (0, 0.5, 0.258), X1 on 4e (0, 0, 0.251), X2 on 4 g (0.231, 0.731, 0), and X3 on 4 h (0.29, 0.29, 0.5) sites.
The calculated equilibrium lattice constants, volume, heat of formation, magnetic moments, density, and tetragonality (c/a ratio) for these alloys are given in Table 1. We note that the proposed tP16 X3Ru systems are relatively new; hence, their fundamental data are limited in the literature. In order to validate our model, we find that the calculated lattice constant of Cr3Ru is in accord with the experiment [33] and literature [21]. Similarly, our calculated lattice constants of the individual metals are in agreement with experimental data [34] (see Supplementary Materials (references [16,35,36] are cited in the Supplementary Materials)).
For a given material system, the heat of formation ΔHf describes the strength of atomic interactions, which indicate the thermodynamic stability of the material, and it is given by Equation (1):
Δ H f = [ E s t r u c t u r e i x i E i x T ]
where E(structure) and E(i) are the calculated equilibrium total energies of the alloy system and that of the individual elemental species i, with total atomic concentrations xT. The calculated heat of formation for each alloy system is presented in Table 1. Negative heat of formation suggests thermodynamic stability, whereas a positive value indicates thermodynamic instability under equilibrium conditions. The calculated heat of formation is comparable to previous theoretical data in the case of Cr3Ru, with a slight discrepancy that can be attributed to the use of different exchange correlation functionals. In this study, the on-site Hubbard U was incorporated into the generalized gradient approximation (GGA) in order to accurately describe the ground-state magnetic moments, whereas the previous studies employed plain GGA [16].
We find that the heat of formation for Sc3Ru, Ti3Ru, V3Ru, Mn3Ru, and Zn3Ru is negative. This result indicates that these alloys are thermodynamically stable and hence can be synthesized under equilibrium experimental conditions. Conversely, Ni3Ru, Co3Ru, Cu3Ru, and Fe3Ru exhibit positive heat of formation, rendering them unstable, and can only be achieved under non-equilibrium conditions. It is noteworthy that the stable systems of Ti, V, Cr, Mn, Co, Ni, and Cu possess relatively high magnetic moments, which can potentially expand the use of these alloys in spintronic applications.
The density of a material describes its lightness/heaviness and holds an essential responsibility in aerospace applications specifically for spinning components in aircraft wings and turbine blades. It is calculated as follows:
ρ c a l = [ M W N V o l A 0 ]
where M W is the molecular weight of the alloy, N is the number of atoms, V o l is the volume of the unit cell, and A 0 is Avogadro’s number (6.022 × 10²³). Table 1 indicates that the densities for X3Ru alloys range from 4.5 g/cm3 to 9.1 g/cm3. It is noted that the thermodynamically stable Sc3Ru and Ti3Ru have the lowest densities compared to the currently used L12-Ni3Al density.
We have further determined the tetragonality (c/a) ratio of the X3Ru alloys in order to evaluate possible phase changes that might exist in them. The tetragonality ratio is found to range from 1.21 to 1.72, with X = Co, Ni, Cu, and Zn possessing a constant value of 1.41, which indicates the absence of phase transition, while in Ti3Ru, c/a = 1.7, indicating a possible phase change.

3.2. Mechanical Properties

3.2.1. Elastic Constants

Mechanical properties describe the resistance of crystal structures to external stress or strain applied to them. It was evaluated by applying a minimum strain to the unit cell to enable the total energy difference to be determined [38,39]. The elastic strain is calculated using Equation (3).
U = Δ E V 0 1 2 i 6 j 6 C i j e i e j
where Δ E is the total energy change of the deformed unit cell relative to the initial cell, V0 is the unstrained volume, C i j (i,j = 1 to 6) are the elastic constants, and e i or e j corresponds to the strain. In this study, the stress–strain method based on Hook’s law was used to calculate the elasticity and the elastic stiffness tensors, expressed as follows [40]:
{ δ i j } = [ C i j ] { ε i j }
where { δ i j } and { ε i j } are the stress and strain tensors, respectively. For primitive tetragonal X3Ru (X = Sc − Zn) structures, there are six independent components (C11, C12, C13, C33, C44, C66) calculated at zero pressure. Based on the calculated elastic constants, the Bohr mechanical stability criteria were examined for all the structures as follows:
C 11 > 0 , C 33 > 0 , C 44 > 0 , C 66 > 0 , C 11 C 12 > 0 , ( C 33 + C 11 2 C 13 ) > 0 , ( 2 C 11 + 2 C 12 + C 33 + 4 C 13 ) > 0
Table 2 presents the elastic constants (Cij) and melting temperatures for X3Ru compounds. Notably, all structures exhibit Cij > 0, indicating compliance with the mechanical stability criteria. However, the Fe3Ru and Cr3Ru structures are mechanically unstable due to C66 < 0 and C44 < 0. A discernible correlation emerges between the elastic constants and the melting temperature of materials [41,42,43,44]. Noteworthy is the observation that the melting temperature of the mechanically stable Ni3Ru surpasses that of the currently used L12 Ni3Al (Table 2). Additionally, Ni3Ru has the highest melting temperature, outperforming Cr3Ru. Consequently, Ni3Ru proves to be a viable candidate for high-temperature structural applications.
To assess the suitability of the X3Ru (X = Sc, Ti, V, Cr, Mn, Fe, Co, Ni, Cu, and Zn) alloys for high-temperature structural application, the melting temperature (Tm) was calculated using the Cij elastic parameters. For tetragonal structures, the melting temperature (Tm) was calculated from Equation (6):
T m = 354   K + ( 450   K M b a r ) [ 1 3 ( 2 C 11 + C 33 ) ] ± 300   K
where Mbar is a mega bar. There exists a direct proportionality between the elastic constants and the melting temperature of materials, as evidenced in references [41,42,43,44]. The melting temperature data of the X3Ru alloys range from 516.68 K to 1795.19 K, with Ni3Ru having the highest melting temperature. Notably, the thermodynamically and mechanically stable Sc3Ru, Ti3Ru, V3Ru, Mn3Ru, and Zn3Ru alloys exhibit melting temperatures of 858.60 K, 1114.49 K, 1163.46 K, 1122.71 K, and 1363.19 K, respectively, which are in the range of the currently utilized L12 Ni3Al.

3.2.2. Bulk, Shear, and Young’s Moduli

Based on the Cij, other elastic parameters can be calculated such as bulk modulus (B), shear modulus (G), and Young’s modulus (E), which are obtained from the Voigt, Reuss, and Hill approximations [46,47]. Bulk modulus (B) highlights the resistance to compression depending on the crystal structure of a material. High compressibility in materials attributes to large bulk modulus, while low bulk modulus constitutes low compressibility. For tetragonal structures, B is given as follows:
B V = 1 9 ( ( 2 C 11 + C 12 ) + C 33 + 4 C 13 )
and the Reuss bounds are given as follows:
B R = C 2 M
where
M = C 11 + C 12 + 2 C 33 4 C 13
with BR, B = BH, and BV being the Bulk modulus for Reuss (R), Voigt (V), and Hill (H) approximations [47]. The shear modulus (G) of a material describes its response to shear stress and is a measure of a material’s stiffness. For tetragonal structures, G is expressed as follows:
G V = 1 30 ( M + 3 C 11 3 C 12 + 12 C 44 + 6 C 66 )
where, M = C 11 + C 12 + 2 C 33 4 C 13
G R = 15 [ ( 18 B V C 2 ) + ( 6 C 11 C 12 ) + ( 6 C 44 ) + ( 3 C 66 ) ] 1
where C 2 = ( C 11 + C 12 ) C 33 2 C 13 2 .
GR and GV are the Reuss and Voigt bounds [46]. Young’s modulus and Poison’s ratio ʋ are independent of the type of crystal structure of a material and are given as follows:
E = ( 9 B X G X 3 B X + G X ) υ = ( 3 B X 2 G X 2 ( B X + G X ) )
where X = V, R, and H approximations.
The Voigt, Reuss, and Hill approximations [46,47] utilize elastic constants to calculate macroscopic quantities, such as bulk (B) modulus, shear (G) modulus, and Young’s (E) modulus. For tetragonal structures, the bulk, shear, and Young’s modulus were derived from the elastic constants [48,49], as summarized in Table 3. The bulk and shear modulus represent volume and shape changes, respectively, while Young’s modulus indicates material stiffness. Table 3 illustrates that the Ni3Ru structure demonstrates the highest bulk, shear, and Young’s modulus, whereas Mn3Ru exhibits the lowest values. In addition, Cr3Ru possesses a negative shear modulus and Young’s modulus. The negative shear and Young moduli are due to phase change leading to instability. This instability is also observed in ferro-elastic phase transformation [50]. The negative elastic modulus is due to Landau theory [51] when two local minima form in a strain energy function. Furthermore, solids with negative elastic modulus can be stabilized with sufficient constraint.
Consequently, Ni3Ru displays superior resistance to volume and shape changes, emerging as the most compression-resistant material under zero-pressure conditions. At the same time, the G values in X3Ru (X = Mn, Fe, Ni, Co, and Zn) alloys are lower than the B values, consistent with observations in reference [52]. This difference suggests that G limits the stability of these alloys, aligning with trends documented in the aforementioned reference.
The assessment of material ductility/brittleness can be effectively performed using the bulk-to-shear modulus ratio (B/G), as introduced by Pugh [53]. A high B/G ratio is associated with ductility, while a low ratio corresponds to brittleness, with the critical value between them being 1.75. The calculated B/G ratios are detailed in Table 3, revealing that all X3Ru structures, except Cr3Ru, exhibit ductility. Notably, the B/G ratios for all structures surpass those of L12-Ni3Al, except for Cr3Ru and V3Ru. Furthermore, Poisson’s ratio (υ) serves as an additional indicator for ductility or brittleness, as outlined by Frantsevich [54]. Materials with υ > 0.3 are considered ductile, while those with υ < 0.3 are deemed brittle. The values for Poisson’s ratio for all structures exceed 0.3, aligning with the ductile nature predicted by the B/G ratios above, except for the Cr3Ru structure.
Additionally, we conducted calculations for Vickers hardness, a metric that gauges a material’s resistance to localized plastic deformation caused by either mechanical indentation or abrasion. The hardness of the X3Ru alloys is determined using the Vickers hardness equation [55]:
H V = 2 ( K 2 G H ) 0.585 3
where K represents the GH/BH ratio of the shear modulus to the bulk modulus. In mechanical properties, Vickers hardness assumes significant importance, particularly in high-temperature applications, where micro-cracks are prevalent. The calculated Vickers hardness values for the primitive tetragonal X3Ru structures are outlined in Table 3. Notably, V3Ru exhibits the highest hardness, whereas Cu3Ru has the lowest value. Consequently, V3Ru showcases superior resistance to localized plastic deformation induced by abrasion or mechanical indentation.

3.2.3. Elastic Anisotropy

Anisotropic behavior refers to a material’s directional dependence on a physical property, a phenomenon linked to micro-cracks, phase transformation, precipitation, and dislocation dynamics [40]. This directional dependence is represented by three elastic factors A1, A2, and A3 corresponding to different crystallographic planes, as well as the universal anisotropic index (AU) and the compression percentage (AB) anisotropy, respectively. This holds true particularly for tetragonal structures as given in Equation (14).
A 1 = 2 C 66 C 11 C 12 ,   A 2 = A 3 = 4 C 44 C 11 + C 33 2 C 13 A U = 5 G V G R + B V B R 6   a n d   A B = B V B R B V + B R 100 %
In the context of shear anisotropic factors, A1, A2, and A3 correspond to the (001), (010), and (100) shear planes, respectively. In isotropic structural materials, these factors (A1, A2, and A3) should ideally be equal to one. Similarly, the value of the universal anisotropic index (AU) should be zero for isotropy. Deviations from these values, either one or zero, indicate the degree of elastic anisotropy in a crystal. The terms BV, BR, GV, and GR represent the Voigt and Reuss approximations in bulk modulus (B) and shear modulus (G). The maximum value for the compression percentage (AB) is 100%, and the minimum is zero. A value of zero signifies isotropy, while 100% indicates maximum anisotropy. The calculated Zener anisotropy factor (A1) values indicate that they are both less than and greater than one for A2 and AU, signifying that all the structures exhibit elastic anisotropy under zero-pressure conditions, as shown in Table 4. Additionally, the AB value for the bulk modulus percentage is zero for Ni3Ru, Ti3Ru, and Cu3Ru, suggesting isotropy in their structures, while the rest are characterized by elastic anisotropy.

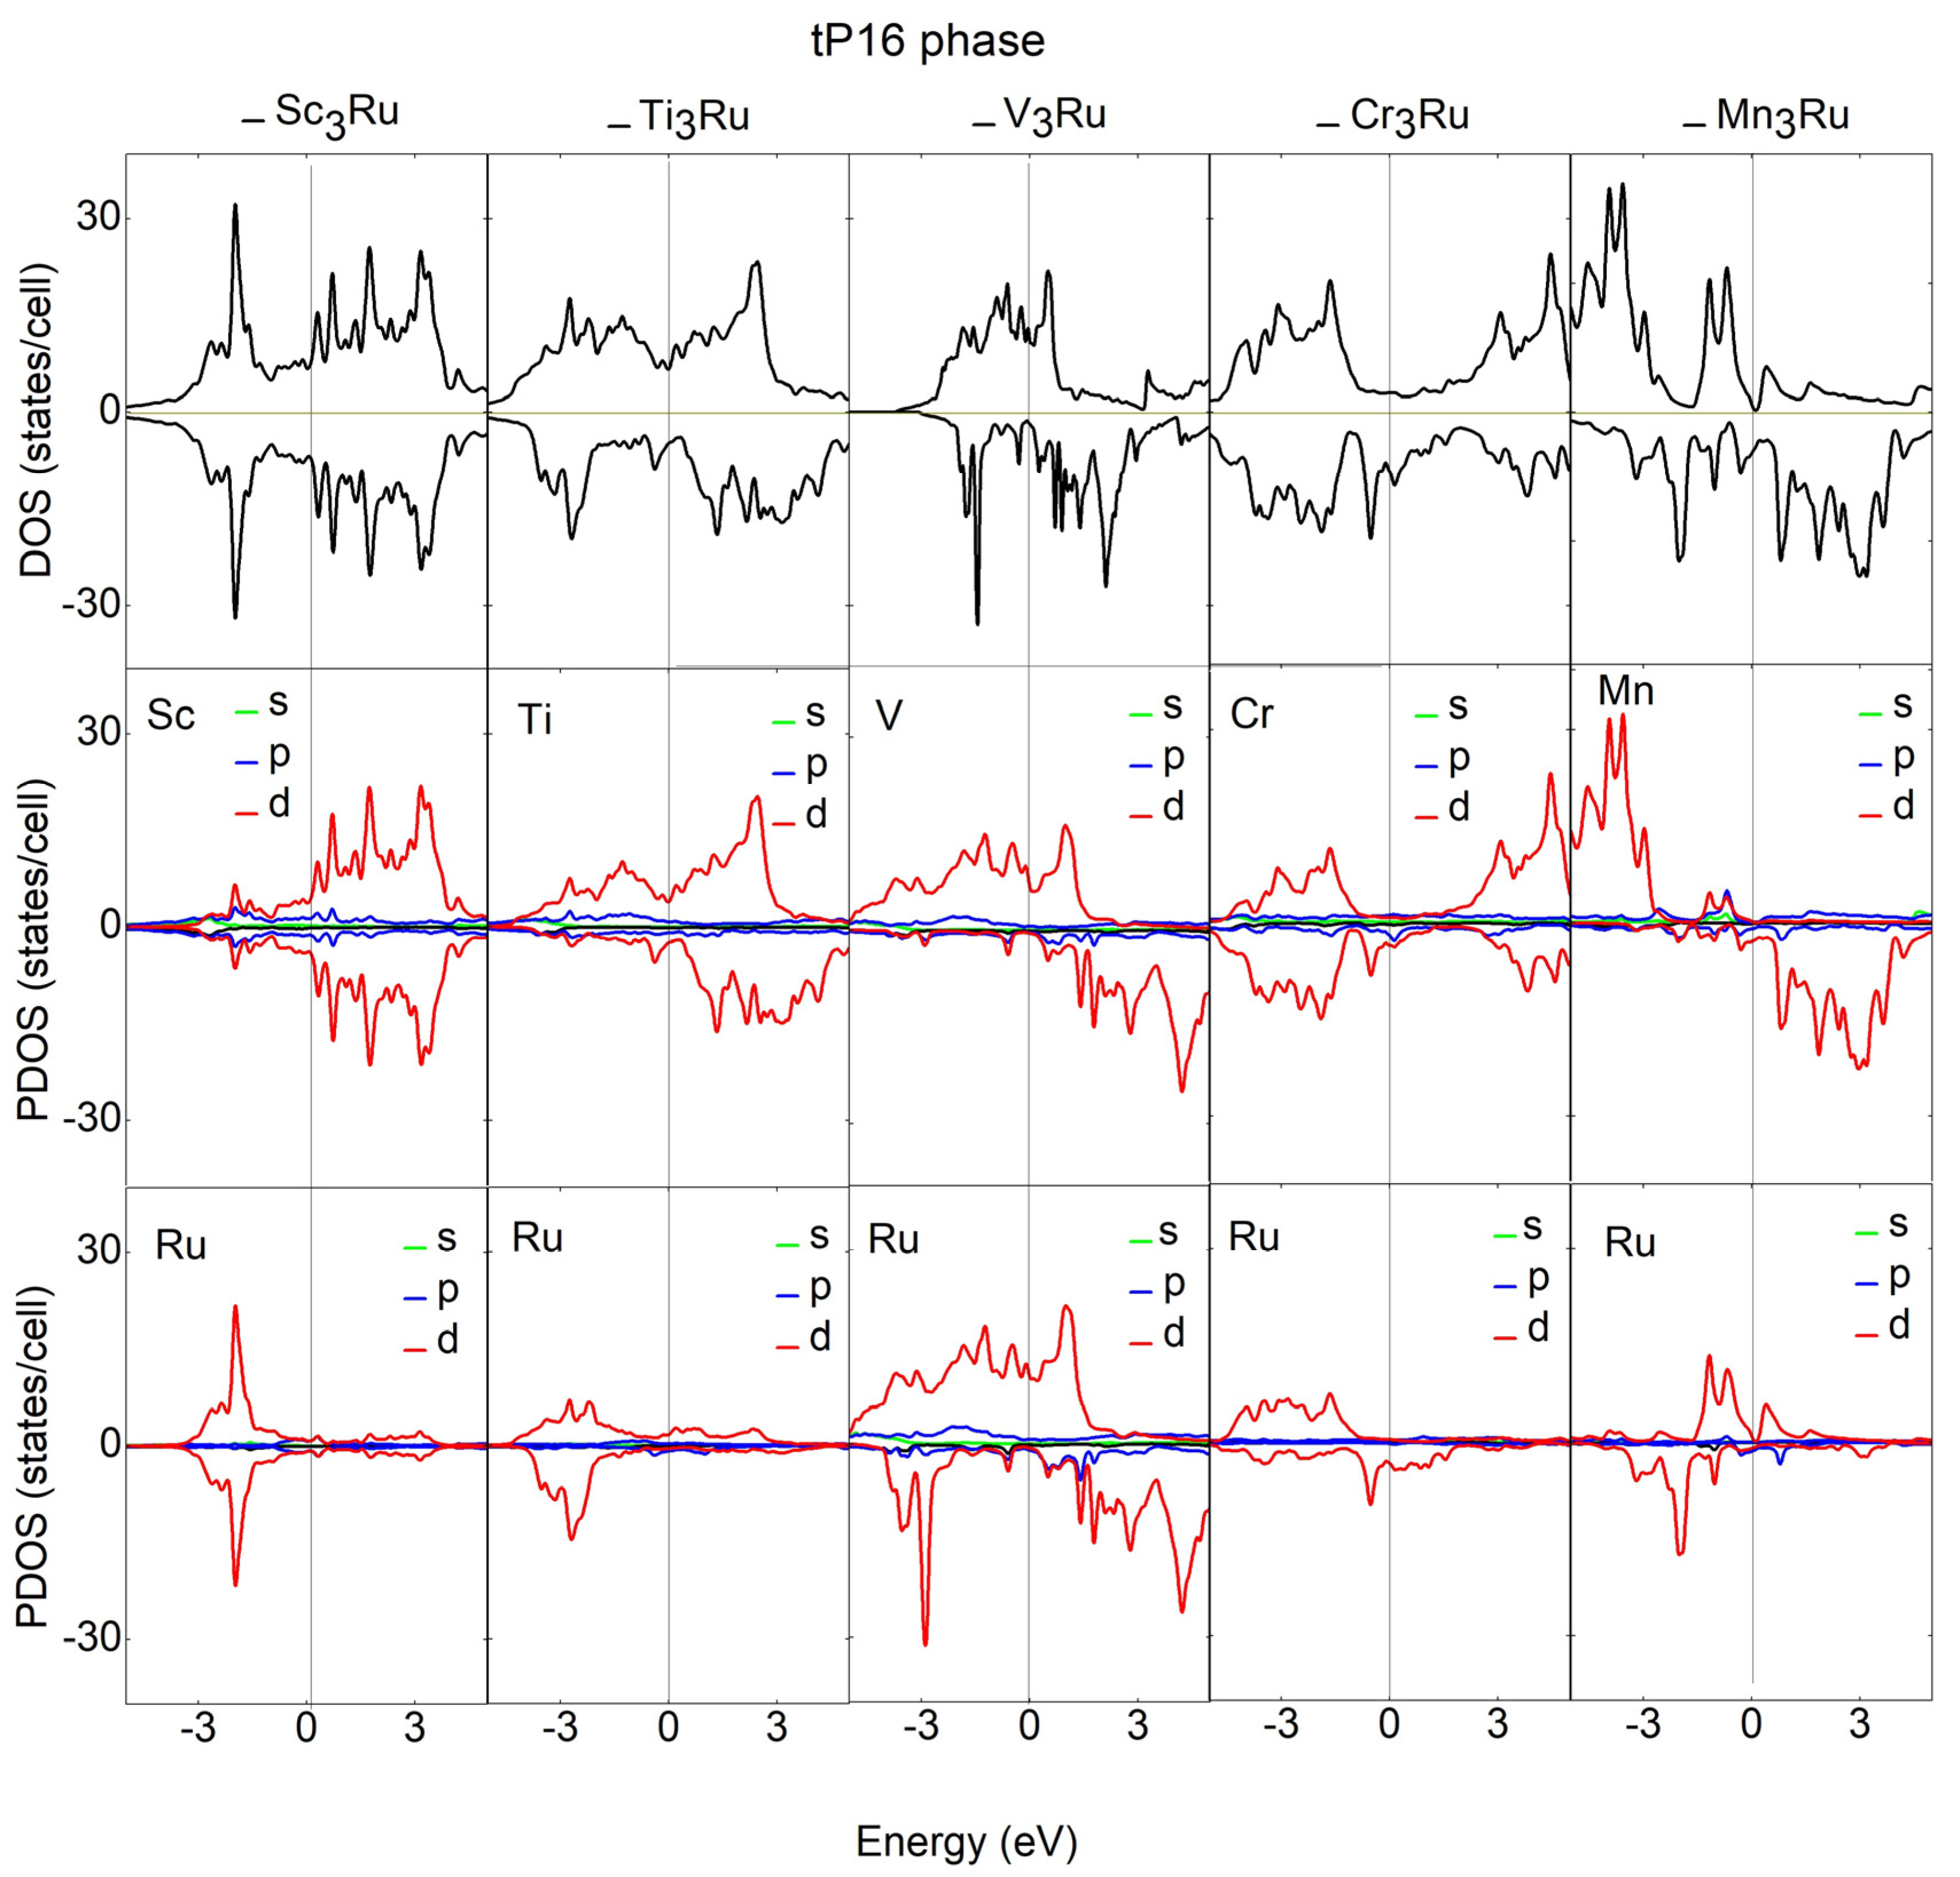
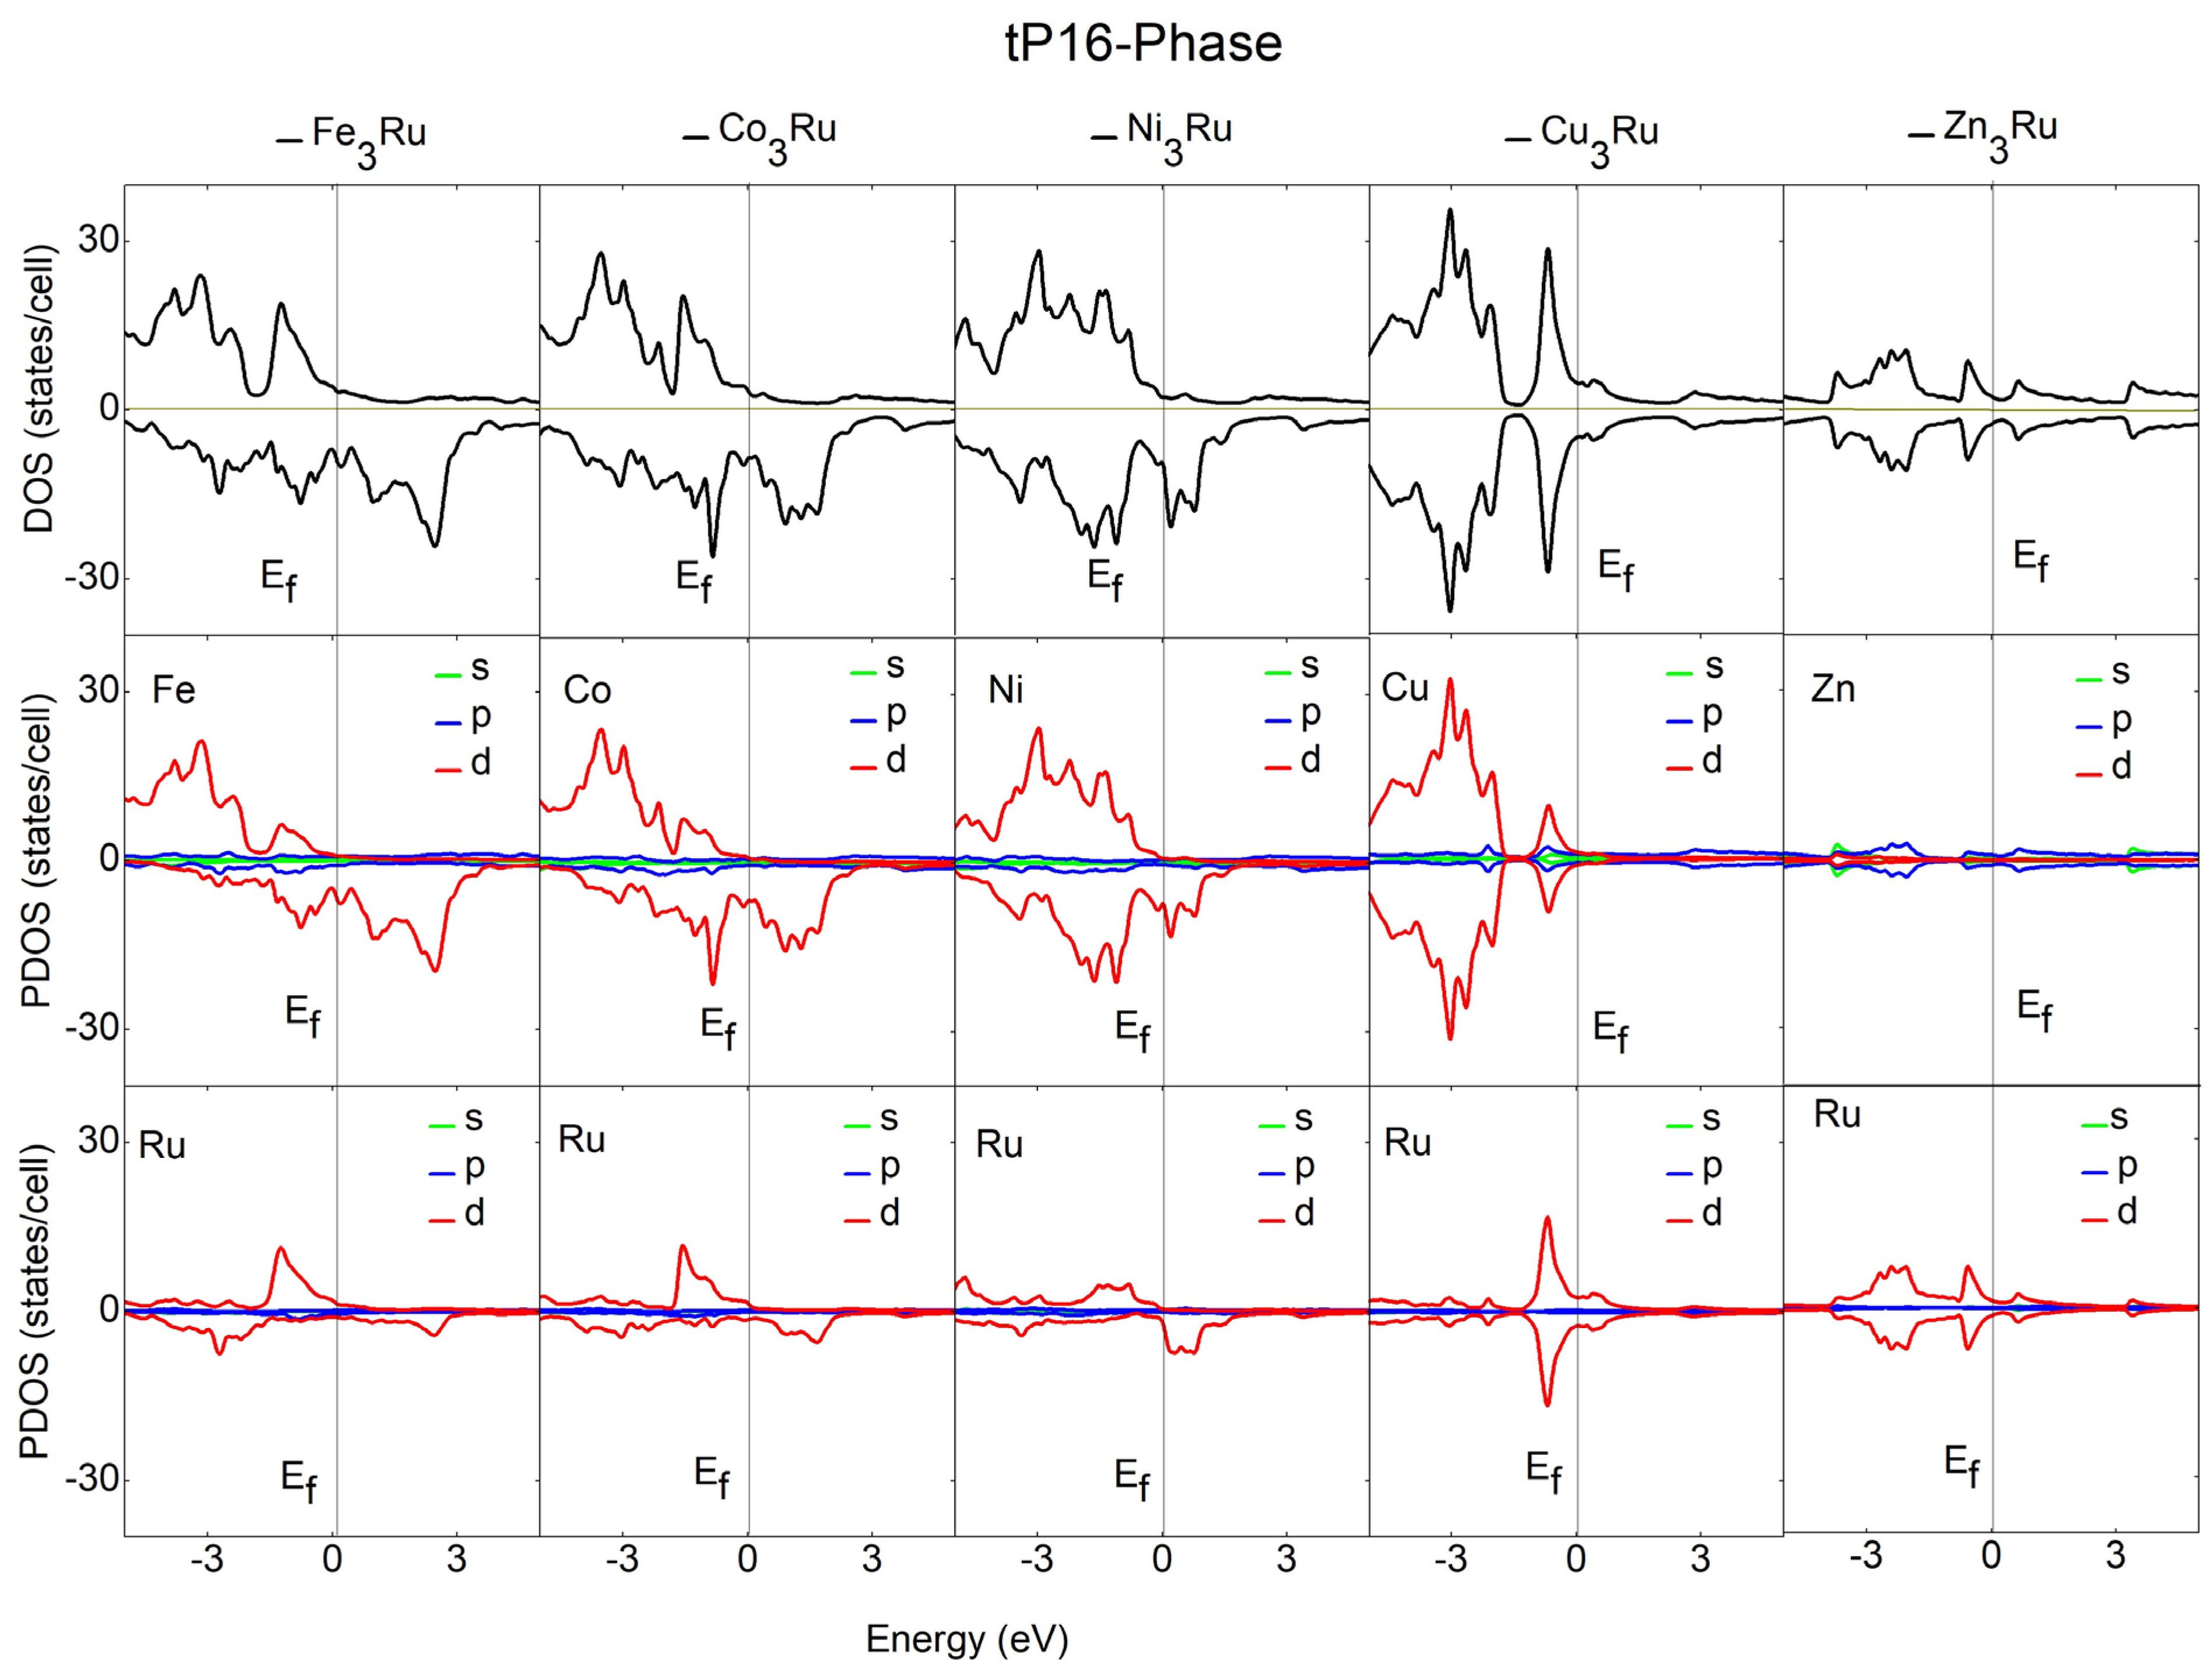
3.3. Electronic and Magnetic Properties

To gain insights into the bonding characteristics of tP16 X3Ru alloys (X = Sc, Ti, V, Cr, Mn, Fe, Co, Ni, Cu, and Zn), their electronic and magnetic properties were investigated. The calculated magnetic moments of these alloys are detailed in Table 1. Notably, the thermodynamically and mechanically stable V3Ru and Mn3Ru exhibit the highest magnetic moments of 2.19 μB and 3.25 μB, respectively. Additionally, Co3Ru and Ni3Ru, which are mechanically stable, demonstrate magnetic moments of 1.82 μB and 1.08 μB.
The relationship between a material’s structural stability and magnetic moments relies on its electronic properties [56]. Figure 2 and Figure 3 show the total density of states (TDOS) and partial density of states (PDOS) for X3Ru alloys in the tP16 phase. An electronic overlap is observed between the valence and conduction bands around the Fermi energy level of X3Ru alloys, signifying a metallic nature. These findings are consistent with previous theoretical studies [16,18,24]. To evaluate the individual atom contributions to the TDOS, we calculated the PDOS for X3Ru alloys, as depicted in Figure 2 and Figure 3. It is evident that the transition metal and Ru 3d orbitals are the major contributors to the total density of states around the fermi level, with the s, p orbitals making minimal contribution.
Moreover, the symmetry of the spin-up and spin-down bands is evident in Sc3Ru, Cu3Ru, and Zn3Ru alloys. This symmetrical pattern signifies non-spin polarization, confirming the absence of magnetic moments (zero magnetic moments) in these alloys. In contrast, V3Ru, Cr3Ru, Mn3Ru, Fe3Ru, Co3Ru, Ni3Ru, and Zn3Ru alloys exhibit asymmetric spin-up and spin-down channels. This asymmetry indicates electron spin polarization at the Fermi energy, leading to a spin polarization effect. This observation aligns with the presence of non-zero magnetic moments, as indicated in Table 1.

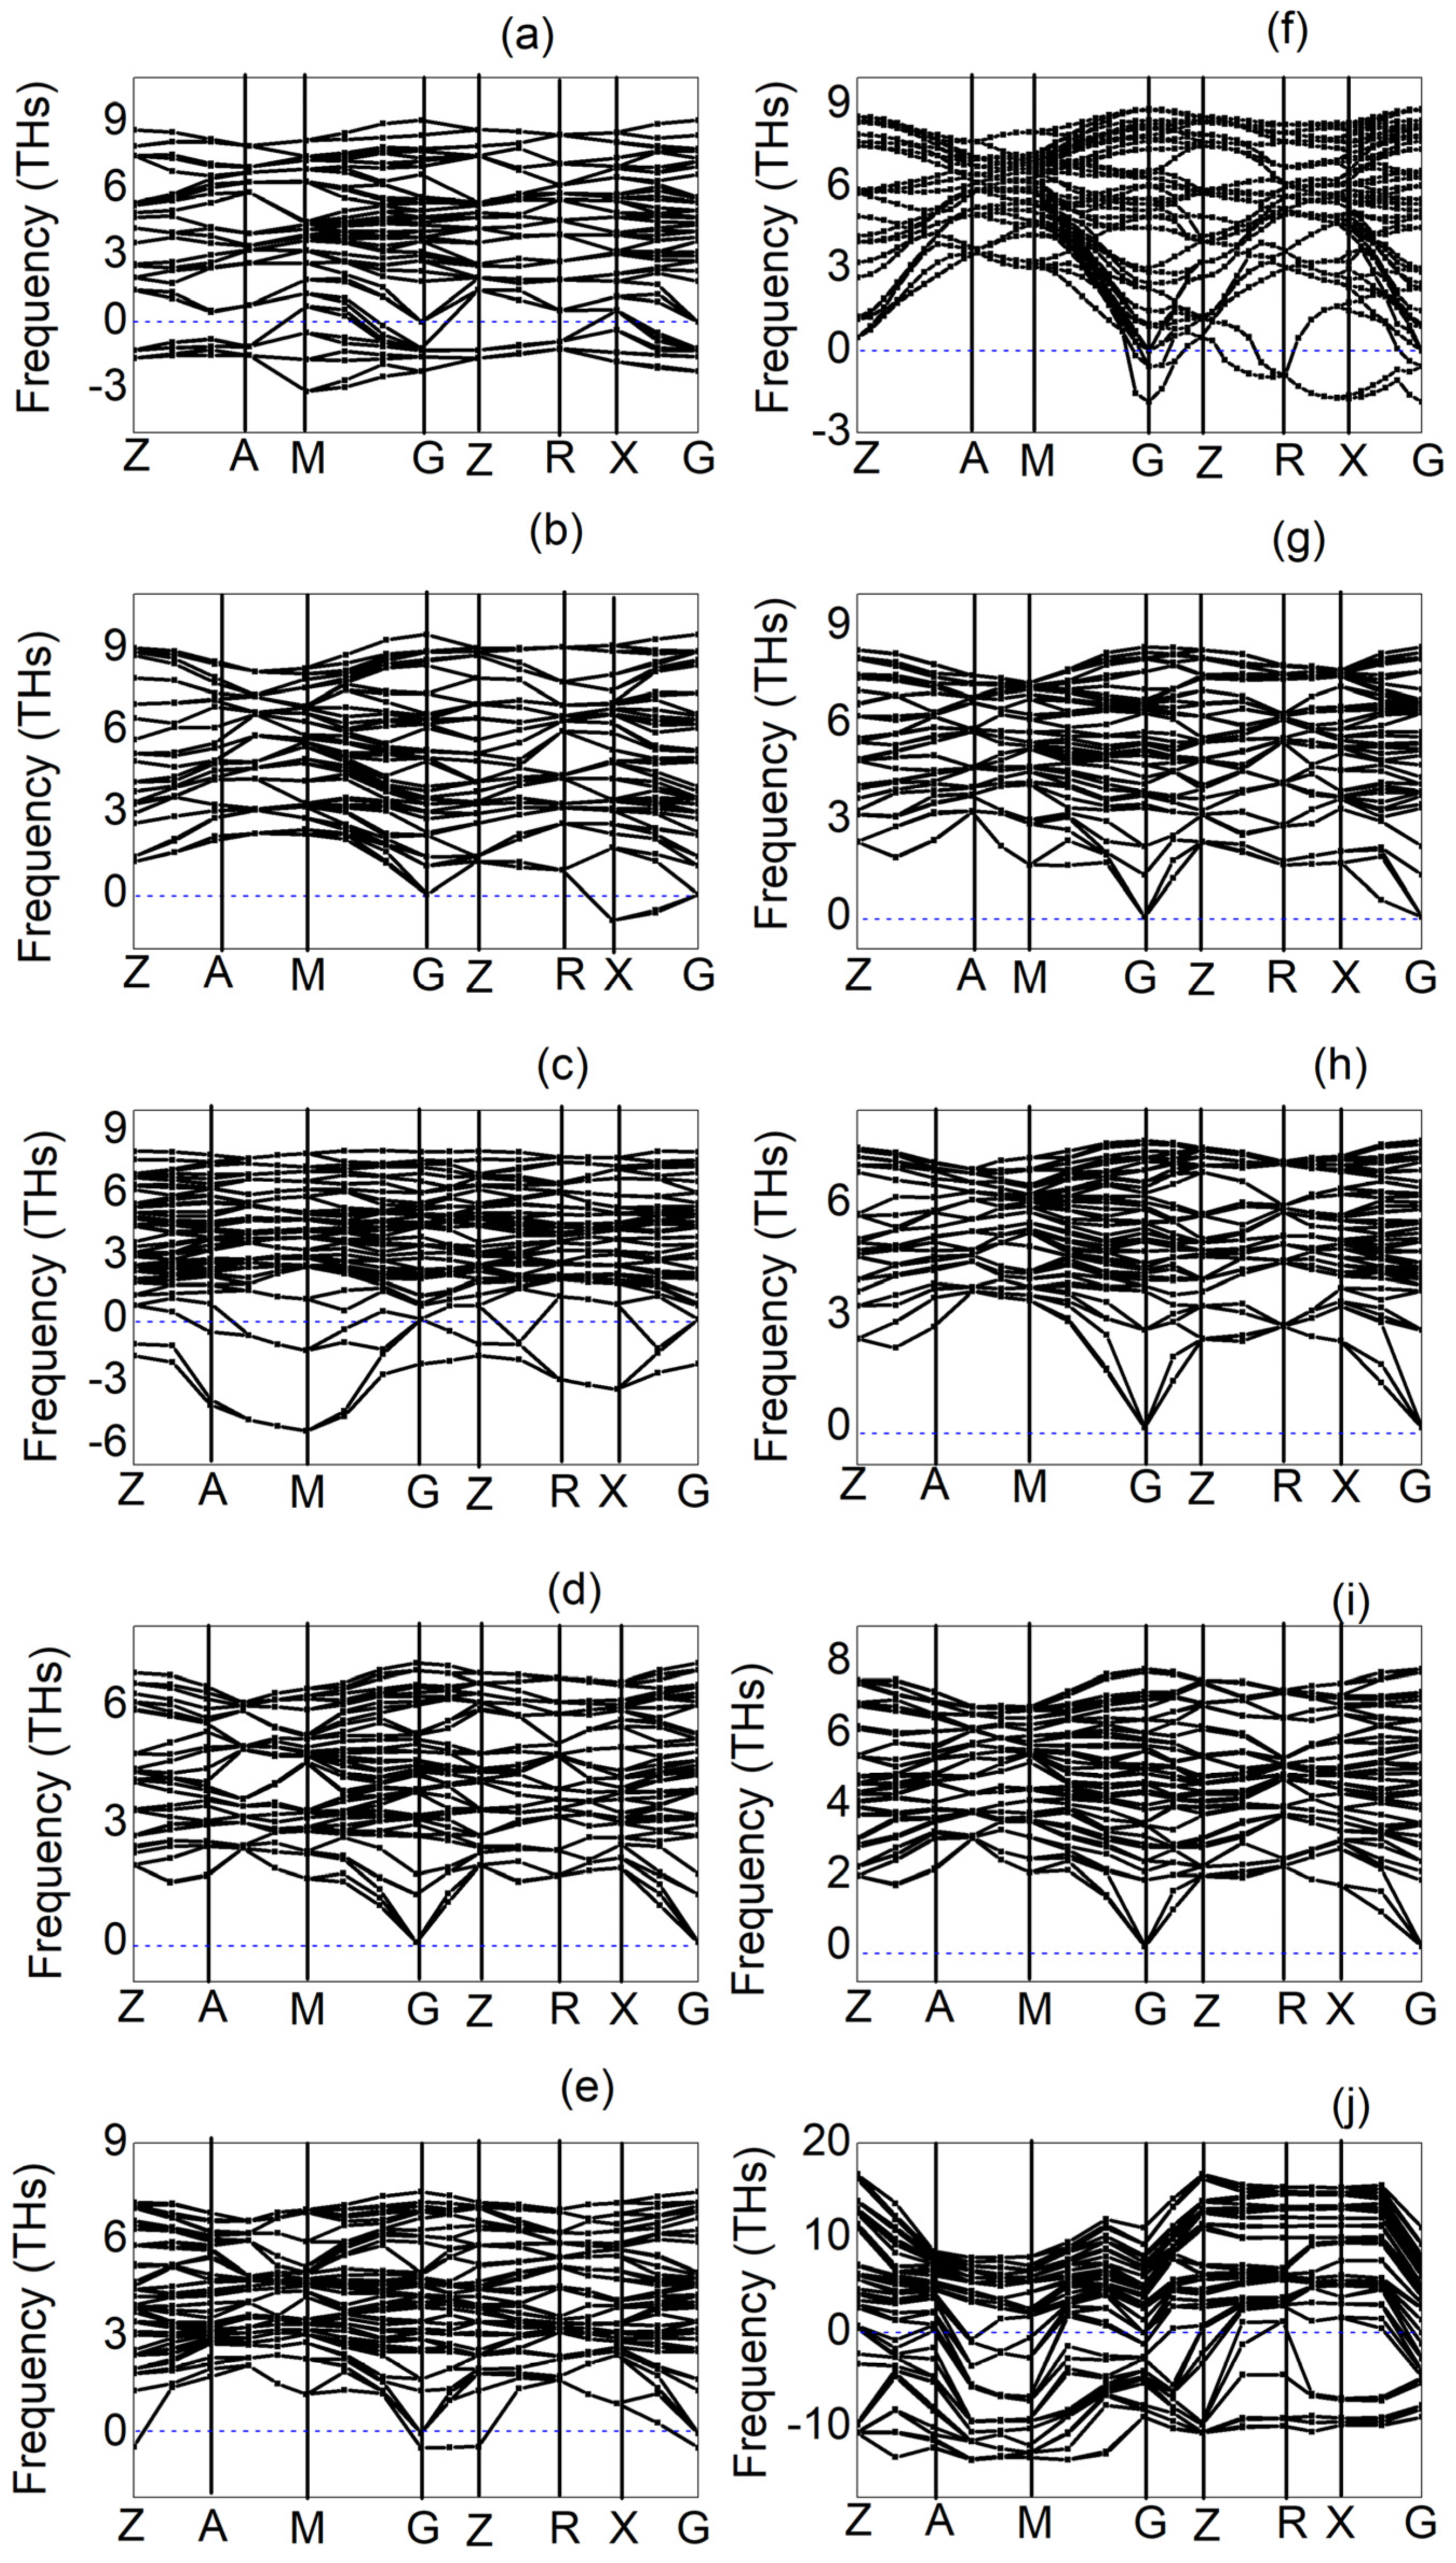
3.4. Phonon Dispersion Curves

Phonons are crucial for understanding the dynamic behavior and thermal conductivities, which are key areas in the advancement of novel materials research. Phonon dispersion curves offer valuable information about a material’s dynamic stability or instability by revealing both positive and negative phonon frequencies. Positive frequencies indicate dynamic stability, whereas negative frequencies signify dynamic instability within a compound [57,58]. Figure 4 shows the dispersion curves of tP16 X3Ru (where X = Sc, Ti, V, Cr, Mn, Fe, Co, Ni, Cu, and Zn) alloys, plotted across the highest symmetry k-points of the Brillouin zone. Among these alloys, the phonon dispersion curves of Cr3Ru, Co3Ru, Ni3Ru, and Cu3Ru demonstrate dynamic stability, as there are no imaginary frequencies present. In contrast, the phonon dispersion plots of Sc3Ru, Ti3Ru, Fe3Ru, V3Ru, Zn3Ru, and Mn3Ru display negative phonon modes, indicating dynamic instability and, therefore, which may be a limiting factor in applications where dynamic stability is vital.

4. Conclusions

In summary, we have utilized first-principles calculations to investigate the structural, electronic, and mechanical properties of tetragonal X3Ru (X = Sc − Zn) binary alloys in the tP16 phase. Analysis of the heat of formation results indicates that Mn3Ru, Sc3Ru, Ti3Ru, V3Ru, and Zn3Ru alloys are thermodynamically stable. Furthermore, the electronic density of states reveals a strong overlap between the valence and conduction bands in Sc3Ru, Ti3Ru, V3Ru, Mn3Ru, Fe3Ru, Co3Ru, Ni3Ru, Cu3Ru, and Zn3Ru alloys, which exhibit a metallic character. All alloys except Cr3Ru demonstrate ductility, as evidenced by high B/G ratios exceeding 1.75, along with high melting temperatures. We observe a direct correlation between these elastic moduli (B, G, and E) and the melting temperatures of the proposed structures, consistent with previous theoretical data. Phonon calculations indicate that Cr3Ru, Co3Ru, Ni3Ru, and Cu3Ru are dynamically stable. Our findings suggest that tetragonal Ru-based alloys are promising candidates for ultra-high-temperature structural applications.

Supplementary Materials

The following supporting information can be downloaded at https://www.mdpi.com/article/10.3390/alloys3020007/s1, Table S1: Calculated lattice constants (Å) in pure 3d-transtion metal X and ruthenium; Table S2: Calculated lattice constants and magnetic moments in pure chromium, ruthenium and iron for different values of Hubbard U parameter.

Author Contributions

B.O.M.: conceptualization, methodology, validation, investigation, writing—original draft, and project administration; M.E.B.: writing—review and editing, resources, and supervision. M.M.T.: writing—review and editing, resources, and supervision. All authors have read and agreed to the published version of the manuscript.

Funding

This research was funded by the National Research Foundation (NRF), grant number 121479, and the Grow Your Own Timber (GYOT) initiative from UNISA.

Institutional Review Board Statement

The study was conducted in accordance with the Declaration of University of South Africa approved by the Institutional Review Board (or Ethics Committee) of University of South Africa (from 8 February 2022 to 6 February 2027). This study is a pure computation and does not involve humans or animals.

Data Availability Statement

The raw data supporting the conclusions of this article will be made available by the authors on request.

Acknowledgments

All DFT calculations were performed at the University of South Africa using high-performance computing (HPC) resources.

Conflicts of Interest

The authors declare no conflicts of interest.

References

  1. Hill, P.J.; Yamabe-Mitarai, Y.; Wolff, I.M. High-temperature compression strengths of precipitation-strengthened ternary Pt-Al-X alloys. Scr. Mater. 2001, 44, 43–48. [Google Scholar] [CrossRef]
  2. Ravindran, P.; Subramoniam, G.; Asokamani, R. Ground-state properties and relative stability between the L12 and DOa phases of Ni3Al by Nb substitution. Phys. Rev. B 1996, 53, 1129–1137. [Google Scholar] [CrossRef] [PubMed]
  3. Yao, X.; Ding, Q.; Wei, X.; Wang, J.; Zhang, Z.; Bei, H. The effects of key elements Re and Ru on the phase morphologies and microstructure in Ni-based single crystal superalloys. J. Alloys Compd. 2022, 926, 166835. [Google Scholar] [CrossRef]
  4. Lee, S.; Do, J.; Jang, K.; Jun, H.; Park, Y.; Choi, P.P. Promotion of topologically close-packed phases in a Ru-containing Ni-based superalloy. Scr. Mater. 2023, 222, 115041. [Google Scholar] [CrossRef]
  5. Wang, S.; Meng, F.; Wang, L.; Yu, H.; Sun, D. The Effect of Ru on the Evolution of the γ′ Phase in Ni-Al-Ru Alloys. Materials 2022, 15, 3344. [Google Scholar] [CrossRef] [PubMed]
  6. Sims, C.T.; Stoloff, N.S.; Hagel, W.C. Superalloys II; Wiley: New York, NY, USA, 1987. [Google Scholar]
  7. Yamabe-Mitarai, Y.; Gu, Y.; Huang, C.; Völkl, R.; Harada, H. Platinum-group-metal-based intermetallics as high-temperature structural materials. JOM 2004, 56, 34–39. [Google Scholar] [CrossRef]
  8. Shongwe, M.B.; Witcomb, M.J.; Cornish, L.A.; Papo, M.J. TEM studies of Pt-Al-Cr-Ru. Alloys 2012, 7, 12–14. [Google Scholar]
  9. Bewlay, B.P.; Jackson, M.R.; Zhao, J.-C.; Subramanian, P.R.; Mendiratta, M.G.; Lewandowski, J.J. Ultrahigh-temperature Nb-silicide-based composites. MRS Bull. 2003, 28, 646–653. [Google Scholar] [CrossRef]
  10. Harris, D.C.; Cabri, L.J. Nomenclature of platinum-group-element alloys: Review and revision. Can. Miner. 1991, 29, 231–237. [Google Scholar]
  11. Massalski, T.B.; Murray, J.L. Binary Phase Diagrams; ASM International: Almere, The Netherlands, 1990. [Google Scholar]
  12. Chattopadhyay, T.; Schubert, K. Kristallstruktur von Pt3Ga(r) und einigen phasen der mischung Pt–Al. J. Less Common Met. 1975, 41, 19–32. [Google Scholar] [CrossRef]
  13. Oya, Y.; Mishima, U.; Suzuki, T. L12 D0c martensitic transformation in Pt3Al and Pt3Ga. Z. Met. 1987, 78, 485–490. [Google Scholar]
  14. Kimmel, G. On the U3Si (Doc) crystallographic type. J. Less Common Met. 1978, 59, P83–P86. [Google Scholar] [CrossRef]
  15. Brandes, E.A.; Brook, G.B. Smithells Metals Reference Book; Butterworth: Butterworth, Malaysia, 1992. [Google Scholar]
  16. Tibane, M.M. Phase Stability Study of Pt-Cr and Ru-Cr Binary Alloys. Ph.D. Thesis, University of Limpopo, Polokwane, South Africa, 2011. [Google Scholar]
  17. Chauke, H.R.; Minisini, B.; Drautz, R.; Nguyen-Manh, D.; Ngoepe, P.E.; Pettifor, D.G. Theoretical investigation of the Pt3Al ground state. Intermetallics 2010, 18, 417–421. [Google Scholar] [CrossRef]
  18. Chen, M.; Liu, C.; Liu, M.; Kumar, U.P.; Li, Z.; Liu, L.; He, J.; Liang, T. Exploring the electronic, mechanical, and anisotropy properties of novel tetragonal B2CO phase. J. Mater. Res. 2019, 34, 3617–3626. [Google Scholar] [CrossRef]
  19. Mnisi, B.O.; Benecha, E.; Tibane, M. Investigation of the thermodynamic, structural, electronic, mechanical and phonon properties of D0c Ru-based intermetallic alloys: An ab-initio Study. Mater. Res. Express 2024. [Google Scholar] [CrossRef]
  20. Mnisi, B.O.; Benecha, E.M.; Tibane, M.M. Computational Study of A15 Ru-Based Alloys for High-Temperature Structural Applications. In Ruthenium: An Element Loved by Researchers; IntechOpen: London, UK, 2021. [Google Scholar]
  21. Mnisi, B.O.; Benecha, E.M.; Chauke, H.R.; Ngoepe, P.E.; Tibane, M.M. Effect of transition metal doping on Cr–Ru alloys using first principles approach. Bull. Mater. Sci. 2020, 43, 120. [Google Scholar] [CrossRef]
  22. Miwa, K.; Fukumoto, A. First-principles study on (formula presented) transition-metal dihydrides. Phys. Rev. B 2002, 65, 155114. [Google Scholar] [CrossRef]
  23. La, P.; Wei, Y.; Lv, R.; Zhao, Y.; Yang, Y. Effect of Mn element on microstructure and mechanical properties of bulk nanocrystalline Fe3Al based materials prepared by aluminothermic reaction. Mater. Sci. Eng. A 2010, 527, 2313–2319. [Google Scholar] [CrossRef]
  24. Kohn, W.; Sham, L.J. Self-consistent equations including exchange and correlation effects. Phys. Rev. 1965, 140, A1133. [Google Scholar] [CrossRef]
  25. Clark, S.J.; Segall, M.D.; Pickard, C.J.; Hasnip, P.J.; Probert, M.I.J.; Refson, K.; Payne, M.C. First principles methods using CASTEP. Z. Krist. 2005, 220, 567–570. [Google Scholar] [CrossRef]
  26. Vanderbilt, D. Soft self-consistent pseudopotentials in a generalized eigenvalue formalism. Phys. Rev. B 1990, 41, 7892–7895. [Google Scholar] [CrossRef]
  27. Perdew, J.P.; Burke, K.; Ernzerhof, M. Generalized gradient approximation made simple. Phys. Rev. Lett. 1996, 77, 3865. [Google Scholar] [CrossRef]
  28. Monkhorst, H.J.; Pack, J.D. Special points for Brillouin-zone integrations. Phys. Rev. B 1976, 13, 5188. [Google Scholar] [CrossRef]
  29. Chen, S.; Pan, Y. Noble metal interlayer-doping enhances the catalytic activity of 2H–MoS2 from first-principles investigations. Int. J. Hydrogen Energy 2021, 46, 21040–21049. [Google Scholar] [CrossRef]
  30. Pan, Y.; Yu, E. First-principles investigation of electronic and optical properties of H-doped FeS2. Int. J. Energy Res. 2021, 45, 11284–11293. [Google Scholar] [CrossRef]
  31. Chen, S.; Pan, Y. Influence of Group III and IV Elements on the Hydrogen Evolution Reaction of MoS2 Disulfide. J. Phys. Chem. C 2021, 125, 11848–11856. [Google Scholar] [CrossRef]
  32. Zhu, N.; Guo, Y.; Zhang, X.; Wang, F. The elastic anisotropy, electronic and thermodynamic properties of TM5Si4 (TM = Sc, Y, Ti, Zr and Hf) silicides from first-principles calculations. Vacuum 2021, 194, 110586. [Google Scholar] [CrossRef]
  33. Zhu, Z.; Zhang, Y.J.; Li, Y.; Li, Q.; Duan, W.; Wen, H.H. Comparative studies on superconductivity in Cr3Ru compounds with bcc and A15 structures. J. Phys. Condens. Matter 2022, 34, 475602. [Google Scholar] [CrossRef] [PubMed]
  34. Mehl, M.J.; Papaconstantopoulos, D.A. Applications of a tight-binding total-energy method for transition and noble metals: Elastic constants, vacancies, and surfaces of monatomic metals. Phys. Rev. B 1996, 54, 4519. [Google Scholar] [CrossRef]
  35. Kittel, C. Introduction to Solid State Physics, 8th ed.; John Wiley & Sons, Inc: Hoboken, USA, 2005. [Google Scholar]
  36. Hong, S.; Fu, C.L. Phase stability and elastic moduli of Cr2Nb by first-principles calculations. Intermetallics 1999, 7, 5–9. [Google Scholar] [CrossRef]
  37. Li, Z.; Xiong, K.; Sun, Y.; Jin, C.; Zhang, S.; He, J.; Mao, Y. First-principles study of mechanical and thermodynamic properties of intermetallic Pt3M (M = Al, Hf, Zr, Co, Y, Sc). Comput. Condens. Matter 2020, 23, e00462. [Google Scholar] [CrossRef]
  38. Heid, R.; Bohnen, K.-P.; Renker, B.; Wolf, T.; Schober, H. Ab initio lattice dynamics and electron-phonon coupling in the refractory compounds ZrN and HfN. Phys. Rev. B 2005, 71, 92302. [Google Scholar] [CrossRef]
  39. Ding, W.-J.; Yi, J.-X.; Chen, P.; Li, D.-L.; Peng, L.-M.; Tang, B.-Y. Elastic properties and electronic structures of typical Al–Ce structures from first-principles calculations. Solid State Sci. 2012, 14, 555–561. [Google Scholar] [CrossRef]
  40. Liu, X.; Feng, Q.; Tang, B.; Zheng, J.; Zheng, Z.; Zhou, W.; Tian, J.; Wang, J. First-principles calculations of mechanical and thermodynamic properties of tetragonal Be12Ti. RSC Adv. 2019, 9, 5302–5312. [Google Scholar] [CrossRef]
  41. Popoola, A.I. Computational Study of Noble Metal Alloys; University of Witwatersand: Johannesburg, South Africa, 2014. [Google Scholar]
  42. Skinner, D.J.; Zedalis, M. Elastic modulus versus melting temperature in aluminum based intermetallics. Scr. Metall. 1988, 22, 1783–1785. [Google Scholar] [CrossRef]
  43. Blackman, M. On the calculation of characteristic temperatures from the Elastic constants. Lond. Edinb. Dublin Philos. Mag. J. Sci. 1951, 42, 1441–1442. [Google Scholar] [CrossRef]
  44. Fine, M.E.; Brown, L.D.; Marcus, H.L. Elastic constants versus melting temperature in metals. Scr. Metall. 1984, 18, 951–956. [Google Scholar] [CrossRef]
  45. Popoola, A.I.; Lowther, J.E. Computational Study of Platinum Group Superalloys. Int. J. Mod. Phys. B 2014, 28, 1450066. [Google Scholar] [CrossRef]
  46. Reuss, A. Calculation of the flow limits of mixed crystals on the basis of the plasticity of monocrystals. Z. Angew. Math. Mech. 1929, 9, 49–58. [Google Scholar] [CrossRef]
  47. Hill, R. The elastic behaviour of a crystalline aggregate. Proc. Phys. Soc. Sect. A 1952, 65, 349. [Google Scholar] [CrossRef]
  48. Liu, K.; Dong, B.; Zhou, X.L.; Wang, S.M.; Zhao, Y.S.; Chang, J. Structural, elastic, and thermodynamic properties of hexagonal molybdenum nitrides under high pressure from first principles. J. Alloys Compd. 2015, 632, 830–836. [Google Scholar] [CrossRef]
  49. Zhang, Y.; Chen, H.-X.; Duan, L.; Fan, J.-B.; Ni, L.; Ji, V. A comparison study of the structural and mechanical properties of cubic, tetragonal, monoclinic, and three orthorhombic phases of ZrO2. J. Alloys Compd. 2018, 749, 283–292. [Google Scholar] [CrossRef]
  50. Salje, E. Phase transitions in ferroelastic and co-elastic crystals. Ferroelectrics 1990, 104, 111–120. [Google Scholar] [CrossRef]
  51. Falk, F. Model free energy, mechanics, and thermodynamics of shape memory alloys. Acta Metall. 1980, 28, 1773–1780. [Google Scholar] [CrossRef]
  52. Poirier, J.-P. Introduction to the Physics of the Earth’s Interior; Cambridge University Press: Cambridge, UK, 2000. [Google Scholar]
  53. Pugh, S.F. XCII. Relations between the elastic moduli and the plastic properties of polycrystalline pure metals. Lond. Edinb. Dublin Philos. Mag. J. Sci. 1954, 45, 823–843. [Google Scholar] [CrossRef]
  54. Frantsevich, I.N.; Voronov, F.F.; Bokuta, S.A. Elastic Constants and Elastic Moduli of Metals and Insulators Handbook; Frantsevich, I.N., Ed.; Naukova Dumka: Kiev, Ukraine, 1983; pp. 60–180. [Google Scholar]
  55. Chen, X.-Q.; Niu, H.; Li, D.; Li, Y. Modeling hardness of polycrystalline materials and bulk metallic glasses. Intermetallics 2011, 19, 1275–1281. [Google Scholar] [CrossRef]
  56. Bai, J.; Raulot, J.M.; Zhang, Y.D.; Esling, C.; Zhao, X.; Zuo, L. Crystallographic, magnetic, and electronic structures of ferromagnetic shape memory alloys Ni2XGa (X = Mn, Fe, Co) from first-principles calculations. J. Appl. Phys. 2011, 109, 014908. [Google Scholar] [CrossRef]
  57. Togo, A.; Tanaka, I. First principles phonon calculations in materials science. Scr. Mater. 2015, 108, 1–5. [Google Scholar] [CrossRef]
  58. Liu, X.; Ge, X.; Si, R.; Zhang, M.; Xu, X. A survey investigation on the stability, electronic and elastic properties of hexagonal ternary transition-metal borides by first-principles calculations. Vacuum 2020, 177, 109432. [Google Scholar] [CrossRef]
Figure 1. Crystal structure of primitive tetragonal X3Ru alloy. The green balls represent Ru atoms, while the purple balls represent X (X = Sc − Zn) atoms.
Alloys 03 00007 g001
Figure 2. Partial density of states of tP16 X3Ru (X = Sc − Mn) structures.
Alloys 03 00007 g002
Figure 3. Partial density of states of tP16 X3Ru (X = Fe − Zn) structures, where the dotted line is the Fermi energy (Ef = zero). The arrows represent the spin-up and -down DOS for all the structures.
Alloys 03 00007 g003
Figure 4. Dispersion curves for (a) Sc3Ru, (b) Ti3Ru, (c) V3Ru, (d) Cr3Ru (e) Mn3Ru, (f) Fe3Ru, (g) Co3Ru, (h) Ni3Ru, (i) Co3Ru, and (j) Zn3Ru alloys in tP16 phase at high symmetric points in the Brillouin zone. The blue lines indicate the zero-phonon frequency.
Alloys 03 00007 g004
Table 1. Optimized lattice constants (a, c), volume (V0), ratio of c/a, heat of formation (ΔHf), magnetic moment (µB), and density of tP16 X3Ru (X = Sc − Zn) structures.
Alloy a (Å)c (Å)V03)ΔHf (eV/Atom)Magnetic Moments (µB/Atom)Density (g/cm3)c/a
Sc3Ru6.238.97348.07−0.180.024.501.44
Ti3Ru5.409.28270.39−0.410.896.011.72
V3Ru5.738.11266.05−0.272.196.341.42
Cr3Ru
Cr3Ru [16]
6.04
5.20
7.28265.890.11
0.24
0.686.421.21
Mn3Ru5.758.14269.02−1.613.256.561.42
Fe3Ru5.078.02206.150.070.958.651.58
Co3Ru5.207.34198.300.101.829.311.41
Ni3Ru5.157.28192.890.921.089.551.41
Cu3Ru5.217.37200.430.310.009.671.41
Zn3Ru5.367.57217.32−0.230.009.081.41
tI16-Pt3Al [17]5.4 −0.79 1.45
tP16-Pt3Ga [12]5.57.80 6.14
L12-Pt3Al [37]3.9
Table 2. Elastic constants (Cij) and melting temperatures (MT) of X3Ru (X = Sc − Zn) structures. The data for the currently used alloy L12 Ni3Al structure are included for comparison.
PhaseC11C12C13C33C44C66MT ± 300 K
Sc3Ru120.4664.8162.4295.4838.428.42858.60
Ti3Ru172.2677.4391.89162.47154.623.501114.49
V3Ru192.8224.3573.52154.0058.8647.651163.46
Cr3Ru51.5336.4853.035.39−3.6515.73516.68
Mn3Ru190.7929.4083.55130.8977.6425.211122.71
Fe3Ru361.3177.92141.14237.9639.08−42.411794.87
Co3Ru330.9868.68170.26270.15130.8536.121602.33
Ni3Ru337.15115.37166.10286.49117.2963.191795.19
Cu3Ru262.2687.26153.90192.0794.7228.841428.89
Zn3Ru247.5968.25122.39177.6189.1653.271363.19
L12-Ni3Al [45]
L12-Pt3Al [37]
235
317
157
177
128
111
1691.00
Table 3. Bulk (GPa), shear (GPa), Young modulus (GPa), BH/GH, Poisson’s ratio ( υ ), and Vickers hardness (HV) of X3Ru (X = Sc, Ti, V, Cr, Mn, Fe, Co, Ni, Cu, and Zn) structures, where V, R, and H stands for Voigt, Reuss, and Hill approximations. The UND = undefined. Data for L12-Ni3Al and L12-Pt3Al are included for comparison.
tP16 PhaseBVGVBRGRBHGHEHBH/GH υ HV
Sc3Ru79.5226.8478.2119.6178.8623.2263.433.400.3660.01
Ti3Ru114.3878.93114.3514.34114.3746.6483.282.450.3213.63
V3Ru98.0557.6297.9453.8697.9955.74140.571.760.2618.35
Cr3Ru43.73−0.5845.4412.4344.58−6.51−20.53−6.850.577UND
Mn3Ru100.6157.16100.5642.22100.5849.69127.992.020.2885.61
Fe3Ru186.7847.18184.4896.20185.6371.69190.542.590.3295.00
Co3Ru194.5094.42193.0767.62193.7981.02213.332.390.3176.43
Ni3Ru206.2193.77206.2185.46206.2189.61234.822.300.3107.46
Cu3Ru167.4165.09167.3942.36167.4053.72145.593.120.3552.44
Zn3Ru144.3270.30144.0158.49144.1764.39168.142.240.3065.90
Li2-Ni3Al [45] 183.0092.00237.001.980.280
Li2-Pt3Al [37] 2.43
Table 4. Shear anisotropy factors (A1, A2), universal elastic anisotropy index (AU), and the percentage of anisotropy (AB) of X3Ru (X = Sc, Ti, V, Cr, Mn, Fe, Co, Ni, Cu, and Zn) structures.
PhaseA1A2AUAB
Sc3Ru0.301.691.860.83
Ti3Ru0.074.1022.530.01
V3Ru0.571.180.350.06
Cr3Ru2.090.30−4.80−1.92
Mn3Ru0.312.011.771.77
Fe3Ru−0.300.49−2.533.45
Co3Ru0.282.011.990.37
Ni3Ru0.571.610.490.00
Cu3Ru0.332.592.680.01
Zn3Ru0.591.981.010.11
Disclaimer/Publisher’s Note: The statements, opinions and data contained in all publications are solely those of the individual author(s) and contributor(s) and not of MDPI and/or the editor(s). MDPI and/or the editor(s) disclaim responsibility for any injury to people or property resulting from any ideas, methods, instructions or products referred to in the content.

