Article

Oxidation Kinetics of FeCr and FeCrAl Alloys: Influence of Secondary Processes (Continuation)

by
Irakli Nakhutsrishvili
* and
Revaz Tevzadze
Vladimer Chavchanidze Institute of Cybernetics, Georgian Technical University, Zurab Anjafaridze 5, 0186 Tbilisi, Georgia
*
Author to whom correspondence should be addressed.
Submission received: 13 December 2024 / Revised: 22 January 2025 / Accepted: 24 January 2025 / Published: 27 January 2025

Abstract

:
This paper discusses the influence of the secondary processes of reaction product evaporation and the reduction of the effective diffusion area into the scale on the kinetics (change in sample mass–time) of the high-temperature oxidation processes, in air, of alumina- and chromia-forming alloys.

1. Introduction

Alloys consisting of iron with a main addition of chromium or nickel (stainless steel) has a long history. As early as the first half of the 19th century, M. Faraday and P. Berthier established the ability of an iron–chromium alloy to resist acid corrosion. Stainless steel was patented in 1912 by the German company Krupp, and the name was given by the English engineer G. Brierley. From this time on, the interest of scientists and engineers in FeCr and FeCrAl alloys began to awaken. FeCr and FeCrAl alloys are widely used because they have many positive properties—The use temperature in the atmosphere can reach 1400 °C long service life, high surface load, good oxidation resistance, low specific gravity, high resistance, good resistance to sulfur, cheap price, etc.
Much information about the resistance of these alloys has been obtained by studying the kinetics of their high-temperature oxidation, which has been undertaken from the early years of this process to the present [1,2,3,4,5,6,7,8,9,10] (only a small portion of the huge number of works are cited here). When FeCr is oxidized, a protective layer of chromia (Cr2O3) is formed, and in the case of FeCrAl, Alumina (Al2O3) is formed. To improve the film adherence and a number of the properties (stability, slow growth, etc.) of the alloy, alloying with rare earth metals (lanthanum, yttrium, cerium, etc.) is widely used. A large number of works are also devoted to this [8,9,10,11,12,13,14,15].
The distinctive feature between the Cr2O3 and Al2O3 films is that the former evaporates while the latter does not. This leads to a significant difference in the kinetics of the oxidation process of FeCr and FeCrAl alloys. Therefore, after the experimental section, the simpler case with FeCr will be considered first, and in the conclusion of this section, we will point out the main feature distinguishing the oxidation processes of FeCr and FeCrAl and FeCrREM and FeCrAlREM alloys; i.e., that in the presence of rare earth (Re) metals, chromites (LaCrO3, YCrO3, CeCrO3, etc.) are formed. With densely packed sublattices, these chromites create barriers for cation diffusion. This leads to a deviation in the oxidation process kinetics from the usual power (parabolic, cubic, and, in rarer cases, fourth-degree) law mn = knt (m—mass gain per unit area at the time t; kn—constant of the nth degree). In Refs. [16,17,18], the decrease in the effective area of the oxidation reaction was taken into account, and the corresponding kinetic equations were derived. These equations contain the following distinctive parameters: S = S0e−km and φ = S/S0, where k is a constant of reduction of the reaction area, and S, S0 are the current and initial sizes. The resulting equations are Equation (1) [16] and Equation (2) [17]:
m = 1 k l n k k p t 1 ,
m = 1 k l n k k p t 1 v m ,
as well as Equation (3) [18]:
t =   2 k 2 k p   [ e k m ( k m 1 ) + 1 ] ,
where k p is the parabolic rate constant (n = 2) and v m is the rate of evaporation of metallic component of Cr2O3. (The rate of evaporation of the main reaction product (vp) can be represented as the sum of the rates of the metallic and gaseous (vg) components: vp = vm + vg. Since oxygen continuously diffuses into the scale to the alloy surface during the oxidation process, it is obvious that the decrease of the mass of the entire system will be determined by evapoation of the metallic component.)
In Equation (3), as in (1), scale evaporation is not taken into account. In Ref. [18], it is indicated that if we take into account the simultaneous processes of evaporation and the change in the reaction surface, then we should be able to solve the differential equation dm/dt = [kp/(2m + kp/kr)]e−km − vm (kr is the rectilinear constant, and vg is the evaporation rate of reaction products by the gaseous component of the scale). However, the integral x e a x b + c x e a x dx (a, b, and c are constants; in this case, x = m, a = k, b = kp/2vg, and c = −1) cannot be represented by means of elementary functions [18]. More discussion can be found in Appendix A.
From Equation (3), S = S0e−km and φ = S/S0 it follows that
t = 2 k 2 k p   [ 1 φ 1 l n ( e φ ) ] .  
And in the case of kr , we will obtain
t = 2 k 2 k p   [ 1 φ 1 l n ( e φ ) ] + ( k k r ) 1 ( φ 1 1 ) .
Below, we will consider the kinetics (mass change of sample–time) of the oxidation processes, in air, of alumina- and chromia-forming alloys using Equations (3)–(5). (Equations (1)–(3) are obtained on the basis of a “simple” parabolic dependence. But then in origin of coordinate system (t = 0, m = 0) it turns out that dm/dt =   . However, it is impossible for the reaction to proceed with an infinite initial velocity. To eliminate this infinity, instead of a “simple”, a “complex” (and sometimes complete) parabolic equation is considered: t = m 2 k p + m k r and solving the corresponding differential equation we will have:
t = 2(k2kp)−1[ekm(km − 1)+1] + (kkr)−1(ekm − 1).
We will use this implicit dependence further in those cases when kr . (Sometimes the tangent to the kinetic curves at the origin of coordinates practically coincides with the ordinate axis. In such cases, it can be assumed that kr .).)

2. Experimental Section

The research alloys are well suited for preliminary thermochemical treatment [19,20]. As a result of this process, re-ions are localized via diffusion on the surface of the sample. This improves the heat resistance of the material by one order. Of the rare earth elements, lanthanum was used. The compositions of the alloys were Fe-44Cr-4Al-0.3La and Fe-44Cr-0.3La. The samples were in the form of low cylinders, with a diameter of bases of 30 mm and a height of 1 mm. Scanning electron microscopy (device SEC SNE-4500 Plus, Suwon, Republic of Korea), X-ray analysis (HZG-4A, Freiberger Präzisionsmechanik GmbH, Freiberg, Germany), and Auger spectroscopy (LAS-2000, ULT AG, Löbau, Germany) methods were used to analyze the samples. The research conducted by these methods shows that during the oxidation process, a grainy film of aluminum closely grown with the matrix is formed, the thickness of which is (100–500) nm. In addition, the composition of the scale is multiphase; together with Al2O3, complex oxides Fe(Cr2O3Al2O3), FeAl2O4, and FeCr2O4 are formed (Figure 1 and Figure 2).
The oxidation temperature was (1100–1300) °C. The temperature of the electric heater was regulated using a high-precision regulator VRT–3 with an accuracy of ±0.5 °C. The samples were heated at a rate of 25 °C/min.
Kinetic measurements were carried out by continuously weighing the samples during the oxidation process. For this purpose, a homemade microbalance built into a vacuum unit was used (Figure 3). Electromagnetic compensation for changes in the sample mass was carried out automatically (Figure 4).
The balance beam made of molybdenum glass, 180 mm long and 2.5 mm in diameter, was fixed on a tungsten filament with a diameter of 20 μm. The balance settling time was 10–15 s, and the maximum load was 5 g. The sensitivity of the balance was 10−6 g.
The electrical signal compensating for the balance beam deviation was recorded on a V-7-16-A digital voltmeter and recorded on a KSP-4 recorder. The signal was calibrated using special reference weights.

3. Results and Discussion

First, let us consider the question of which of the Equations (1)–(3) should be used further. It turned out that the calculated kinetic curves constructed according to Equation (2) differ significantly from the experimental ones. This is clearly revealed with an increase in the oxidation temperature (Figure 5). The curves constructed according to Equation (3) are also shown there. It is evident that this equation should be used further.

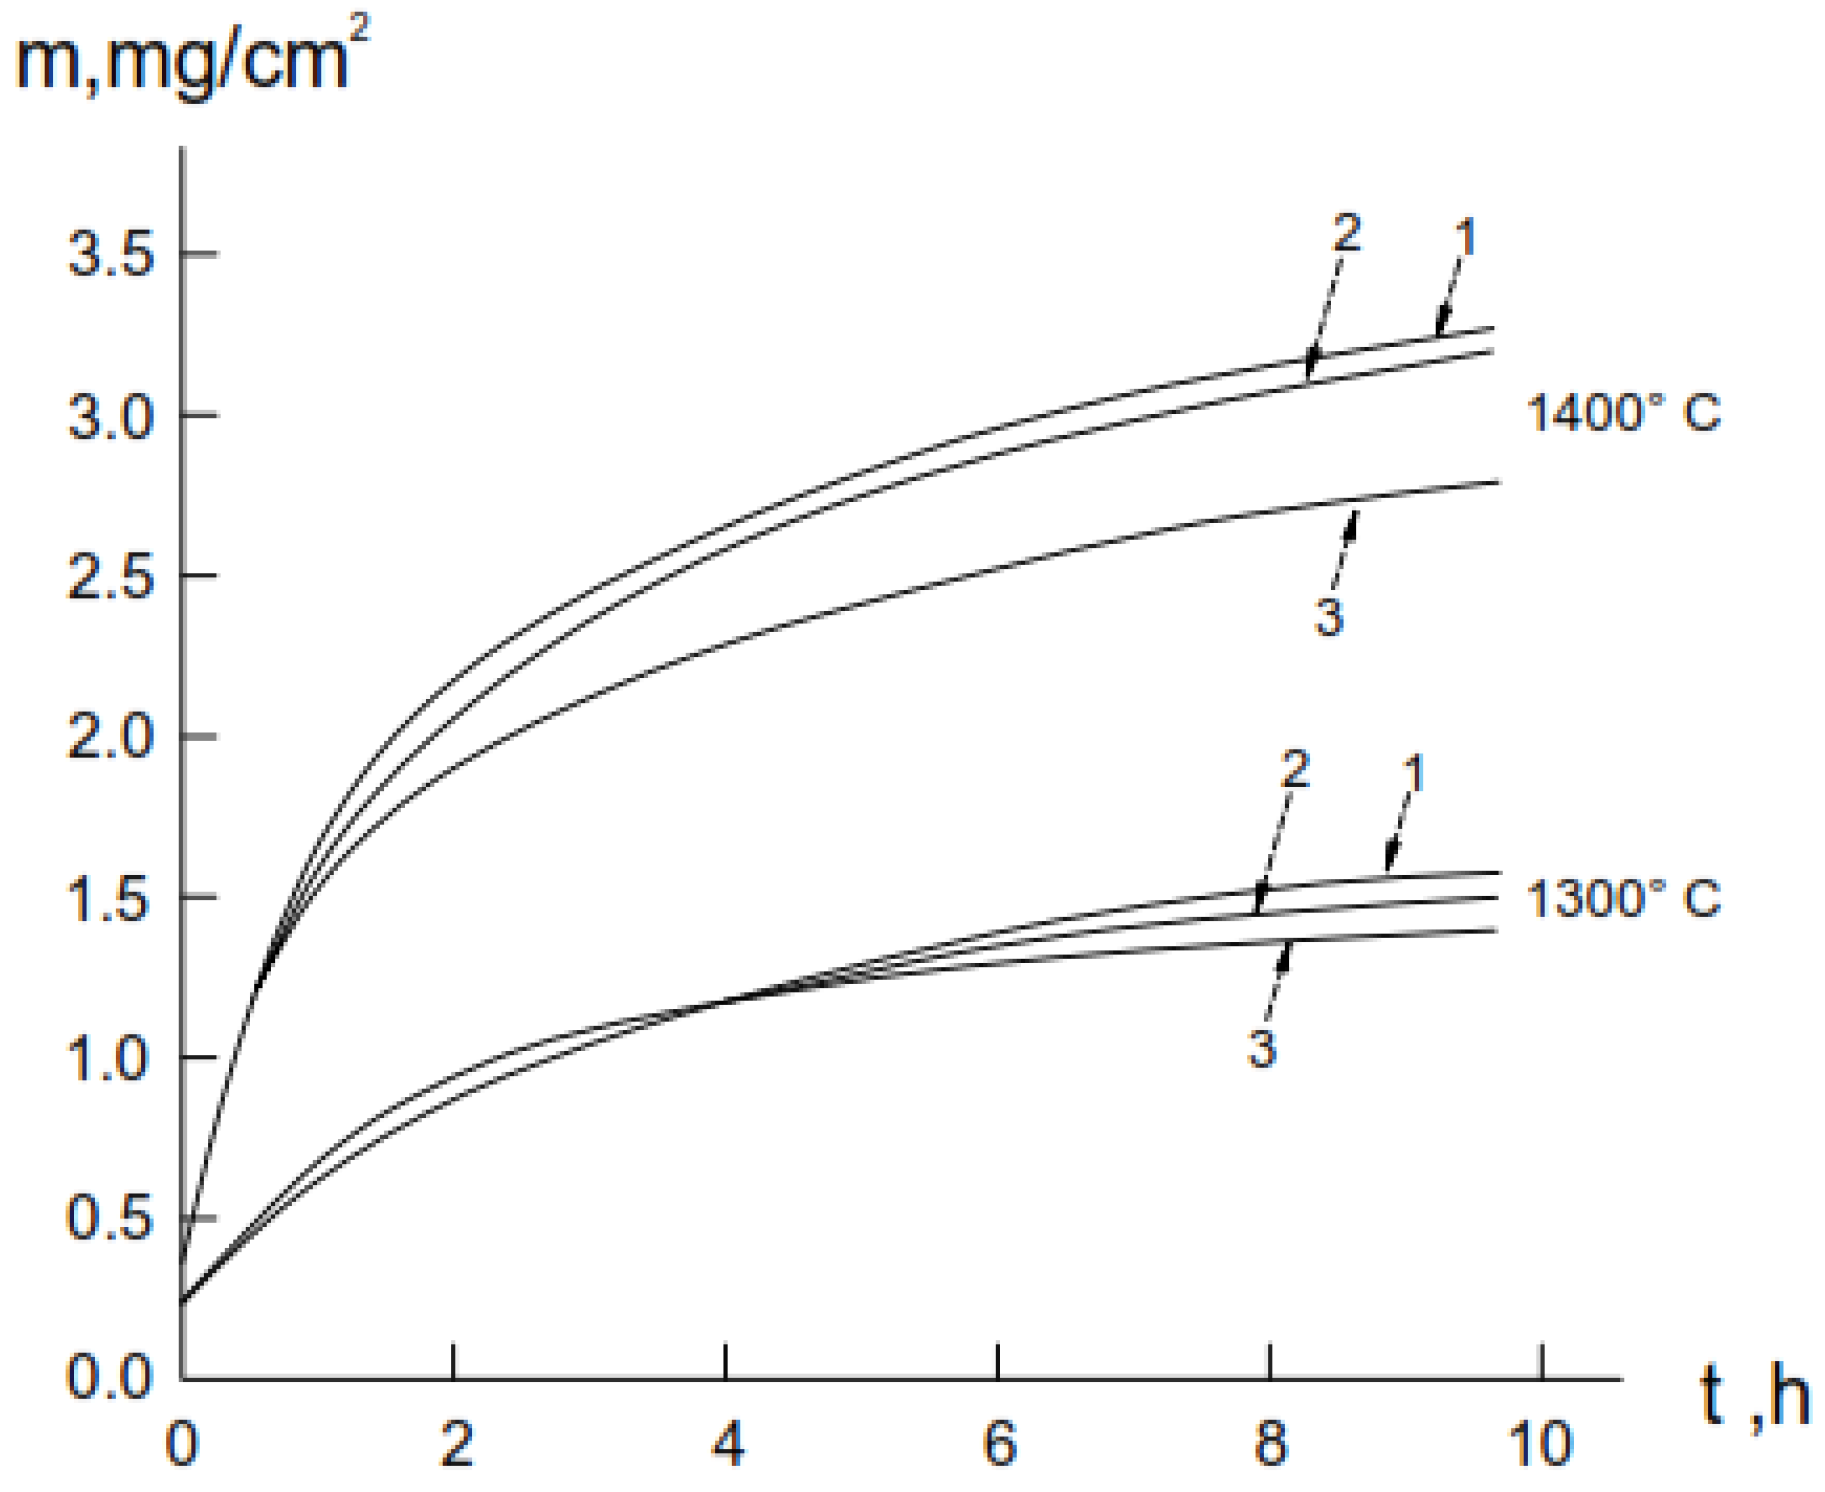
3.1. Oxidation Kinetic of Alumina-Forming Alloy in Air

A detailed study of the oxidation kinetics of the Fe-Cr-Al-La system alloys with variable content of chromium at an optimal ratio of aluminum and lanthanum showed that increasing the chromium concentration to 45 wt.% helps to achieve the maximum positive effect [21,22,23].
Figure 6 shows a typical experimental kinetic curve of the oxidation of the FeCrAl(La) alloy in air (curve 1). The nature of this curve indicates that with continuous oxidation for at least 10 h, the oxide film remains intact. This indicates its sufficient strength and plasticity. The same figure also shows a theoretical curve calculated using Equation (3). And in Table 1, the values of kinetic parameters are given. They are calculated/according to the methodology given in [24]. It can be seen that the experimental and theoretical curves are in satisfactory agreement.
Figure 7 shows the experimental and calculated kinetic curves denoting the decrease in the effective diffusion area during the oxidation of the FeCrAl(La) alloy at 1300 °C (curves 1 and 2, respectively). It also shows that the experimental and theoretical curves are in satisfactory agreement.
Let us introduce a new parameter: tA = 2k−2kp−1. From Formulae (4) and (5), it is clear that this parameter characterizes a certain period of time during which the formation of diffusion barriers in the scale is practically completed. At the same time, from Equation (4), in the first approximation, it turns out that t ≈ (2m2/kp) + (m/kr). Then, by combining it with equations e−km and φ = S/S0 = e−km and (5), one can easily verify that by the time the formation of diffusion barriers is complete, φ φA e k k p 2 k r 1 .
It is evident from Figure 5 that the experimental and theoretical curves intersect at the point with coordinates (tA, φA). Based on all of the above, it can be concluded that after the t time interval, φ drops sharply to level φA and subsequently changes comparatively little during the alloy oxidation process. This is obviously due to the fact that the predominant amount of lanthane contained in the alloy has already passed into the scale, which limits the further formation of diffusion barriers near the matrix–scale interface.

3.2. Oxidation Kinetic of Chromia-Forming Alloy in Air

A large number of works, both previously and recently, have also been devoted to the study of high-temperature oxidation of chromia-forming alloys [25,26,27,28,29,30,31], etc. As already indicated above, the distinctive feature of this process from the high temperature oxidation of alumina-forming alloys is the evaporation of Cr2O3 [17,18,32,33,34], etc., which introduces a change of the nature of the process.
Figure 8 shows the results of a separate experiment on the evaporation of Cr2O3 in a vacuum.
The chromite LaCrO3 formed during oxidation of the alloy also evaporates, but at a very low rate—i.e., an order of magnitude lower than the evaporation rate of Cr2O3 at the same temperatures. Therefore, it can be ignored in the overall change in the mass of the sample when weighing it.
Figure 9 shows a typical experimental and calculated kinetic curves denoting the oxidation of the FeCr(La) alloy in air; and the kinetic curves denoting the decrease in the effective diffusion area during the process are presented in Figure 10. The values of the kinetic parameters are given in Table 2.
It should be noted that the high value of the rectilinear constant (see Table 2) simplifies the expression φA e k k p 2 k r 1 to φA e 1 (lnφA + lne = lnφA + 1 ≈ 0); i.e., φA ≈ 0.37. Thus, it can be concluded that during the high-temperature oxidation of chromium-forming alloys, the effective diffusion area initially decreases by 2.72 times, after which, the process practically enters a stationary mode.
Below are the empirical formulae compiled from the data of Table 1 and Table 2, according to which the kinetic curves were constructed in the corresponding figures:
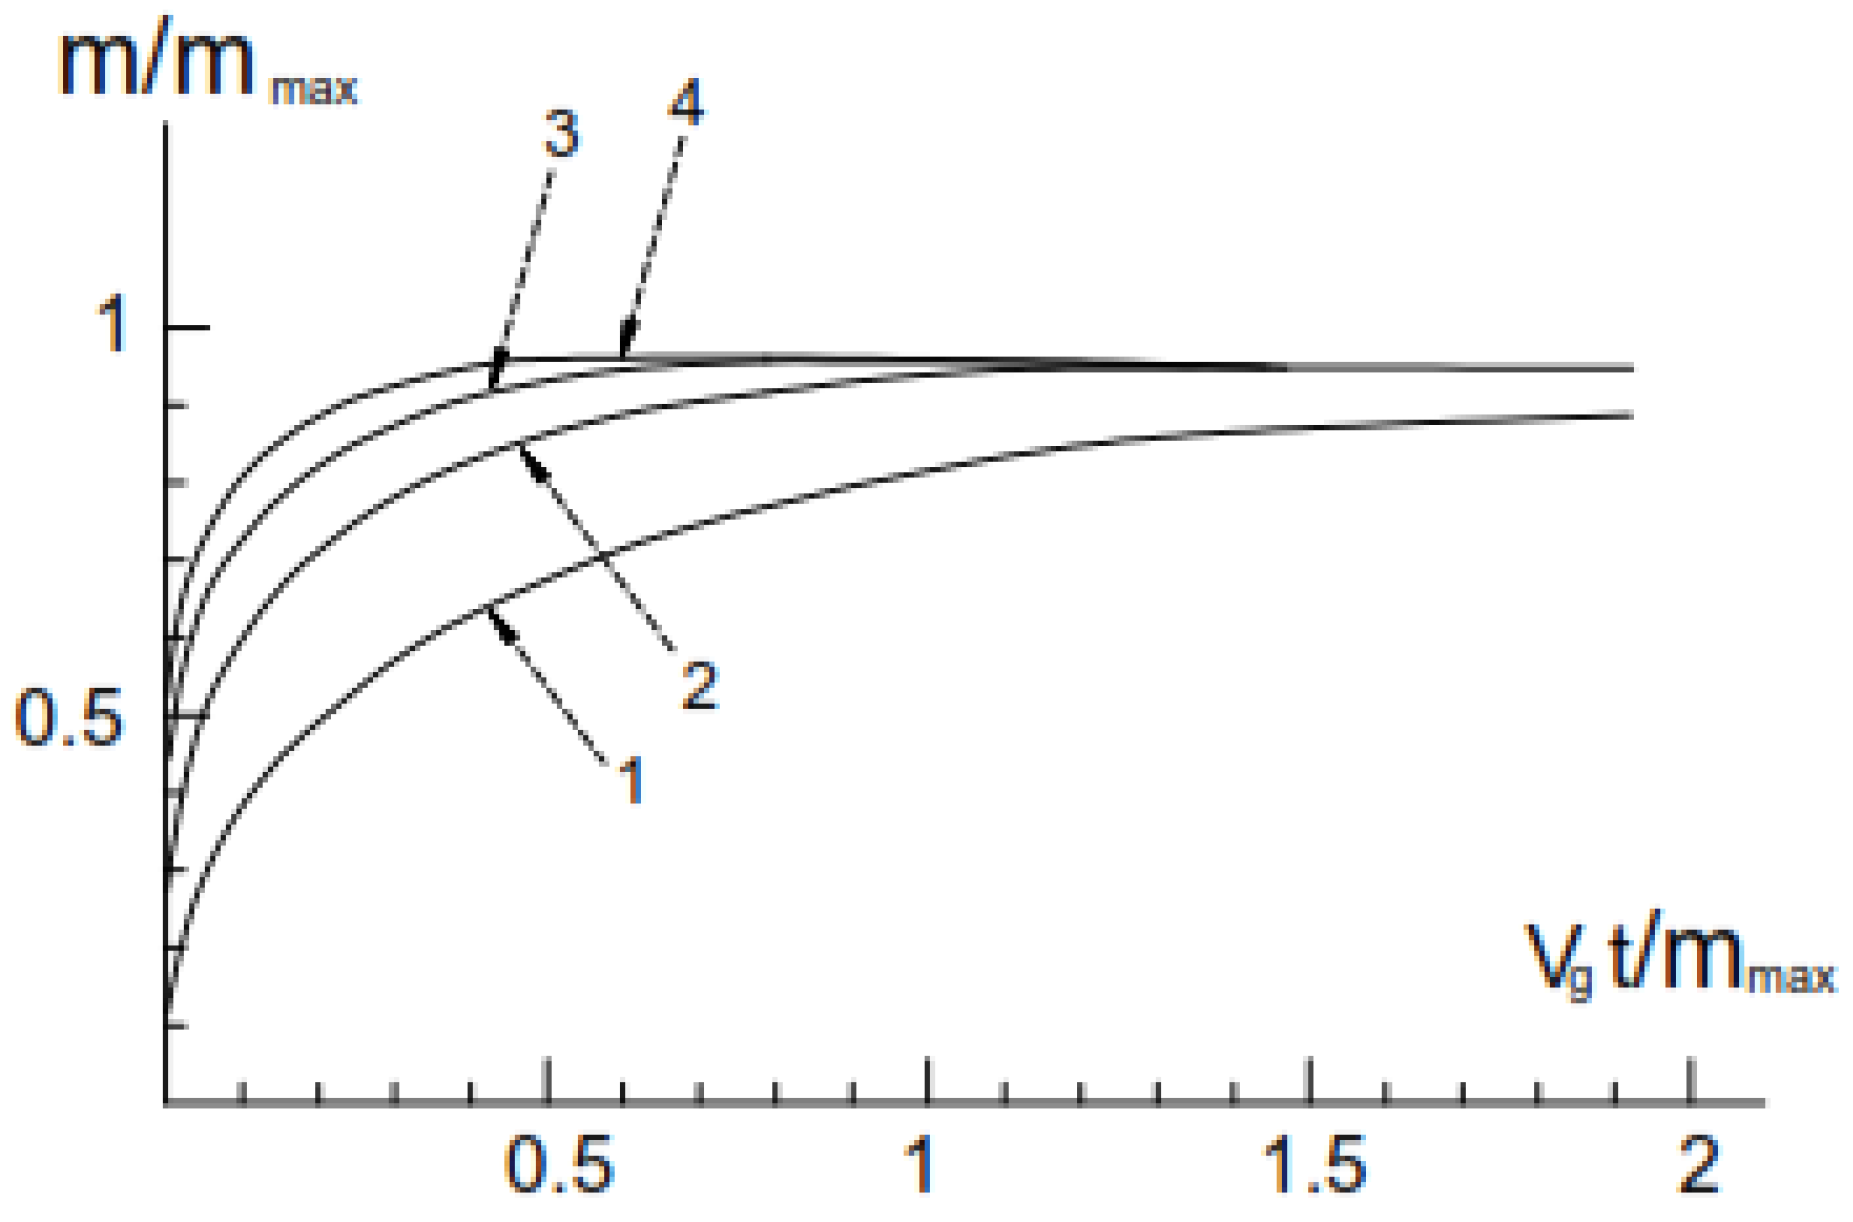
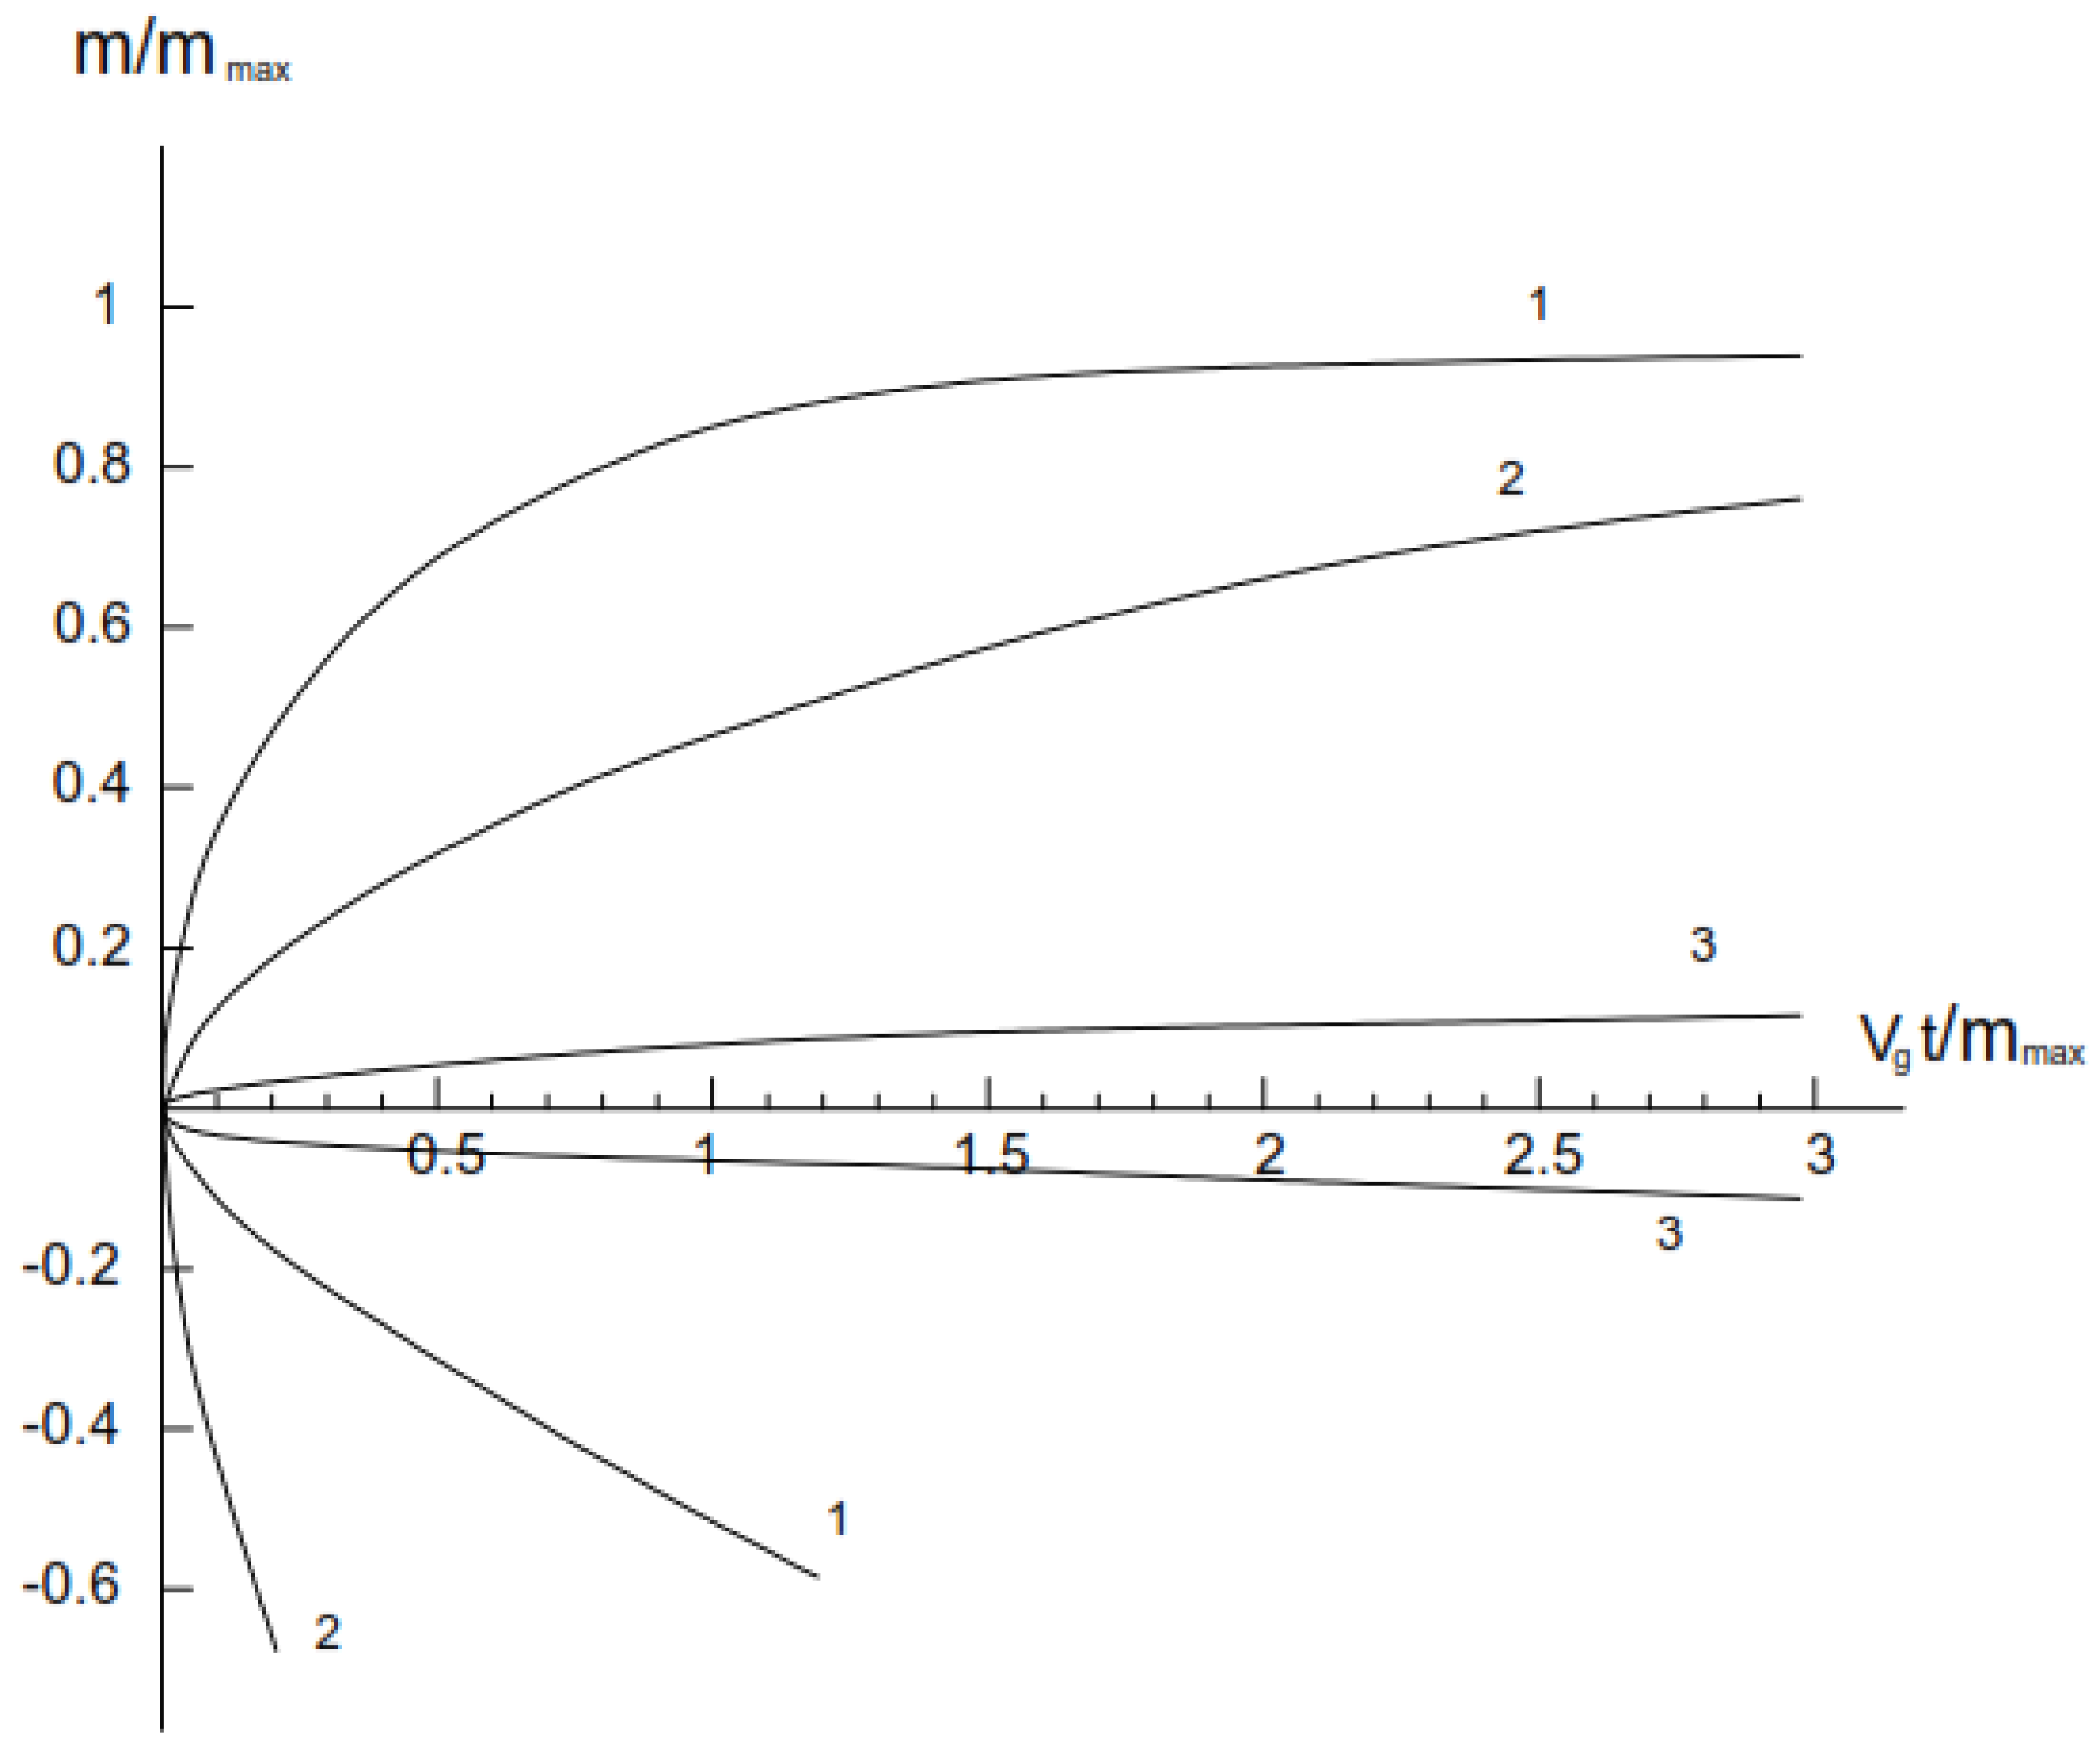
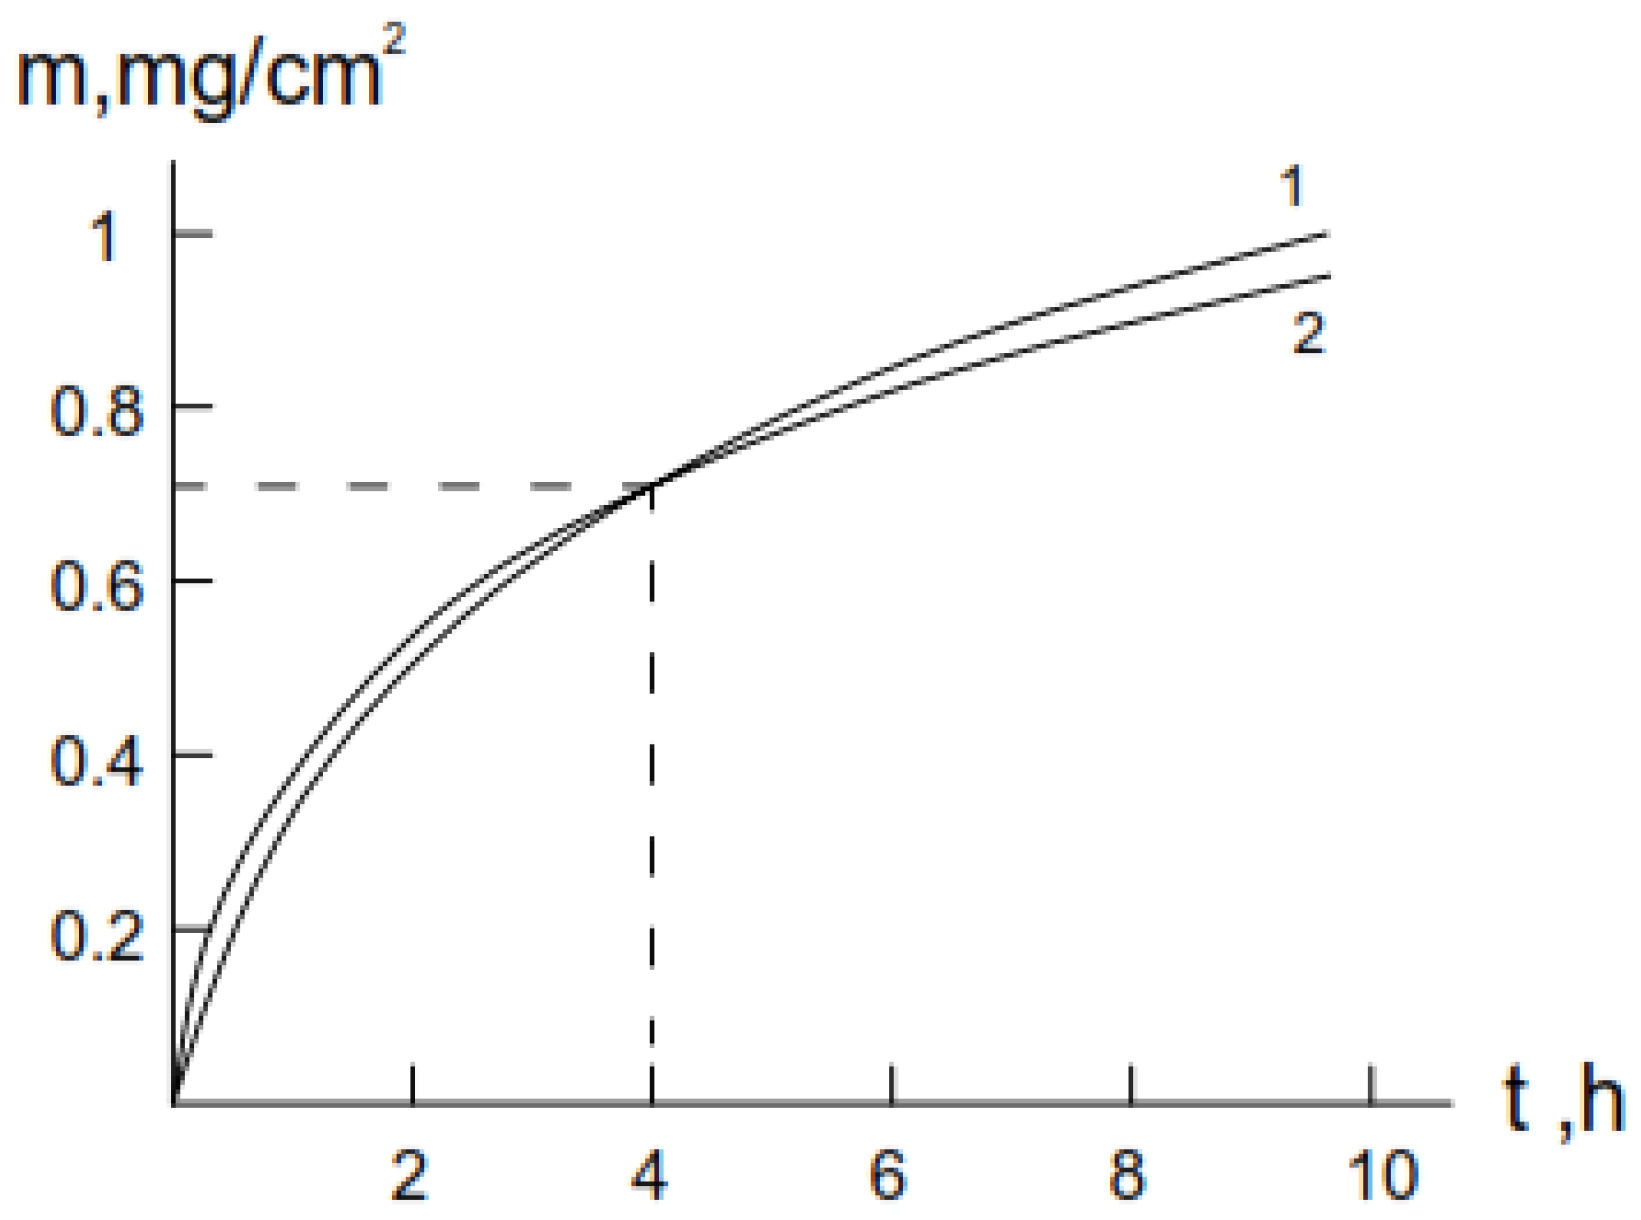
  • t ≈ 4.04 [e1.99m (1.99m − 1) + 1] + 0.77 (e1.99m − 1);
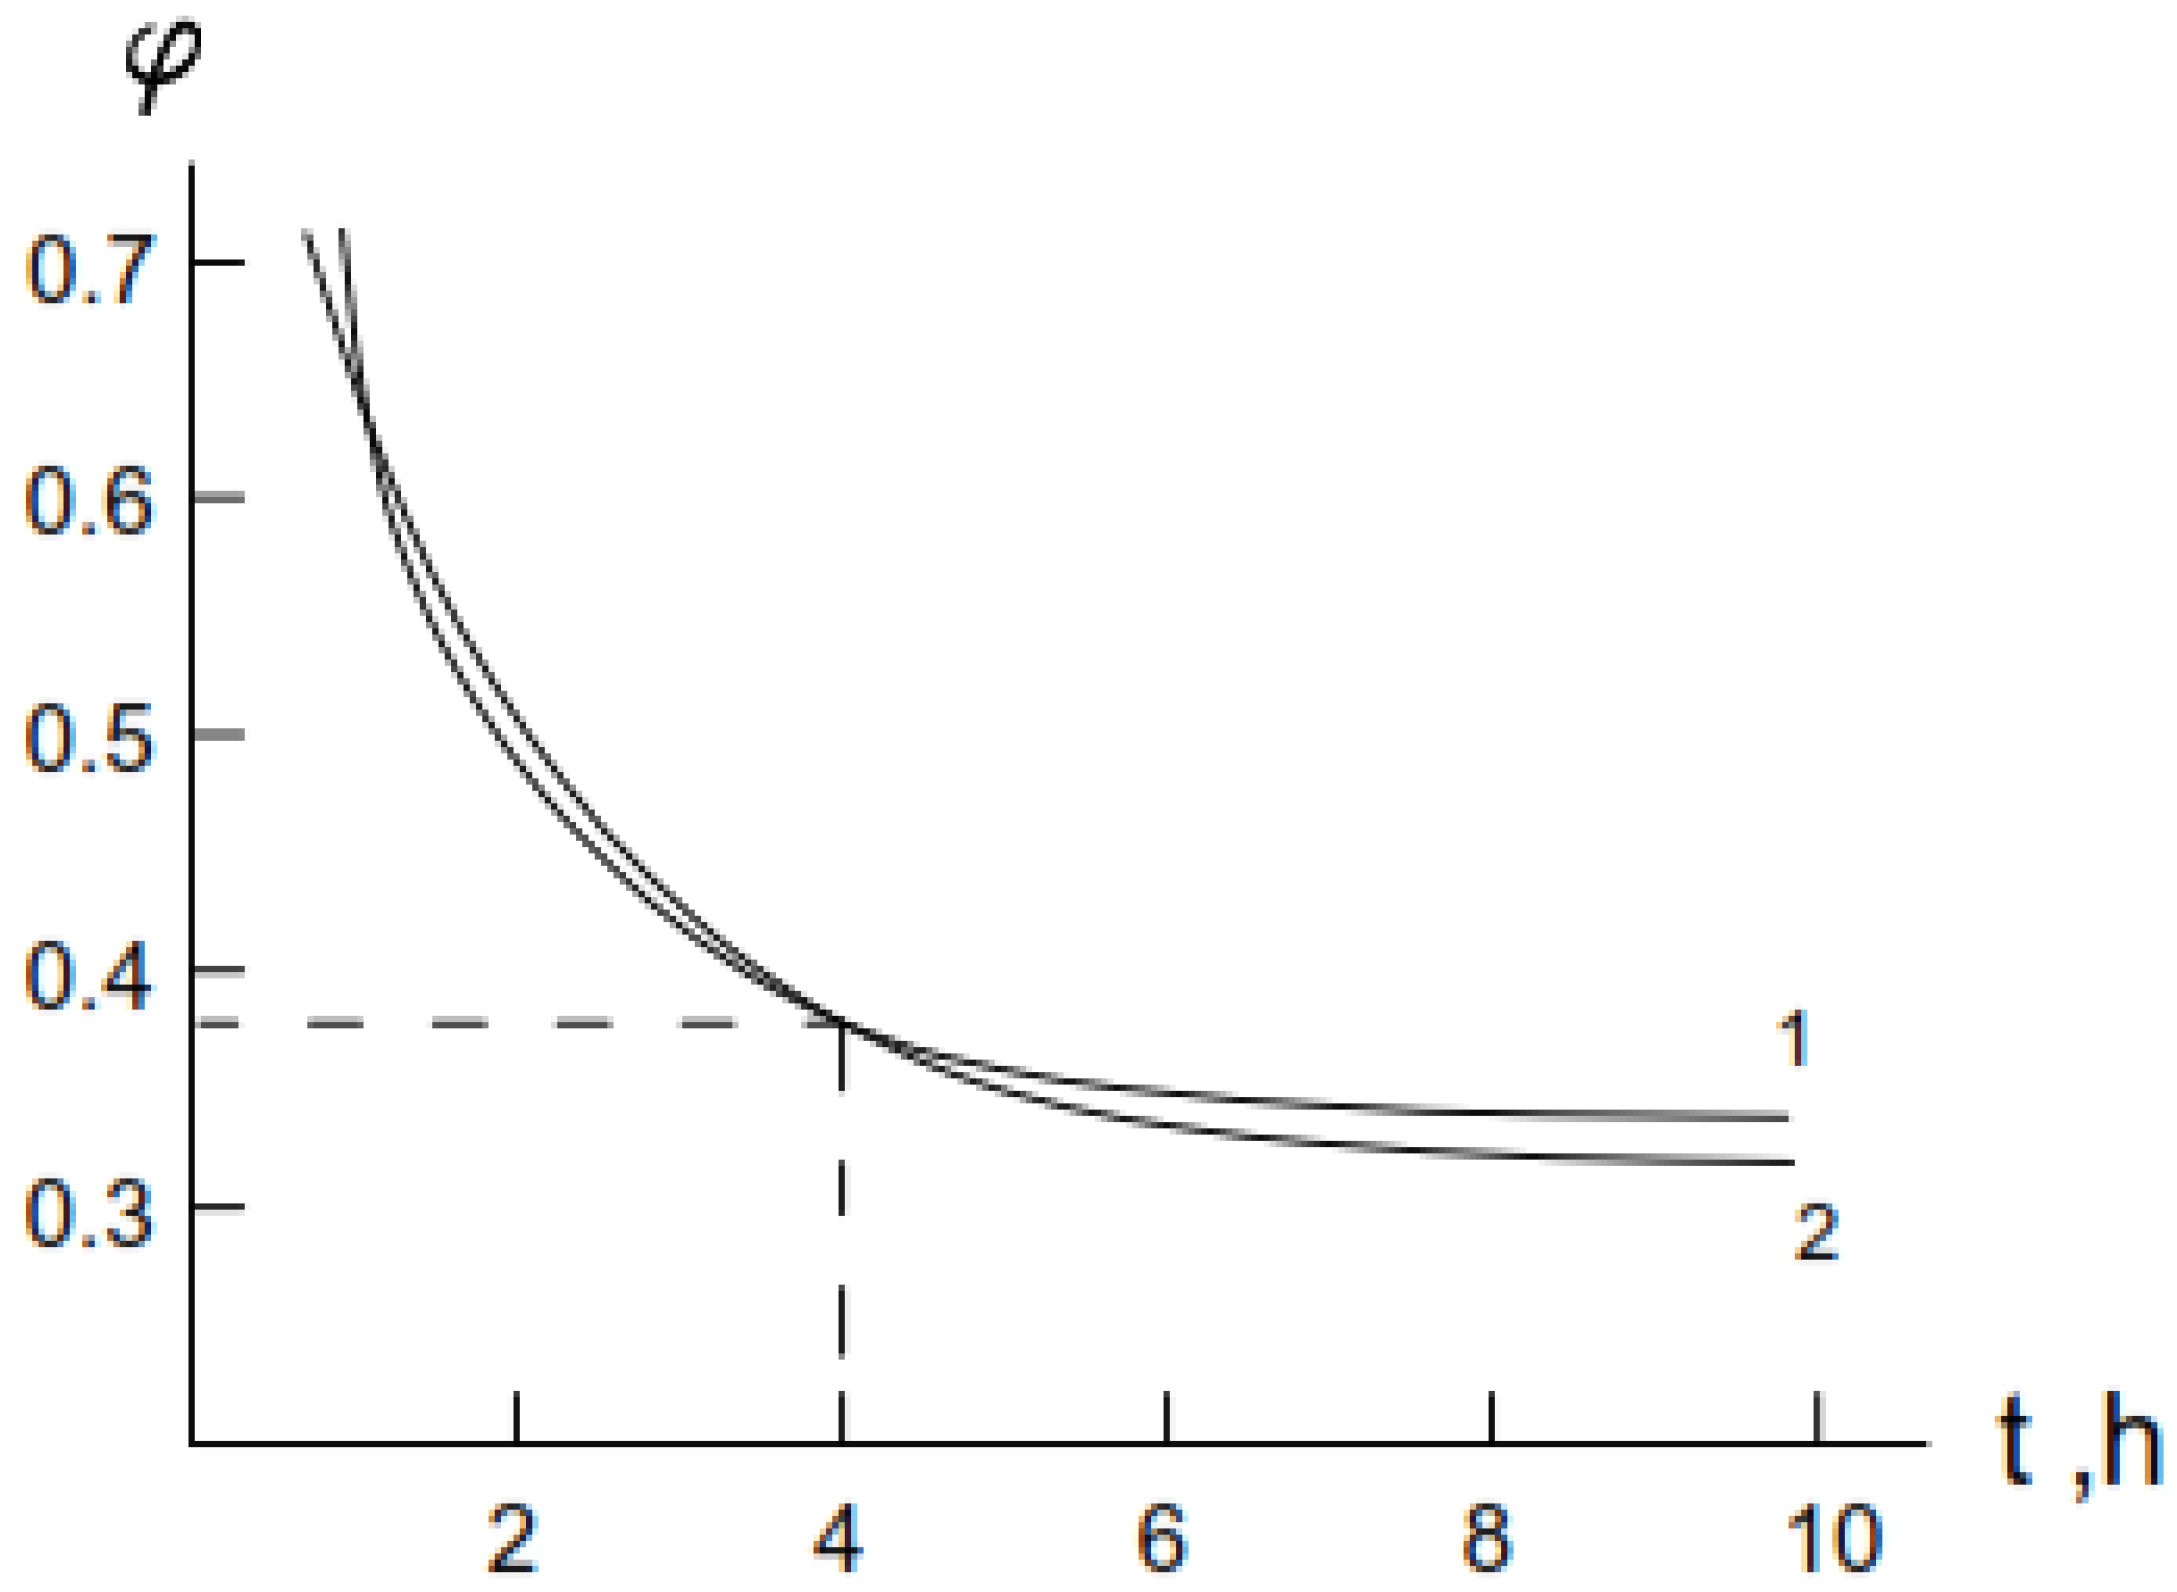
  • t ≈ 4.04 [1 − φ−1ln(eφ)] + 0.77 (φ−1 − 1) for alumina-forming alloy at 1200 °C;
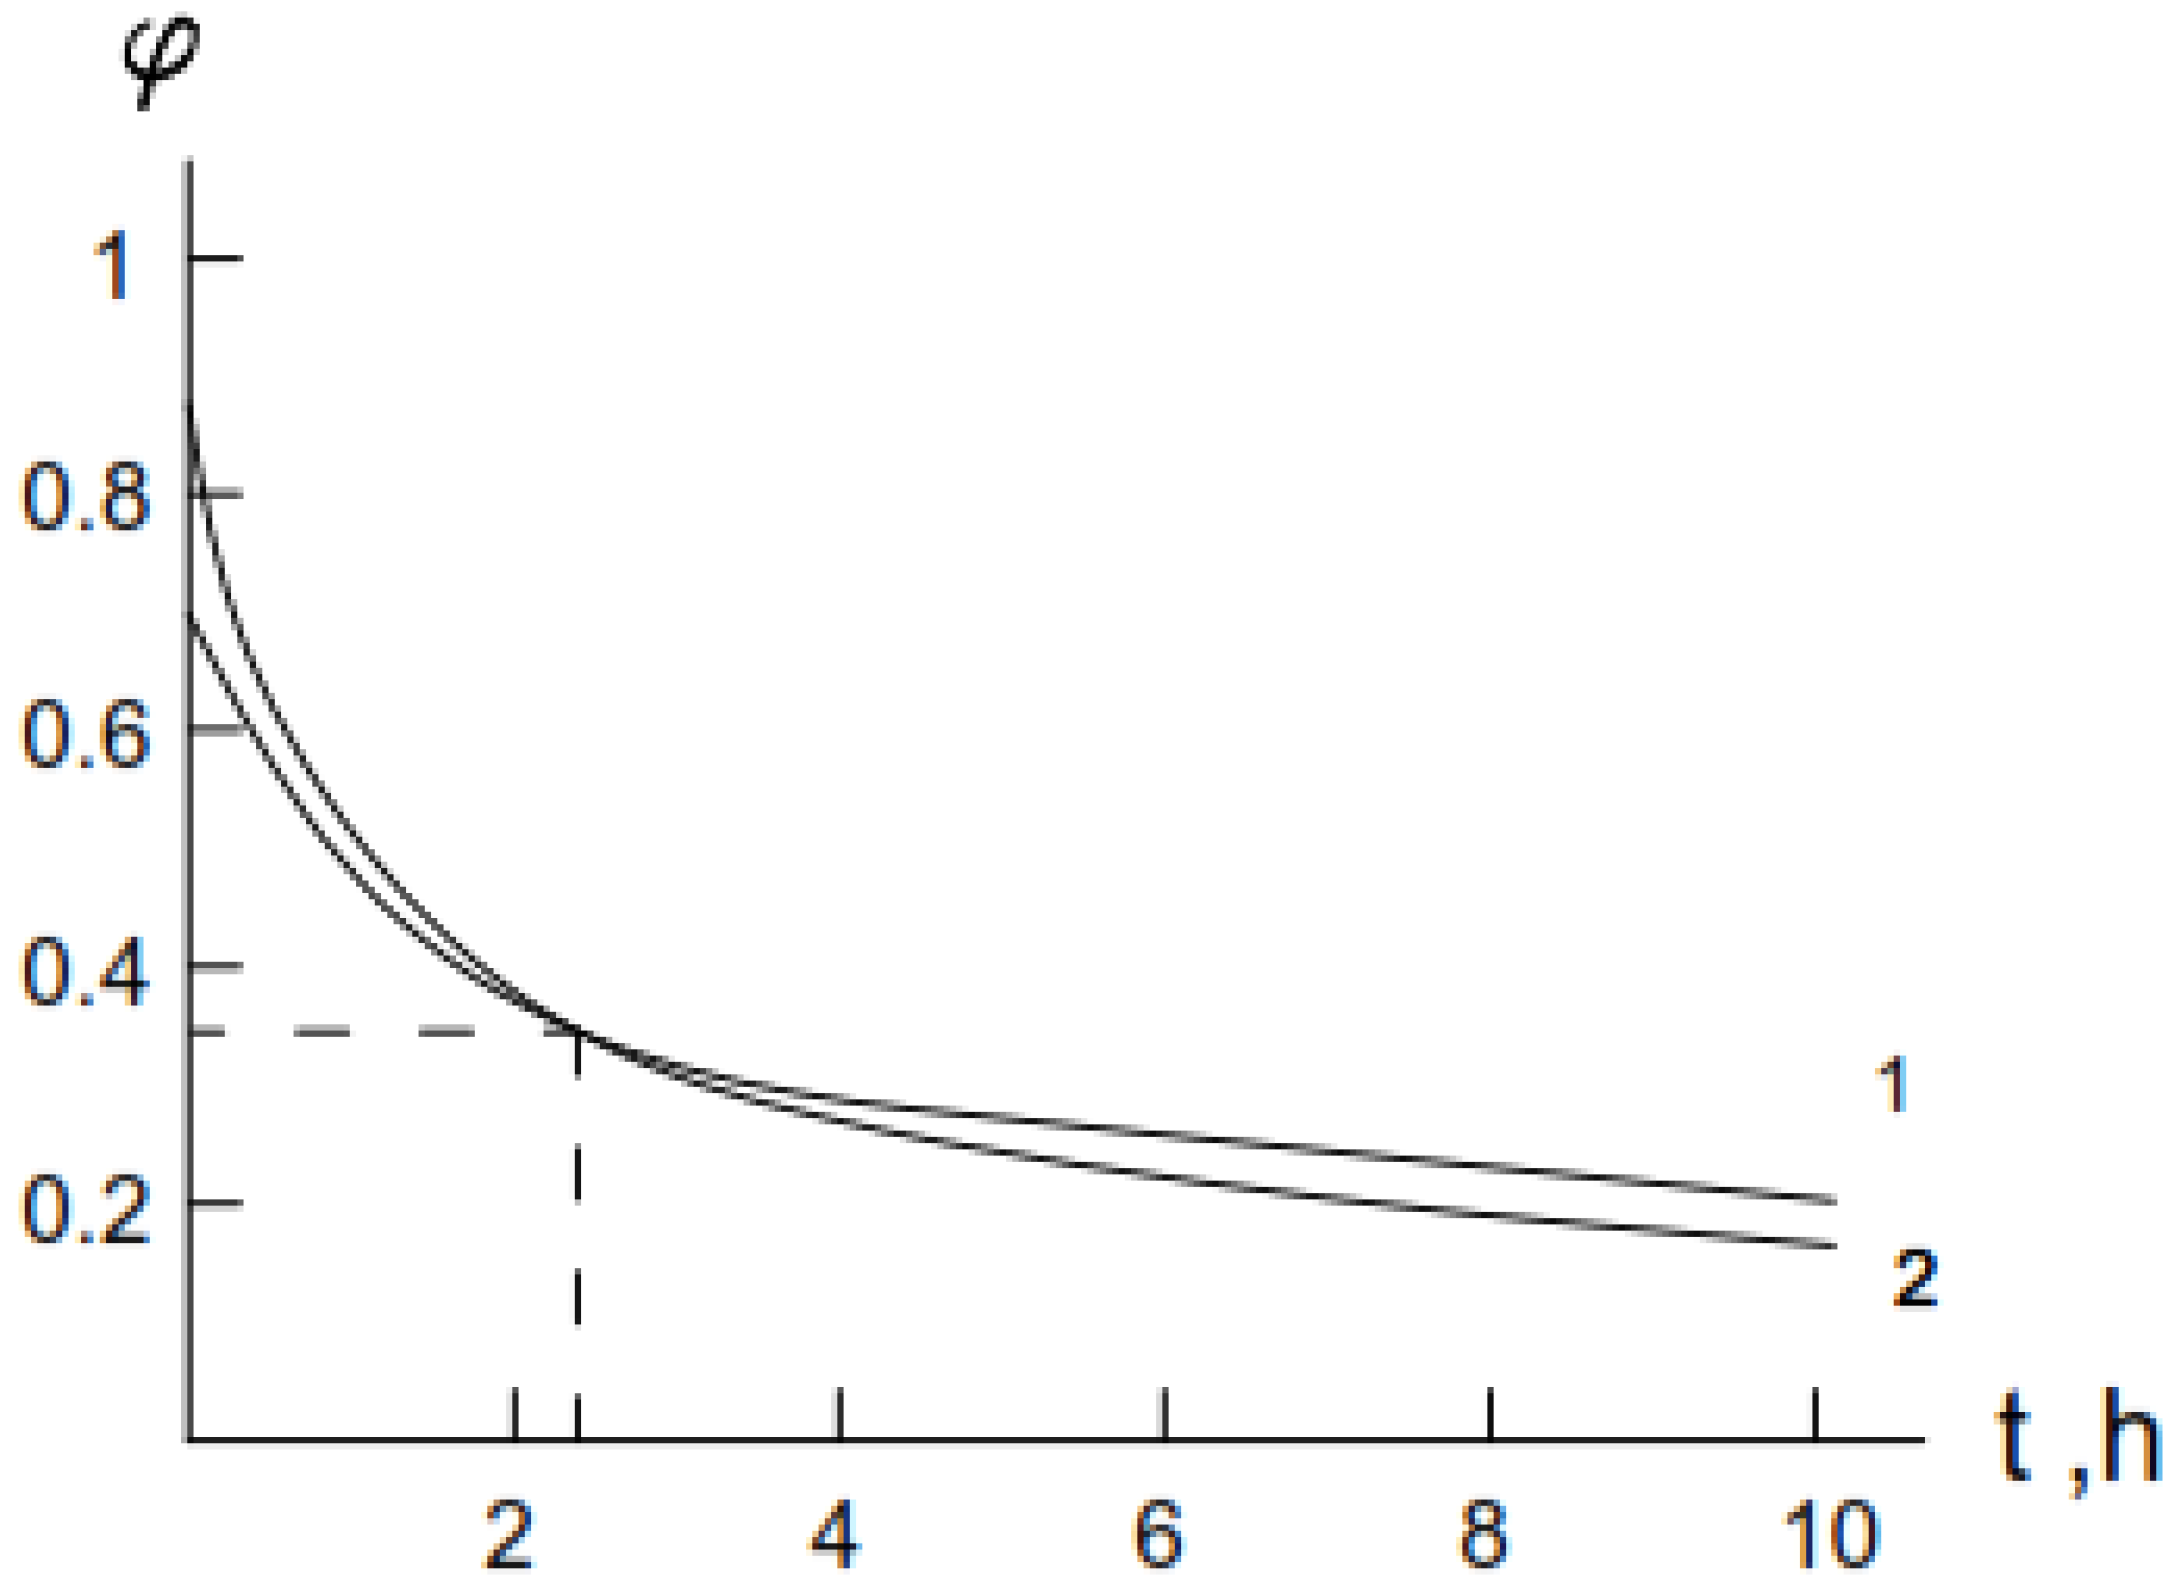
  • t ≈ 4.04 [e1.99m (1.99m − 1) + 1];
  • t ≈ 4.04 [1 – φ−1ln(eφ)] for chromia-forming alloy at 1200 °C (t is in hours, m is in mg/cm2).
In conclusion, we note the following: in Ref. [25], the dependence of the maximum achievable value of mass increase ( m ¯ ) of the sample on parameter kp/vgin logarithmic coordinates is given. This work provides data for the following compounds: B2O3, SiO2, CrCl2, PbCl2, and Cr2O3. The dependence has a rectilinear character, on which our data for Ge3N4 [26] fit well (Figure 11). In our case, when, along with the evaporation of Cr2O3, a decrease in the effective diffusion area also occurs, this rectilinearity is already realized in coordinates m ¯ − lg(kp/vg) (Figure 12). In most cases, three dots are not enough to build an experimental points dependence, but their almost-ideal arrangement in Figure 12 allows us to consider our case acceptable.

4. Conclusions

All kinetic models of oxidation processes are simplified schemes of conditions in which all real systems of alloys are located. The appearance of diffusion/low-permeability phases in the scale is equivalent to a decrease in the effective reaction area, since certain micro-areas of the scale become difficult to overcome for the interacting components. Here, we show the correspondence of some of these models to experimental data on the high-temperature oxidation of alloys FeCr and FeCrAl with the addition of La. It is shown that the selected kinetic equations describe these processes well.

5. Future Research Directions

Future research should aim to improve the thermoelectric characteristics of the SiGe alloy listed in the main text. This will serve to increase the figures of merit and efficiency of the alloy.

Author Contributions

In developing this journal article, I.N. and R.T. conceptualized and wrote the text. All authors have read and agreed to the published version of the manuscript.

Funding

This research received no external funding.

Data Availability Statement

All relevant data are included within the manuscript. No additional data are available.

Conflicts of Interest

The author declare no conflicts of interest.

Appendix A

There are many known cases where, during oxidation of a metal or alloy, short-circuit diffusion rather than volume occurs. In such a case, the kinetics of the process is described not by the usual parabolic law, but by a cubic law (n = 3) [35,36,37,38,39,40,41,42,43,44,45]. When solving the corresponding differential equation, instead of Equation (3), we obtain [46]: t = m m a x 2 v g ln m m a x + m m m a x m m v g ; where, in general mmax = (kn/nkrk0)1/(n−1); k0 = vg/(kr − vg). (For n = 2, Equation (3) in these notations will take the form of t = m m a x v g ln 1 m m m a x m v g .)
The equation t= m m a x v g 1 3 a r c t g 3 m m + 2 m m a x 1 6 l n ( m m a x m ) 2 m 2 + m m m a x + m m a x 2 m v g at n = 4 should be used comparatively less frequently for mechanisms of local electric fields and space charges [47,48]. Formally, we can also consider the case with n = 5, for which the solution of the integral given in the introduction is expressed by a complex mathematical formula (not given here). Figure A1 shows graphs of all considered kinetic dependences in normalized coordinates.
Figure A1. Kinetic dependences for n = 2 (1), 3 (2), 4 (3), and 5 (4) in normalized coordinates.
Alloys 04 00002 g0a1
It is also possible to formally consider the graphs for n = 2, 3, and 4 with negative values of m. This is interesting because the complete graphs have a top (see Figure A2) [46].
Figure A2. Full formal kinetic dependences for n = 2 (1), 3 (2), and 4 (3) in normalized coordinates.
Alloys 04 00002 g0a2

References

  1. Yan, X.; Wang, J.; Li, H.; Wang, S. Microstructure evolution and oxidation resistance properties of oxide dispersion strengthened FeCrAl alloys at 1100 °C. Vacuum 2024, 227, 113371. [Google Scholar] [CrossRef]
  2. Ibrahim, O.M.; Alazemi, A.A.; Naji, L.B. Multistage heat treatment and the development of a protective oxide-scale layer on the surface of FeCrAl sintered-metal-fibers. Sci. Rep. 2021, 11, 797. [Google Scholar] [CrossRef]
  3. Umretiya, R.V.; Qu, H.; Yin, L.; Jurewicz, T.B.; Gupta, V.K.; Drobnjak, M.; Knussman, M.P.; Hoffman, A.K.; Rebak, R.B. Corrosion behavior of additively manufactured FeCrAl in out-of-pile light water reactor environments. NPJ Mater. Degrad. 2024, 8, 88. [Google Scholar] [CrossRef]
  4. Kanthal, I.; Fedorova, I.; Alleima, D.; Karlsson, D. Oxidation behavior of additively manufactured Ti-added FeCrAl alloys. High Temp. Corros. Mater. 2024, 101, 1155–1165. [Google Scholar]
  5. Okoro, V.U.; Daub, K.; Nordin, H.; Persaud, S.Y. Comparing the oxidation of FeCrAl alloys in isothermal and cyclic high-temperature steam environments. Nucl. Mater. 2024, 589, 154843. [Google Scholar] [CrossRef]
  6. Wang, Z.; Wang, H.; Huang, X. Exploring the impact of microstructure refinement on high temperature steam oxidation behavior of FeCrAl alloy. Nucl. Mater. 2025, 603, 155372. [Google Scholar] [CrossRef]
  7. Kim, C.; Tang, C.; Grosse, M.; Maeng, Y.; Jang, C.; Steinbrueck, M. Oxidation mechanism and kinetics of nuclear-grade FeCrAl alloys in the temperature range of 500–1500 °C in steam. Zeitschriftenaufsatz 2022, 564, 1000145733. [Google Scholar] [CrossRef]
  8. Wang, P.; Qi, W.; Yang, K.; Qiao, Y.; Wang, X.; Zheng, T.; Bai, C.; Liu, Z.; Zhang, X. Systematic investigation of the oxidation behavior of Fe-Cr-Al cladding alloys in high-temperature steam. Corros. Sci. 2022, 207, 110595. [Google Scholar] [CrossRef]
  9. Qi, W.; Yang, K.; Wang, P.; Du, S.; Bai, C.; Wang, X.; Qiao, Y.; Zheng, T.; Zhang, L.; Zhang, X. High-temperature steam oxidation behavior of an FeCrAl alloy with controlled addition of Mo. J. Mater. Sci. 2022, 57, 20909–20927. [Google Scholar] [CrossRef]
  10. Raiman, S.S.; Field, K.G.; Rebak, R.B.; Yamamoto, Y.; Terrani, K.A. Hydrothermal corrosion of 2nd generation FeCrAl alloys for accident tolerant fuel cladding. Nucl. Mater. 2020, 536, 152221. [Google Scholar] [CrossRef]
  11. Hou, P.Y.; Shui, Z.R.; Chuang, G.Y.; Stringer, J. Effect of reactive element oxide coatings on the high temperature oxidation behavior of a FeCrAl alloy. Electrochem. Soc. 1992, 139, 1119. [Google Scholar] [CrossRef]
  12. Othman, N.K.; Jalar, A.; David Young, D. Effects of lanthanum on Fe-25Cr alloys under cyclic oxidation. Adv. Mater. Res. 2010, 97–101, 1212–1215. [Google Scholar] [CrossRef]
  13. Mikadze, O.; Kandelaki, A. Influence of cerium additives on high-temperature corrosion of chromium. Bull. Georgian Acad. Sci. 2010, 4, 66–69. [Google Scholar]
  14. Qi, W.; Qiao, Y.; Ru, W.; Wang, X.; Zhang, X.; Zheng, T.; Du, S.; Wang, P.; Yang, K. High-temperature steam oxidation and surface microstructure evolution of Fe13Cr6Al(1–4)Mo0.15Y alloys. Metals 2024, 14, 1229. [Google Scholar] [CrossRef]
  15. Zhang, S.; Hayashi, S.; Ukai, C. High-temperature oxidation of oxide-dispersion-strengthened FeCrAl alloys: Influences of Al, Co and Y concentration on the mechanism of oxide scale growth. Mater. Res. Technol. 2024, 30, 9196–9204. [Google Scholar] [CrossRef]
  16. Evans, U.R. An introduction to Metallic Corrosion; Edward Arnold Ltd.: London, UK, 1981; p. 302. [Google Scholar]
  17. Tavadze, F.N.; Mikadze, O.I.; Keshelava, N.P.; Bulia, B.P. High-temperature corrosion of dilute chromium-lanthanum alloys. Oxid. Met. 1986, 25, 335–350. [Google Scholar] [CrossRef]
  18. Nakhutsrishvili, I. Oxidation kinetics of FeCr and FeCrAl alloys: Influence of secondary processes. Johns. Matthey Technol. Rev. 2025, 69, 1–12. [Google Scholar]
  19. Mikadze, O.; Dzindzibadze, T.G.; Bulia, B.P.; Rukhadze, L.N. Chemical-thermal treatment of low-alloyed chromium. Georgian Eng. News 2000, 1, 92–93. [Google Scholar]
  20. Mikadze, O.; Tsurtsumia, O.; Bulia, B. Improvement in Corrosion Resistance of Low-Alloyed Chromium by Thermo-Chemical Treatment; Congress Junior Euromat: Lausanne, Switzerland, 2006. [Google Scholar]
  21. Mikadze, O.; Bulia, B. Scientific principles of chromium matrix heat resistant alloing. Bull. Georgian Acad. Sci. 2001, 163, 495–597. [Google Scholar]
  22. Gussev, M.N.; Field, K.G.; Yamamoto, Y. Design, properties, and weldability of advanced oxidation-resistant FeCrAl alloys. Mater. Des. 2017, 129, 227–238. [Google Scholar] [CrossRef]
  23. Gurevich, L.M.; Pronichev, D.V.; Slautin, O.V.; Tikhaeva, V.V. Corrosion resistance of Fe-Cr-Al intermetallic coatings obtained by aluminizing. Metals 2023, 13, 1883. [Google Scholar] [CrossRef]
  24. Mikadze, O.I.; Nakhutsrishvili, I.G.; Dzigrashvili, T.A.; Maisuradze, N.I.; Mikadze, G.O. Calculation of oxidation kinetic parameters for heat—Resistant alloys with the decreasing effective diffusion area. Metallofiz. I Noveyshiye Tekhnologii (Met. Adv. Technol.) 2010, 32, 543–548. [Google Scholar]
  25. Smialek, J.L. Simplified paralinear oxidation analyses. High Temp. Corros. Mater. 2023, 99, 1–27. [Google Scholar] [CrossRef]
  26. Nakhutsrishvili, I.; Sepashvili, N. Analisys of kinetic curves of mass change during the interaction of active gases with the surface of certain metals and compounds with simultaneous evaporation of the product of reaction. 2025; in press. [Google Scholar]
  27. Tedmon, C.S. The effect of oxide volatilization on the oxidation kinetics of Cr and Fe-Cr alloys. Electrochem. Soc. 1966, 113, 766. [Google Scholar] [CrossRef]
  28. Yamamura, K.; Uehara, T.; Tanaka, S.; Yasuda, N. Oxidation behavior of Fe-Cr ferritic alloy for SOFC interconnects ZMG232G10 in air and H2/H2O. Electrochem. Soc. 2013, 57, 2177. [Google Scholar] [CrossRef]
  29. Guo, T.; He, C.; Liang, Z.; Zhao, Q. Molecular dynamics study on the initial oxidation behavior of FeCr alloys in supercritical H2O and supercritical CO2 with O2. Supercrit. Fluids 2024, 204, 106110. [Google Scholar] [CrossRef]
  30. Hu, Q.; Lyu, Z.-Y.; Xing, L.-D.; Gu, C.; Bao, Y.-P. Initial oxidation of Fe-Cr alloys at different temperatures and atmospheric conditions: A ReaxFF molecular dynamics approach. ISIJ Int. 2024, 64, 1967–1975. [Google Scholar] [CrossRef]
  31. Chyrkin, A.; Froitzheim, J.; Quadakkers, W.J. Transition from internal to external oxidation in binary Fe-Cr alloys around 900 °C. 2024; preprint. [Google Scholar] [CrossRef]
  32. Caplan, D.; Cohen, M. The volatilization of chromium oxide. Electrochem. Soc. 1961, 108, 438. [Google Scholar] [CrossRef]
  33. Yamauchi, A.; Kurokawa, K.; Takahashi, H. Evaporation of Cr2O3 in atmospheres containing H2O. Oxid. Met. 2003, 59, 517–527. [Google Scholar] [CrossRef]
  34. Zhang, K.; El-kharouf, A.; Caykara, T.; Steinberger-Wilckens, R. Effect of temperature and water content on the xidation behaviour and Cr evaporation of high-Cr alloys for SOFC cathode air preheaters. High Temp. Corros. Mater. 2023, 100, 1–25. [Google Scholar]
  35. Chen, Y.; Tan, T.; Chen, H. Oxidation companied by scale removal: Initial and asymptotic kinetics. Nucl. Sci. Technol. 2008, 45, 662–667. [Google Scholar] [CrossRef]
  36. Krejčí, J.; Vrtílková, V.; Gajdoš, P.; Rada, D. Proposal of new oxidation kinetics for sponge base E110 cladding tubes material. Nucl. Sci. Technol. 2017, 3, 18. [Google Scholar] [CrossRef]
  37. Stringer, J. The functional form of rate curves for high-temperature oxidation of dispersioncontaining alloys forming Cr2O3 scales. Oxid. Met. 1972, 5, 49–58. [Google Scholar] [CrossRef]
  38. Yong, Y.; Benton, B.E.; Howell, M.; Bell, G. High-temperature oxidation kinetics of sponge-based E110 cladding alloy. Nucl. Mater. 2018, 499, 595–612. [Google Scholar]
  39. Smeltzer, W.W.; Haering, R.R.; Kirkaldy, J.S. Oxidation of metals by short circuit and lattice diffusion of oxygen. Acta Metall. 1969, 9, 880–885. [Google Scholar] [CrossRef]
  40. Atkinson, H.V. A review of the role of short-circuit diffusion in the oxidation of nickel, chromium, and nickel-chromium alloys. Oxid. Met. 1985, 24, 177–197. [Google Scholar] [CrossRef]
  41. Waber, J.T. On the cubic law of oxidation. Chem. Phys. 1952, 20, 734–735. [Google Scholar] [CrossRef]
  42. Sadique, S.E.; Mollah, A.H.; Islam, M.S.; Ali, M.M.; Megat, M.H.H.; Basri, S. High-temperature oxidation behavior of iron–chromium–aluminum alloys. Oxid. Met. 2000, 54, 385–400. [Google Scholar] [CrossRef]
  43. Piatkowski, J.; Przeliorz, R.; Jabłońska, B. Oxidation kinetics of NiAl, FeAl and TiAl alloys. Solid State Phenom. 2013, 203–204, 431–434. [Google Scholar] [CrossRef]
  44. Li, H.; Zhang, H.; Zheng, W. Study on oxidation kinetics of three kinds of candidate superalloys for VHTR under air ingress accident. Ann. Nucl. Energy 2023, 189, 109844. [Google Scholar] [CrossRef]
  45. Kopec, M.; Mierzejewska, I.; Gorniewicz, D.; Sitek, R.; Jóźwiak, S. High-temperature oxidation behaviour of additively manufactured and wrought HAYNES 282. Mater. Sci. 2024, 37, 17647–17665. [Google Scholar] [CrossRef]
  46. Nakhutsrishvili, I. Study of growth and sublimation of germanium nitride using the concept of Tedmon’s kinetic model. Orient. J. Chem. 2020, 36, 850–854. [Google Scholar] [CrossRef]
  47. Carrette, F.; Guinard, L.; Pieraggi, B. Kinetics of corrosion products release from nickel-base alloys corroding in primary water conditions a new modeling of release. In Proceedings of the International Conference Water Chemistry in Nuclear Reactor Systems, Avignon, France, 22–26 July 2022; pp. 1–32. [Google Scholar]
  48. Liu, T.-K.; Bautista, R.G. Prediction of the global volatilization rate of gas-metal-alloy reaction systems—Method of calculation. Oxid. Met. 1981, 16, 243–252. [Google Scholar] [CrossRef]
Figure 1. Auger spectra of the FeCrAl(La) alloy oxidized at 1200 °C for 5 h: (a) from the perspective of the matrix; (b) from the perspective of the scale.
Alloys 04 00002 g001
Figure 2. X-ray diffractograms of the initial (non-oxidized) sample (a) and alloy oxidized at 1200 °C (b); o—matrix; ∆—Al2O3.
Alloys 04 00002 g002
Figure 3. Scheme of the microbalance: 1—beam; 2—glass case; 3—quartz filament; 4—quartz reactor; 5—sample; 6—electric heater; 7—electromagnet coil; 8—ferrite; 9—magnet.
Alloys 04 00002 g003
Figure 4. Electrical block-diagram of the scale: 1—ferrite; 2—magnet; 3—generator; 4—power supply; 5—pre-power amplifier; 6—phase detector; 7—output power amplifier; 8—measuring devices.
Alloys 04 00002 g004
Figure 5. Kinetic curves denoting the oxidation of FeCr alloy in air: 1, 1′—experimental, 2, 2′—according to Equation (3), 3, 3′—according to Equation (2). (The experimental curves are taken from Ref. [17]).
Alloys 04 00002 g005
Figure 6. Kinetic curves denoting the oxidation of alumina-forming alloy in air: 1, 1′—experimental, 2; 2′—according to Equation (3); 3, 3′—according to Equation (2).
Alloys 04 00002 g006
Figure 7. Kinetic curves denoting the decrease in the effective diffusion area during the oxidation of the FeCrAl(La) alloy: (1)—experimental; (2)—theoretical.
Alloys 04 00002 g007
Figure 8. Temperature dependence of Cr2O3 evaporation rate.
Alloys 04 00002 g008
Figure 9. Kinetic curves denoting the oxidation of chromia/forming alloy in air: 1, 1′—experimental; 2, 2′—according to Equation (3); 3, 3′—according to Equation (2).
Alloys 04 00002 g009
Figure 10. Kinetic curves denoting the decrease in the effective diffusion area during the oxidation of the FeCr(La) alloy: (1)—experimental; (2)—theoretical.
Alloys 04 00002 g010
Figure 11. Dependence M ¯ –kp/vg for different compounds in logarithmic coordinates.
Alloys 04 00002 g011
Figure 12. Dependence  / m ¯ –lg(kp/vg) for chromia-forming alloy at oxidation temperatures: (o)—1100; (∆)—1200; and (□)—130 °C. [kp/vg] = mg/cm2.
Alloys 04 00002 g012
Table 1. Kinetic parameters of high-temperature oxidation of alumina-forming alloy.
ParametersTemperature, °C
120012501300
k, cm2/mg1.991.681.46
kr, mg/cm2·h0.650.780.95
kp, mg2/cm4·h0.120.270.59
mA, mg/cm20.40.50.7
tA, h42.72.4
φA, relat. units0.450.430.36
Table 2. Kinetic parameters of high-temperature oxidation of chromia-forming alloy.
ParametersTemperature, °C
110012001300
k, cm2/mg2.321.550.69
kr, mg/cm2·h18.90.281.07
kp, mg2/cm4·h3.853.63.93
mA, mg/cm20.40.71.5
tA, h444
φA, relat. units0.390.370.36
Disclaimer/Publisher’s Note: The statements, opinions and data contained in all publications are solely those of the individual author(s) and contributor(s) and not of MDPI and/or the editor(s). MDPI and/or the editor(s) disclaim responsibility for any injury to people or property resulting from any ideas, methods, instructions or products referred to in the content.

