An In-Depth Examination into How Genotype, Planting Density, and Time of Sowing Affect Key Phytochemical Constituents in Nigella sativa Seed

 ,
,  ,
,  ,
, 
 , and
, and 
Abstract
1. Introduction
2. Materials and Methods
2.1. Chemicals and Reagents
2.2. Trial Center and Experimental Material Production
2.3. Extraction Protocol
2.4. Experimental Analysis
2.4.1. Moisture Content
2.4.2. Solid and Oil Yield
2.4.3. Total Phenolic Content (TPC)
2.4.4. Total Antioxidant Capacity Analysis Techniques
Ferric Reducing Antioxidant Capacity (FRAP) Analysis
Cupric Reducing Antioxidant Capacity (CUPRAC) Analysis
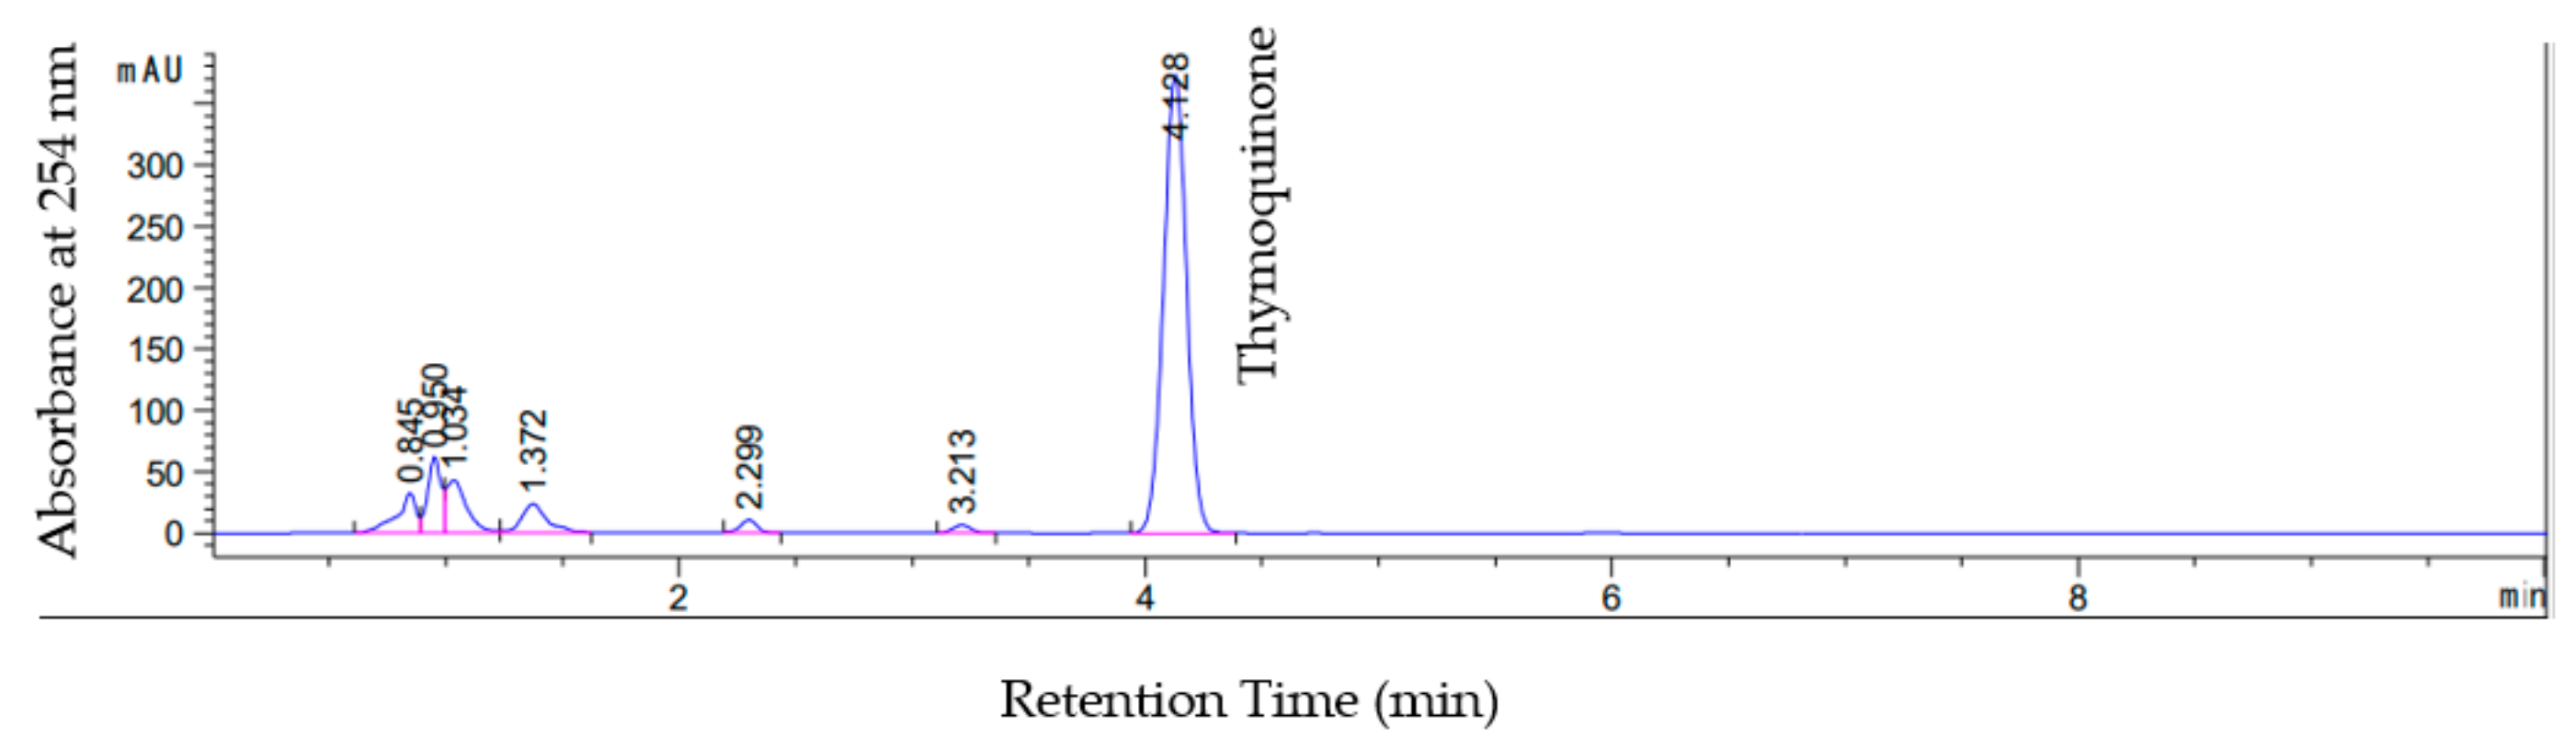
2.4.5. Quantification of Thymoquinone (TQ)
2.4.6. Fatty Acids Analysis
Derivatization (Methyl Ester Preparation)
Gas Chromatography
2.5. Statistical Analysis
3. Results and Discussion
3.1. Moisture Content
3.2. Screw-Pressed Oil and Solid Component
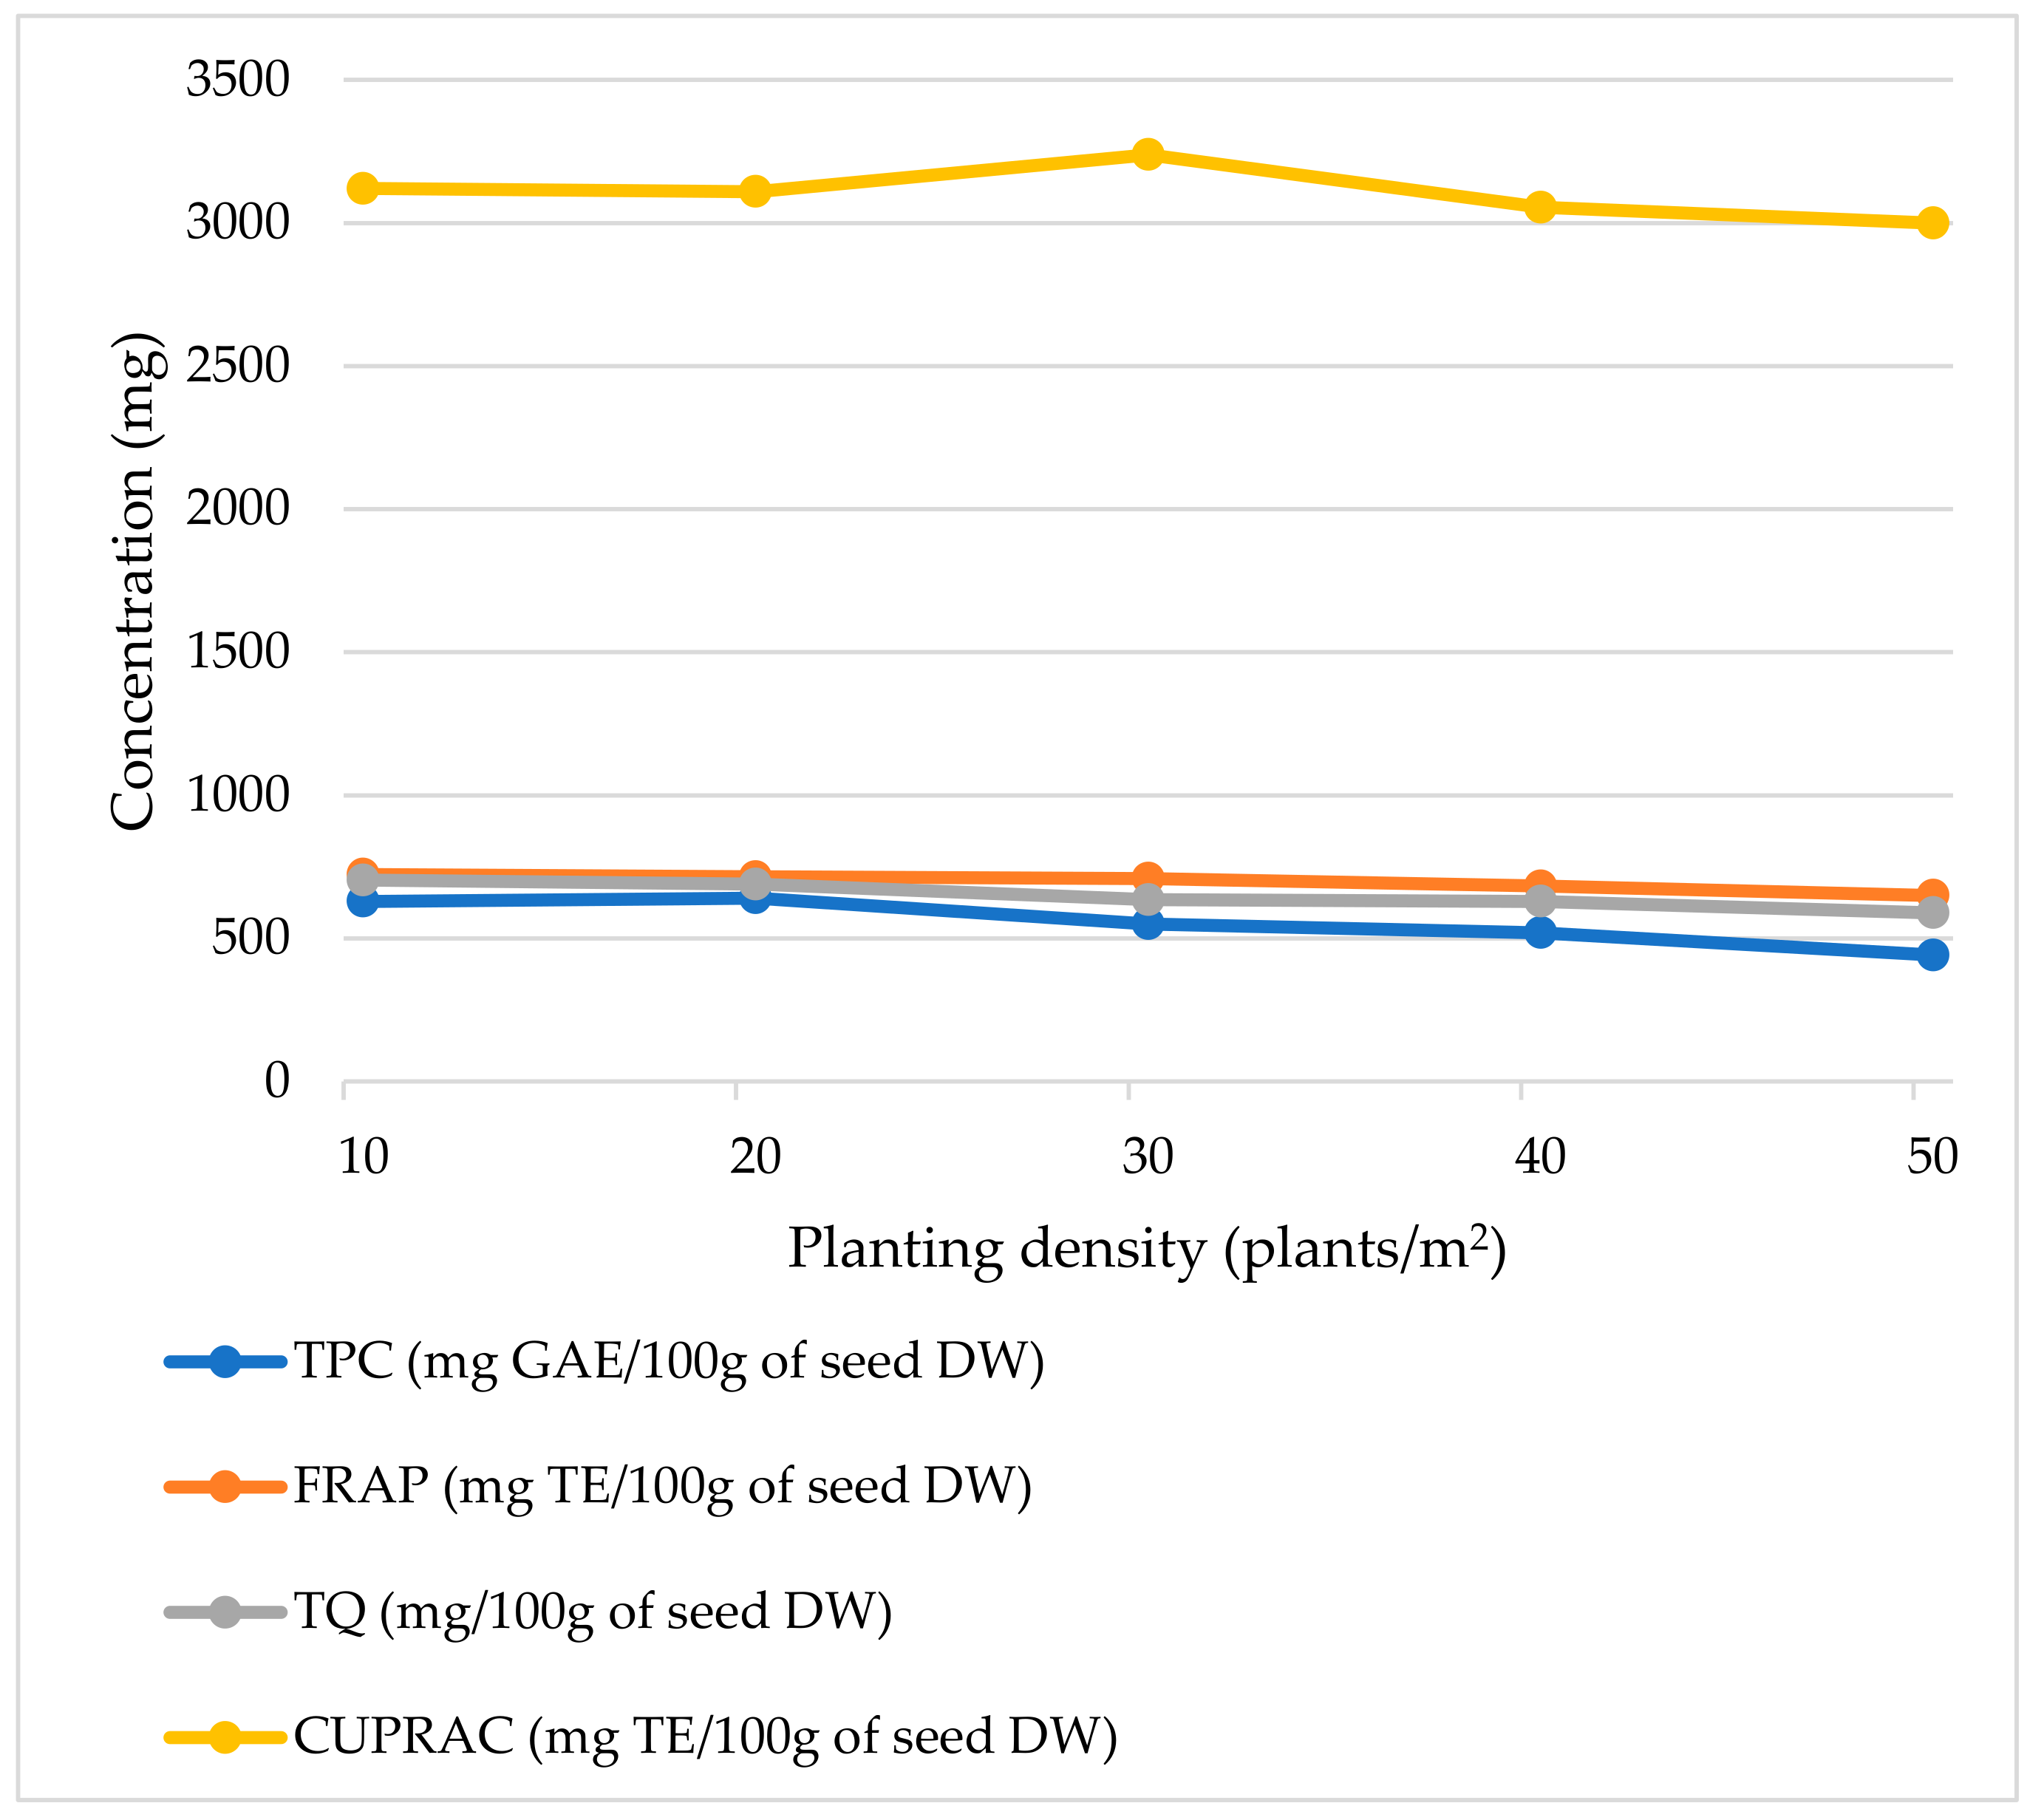
3.3. TPC and Antioxidant Capacity
3.4. TQ Composition
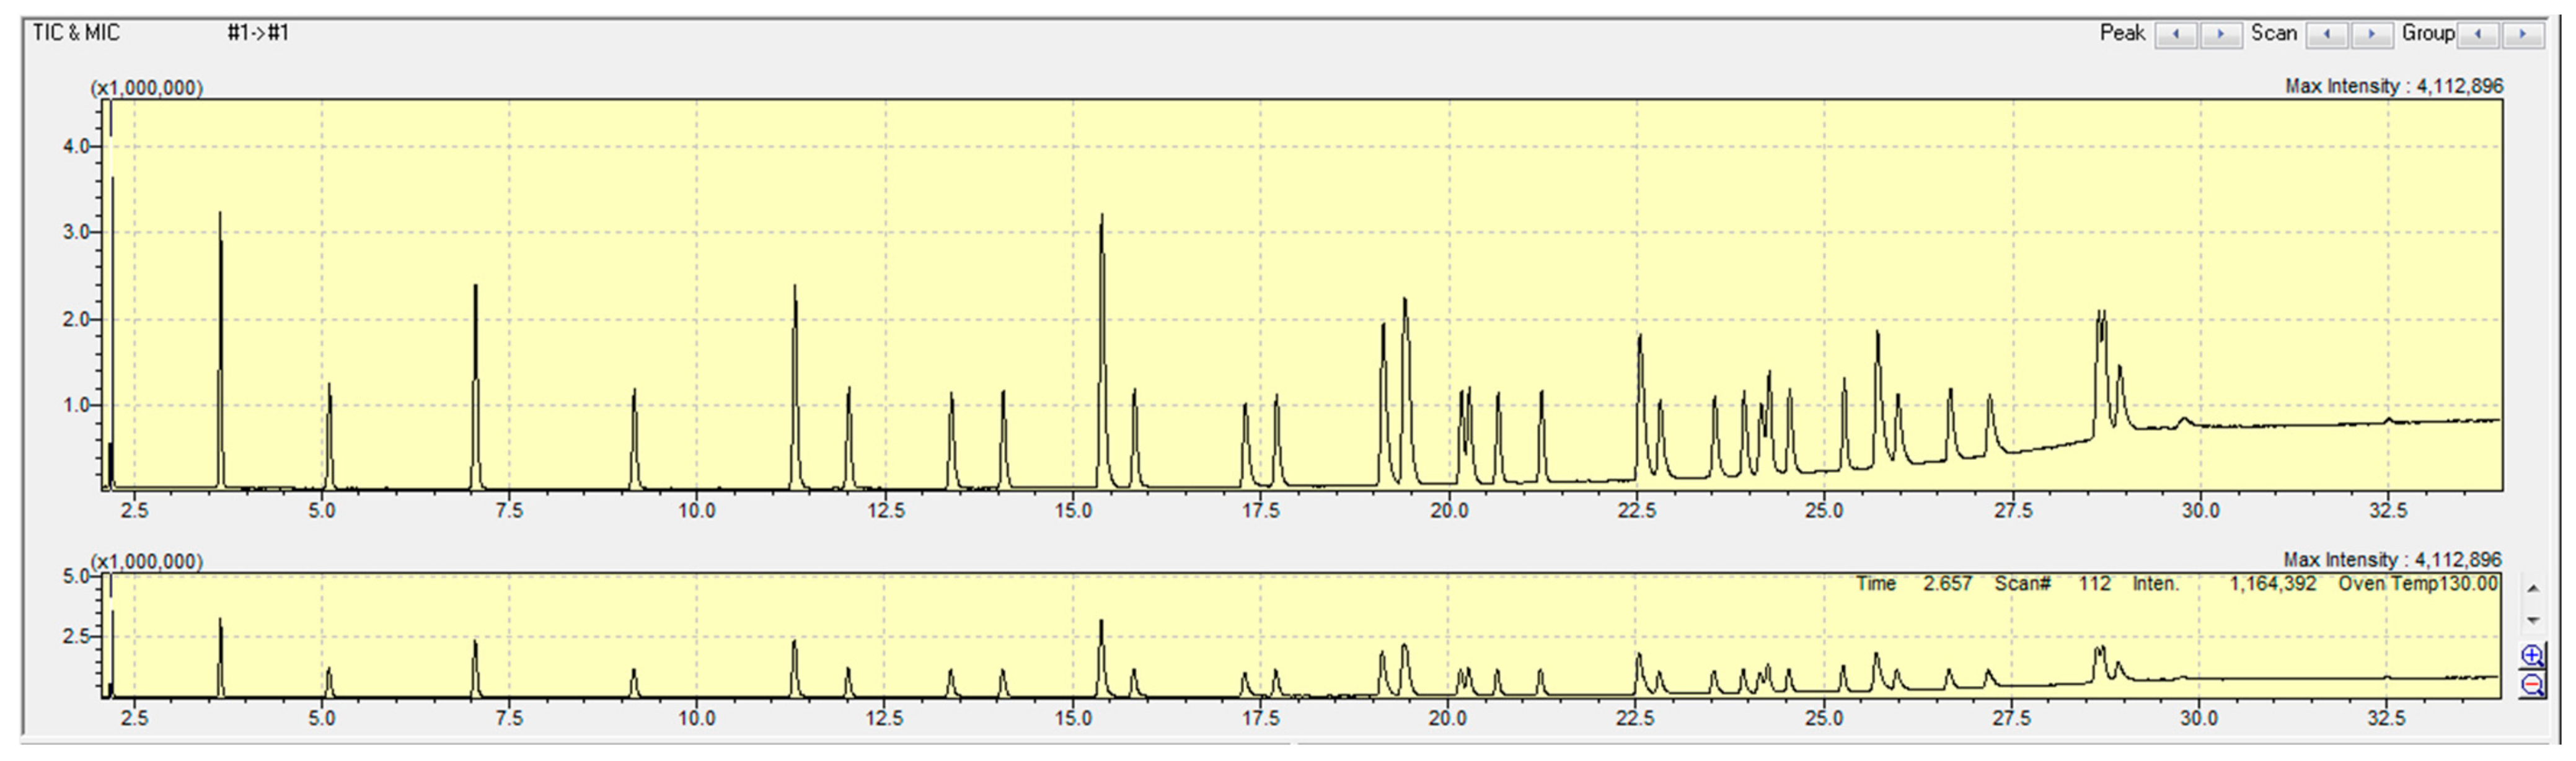
3.5. Fatty Acids
3.6. Correlation of Different Variables
4. Conclusions
Author Contributions
Funding
Institutional Review Board Statement
Informed Consent Statement
Data Availability Statement
Acknowledgments
Conflicts of Interest
Appendix A
Appendix B
References
- Kabir, Y.; Akasaka-Hashimoto, Y.; Kubota, K.; Komai, M. Volatile compounds of black cumin (Nigella sativa L.) seeds cultivated in Bangladesh and India. Heliyon 2020, 6, e05343. [Google Scholar] [CrossRef] [PubMed]
- Darakhshan, S.; Bidmeshki Pour, A.; Hosseinzadeh Colagar, A.H.; Sisakhtnezhad, S. Thymoquinone and its therapeutic potentials. Pharmacol. Res. 2015, 95–96, 138–158. [Google Scholar] [CrossRef] [PubMed]
- Khader, M.; Eckl, P.M. Thymoquinone: An emerging natural drug with a wide range of medical applications. Iran. J. Basic Med. Sci. 2014, 17, 950–957. [Google Scholar] [PubMed]
- Sahak, M.K.A.; Kabir, N.; Abbas, G.; Draman, S.; Hashim, N.H.; Adli, D.S.H. The role of Nigella sativa and its active constituents in learning and memory. Evid. Based Complement. Altern. Med. Ecam 2016, 1, 6075679. [Google Scholar] [CrossRef]
- Tavakkoli, A.; Ahmadi, A.; Razavi, B.M.; Hosseinzadeh, H. Black seed (Nigella sativa) and its constituent thymoquinone as an antidote or a protective agent against natural or chemical toxicities. Iran. J. Pharm. Res. 2017, 16, 2–23. [Google Scholar]
- Chaieb, K.; Kouidhi, B.; Jrah, H.; Mahdouani, K.; Bakhrouf, A. Antibacterial activity of Thymoquinone, an active principle of Nigella sativa and its potency to prevent bacterial biofilm formation. BMC Complement. Altern. Med. 2011, 11, 29. [Google Scholar] [CrossRef] [PubMed]
- Singh, A.; Ahmad, I.; Akhter, S.; Ahmad, M.Z.; Iqbal, Z.; Ahmad, F.J. Thymoquinone: Major Molecular Targets, Prominent Pharmacological Actions and Drug Delivery Concerns. Curr. Bioact. Compd. 2013, 8, 334–344. [Google Scholar] [CrossRef]
- Zafeer, M.F.; Waseem, M.; Chaudhary, S.; Parvez, S. Cadmium-induced hepatotoxicity and its abrogation by thymoquinone. J. Biochem. Mol. Toxicol. 2012, 26, 199–205. [Google Scholar] [CrossRef]
- Suddek, G.M. Protective role of thymoquinone against liver damage induced by tamoxifen in female rats. Can. J. Physiol. Pharmacol. 2014, 92, 640–644. [Google Scholar] [CrossRef]
- Ismail, N.; Ismail, M.; Mazlan, M.; Latiff, L.A.; Imam, M.U.; Iqbal, S.; Azmi, N.H.; Ghafar, S.A.A.; Chan, K.W. Thymoquinone prevents β-amyloid neurotoxicity in primary cultured cerebellar granule neurons. Cell. Mol. Neurobiol. 2013, 33, 1159–1169. [Google Scholar] [CrossRef]
- Alhebshi, A.; Gotoh, M.; Suzuki, I. Thymoquinone protects cultured rat primary neurons against amyloid β-induced neurotoxicity. Biochem. Biophys. Res. Commun. 2013, 433, 362–367. [Google Scholar] [CrossRef] [PubMed]
- Badary, O.A.; Nagi, M.N.; al-Shabanah, O.A.; al-Sawaf, H.A.; al-Sohaibani, M.O.; al-Bekairi, A.M. Thymoquinone ameliorates the nephrotoxicity induced by cisplatin in rodents and potentiates its antitumor activity. Can. J. Physiol. Pharmacol. 1997, 75, 1356–1361. [Google Scholar] [CrossRef] [PubMed]
- Magdy, M.-A.; Hanan, E.-A.; Nabila, E.-M. Thymoquinone: Novel gastroprotective mechanisms. Eur. J. Pharmacol. 2012, 697, 126–131. [Google Scholar] [CrossRef] [PubMed]
- Shoieb, A.M.; Elgayyar, M.; Dudrick, P.S.; Bell, J.L.; Tithof, P.K. In vitro inhibition of growth and induction of apoptosis in cancer cell lines by thymoquinone. Int. J. Oncol. 2003, 22, 107–113. [Google Scholar] [CrossRef] [PubMed]
- Alghamdi, F.; Al-Seeni, M.N.; Ghoneim, M.A. Potential synergistic antioxidant effect of thymoquinone and vitamin E on cisplatin-induced acute nephropathy in rats. Clin. Nutr. Exp. 2020, 32, 29–37. [Google Scholar] [CrossRef]
- Alobaedi, O.H.; Talib, W.H.; Basheti, I.A. Antitumor effect of thymoquinone combined with resveratrol on mice transplanted with breast cancer. Asian Pac. J. Trop. Med. 2017, 10, 400–408. [Google Scholar] [CrossRef] [PubMed]
- Effenberger-Neidnicht, K.; Schobert, R. Combinatorial effects of thymoquinone on the anti-cancer activity of doxorubicin. Cancer Chemother. Pharmacol. 2010, 67, 867–874. [Google Scholar] [CrossRef]
- Fatfat, Z.; Fatfat, M.; Gali-Muhtasib, H. Therapeutic potential of thymoquinone in combination therapy against cancer and cancer stem cells. World J. Clin. Oncol. 2021, 12, 522–543. [Google Scholar] [CrossRef]
- Erol, B.; Sari, U.; Amasyali, A.S.; Ozkanli, S.; Sogut, S.; Hanci, V.; Efiloglu, O.; Danacioglu, Y.O.; Engin, P.; Yencilek, F.; et al. Comparison of combined antioxidants and thymoquinone in the prevention of testis ischemia—Reperfusion injury. Andrology 2016, 5, 119–124. [Google Scholar] [CrossRef]
- Bayati, P.; Karimmojeni, H.; Razmjoo, J. Changes in essential oil yield and fatty acid contents in black cumin (Nigella sativa L.) genotypes in response to drought stress. Ind. Crops Prod. 2020, 155, 112764. [Google Scholar] [CrossRef]
- Iqbal, M.S.; Ghafoor, A.; Ullah, I.; Ahmad, H. Quantification and Compositional Diversity of Fatty Acid Methyl Esters Profile in Nigella sativa L. Germplasm. J. Am. Oil Chem. Soc. 2014, 91, 1975–1986. [Google Scholar] [CrossRef]
- Kiani, M.; Alahdadi, I.; Soltani, E.; Boelt, B.; Benakashani, F. Variation of seed oil content, oil yield, and fatty acids profile in Iranian Nigella sativa L. landraces. Ind. Crop. Prod. 2020, 149, 112367. [Google Scholar] [CrossRef]
- Piras, A.; Rosa, A.; Marongiu, B.; Porcedda, S.; Falconieri, D.; Dessì, M.A.; Ozcelik, B.; Koca, U. Chemical composition and in vitro bioactivity of the volatile and fixed oils of Nigella sativa L. extracted by supercritical carbon dioxide. Ind. Crops Prod. 2013, 46, 317–323. [Google Scholar] [CrossRef]
- Briggs, M.A.; Petersen, K.S.; Kris-Etherton, P.M. Saturated fatty acids and cardiovascular disease: Replacements for saturated fat to reduce cardiovascular risk. Healthcare 2017, 5, 29. [Google Scholar] [CrossRef] [PubMed]
- Montell, E.; Turini, M.; Marotta, M.; Roberts, M.; Noé, V.; Ciudad, C.J.; Macé, K.; Gómez-Foix, A.M. DAG accumulation from saturated fatty acids desensitizes insulin stimulation of glucose uptake in muscle cells. Am. J. Physiol. Metab. 2001, 280, E229–E237. [Google Scholar] [CrossRef] [PubMed]
- Çakmakçı, S.; Tahmas-Kahyaoğlu, D. An overview of the effects of fatty acids on health and nutrition. Akad. Gida 2012, 10, 103–113. [Google Scholar]
- Chen, J.; Liu, H. Nutritional indices for assessing fatty acids: A mini-review. Int. J. Mol. Sci. 2020, 21, 5695. [Google Scholar] [CrossRef] [PubMed]
- Joris, P.J.; Mensink, R.P. Role of cis-monounsaturated fatty acids in the prevention of coronary heart disease. Curr. Atheroscler. Rep. 2016, 18, 38. [Google Scholar] [CrossRef] [PubMed]
- Lakshimi, V.I.; Kavitha, M. New Insights into Prospective Health Potential of ω-3 PUFAs. Curr. Nutr. Rep. 2023, 12, 813–829. [Google Scholar] [CrossRef]
- Ahmad, N.; Ahmad, R.; Al-Layly, A.; Al-Shawi, H.; Al-Ali, A.; Amir, M.; Mostafa, A. Ultra-high-performance liquid chromatography-based identification and quantification of thymoquinone in nigella sativa extract from different geographical regions. Pharmacogn. Mag. 2018, 14, S471–S480. [Google Scholar] [CrossRef]
- Saxena, S.; Rathore, S.; Diwakar, Y.; Kakani, R.; Kant, K.; Dubey, P.; Solanki, R.; Sharma, L.; Agarwal, D.; John, S. Genetic diversity in fatty acid composition and antioxidant capacity of Nigella sativa L. genotypes. LWT 2017, 78, 198–207. [Google Scholar] [CrossRef]
- Ghanavi, Z.; Velayati, A.A.; Farnia, P.; Naji, A.M.; Kalatehjari, S. Essential Oil Composition of Nigella sativa Seeds from Different Populations of Iran. J. Essent. Oil Bear. Plants 2018, 21, 1652–1659. [Google Scholar] [CrossRef]
- Datta, A.K.; Saha, A.; Bhattacharya, A.; Mandal, A.; Paul, R.; Sengupta, S. Black cumin (Nigella sativa L.)—A review. J. Plant Dev. Sci. 2012, 4, 1–43. [Google Scholar]
- Melnyk, H.; Stalyus, L.; Kozak, T. The perspectives of Nigella sativa L. growing in the climatic conditions of the Precarpathian Region. Pharma Innov. 2015, 4, 24. [Google Scholar]
- Mehdikhani, B.A.P.; Hasnzade, A. The effect of harvest index, yield and yield components of three varieties of black seed (Nigella sativa) in different planting densities. Int. J. AgriScience 2012, 2, 93–101. [Google Scholar]
- Ahmed, N.U.; Haque, K.R. Effect of row spacing and time of sowing on the yield of blackcumin (Nigella sativa) [in Bangladesh]. Bangladesh J. Agric. 1986, 11, 21–24. [Google Scholar]
- Gholinezhad, E.; Abdolrahimi, B. The investigation of oil yield of three varieties of black seed (Nigella sativa) in different plant densities. Int. J. Adv. Biol. Biomed. Res. 2014, 2, 919–930. [Google Scholar]
- EL-Kadi, B.M.; Mousa, G.T.; Gad, M.M.; Ali, E.F. Effect of Fertilization and Plant Density on Seed and Oil Productions of Nigella sativa, L. Assiut J. Agric. Sci. 2014, 45, 81–90. [Google Scholar]
- Kalidasu, G.; Surepeddi, S.; Sivasankar, A. Influence of Sowing Window and Plant Density on Growth, Phenology, Yield and Quality of Nigella sativa L. in Coastal Humid Tropic. Int. J. Curr. Microbiol. Appl. Sci. 2017, 6, 499–512. [Google Scholar]
- Kizil, S. The Effect of Row Spacing on Seed Yield, Yield Components, Fatty Oil and Essential Oil of Nigella sativa L. Crop Res. 2005, 30, 107–112. [Google Scholar]
- Koli, S.A. Effect of Variety and Plant Spacing on Seed Yield and Yield Attributes of Black Cumin (Nigella sativa L.). Ph.D. Thesis, Department of Agricultural Botany, Sher-e-Bangla Agricultural University:, Dhaka, Bangladesh, 2013. [Google Scholar]
- Masud, A.-A. Effect of Date of Sowing and Spacing on Growth and Seed Yield of Black Cumin (Nigella sativa L.). Master Thesis, Institute of Seed Technology, Sher-e-Bangla Agricultural University, Dhaka, Bangladesh, 2021. [Google Scholar]
- Meena, S.S.; Mehta, R.S.; Lal, G.; Kant, K.; Sharma, Y.K.; Saxena, S.N.; Anwer, M.M. Essential oil, fatty oil and seed yield of nigella (Nigella sativa L.) as influenced by sowing dates and crop geometry. Indian J. Hortic. 2012, 69, 591–593. [Google Scholar]
- Mengistu, F.G. The Influence of Seed Rate and Inter-Row Spacing on Seed Yield and Yield Attributes of Black Cumin in Arsi Highlands, Ethiopia. J. Biol. Agric. Healthc. 2021, 11, 33–39. [Google Scholar] [CrossRef]
- Mollafilabi, A.; Moodi, H. Effects of Plant Density and Nitrogen on Physiological Growth Indices, Yield Components and Yield of Black Seed (Nigella sativa L.) as a Medicinal Plant; Ferdowsi University of Mashhad: Mashhad, Iran, 2021. [Google Scholar]
- Roussis, I.; Kakabouki, I.; Bilalis, D. Comparison of Growth Indices of Nigella sativa L. under Different Plant Densities and Fertilization. Emir. J. Food Agric. 2019, 31, 231–247. [Google Scholar] [CrossRef]
- Sarkar, M.I.; Khaleda, K.; Mostarin, T.; Alam, M.M.; Siddika, M.J.; Saddam, M.A.H.; Banik, N.; Samad, M.A. Effect of macronutrients combination with plant spacing on the growth and yield of black cumin (Nigella sativa L.). Eur. J. Nutr. Food Safety. 2021, 14, 15–27. [Google Scholar] [CrossRef]
- Tunçtürk, M.; Ekin, Z.; Didem, T. Response of Black Cumin (Nigella sativa L.) to Different Seed Rates Growth, Yield Components and Essential Oil Content. J. Agron. 2005, 4, 216–219. [Google Scholar] [CrossRef]
- Zapotoczny, P.; Żuk-Gołaszewska, K.; Ropelewska, E. Impact of cultivation methods on properties of black cumin (Nigella sativa L.) seeds. J. Cent. Eur. Agric. 2019, 20, 353–364. [Google Scholar] [CrossRef]
- Zolleh, H.H.; Bahraminejad, S.; Maleki, G.; Papzan, A.H. Response of Cumin (Cuminum cyminum L.) to Sowing Date and Plant Density. Res. J. Agric. Biol. Sci. 2009, 5, 597–602. [Google Scholar]
- Roussis, I.; Kakabouki, I.; Beslemes, D.; Tigka, E.; Kosma, C.; Triantafyllidis, V.; Mavroeidis, A.; Zotos, A.; Bilalis, D. Nitrogen Uptake, Use Efficiency, and Productivity of Nigella sativa L. in Response to Fertilization and Plant Density. Sustainability 2022, 14, 3842. [Google Scholar] [CrossRef]
- Verma, I.; Naurka, I.S.; Patel, R. Effect of different doses of NPK fertilizer on yield characters of nigella (Nigella sativa L.). Pharma Innov. J. 2022, 11, 1139–1144. [Google Scholar]
- Johnson, J.; Mani, J.; Ashwath, N.; Naiker, M. Potential for Fourier transform infrared (FTIR) spectroscopy toward predicting antioxidant and phenolic contents in powdered plant matrices. Spectrochim. Acta Part A Mol. Biomol. Spectrosc. 2020, 233, 118228. [Google Scholar] [CrossRef]
- International Seed Testing Association Moisture Committee. ISTA Handbook on Moisture Determination, 1st ed.; Nijënstein, H., Nydam, J., Don, R., Eds.; International Seed Testing Association: Wallisellen, Switzerland, 2007. [Google Scholar]
- Górnaś, P.; Siger, A.; Rudzińska, M.; Grygier, A.; Marszałkiewicz, S.; Ying, Q.; Sobieszczańska, N.; Segliņa, D. Impact of the Extraction Technique and Genotype on the Oil Yield and Composition of Lipophilic Compounds in the Oil Recovered from Japanese Quince (Chaenomeles japonica) Seeds. Eur. J. Lipid Sci. Technol. 2018, 121, 1800262. [Google Scholar] [CrossRef]
- Martínez, M.L.; Marín, M.A.; Faller, C.M.S.; Revol, J.; Penci, M.C.; Ribotta, P.D. Chia (Salvia hispanica L.) oil extraction: Study of processing parameters. LWT 2012, 47, 78–82. [Google Scholar] [CrossRef]
- Hosseini, S.S.; Rezadoost, H.; Nadjafi, F.; Asareh, M.H. Comparative essential oil composition and fatty acid profiling of some Iranian black cumin landraces. Ind. Crop. Prod. 2019, 140, 111628. [Google Scholar] [CrossRef]
- Ashraf, M.; Ali, Q.; Iqbal, Z. Effect of nitrogen application rate on the content and composition of oil, essential oil and minerals in black cumin (Nigella sativa L.) seeds. J. Sci. Food Agric. 2006, 86, 871–876. [Google Scholar] [CrossRef]
- Alam, M.N.; Bristi, N.J.; Rafiquzzaman, M. Review on in vivo and in vitro methods evaluation of antioxidant activity. Saudi Pharm. J. 2013, 21, 143–152. [Google Scholar] [CrossRef] [PubMed]
- Gulcin, İ. Antioxidants and antioxidant methods: An updated overview. Arch. Toxicol. 2020, 94, 651–715. [Google Scholar] [CrossRef] [PubMed]
- Schlesier, K.; Harwat, M.; Böhm, V.; Bitsch, R. Assessment of antioxidant activity by using different in vitro methods. Free. Radic. Res. 2002, 36, 177–187. [Google Scholar] [CrossRef] [PubMed]
- Mani, J.S.; Johnson, J.B.; Bhattarai, S.; Trotter, T.; Naiker, M. Phytochemistry and Therapeutical Potential of New Nigella sativa Genotypes from Australia. J. Herbs Spices Med. Plants 2022, 29, 229–249. [Google Scholar] [CrossRef]
- O‘Fallon, J.V.; Busboom, J.R.; Nelson, M.L.; Gaskins, C.T. A direct method for fatty acid methyl ester synthesis: Application to wet meat tissues, oils, and feedstuffs. J. Anim. Sci. 2007, 85, 1511–1521. [Google Scholar] [CrossRef]
- Hoyos, B.E.; Johnson, J.B.; Mani, J.S.; Batley, R.J.; Trotter, T.; Bhattarai, S.P.; Naiker, M. The Effect of Water Stress on Bioactive Compounds in Australian-Grown Black Sesame. Plants 2024, 13, 793. [Google Scholar] [CrossRef]
- Vergara, R.; da Silva, R.N.O.; Nadal, A.P.; Gadotti, G.I.; Aumonde, T.Z.; Villela, F.A. Harvest delay, storage and physiological quality of soybean seeds. J. Seed Sci. 2019, 41, 506–513. [Google Scholar] [CrossRef]
- Rao, N.K.; Dulloo, M.E.; Engels, J.M.M. A review of factors that influence the production of quality seed for long-term conservation in genebanks. Genet. Resour. Crop. Evol. 2016, 64, 1061–1074. [Google Scholar] [CrossRef]
- Austin, R.B. Effects of Environment Before Harvesting on Viability, in Viability of Seeds; Roberts, E.H., Ed.; Springer: Dordrecht, The Netherland, 1972; pp. 114–149. [Google Scholar]
- Olusola, O.; Ifechi, S.; Ekeoma, U. Effect of time of harvest at different moisture contents on physiological and storability attributes of pigeon pea (Cajanus cajan). Innov. Agric. 2023, 6, e32875. [Google Scholar]
- Cheikh-Rouhou, S.; Besbes, S.; Hentati, B.; Blecker, C.; Deroanne, C.; Attia, H. Nigella sativa L.: Chemical composition and physicochemical characteristics of lipid fraction. Food Chem. 2006, 101, 673–681. [Google Scholar] [CrossRef]
- Khoddami, A.; Ghazali, H.M.; Yassoralipour, A.; Ramakrishnan, Y.; Ganjloo, A. Physicochemical Characteristics of Nigella Seed (Nigella sativa L.) Oil as Affected by Different Extraction Methods. J. Am. Oil Chem. Soc. 2011, 88, 533–540. [Google Scholar] [CrossRef]
- Oubannin, S.; Bijla, L.; Gagour, J.; Hajir, J.; Aabd, N.A.; Sakar, E.H.; Salama, M.A.; Gharby, S. A comparative evaluation of proximate composition, elemental profiling and oil physicochemical properties of black cumin (Nigella sativa L.) seeds and argan (Argania spinosa L. Skeels) kernels. Chem. Data Collect. 2022, 41, 100920. [Google Scholar] [CrossRef]
- Telci, I.; Sahin-Yaglioglu, A.; Eser, F.; Aksit, H.; Demirtas, I.; Tekin, S. Comparison of Seed Oil Composition of Nigella sativa L. and N. damascena L. During Seed Maturation Stages. J. Am. Oil Chem. Soc. 2014, 91, 1723–1729. [Google Scholar] [CrossRef]
- Melese, B.; Satheesh, N.; Fanta, S.W.; Bishaw, Z. Effects of storage bags type and storage duration on seed quality and proximate composition of emmer wheat (Triticum dicoccum L.) in Ethiopia. Heliyon 2022, 8, e12506. [Google Scholar] [CrossRef]
- Selemani, S.; Madege, R.; Nzogela, Y. Influence of storage conditions on viability and vigour of Sunflower (Helianthus annuus L.) seeds. J. Curr. Opin. Crop. Sci. 2023, 4, 141–153. [Google Scholar] [CrossRef]
- Gharibzahedi, S.M.T.; Mousavi, S.M.; Moayedi, A.; Garavand, A.T.; Alizadeh, S.M. Moisture-dependent engineering properties of black cumin (Nigella sativa L.) seed. Agric. Eng. Int. CIGR J. 2010, 12, 194–202. [Google Scholar]
- Sakdasri, W.; Sila-Ngam, P.; Chummengyen, S.; Sukruay, A.; Ngamprasertsith, S.; Supang, W.; Sawangkeaw, R. Optimization of yield and thymoquinone content of screw press-extracted black cumin seed oil using response surface methodology. Ind. Crop. Prod. 2023, 191, 115901. [Google Scholar] [CrossRef]
- Singh, R.; Vishwakarma, R.; Vishal, M.; Singh, S.; Saharan, V. Moisture dependent physical properties of nigella seeds. Afr. J. Agric. Res. 2015, 10, 58–66. [Google Scholar]
- Sharma, P.K.; Mani, I.; Chopra, S. Engineering properties of black cumin seed (Nigella sativa): Effect of moisture content variation. J. Exp. Zool. India 2022, 25, 927–935. [Google Scholar]
- Telci, İ.; Özek, T.; Demirtaş, İ.; Özek, G.; Yur, S.; Ersoy, S.; Yasak, S.; Gül, F.; Karakurt, Y. Studies on black cumin genotypes of Turkiye: Agronomy, seed and thymoquinone yields. J. Appl. Res. Med. Aromat. Plants 2023, 35, 100494. [Google Scholar] [CrossRef]
- Safaei, Z.; Azizi, M.; Davarynejad, G.; Aroiee, H. The Effect of Planting Seasons on Quantitative and Qualitative Characteristics of Black cumin (Nigella sativa L.). J. Med. Plants By-Prod. 2017, 6, 27–33. [Google Scholar]
- Bayati, P.; Karimmojeni, H.; Razmjoo, J.; Pucci, M.; Abate, G.; Baldwin, T.C.; Mastinu, A. Physiological, biochemical, and agronomic trait responses of Nigella sativa genotypes to water stress. Horticulturae 2022, 8, 193. [Google Scholar] [CrossRef]
- Alrashidi, M.; Derawi, D.; Salimon, J.; Yusoff, M.F. The effects of different extraction solvents on the yield and antioxidant properties of Nigella sativa oil from Saudi Arabia. J. Taibah Univ. Sci. 2022, 16, 330–336. [Google Scholar] [CrossRef]
- Alrashidi, M.; Derawi, D.; Salimon, J.; Yusoff, M.F. An investigation of physicochemical properties of Nigella sativa L. Seed oil from Al-Qassim by different extraction methods. J. King Saud Univ. Sci. 2020, 32, 3337–3342. [Google Scholar] [CrossRef]
- Santiworakun, N.Y.; Suksuwan, A.; Sirikwanpong, S.; Dahlan, W.; Ariyapitipun, T. Physicochemical characterization of microcapsules containing cold pressed black cumin seed oils (Nigella sativa L.) as an alternative nutrient source in a functional diet. LWT 2021, 157, 113045. [Google Scholar] [CrossRef]
- Gharby, S.; Harhar, H.; Guillaume, D.; Roudani, A.; Boulbaroud, S.; Ibrahimi, M.; Ahmad, M.; Sultana, S.; Hadda, T.B.; Chafchaouni-Moussaoui, I.; et al. Chemical investigation of Nigella sativa L. seed oil produced in Morocco. J. Saudi Soc. Agric. Sci. 2015, 14, 172–177. [Google Scholar] [CrossRef]
- Hamed, S.F.; Shaaban, H.A.; Ramadan, A.A.; Edris, A.E. Potentials of enhancing the physicochemical and functional characteristics of Nigella sativa oil by using the screw pressing technique for extraction. Grasas Y Aceites 2017, 68, 188. [Google Scholar] [CrossRef]
- Atta, M.B. Some characteristics of nigella (Nigella sativa L.) seed cultivated in Egypt and its lipid profile. Food Chem. 2003, 83, 63–68. [Google Scholar] [CrossRef]
- Albakry, Z.; Karrar, E.; Ahmed, I.A.M.; Ali, A.A.; Al-Maqtari, Q.A.; Zhang, H.; Wu, G.; Wang, X. A comparative study of black cumin seed (Nigella sativa L.) oils extracted with supercritical fluids and conventional extraction methods. J. Food Meas. Charact. 2023, 17, 2429–2441. [Google Scholar] [CrossRef]
- Deli, S.; Masturah, F.M.; Aris, T.Y.; Nadiah, W.W.A. The Effects of physical parameters of the screw press oil expeller on oil yield from Nigella sativa L. seeds. Int. Food Res. J. 2011, 18, 1367–1373. [Google Scholar]
- Khan, L.M.; Hanna, M.A. Expression of oil from oilseeds—A review. J. Agric. Eng. Res. 1983, 28, 495–503. [Google Scholar] [CrossRef]
- Haron, H.; Grace-Lynn, C.; Shahar, S. Comparison of Physicochemical Analysis and Antioxidant Activities of Nigella sativa Seeds and Oils from Yemen, Iran and Malaysia. Sains Malays. 2014, 43, 535–542. [Google Scholar]
- Thippeswamy, N.B.; Naidu, K.A. Antioxidant potency of cumin varieties—Cumin, black cumin and bitter cumin—On antioxidant systems. Eur. Food Res. Technol. 2005, 220, 472–476. [Google Scholar] [CrossRef]
- Thilakarathne, R.C.N.; Madushanka, G.D.M.P.; Navaratne, S.B. Phytochemical Analysis of Indian and Ethiopian Black Cumin Seeds (Nigella sativa). 2018. Available online: http://dr.lib.sjp.ac.lk/handle/123456789/8790 (accessed on 4 July 2024).
- Rababah, T.M.; Ereifej, K.I.; Esoh, R.B.; Al-U’Datt, M.H.; Alrababah, M.A.; Yang, W. Antioxidant activities, total phenolics and HPLC analyses of the phenolic compounds of extracts from common Mediterranean plants. Nat. Prod. Res. 2011, 25, 596–605. [Google Scholar] [CrossRef]
- Şen, N.; Kar, Y.; Tekeli, Y. Antioxidant Activities of Black Cumin (Nigella sativa L.) Seeds Cultivating in Different Regions of Turkey. J. Food Biochem. 2010, 34, 105–119. [Google Scholar] [CrossRef]
- Kamiloglu, S.; Capanoglu, E.; Yilmaz, O.; Duran, A.; Boyacioglu, D. Investigating the antioxidant potential of Turkish herbs and spices. Qual. Assur. Saf. Crop. Foods 2014, 6, 151–158. [Google Scholar] [CrossRef]
- Toma, C.-C.; Olah, N.-K.; Vlase, L.; Mogoșan, C.; Mocan, A. Comparative Studies on Polyphenolic Composition, Antioxidant and Diuretic Effects of Nigella sativa L. (Black Cumin) and Nigella damascena L. (Lady-in-a-Mist) Seeds. Molecules 2015, 20, 9560–9574. [Google Scholar] [CrossRef]
- Mehmood, A. Sowing time and nitrogen application methods impact on production traits of Kalonji (Nigella sativa L.). Pure Appl. Biol. 2018, 7, 476–485. [Google Scholar] [CrossRef]
- El-Mekawy, M. Growth and yield of Niglla sativa L. plant influenced by sowing date and irrigation treatments. Am. Eurasian J. Agric. Environ. Sci. 2012, 12, 499–505. [Google Scholar]
- Haq, M.Z.; Hossain, M.M.; Haque, M.M.; Das, M.R.; Huda, M.S. Blossoming characteristics in black cumin genotypes in relation seed yield influenced by sowing time. Am. J. Plant Sci. 2015, 6, 1167–1183. [Google Scholar] [CrossRef]
- Kant, V.; Meena, S.; Meena, N.; Lal, G. Influence of Different Dates of Sowing, Fertilizer Level and Weedicides on Growth and Yield of Nigella (Nigella sativa L.) under Semi-Arid Conditions. Int. J. Curr. Microbiol. Appl. Sci. 2018, 7, 1156–1167. [Google Scholar] [CrossRef]
- Kiran, M.; Naruka, I.; Nayma, S.; Bepari, A.R. Effect of Sowing Time and Plant Geometry on Growth, Yield and Quality of Black Cumin (Nigella sativa L.). Int. J. Curr. Microbiol. Appl. Sci. 2019, 8, 1915. [Google Scholar] [CrossRef]
- Kizil, S.; Kirici, S.; Çakmak, Ö.; Khawar, K.M. Effects of sowing periods and P application rates on yield and oil composition of black cumin (Nigella sativa L.). J. Food Agric. Environ. 2008, 6, 242. [Google Scholar]
- Kurubetta, K.D.; Hosmath, J.; Alagundagi, S.; Hegde, R.; Nawalagatti, C. Effect of sowing window and crop geometry on seed quality parameters of nigella (Nigella sativa L.) varieties. Pharma Innov. J. 2021, 10, 2186–2192. [Google Scholar]
- Rahnavard, A.; Sadeghi, S.; Ashrafi, Z.Y. Study of sowing date and plant density affect on Black Cumin Cuminum carvi yield, in Iran. Biyolojik Çeşitlilik Ve Koruma 2010, 3, 23–27. [Google Scholar]
- Vaseghi, A.; Ghanbari, A.; Heydari, M.; Davazdahemami, S. Effect of Sowing Date on Qualitative and Quantitative Characteristics of Two Varieties of Black Cumin (Nigella sativa) Populations. J. Crop Ecophysiol. (Agric. Sci.) 2014, 7, 373–392. [Google Scholar]
- Waliullah; Hossain, M.; Rahman, H. Influence of sowing dates and sowing methods on growth and seed yield of black cumin (Nigella sativa L.). J. Trop. Crop. Sci. 2021, 8, 124–133. [Google Scholar]
- Belete, Y.; Dagne, E. HPTLC assay of thymoquinone in black seed and black seed oil (Nigella sativa linn) and identification of thymoquinone conversion with Uv-Vis. J. Drug Deliv. Ther. 2014, 4, 5–9. [Google Scholar] [CrossRef]
- Foudah, A.I.; Shakeel, F.; Alqarni, M.H.; Ross, S.A.; Salkini, M.A.; Alam, P. Green NP-HPTLC and green RP-HPTLC methods for the determination of thymoquinone: A contrast of validation parameters and greenness assessment. Phytochem. Anal. 2021, 33, 184–193. [Google Scholar] [CrossRef] [PubMed]
- Ravi, Y.; Vethamoni, P.I.; Saxena, S.; Raveendran, M.; Velmurugan, S.; Santhanakrishnan, P. Extraction and estimation of thymoquinone (a highly valued metabolite) from Nigella sativa L. Med. Plants Int. J. Phytomedicines Relat. Ind. 2022, 14, 492–498. [Google Scholar] [CrossRef]
- Aziz, S.A.; Kurniawati, A.; Faridah, D.N. Changes of Thymoquinone, Thymol, and Malondialdehyde Content of Black Cumin (Nigella sativa L.) in Response to Indonesia Tropical Altitude Variation. HAYATI J. Biosci. 2017, 24, 156–161. [Google Scholar]
- Ravi, Y.; Vethamoni, I.P.; Saxena, S.N.; Velmurugan, S.; Santanakrishnan, V.P.; Raveendran, M.; Bariya, H.; Harsh, M. Guesstimate of thymoquinone diversity in Nigella sativa L. genotypes and elite varieties collected from Indian states using HPTLC technique. Open Life Sci. 2023, 18, 20220536. [Google Scholar] [CrossRef]
- Giridhar, K. Effect of Sowing Time, Plant Density, Nitrogen and Phosphorus Levels on Growth, Yield and Quality of Black Cumin (Nigella sativa L.) in Vertisols of Andhra Pradesh. Ph. D. Thesis, Department of Plantation, Spices, Medicinal and Aromatic Crops. Dr. Y.S.R. Horticultural University, Hyderabad, India, 2015. [Google Scholar]
- Abdou, N.M.; Roby, M.H.H.; Al-Huqail, A.A.; Elkelish, A.; Sayed, A.A.S.; Alharbi, B.M.; Mahdy, H.A.A.; Abou-Sreea, A.I.B. Compost Improving Morphophysiological and Biochemical Traits, Seed Yield, and Oil Quality of Nigella sativa under Drought Stress. Agronomy 2023, 13, 1147. [Google Scholar] [CrossRef]
- Vatansev, H.; Ciftci, H.; Ozkaya, A.; Ozturk, B.; Evliyaoglu, N.; Kiyici, A. Chemical Composition of Nigella sativa L. Seeds Used as a Medical Aromatic Plant from East Anatolia Region, Turkey. Asian J. Chem. 2013, 25, 5490–5492. [Google Scholar] [CrossRef]
- Hamrouni-Sellami, I.; Kchouk, M.E.; Marzouk, B. Lipid and Aroma Composition of Black Cumin (Nigella sativa L.) Seeds from Tunisia. J. Food Biochem. 2008, 32, 335–352. [Google Scholar] [CrossRef]
- Hameed, S.; Imran, A.; Nisa, M.u.; Arshad, M.S.; Saeed, F.; Arshad, M.U.; Asif Khan, M. Characterization of extracted phenolics from black cumin (Nigella sativa linn), coriander seed (Coriandrum sativum L.), and fenugreek seed (Trigonella foenum-graecum). Int. J. Food Prop. 2019, 22, 714–726. [Google Scholar] [CrossRef]
- Cobourne-Duval, M.K.; Taka, E.; Mendonca, P.; Bauer, D.; Soliman, K.F.A. The Antioxidant Effects of Thymoquinone in Activated BV-2 Murine Microglial Cells. Neurochem. Res. 2016, 41, 3227–3238. [Google Scholar] [CrossRef]
- Khither, H.; Sobhi, W.; Khenchouche, A.; Mosbah, A.; Benboubetra, M. In-vitro Antioxidant Effect of Thymoquinone. Annu. Res. Rev. Biol. 2018, 25, 1–9. [Google Scholar] [CrossRef]
- Szydłowska-Czerniak, A.; Trokowski, K.; Karlovits, G.; Szłyk, E. Determination of antioxidant capacity, phenolic acids, and fatty acid composition of rapeseed varieties. J. Agric. Food Chem. 2010, 58, 7502–7509. [Google Scholar] [CrossRef] [PubMed]
- Szabó, É.; Marosvölgyi, T.; Szilágyi, G.; Kőrösi, L.; Schmidt, J.; Csepregi, K.; Bóna, Á. Correlations between total antioxidant capacity, polyphenol and fatty acid content of native grape seed and pomace of four different grape varieties in hungary. Antioxidants 2021, 10, 1101. [Google Scholar] [CrossRef] [PubMed]
- Channaoui, S.; Hssaini, L.; Velasco, L.; Mazouz, H.; El Fechtali, M.; Nabloussi, A. Comparative Study of Fatty Acid Composition, Total Phenolics, and Antioxidant Capacity in Rapeseed Mutant Lines. J. Am. Oil Chem. Soc. 2020, 97, 397–407. [Google Scholar] [CrossRef]
- Muthai, U.; Indieka, A.; Muchugi, A.; Karori, S.; Mng’Omba, S.; Ky-Dembele, C.; Jamnadass, R. Quantitative variation of fatty acid composition in seed oil from baobab (Adansonia digitata L.) wild populations in sub-Sahara Africa. S. Afr. J. Bot. 2019, 123, 1–8. [Google Scholar] [CrossRef]

| Months | Precipitation (mm) | Humidity (%) | Rainy Days | Average Sun Hours | Min. Temp (°C) | Max. Temp (°C) | Average Temperature (°C) |
|---|---|---|---|---|---|---|---|
| May | 31 | 65 | 3 | 8.4 | 15.5 | 24.7 | 19.9 |
| June | 32 | 67 | 3 | 7.7 | 13.1 | 22.3 | 17.4 |
| July | 24 | 63 | 2 | 8.1 | 11.7 | 22.1 | 16.7 |
| August | 23 | 61 | 2 | 8.6 | 12.5 | 23.6 | 17.9 |
| September | 21 | 62 | 2 | 9 | 15.3 | 26.6 | 16.6 |
| October | 37 | 62 | 4 | 9 | 18.2 | 28.6 | 22.9 |
| November | 54 | 64 | 5 | 9.1 | 20.1 | 29.6 | 24.4 |
| December | 95 | 66 | 7 | 9.3 | 22 | 30.9 | 25.9 |
| Compound | Calibration Range (mg/L) | Linearity (R2) | Calibration Equation | σ | LOD (mg/L) | LOQ (mg/L) |
|---|---|---|---|---|---|---|
| Myristic acid, methyl ester | 2–200 | 0.9968 | Y = 13,367x − 16,736 | 67,412.68 | 16.64 | 50.43 |
| Pentadecanoic acid | 1–100 | 0.9959 | Y = 12,830x – 8431 | 36,483.59 | 9.38 | 28.44 |
| Palmitic acid | 3–300 | 0.9968 | Y = 12,841x − 28,151 | 96,994.24 | 24.93 | 75.54 |
| Margaric acid | 1–100 | 0.9972 | Y= 12,072x − 7118.4 | 28,285.37 | 7.73 | 23.43 |
| Stearic acid | 2–200 | 0.9961 | Y = 12,266x − 21,090 | 68,546.32 | 18.44 | 55.88 |
| Arachidic acid | 2–200 | 0.9957 | Y = 11,793x − 20,305 | 68,610.06 | 19.20 | 58.18 |
| Palmitoleic acid | 1–100 | 0.9956 | Y = 4944.8x − 3998.8 | 14,558.54 | 9.72 | 29.44 |
| cis-10-Heptadecenoic acid (C17:1 (cis-10) | 1–100 | 0.9961 | Y = 5265.4x − 3815.7 | 14,571.59 | 9.13 | 27.67 |
| Oleic acid | 2–200 | 0.9972 | Y = 7286.9x − 17,879 | 34,563.50 | 15.65 | 47.43 |
| 11-Eicosenoic acid | 1–100 | 0.9966 | Y = 5179.9x − 3032.8 | 13,452.14 | 8.57 | 25.97 |
| Linoleic acid | 1–100 | 0.9964 | Y = 5454.8x − 4257.7 | 14,535.96 | 8.79 | 26.65 |
| Alpha-Linolenic acid | 1–100 | 0.9962 | Y = 5348.5x – 4249 | 14,724.26 | 9.08 | 27.53 |
| 11,14-Eicosadienoic acid | 1–100 | 0.995 | Y = 5488.8x − 4646.2 | 17,356.86 | 10.44 | 31.62 |
| Genotypes | Moisture (%) | Oil Yield (%DW of Seed) | Solid Yield (%DW of Seed) | TPC (mg GAE/100 g DW) | FRAP (mg TE/100 g DW) | CUPRAC (mg TE/100 g DW) | TQ (mg/100 g DW) |
|---|---|---|---|---|---|---|---|
| AVTKS#1 | 6.4 ± 0.2 c | 17.4 ± 1.7 ab | 76.6 ± 1.7 ab | 878.4 ± 43.7 de | 931.5 ± 83.7 ab | 4092.8 ± 250.1 c | 675.8 ± 68.1 a |
| AVTKS#2 | 5.6 ± 0.3 ab | 16.5 ± 1.6 ab | 77.5 ± 1.6 ab | 722.3 ± 22.9 ab | 972.8 ± 80.9 abc | 4039.5 ± 208.6 c | 740.7 ± 79.7 abc |
| AVTKS#3 | 5.8 ± 0.3 abc | 17.2 ± 1.6 ab | 76.8 ± 1.6 ab | 792.1 ± 47.0 bcd | 972.0 ± 76.1 abc | 3933.1 ± 153.0 c | 708.0 ± 67.8 ab |
| AVTKS#4 | 8.1 ± 0.5 e | 16.6 ± 1.6 ab | 77.4 ± 1.6 ab | 853.9 ± 61.3 cde | 1128.9 ± 78.2 d | 4139.3 ± 166.3 c | 865.9 ± 53.6 c |
| AVTKS#5 | 8.0 ± 0.4 e | 17.0 ± 1.2 ab | 77.0 ± 1.2 ab | 922.5 ± 64.4 e | 1138.7 ± 54.6 d | 3902.8 ± 154.9 bc | 783.3 ± 95.0 abc |
| AVTKS#6 | 8.1 ± 0.7 e | 16.7 ± 1.7 ab | 77.3 ± 1.7 ab | 764.2 ± 56.1 bc | 1041.6 ± 83.0 bcd | 3933.0 ± 182.0 c | 733.1 ± 56.9 abc |
| AVTKS#7 | 7.6 ± 0.1 de | 15.6 ± 1.5 a | 78.4 ± 1.5 b | 840.1 ± 73.1 cde | 1109.4 ± 81.0 cd | 4159.0 ± 193.1 c | 848.8 ± 64.2 bc |
| AVTKS#8 | 6.8 ± 0.3 cd | 17.8 ± 1.8 ab | 76.2 ± 1.8 ab | 839.8 ± 51.3 cde | 1070.6 ± 61.6 bcd | 4007.1 ± 132.8 c | 1118.6 ± 89.3 d |
| AVTKS#9 | 6.6 ± 0.3 bcd | 15.5 ± 1.5 a | 78.5 ± 1.5 b | 884.7 ± 51.7 de | 983.2 ± 82.2 abc | 3796.0 ± 179.7 abc | 1066.1 ± 77.3 d |
| AVTKS#10 | 4.8 ± 0.4 a | 19.3 ± 1.9 ab | 74.7 ± 1.9 ab | 723.5 ± 36.7 ab | 969.4 ± 72.2 abc | 4086.9 ± 207.3 c | 835.7 ± 75.2 bc |
| AVTKS#11 | 5.7 ± 0.3 ab | 17.8 ± 0.7 ab | 76.2 ± 0.7 ab | 647.3 ± 44.8 a | 876.8 ± 62.8 a | 3487.5 ± 196.0 a | 810.1 ± 80.8 abc |
| AVTKS#12 | 5.9 ± 0.2 bc | 21.0 ± 1.1 b | 73.0 ± 1.1 a | 660.3 ± 43.3 a | 868.7 ± 61.1 a | 3538.7 ± 207.8 ab | 811.6 ± 75.8 abc |
| Planting Density | Moisture (%) | Oil Yield (%DW of Seed) | Solid Yield (%DW of Seed) | Total Phenolic (mg GAE/100 g DW) | FRAP (mg TE/100 g DW) | CUPRAC (mg TE/100 g DW) | TQ (mg/100 g DW) |
|---|---|---|---|---|---|---|---|
| 10 plants/m2 | 7.4 ± 0.2 b | 16.1 ± 1.2 a | 77.9 ± 1.2 a | 629.1 ± 61.8 c | 722.8 ± 45.2 b | 3119.8 ± 245.1 a | 703.8 ± 66.7 b |
| 20 plants/m2 | 7.5 ± 0.1 bc | 17.9 ± 1.6 a | 76.1 ± 1.6 a | 641.3± 63.3 c | 714.9± 69.7 b | 3109.9 ± 310.0 a | 689.3 ± 60.3 b |
| 30 plants/m2 | 7.7 ± 0.1 c | 17.7± 1.6 a | 76.3 ± 1.6 a | 550.5± 54.3 b | 709.4 ± 47.0 ab | 3238.1 ± 216.1 a | 635.1 ± 60.2 ab |
| 40 plants/m2 | 7.2 ± 0.1 a | 17.6 ± 1.1 a | 76.4 ± 1.1 a | 520.0± 51.6 b | 683.3 ± 36.3 ab | 3054.5 ± 291.5 a | 629.5 ± 53.6 ab |
| 50 plants/m2 | 7.0 ± 0.1 a | 16.0 ± 2.0 a | 78.0 ± 2.0 a | 441.8 ± 44.1 a | 650.1 ± 23.6 a | 2999.5 ± 231.7 a | 589.4 ± 54.0 a |
| Time of Sowing | Moisture (%) | Oil Yield (%DW of Seed) | Solid Yield (%DW of Seed) | TPC (mg GAE/100 g DW) | FRAP (mg TE/100 g DW) | CUPRAC (mg TE/100 g DW) | TQ (mg/100 g DW) |
|---|---|---|---|---|---|---|---|
| 1 April | 8.3 ± 0.7 b | 18.8 ± 1.8 b | 75.2 ± 1.8 a | 705.9 ± 46.4 a | 905.9 ± 53.4 ab | 3649.6 ± 158.0 a | 670.0 ± 55.2 a |
| 1 May | 5.8 ± 0.3 a | 17.2 ± 1.6 ab | 76.8 ± 1.6 ab | 792.1 ± 47.0 b | 972.0 ± 76.1 b | 3933.1 ± 153.0 b | 708.0 ± 67.8 ab |
| 1 June | 10.5 ± 1.2 c | 14.2 ± 1.2 a | 79.8 ± 1.2 b | 760.1 ± 44.2 ab | 863.0 ± 74.5 a | 3570.4 ± 183.9 a | 834.2 ± 72.1 b |
| Country | Method | Oil Yield% | Reference |
|---|---|---|---|
| Australia | Screw pressed method at 60 °C | 14–21 | Present study |
| Saudi Arabia | Screwless cold press method | 21.73 | [82,83] |
| Thailand | Single screw cold press method | 27.38 | [84] |
| Morocco | Screwless cold press method | 27 | [85] |
| Egypt | Hydraulic press and screw press method | 20.5 and 21.1 | [86] |
| Egypt | Hydraulic press | 24.76 | [87] |
| Turkey | Screw cold press method | 20.1–30.7 | [79] |
| China | Domestic cold press oil expeller | 29.1 | [88] |
| Fatty Acids | Fatty Acid (mg/g of Seed) in the Seeds of Different Nigella Genotypes | |||||||||||
|---|---|---|---|---|---|---|---|---|---|---|---|---|
| AVTKS#1 | AVTKS#2 | AVTKS#3 | AVTKS#4 | AVTKS#5 | AVTKS#6 | AVTKS#7 | AVTKS#8 | AVTKS#9 | AVTKS#10 | AVTKS#11 | AVTKS#12 | |
| Saturated Fatty Acids (SFAs) | ||||||||||||
| C14:0 | 0.3 ± 0.1 a | 0.4 ± 0.0 b | 0.4 ± 0.0 b | 0.4 ± 0.0 ab | 0.4 ± 0.0 ab | 0.4 ± 0.0 ab | 0.4 ± 0.0 b | 0.4 ± 0.0 b | 0.4 ± 0.0 b | 0.4 ± 0.0 b | 0.4 ± 0.0 b | 0.3 ± 0.0 ab |
| C15:0 | 0.1 ± 0.0 a | 0.1 ± 0.0 a | 0.1 ± 0.0 a | 0.1 ± 0.0 a | 0.1 ± 0.0 a | 0.1 ± 0.0 a | 0.1 ± 0.0 a | 0.1 ± 0.0 a | 0.1 ± 0.0 a | 0.1 ± 0.0 a | 0.1 ± 0.0 a | 0.1 ± 0.0 a |
| C16:0 | 14.8 ± 1.2 ab | 17.3 ± 0.5 b | 16.8 ± 0.3 ab | 15.0 ± 1.1 ab | 14.4 ± 1.1 ab | 15.5 ± 0.9 ab | 17.5 ± 0.7 b | 16.8 ± 0.5 ab | 16.5 ± 0.6 ab | 16.4 ± 0.5 ab | 15.8 ± 1.3 ab | 13.7 ± 1.1 a |
| C17:0 | 0.1 ± 0.0 a | 0.2 ± 0.0 a | 0.1 ± 0.0 a | 0.1 ± 0.0 a | 0.1 ± 0.0 a | 0.1 ± 0.0 a | 0.1 ± 0.0 a | 0.1 ± 0.0 a | 0.1 ± 0.0 a | 0.1 ± 0.0 a | 0.1 ± 0.0 a | 0.1 ± 0.0 a |
| C18:0 | 2.1 ± 0.2 a | 3.1 ± 0.2 c | 3.1 ± 0.1 c | 2.6 ± 0.2 abc | 2.5 ± 0.2 ab | 2.8 ± 0.1 bc | 3.0 ± 0.1 bc | 3.0 ± 0.1 bc | 3.0 ± 0.1 bc | 2.9 ± 0.1 bc | 2.9 ± 0.2 bc | 3.1 ± 0.2 bc |
| C20:0 | 0.3 ± 0.0 ab | 0.4 ± 0.0 c | 0.4 ± 0.0 bc | 0.3 ± 0.0 abc | 0.3 ± 0.0 ab | 0.4 ± 0.0 abc | 0.4 ± 0.0 abc | 0.4 ± 0.0 bc | 0.4 ± 0.0 abc | 0.4 ± 0.0 abc | 0.3 ± 0.0 abc | 0.3 ± 0.0 a |
| Total SFAs | 17.7 ± 1.4 ab | 21.5 ± 0.7 b | 21.0 ± 0.4 ab | 18.6 ± 1.4 ab | 17.8 ± 1.4 ab | 19.3 ± 1.0 ab | 21.6 ± 0.8 b | 20.8 ± 0.5 ab | 20.5 ± 0.7 ab | 20.3 ± 0.6 ab | 19.7 ± 1.5 ab | 17.6 ± 1.4 a |
| Monounsaturated Fatty Acids (MUFAs) | ||||||||||||
| C16:1 (cis-9) | 0.3 ± 0.0 abc | 0.4 ± 0.0 d | 0.4 ± 0.0 bcd | 0.3 ± 0.0 abcd | 0.3 ± 0.0 a | 0.3 ± 0.0 abcd | 0.4 ± 0.0 cd | 0.4 ± 0.0 bcd | 0.3 ± 0.0 abcd | 0.4 ± 0.0 cd | 0.3 ± 0.0 abcd | 0.3 ± 0.0 ab |
| C17:1 (cis-10) | 0.1 ± 0.0 ab | 0.1 ± 0.0 bc | 0.1 ± 0.0 bc | 0.1 ± 0.0 abc | 0.1 ± 0.0 a | 0.1 ± 0.0 bc | 0.1 ± 0.0 bc | 0.1 ± 0.0 c | 0.1 ± 0.0 bc | 0.1 ± 0.0 bc | 0.1 ± 0.0 bc | 0.1 ± 0.0 abc |
| C18:1 | 12.1 ± 0.5 a | 15.6 ± 0.5 d | 14.8 ± 0.2 bcd | 13.6 ± 0.3 abcd | 12.8 ± 0.9 ab | 14.4 ± 0.7 bcd | 15.3 ± 0.6 cd | 14.9 ± 0.3 bcd | 15.3 ± 0.6 d | 14.3 ± 0.4 bcd | 13.2 ± 0.6 abc | 11.7 ± 0.9 a |
| C20:1 (cis-11) | 0.4 ± 0.0 a | 0.5 ± 0.0 c | 0.4 ± 0.0 abc | 0.4 ± 0.0 ab | 0.4 ± 0.0 ab | 0.4 ± 0.0 ab | 0.4 ± 0.0 bc | 0.4 ± 0.0 abc | 0.4 ± 0.0 bc | 0.4 ± 0.0 abc | 0.4 ± 0.0 ab | 0.4 ± 0.0 ab |
| Total MUFAs | 12.8 ± 0.6 a | 16.6 ± 0.6 d | 15.7 ± 0.2 bcd | 14.4 ± 0.4 abcd | 13.6 ± 0.9 ab | 15.2 ± 0.8 bcd | 16.2 ± 0.7 cd | 15.8 ± 0.4 bcd | 16.2 ± 0.6 cd | 15.3 ± 0.5 bcd | 14.0 ± 0.7 abc | 12.4 ± 0.9 a |
| Polyunsaturated Fatty Acids (PUFAs) | ||||||||||||
| C18:2 | 109.4 ± 8.0 bcd | 120.1 ± 7.6 cd | 119.1 ± 8.3 cd | 115.3 ± 5.3 bcd | 107.9 ± 7.5 bc | 115.9 ± 4.8 bcd | 130.9 ± 3.9 d | 126.6 ± 3.0 cd | 123.1 ± 5.6 cd | 124.6 ± 3.8 cd | 96.1 ± 8.6 ab | 80.1 ± 5.9 a |
| C18:3(cis 9,12,15) | 0.3 ± 0.0 a | 0.4 ± 0.0 a | 0.4 ± 0.0 a | 0.4 ± 0.0 a | 0.4 ± 0.0 a | 0.4 ± 0.0 a | 0.4 ± 0.0 a | 0.4 ± 0.0 a | 0.4 ± 0.0 a | 0.4 ± 0.0 a | 0.4 ± 0.0 a | 0.3 ± 0.0 a |
| C20:2 (cis-11,14) | 2.3 ± 0.1 a | 3.7 ± 0.2 d | 3.4 ± 0.0 cd | 3.2 ± 0.2 bcd | 3.0 ± 0.2 bc | 3.2 ± 0.2 bcd | 3.7 ± 0.1 d | 3.6 ± 0.2 d | 3.6 ± 0.1 cd | 3.4 ± 0.1 cd | 2.9 ± 0.2 ab | 2.3 ± 0.1 a |
| Total PUFAs | 112.1 ± 8.2 bcd | 124.2 ± 7.6 cd | 123.0 ± 8.3 cd | 118.9 ± 5.6 bcd | 111.3 ± 7.7 bc | 119.5 ± 5.0 bcd | 135.0 ± 4.0 d | 130.6 ± 3.2 cd | 127.0 ± 5.6 cd | 128.5 ± 4.0 cd | 99.3 ± 8.8 ab | 82.8 ± 5.8 a |
| Total MUFAs + PUFAs | 124.9 ± 8.6 bc | 140.8 ± 7.8 cd | 138.6 ± 8.3 cd | 133.3 ± 5.9 bcd | 124.9 ± 8.6 bc | 134.7 ± 5.7 bcd | 151.2 ± 4.6 d | 146.4 ± 3.5 cd | 143.2 ± 6.2 cd | 143.7 ± 4.4 cd | 113.4 ± 9.2 ab | 95.3 ± 6.6 ab |
| MUFAs/SFAs | 0.7 ± 0.1 a | 0.8 ± 0.0 a | 0.7 ± 0.0 a | 0.8 ± 0.0 a | 0.8 ± 0.0 a | 0.8 ± 0.0 a | 0.8 ± 0.0 a | 0.8 ± 0.0 a | 0.8 ± 0.0 a | 0.8 ± 0.0 a | 0.7 ± 0.0 a | 0.7 ± 0.0 a |
| PUFAs/SFAs | 6.3 ± 0.2 c | 5.8 ± 0.4 bc | 5.9 ± 0.3 c | 6.4 ± 0.2 c | 6.2 ± 0.1 c | 6.2 ± 0.1 c | 6.3 ± 0.1 c | 6.3 ± 0.1 c | 6.2 ± 0.1 c | 6.3 ± 0.0 c | 5.1 ± 0.3 ab | 4.7 ± 0.2 a |
| MUFAs +PUFAs/SFAs | 7.1 ± 0.3 b | 6.6 ± 0.4 b | 6.6 ± 0.3 b | 7.2 ± 0.2 b | 7.0 ± 0.1 b | 7.0 ± 0.1 b | 7.0 ± 0.1 b | 7.0 ± 0.1 b | 7.0 ± 0.1 b | 7.1 ± 0.0 b | 5.8 ± 0.3 a | 5.4 ± 0.3 a |
| Name of Fatty Acids | Fatty Acid (mg/g of Seed) in Nigella Different Planting Densities | ||||
|---|---|---|---|---|---|
| 10 Plants/m2 | 20 Plants/m2 | 30 Plants/m2 | 40 Plants/m2 | 50 Plants/m2 | |
| Saturated Fatty Acids (SFAs) | |||||
| C14:0 | 0.3 ± 0.0 a | 0.3 ± 0.0 b | 0.3 ± 0.0 a | 0.3 ± 0.0 a | 0.2 ± 0.0 a |
| C15:0 | 0.1 ± 0.0 a | 0.1 ± 0.0 a | 0.1 ± 0.0 a | 0.1 ± 0.0 a | 0.1 ± 0.0 a |
| C16:0 | 12.0 ± 0.4 a | 11.9 ± 0.5 a | 11.9 ± 0.3 a | 12.4 ± 0.5 a | 12.9 ± 0.8 a |
| C17:0 | 0.1 ± 0.0 a | 0.1 ± 0.0 a | 0.1 ± 0.0 a | 0.1 ± 0.0 a | 0.1 ± 0.0 a |
| C18:0 | 3.5 ± 0.2 a | 3.6 ± 0.2 a | 3.0 ± 0.2 a | 3.3 ± 0.2 ab | 3.1 ± 0.2 a |
| C20:0 | 0.2 ± 0.0 a | 0.2 ± 0.0 a | 0.3 ± 0.0 a | 0.3 ± 0.0 a | 0.2 ± 0.0 a |
| Total SFAs | 16.3 ± 0.4 a | 16.3 ± 0.5 a | 15.6 ± 0.2 a | 16.4 ± 0.4 a | 16.6 ± 0.9 a |
| Monounsaturated Fatty Acids (MUFAs) | |||||
| C16:1 (cis-9) | 0.2 ± 0.0 a | 0.2 ± 0.0 a | 0.2 ± 0.0 a | 0.2 ± 0.0 a | 0.2 ± 0.0 a |
| C17:1 (cis-10) | 1.4 ± 0.1 a | 1.3 ± 0.1 a | 1.3 ± 0.1 a | 1.3 ± 0.1 a | 1.3 ± 0.0 a |
| C18:1 | 18.0 ± 1.3 a | 19.0 ± 1.5 a | 17.8 ± 2.3 a | 17.5 ± 0.8 a | 15.9 ± 1.4 a |
| C20:1 (cis-11) | 0.2 ± 0.0 ab | 0.3 ± 0.0 b | 0.2 ± 0.0 a | 0.2 ± 0.0 a | 0.2 ± 0.0 a |
| Total MUFAs | 19.8 ± 1.2 a | 20.7 ± 1.4 a | 19.5 ± 2.3 a | 19.2 ± 0.8 a | 17.6 ± 1.3 a |
| Polyunsaturated Fatty Acids (PUFAs) | |||||
| C18:2 | 81.5 ± 4.0 ab | 86.5 ± 4.9 b | 82.8 ± 2.6 ab | 78.1 ± 1.9 a | 77.3 ± 4.0 a |
| C18:3(cis 9,12,15) | 0.2 ± 0.0 a | 0.2 ± 0.0 a | 0.2 ± 0.0 a | 0.2 ± 0.0 a | 0.2 ± 0.0 a |
| C20:2 (cis-11,14) | 2.1 ± 0.1 a | 2.2 ± 0.1 a | 2.1 ± 0.0 a | 2.1 ± 0.1 a | 2.1 ± 0.1 a |
| Total PUFAs | 83.8 ± 4.0 ab | 89.0 ± 4.7 b | 85.1 ± 2.6 ab | 80.4 ± 1.9 a | 79.5 ± 4.0 a |
| Total MUFAs + PUFAs | 103.6 ± 4.7 ab | 109.7 ± 5.2 b | 104.6 ± 3.2 ab | 99.6 ± 2.2 a | 97.1 ± 4.7 a |
| Ratio MUFAs/SFAs | 1.2 ± 0.1 ab | 1.3 ± 0.1 b | 1.3 ± 0.1 ab | 1.2 ± 0.0 ab | 1.1 ± 0.1 a |
| Ratio PUFAs/SFAs | 5.2 ± 0.3 ab | 5.5 ± 0.2 b | 5.5 ± 0.2 b | 4.9 ± 0.2 a | 4.8 ± 0.3 a |
| Ratio MUFAs +PUFAs/SFAs | 6.4 ± 0.4 ab | 6.7 ± 0.2 b | 6.7 ± 0.2 b | 6.1 ± 0.2 a | 5.9 ± 0.3 a |
| Name of Fatty Acids | Fatty Acid (mg/g of Seed) in Different Time of Sowing | ||
|---|---|---|---|
| 1 April | 1 May | 1 June | |
| Saturated Fatty Acids (SFAs) | |||
| C14:0 | 0.2 ± 0.0 a | 0.4 ± 0.0 b | 0.2 ± 0.0 a |
| C15:0 | 0.1 ± 0.0 a | 0.1 ± 0.0 b | 0.1 ± 0.0 a |
| C16:0 | 12.3 ± 0.5 a | 16.8 ± 0.3 b | 11.4 ± 0.4 a |
| C17:0 | 0.1 ± 0.0 a | 0.1 ± 0.0 b | 0.1 ± 0.0 a |
| C18:0 | 3.3 ± 0.3 b | 3.1 ± 0.1 b | 2.5 ± 0.1 a |
| C20:0 | 0.3 ± 0.0 a | 0.4 ± 0.0 b | 0.2 ± 0.0 a |
| Total SFAs | 16.3 ± 0.8 b | 21.0 ± 0.4 c | 14.5 ± 0.4 a |
| Monounsaturated Fatty Acids (MUFAs) | |||
| C16:1 (cis-9) | 0.2 ± 0.0 a | 0.4 ± 0.0 b | 0.2 ± 0.0 a |
| C17:1 (cis-10) | 1.4 ± 0.1 c | 0.1 ± 0.0 a | 1.1 ± 0.1 b |
| C18:1 | 18.6 ± 1.5 b | 14.8 ± 0.2 a | 13.0 ± 0.5 a |
| C20:1 (cis-11) | 0.2 ± 0.0 a | 0.4 ± 0.0 b | 0.2 ± 0.0 a |
| Total MUFAs | 20.4 ± 1.5 b | 15.7 ± 0.2 a | 14.4 ± 0.5 a |
| Polyunsaturated Fatty Acids (PUFAs) | |||
| C18:2 | 107.9 ± 4.2 a | 119.1 ± 8.3 a | 112.6 ± 7.1 a |
| C18:3(cis 9,12,15) | 0.2 ± 0.0 a | 0.4 ± 0.0 b | 0.2 ± 0.0 a |
| C20:2 (cis-11,14) | 1.4 ± 0.1 b | 3.4 ± 0.0 c | 1.1 ± 0.0 a |
| Total PUFAs | 109.5 ± 4.3 a | 123.0 ± 8.3 a | 113.9 ± 7.1 a |
| Total MUFAs + PUFAs | 129.9 ± 5.3 a | 138.6 ± 8.3 a | 128.4 ± 7.6 a |
| Ratio MUFAs/SFAs | 1.3 ± 0.1 b | 0.7 ± 0.0 a | 1.0 ± 0.0 a |
| Ratio PUFAs/SFAs | 6.7 ± 0.1 ab | 5.9 ± 0.3 a | 7.8 ± 0.5 b |
| Ratio MUFAs +PUFAs/SFAs | 8.0 ± 0.2 b | 6.6 ± 0.3 a | 8.8 ± 0.6 b |
| Oil | TPC | FRAP | CUPRAC | TQ | C14:0 | C15:0 | C16:0 | C17:0 | C18:0 | C20:0 | C16:1 | C17:1 | C18:1 | C20:1 | C18:2 | C18:3 | C20:2 | Σ SFA | Σ MUFA | |
|---|---|---|---|---|---|---|---|---|---|---|---|---|---|---|---|---|---|---|---|---|
| TPC | 0.049 | |||||||||||||||||||
| FRAP | 0.187 | 0.819 *** | ||||||||||||||||||
| CUPRAC | −0.060 | 0.784 *** | 0.794 *** | |||||||||||||||||
| TQ | −0.013 | 0.543 *** | 0.561 *** | 0.435 *** | ||||||||||||||||
| C14:0 | 0.074 | 0.167 | 0.231 | 0.202 | −0.374 *** | |||||||||||||||
| C15:0 | 0.056 | 0.043 | 0.159 | 0.099 | −0.424 *** | 0.925 *** | ||||||||||||||
| C16:0 | 0.020 | 0.124 | 0.101 | 0.131 | −0.475 *** | 0.906 *** | 0.894 *** | |||||||||||||
| C17:0 | 0.052 | 0.127 | 0.061 | 0.109 | −0.546 *** | 0.883 *** | 0.886 *** | 0.899 *** | ||||||||||||
| C18:0 | 0.070 | −0.055 | 0.223 | 0.174 | 0.359 *** | −0.059 | −0.167 | −0.175 | −0.323 *** | |||||||||||
| C20:0 | 0.082 | 0.149 | 0.108 | 0.126 | −0.531 *** | 0.921 *** | 0.918 *** | 0.932 *** | 0.958 *** | −0.291 ** | ||||||||||
| C16:1 | 0.085 | 0.161 | 0.159 | 0.186 | −0.507 *** | 0.931 *** | 0.908 *** | 0.944 *** | 0.932 *** | −0.218 | 0.974 *** | |||||||||
| C17:1 | −0.081 | −0.141 | −0.069 | −0.088 | 0.570 *** | −0.837 *** | −0.840 *** | −0.836 *** | −0.933 *** | 0.486 *** | −0.942 *** | −0.914 *** | ||||||||
| C18:1 | −0.064 | 0.092 | 0.154 | 0.113 | 0.593 *** | −0.321 *** | −0.403 *** | −0.373 *** | −0.538 *** | 0.742 *** | −0.511 *** | −0.464 *** | 0.682 *** | |||||||
| C20:1 | 0.063 | 0.200 | 0.172 | 0.153 | −0.472 *** | 0.940 *** | 0.870 *** | 0.928 *** | 0.920 *** | −0.184 | 0.957 *** | 0.970 *** | −0.902 *** | −0.428 *** | ||||||
| C18:2 | −0.109 | 0.018 | 0.042 | −0.003 | −0.401 *** | 0.731 *** | 0.750 *** | 0.786 *** | 0.770 *** | −0.306 ** | 0.768 *** | 0.763 *** | −0.706 *** | −0.335 *** | 0.742 *** | |||||
| C18:3 | 0.105 | 0.161 | 0.139 | 0.154 | −0.503 *** | 0.939 *** | 0.895 *** | 0.923 *** | 0.946 *** | −0.265 ** | 0.970 *** | 0.968 *** | −0.937 *** | −0.496 *** | 0.963 *** | 0.746 *** | ||||
| C20:2 | −0.003 | 0.276 ** | 0.249 ** | 0.217 | −0.333 *** | 0.922 *** | 0.857 *** | 0.902 *** | 0.845 *** | −0.097 | 0.904 *** | 0.915 *** | −0.815 *** | −0.290 ** | 0.927 *** | 0.678 *** | 0.911 *** | |||
| Σ SFA | 0.037 | 0.118 | 0.142 | 0.166 | −0.424 *** | 0.919 *** | 0.886 *** | 0.986 *** | 0.865 *** | −0.012 | 0.905 *** | 0.928 *** | −0.776 *** | −0.260 ** | 0.918 *** | 0.750 *** | 0.900 *** | 0.905 *** | ||
| Σ MUFA | −0.069 | 0.062 | 0.130 | 0.093 | 0.611 *** | −0.399 *** | −0.475 *** | −0.445 *** | −0.611 *** | 0.741 *** | −0.587 *** | −0.539 *** | 0.753 *** | 0.994 *** | −0.503 *** | −0.395 *** | −0.572 *** | −0.369 *** | −0.333 *** | |
| Σ PUFA | −0.105 | 0.028 | 0.051 | 0.007 | −0.405 *** | 0.748 *** | 0.764 *** | 0.801 *** | 0.783 *** | −0.302 ** | 0.784 *** | 0.779 *** | −0.720 *** | −0.338 *** | 0.759 *** | 1.000 *** | 0.763 *** | 0.700 *** | 0.766 *** | −0.399 *** |
| TQ (mg/L) | TPC (GAE mg/L) | FRAP (TE mg/L) | CUPRAC (TE mg/L) |
|---|---|---|---|
| 10 | 9.9 ± 0.3 a | 4.0 ± 0.3 a | 2.4 ± 0.4 a |
| 20 | 10.7 ± 0.1 ab | 4.7 ± 0.3 ab | 7.0 ± 0.6 ab |
| 50 | 12.1 ± 0.3 ab | 5.8 ± 0.5 b | 10.3 ± 1.0 b |
| 100 | 13.4 ± 0.8 bc | 7.3 ± 0.6 c | 20.3 ± 1.9 c |
| 200 | 15.8 ± 1.5 cd | 9.9 ± 0.5 d | 42.0 ± 3.1 d |
| 250 | 17.9 ± 1.7 d | 11.3 ± 0.7 d | 55.8 ± 5.4 e |
Disclaimer/Publisher’s Note: The statements, opinions and data contained in all publications are solely those of the individual author(s) and contributor(s) and not of MDPI and/or the editor(s). MDPI and/or the editor(s) disclaim responsibility for any injury to people or property resulting from any ideas, methods, instructions or products referred to in the content. |
© 2024 by the authors. Licensee MDPI, Basel, Switzerland. This article is an open access article distributed under the terms and conditions of the Creative Commons Attribution (CC BY) license (https://creativecommons.org/licenses/by/4.0/).
Share and Cite
Thani, P.R.; Johnson, J.B.; Bhattarai, S.; Trotter, T.; Walsh, K.; Broszczak, D.; Naiker, M. An In-Depth Examination into How Genotype, Planting Density, and Time of Sowing Affect Key Phytochemical Constituents in Nigella sativa Seed. Seeds 2024, 3, 357-380. https://doi.org/10.3390/seeds3030026
Thani PR, Johnson JB, Bhattarai S, Trotter T, Walsh K, Broszczak D, Naiker M. An In-Depth Examination into How Genotype, Planting Density, and Time of Sowing Affect Key Phytochemical Constituents in Nigella sativa Seed. Seeds. 2024; 3(3):357-380. https://doi.org/10.3390/seeds3030026
Chicago/Turabian StyleThani, Parbat Raj, Joel B. Johnson, Surya Bhattarai, Tieneke Trotter, Kerry Walsh, Daniel Broszczak, and Mani Naiker. 2024. "An In-Depth Examination into How Genotype, Planting Density, and Time of Sowing Affect Key Phytochemical Constituents in Nigella sativa Seed" Seeds 3, no. 3: 357-380. https://doi.org/10.3390/seeds3030026
APA StyleThani, P. R., Johnson, J. B., Bhattarai, S., Trotter, T., Walsh, K., Broszczak, D., & Naiker, M. (2024). An In-Depth Examination into How Genotype, Planting Density, and Time of Sowing Affect Key Phytochemical Constituents in Nigella sativa Seed. Seeds, 3(3), 357-380. https://doi.org/10.3390/seeds3030026